Back to Journals » Nature and Science of Sleep » Volume 14
The 3% Oxygen Desaturation Index is an Independent Risk Factor for Hypertension Among Children with Obstructive Sleep Apnea
Authors Chuang HH, Wang CY, Chuang LP ![]() , Huang YS
, Huang YS ![]() , Li HY
, Li HY ![]() , Fang TJ, Lin RH, Lee LA
, Fang TJ, Lin RH, Lee LA ![]()
Received 21 February 2022
Accepted for publication 7 June 2022
Published 16 June 2022 Volume 2022:14 Pages 1149—1164
DOI https://doi.org/10.2147/NSS.S362557
Checked for plagiarism Yes
Review by Single anonymous peer review
Peer reviewer comments 3
Editor who approved publication: Prof. Dr. Ahmed BaHammam
Hai-Hua Chuang,1– 3 Chao-Yung Wang,4 Li-Pang Chuang,5 Yu-Shu Huang,6 Hsueh-Yu Li,7 Tuan-Jen Fang,7 Rong-Ho Lin,2 Li-Ang Lee3,7
1Department of Family Medicine, Chang Gung Memorial Hospital, Linkou Main Branch, Chang Gung University, Taoyuan, Taiwan; 2Department of Industrial Engineering and Management, National Taipei University of Technology, Taipei, Taiwan; 3School of Medicine, National Tsing Hua University, Hsinchu, Taiwan; 4Department of Cardiology, Chang Gung Memorial Hospital, Linkou Main Branch, Chang Gung University, Taoyuan, Taiwan; 5Department of Pulmonary and Critical Care Medicine, Chang Gung Memorial Hospital, Linkou Main Branch, Chang Gung University, Taoyuan, Taiwan; 6Department of Child Psychiatry, Chang Gung Memorial Hospital, Linkou Main Branch, Chang Gung University, Taoyuan, Taiwan; 7Department of Otorhinolaryngology-Head and Neck Surgery, Chang Gung Memorial Hospital, Linkou Main Branch, Chang Gung University, Taoyuan, Taiwan
Correspondence: Li-Ang Lee, Department of Otorhinolaryngology-Head and Neck Surgery, Chang Gung Memorial Hospital, Linkou Main Branch, No. 5, Fuhsing Street, Guishan District, Taoyuan, 33305, Taiwan, Tel +886 33281200 ext. 3972, Fax +886 33979361, Email [email protected]
Background: Obstructive sleep apnea (OSA) and obesity are both directional risk factors of hypertension. Chronic intermittent hypoxemia (IH) is a commonly observed pathophysiological mechanism involved in multiple comorbidities of OSA. However, their interactions are not well understood in children. This study aimed to investigate the associations of IH indexes (oxygen desaturation index 3% [ODI3], mean peripheral oxygen saturation [SpO2], least SpO2, and time with SpO2 < 85%), apnea-hypopnea index, and weight status with hypertension in a sample of pediatric OSA patients.
Methods: The medical records of 365 pediatric OSA patients were retrospectively reviewed in this cross-sectional study. Demographics, anthropometrics, standard in-laboratory polysomnography, and nocturnal blood pressure were collected. Multivariate logistic regression with forward selection was used to identify independent predictors of hypertension.
Results: Multivariate logistic regression analysis showed that ODI3 (odds ratio [OR] = 1.02, 95% confidence interval [CI] = 1.01– 1.03) and body mass index z-score (OR = 1.34, 95% CI = 1.12– 1.60) were independent continuous predictors of pediatric hypertension, whilst severe OSA (OR = 2.62, 95% CI = 1.60– 4.29) and overweight/obesity (OR = 2.63, 95% CI = 1.59– 4.34) were independent categorical predictors. Traditional risk factors including male sex (OR = 2.33, 95% CI = 1.02– 5.33), late childhood/adolescence (OR = 1.98, 95% CI = 1.01– 3.88), and overweight/obesity (OR = 2.97, 95% CI = 1.56– 5.67) combined with sleep hypoxemia (least SpO2 ≤ 95%) (OR = 2.24, 95% CI = 1.16– 4.04) predicted hypertension (R2 = 0.21) in the severe IH subgroup (n = 205), while the no/mild IH subgroup (n = 160) had an entirely different predictor, severe OSA (OR = 3.81, 95% CI = 1.49– 9.74) (R2 = 0.07).
Conclusion: The close relationships among IH, overweight/obesity, and hypertension highlight the importance of reducing IH and body weight in children with OSA.
Keywords: children, oxygen desaturation index, intermittent hypoxemia, obesity, obstructive sleep apnea, predictive model
Introduction
Obstructive sleep apnea (OSA) is a chronic sleep condition characterized by repetitive partial collapses and/or complete obstructions of the upper airway due to respiratory control instability and upper airway dysfunction.1 The prevalence of OSA ranges between 1% and 6% among children.2 The diagnosis of OSA requires comprehensive history taking and physical examination prior to a standard polysomnography (PSG), and congenital structural abnormalities should be carefully inspected and exclusion. OSA can induce intermittent hypoxemia (IH), oxidative stress, elevated sympathetic nerve activity, vascular endothelial dysfunction, inflammation, and metabolic dysregulation, leading to a wide range of adverse outcomes on multiple organ systems.3
IH, a pathophysiological manifestation commonly observed in OSA, is considered involved in the elevation of blood pressure (BP) in patients with disordered sleep.4 IH dysregulates hypoxia-inducible factors, increases reactive oxygen species, activates chemoreflex, suppresses baroreflex, stimulates the sympathetic nervous system, and leads to hypertension.5 In adults with OSA, nocturnal IH (in terms of oxygen desaturation index 4% [ODI4]6 and oxygen desaturation rate7) played a more important role in hypertension than AHI. Adenotonsillectomy has been shown to significantly reduce IH and improve office8 as well as nocturnal BP9 among pediatric OSA patients with hypertension. Moreover, chronic IH has been associated with growth delay, behavioral impairment, and academic underperformance in children with SDB.10
Obesity is another well-known risk factor for pediatric hypertension.11 In healthy school-aged children, a body mass index (BMI) ≥ 18.75 kg/m2 has been independently associated with hypertension.12 Among children with SDB, obesity (defined as BMI z-score ≥ 1.64513) has been shown to be an independent predictor of hypertension, along with older age and severe SDB (apnea-hypopnea index [AHI] ≥ 10 events/h14,15). Previous studies have suggested that pediatric hypertension increases along with childhood obesity,16 and that hypertension further contributes to the clustering of obesity-related cardio-metabolic risk factors.17 Moreover, obesity increases fat accumulation in the parapharyngeal space18 and reduces lung volume,19 which can also cause or aggravate OSA. Notably, pediatric OSA, obesity, and hypertension are likely to persist into adulthood and then further increase the risks of cardiovascular diseases and mortality.20 As the detrimental physiological effects of these chronic conditions develop and progress over time, early recognition with timely management is essential.
Hypertension is one of the earliest recognized comorbidities of OSA, and it plays a cardinal role in the development of other unfavorable health outcomes including premature mortality.4,21,22 A Taiwan National Health Insurance Research Database study reported that the prevalence of hypertension in patients with OSA was as high as 37%, and that cardiovascular events were the most common cause of death.23 In addition, the Wisconsin Sleep Cohort Study reported that patients with severe sleep-disordered breathing (SDB) had a 3.8-fold higher risk of all-cause mortality after 18 years of follow-up, and an even higher 5.2-fold higher risk of cardiovascular mortality.24 Similar to that in adults, hypertension is a common comorbidity among pediatric OSA patients. A hospital-based study in Taiwan reported a prevalence of hypertension of 27% among children with SDB.14
Both obesity and OSA are well-known to have bidirectional associations with hypertension in adults.25,26 However, little is known about the relationships among IH, weight status, and hypertension in children with OSA. We hypothesized that IH may be an independent risk factor for hypertension in this disease population. Therefore, this study aimed to investigate the associations of oxygen desaturation index 3% (ODI3), mean peripheral oxygen saturation (SpO2), least SpO2, time with SpO2 < 85%, AHI, and weight status with hypertension in a cohort of pediatric OSA patients.
Materials and Methods
Data Availability Statement
The data underlying this article cannot be shared publicly due to the privacy of the individuals who participated in the study. The data can be shared at reasonable request to the corresponding author.
Study Design and Subjects
The investigators retrospectively reviewed the medical charts of pediatric patients with OSA at the ear, nose, and throat outpatient clinic of a tertiary medical center (Chang Gung Memorial Hospital, Linkou Main Branch) in northern Taiwan between 01 January 2010 and 31 December 2019. This study was approved by the Institutional Review Board of Chang Gung Medical Foundation, Taiwan (No. 202000873B0; date of approval: 22 May 2020). The requirement for written informed consent was waived. This study followed the guidelines of the World Medical Association Declaration of Helsinki27 and the Strengthening the Reporting of Observational Studies in Epidemiology.28
The inclusion criteria were: (a) age 2–18 years, and (b) PSG-diagnosed OSA (an obstructive AHI ≥ 2.0 events/h or an obstructive apnea index ≥ 1.0 events/h29). The exclusion criteria were: (a) lack of complete PSG data, (b) absence of BP data, (c) chronic inflammatory disorders such as asthma, allergies, eczema, or other atopic/autoimmune diseases,30 and (d) craniofacial or neuromuscular disorders.31
Demographics
Age at the diagnosis of OSA and sex were recorded. The overall cohort was further divided into three development stage subgroups: toddler/preschool (≥ 2 years old and < 5 years old), early childhood (≥ 5 years old and < 8 years old), and late childhood/adolescence (≥ 8 years old and < 18 years old).14
Anthropometrics
BMI z-score was calculated based on the United States Centers for Disease Control and Prevention 2000 growth charts.32 Weight status was categorized into three subgroups based on BMI z-score: underweight (< −1.645), normal weight (≥ −1.645 and < 1.036), and overweight/obesity (≥ 1.036).33
Neck circumference (NC) has been associated with systolic BP,34 and it was measured at the thyroid cartilage level.35 Neck size was further categorized into three subgroups according to NC: small (< 26.0 cm), middle (≥ 26.0 cm and < 31.0 cm), and large (≥ 31.0 cm).
Tonsil size was graded according to occupation of the oropharynx (grade 1: 0%–25%; grade 2: 26%–50%; grade 3: 51%–75%; and grade 4: 76–100%),36 and adenoid size was graded according to the degree of obstruction of the posterior choana (grade 1: 0%–25%; grade 2: 26%–50%; grade 3: 51%–75%; and grade 4: 76–100%)37 by two senior investigators (Li, H.-Y. and Lee, L.-A.) following a previously reported procedure.38 Tonsil size and adenoid size were further categorized into three subgroups: grades 1 and 2, grade 3, and grade 4.
Polysomnography
All participants underwent whole night, board-certified sleep technician-attended, in-laboratory PSG (Nicolet Biomedical Inc., Madison, WI, USA) accompanied by a family member.39 The PSGs were performed by the same registered sleep technologists and manually verified by the study investigators (Chuang, L.-P. and Huang, Y.-S.). Using the 2012 American Academy of Sleep Medicine Scoring Manual,40 apnea was defined as ≥ 90% reduction of airflow for ≥ 2 breaths, and hypopnea was defined as ≥ 30% reduction of airflow with either oxygen desaturation ≥ 3% or electroencephalographic arousal for ≥ 2 breaths. Obstructive AHI and apnea index were then calculated accordingly. The following disease parameters for OSA were also obtained: AHI, ODI3, mean SpO2, least SpO2, and time with SpO2 < 85%.
The subjects were further divided into three OSA severity subgroups according to AHI: mild OSA (< 5.0 events/h), moderate OSA (≥ 5.0 events/h and < 10.0 events/h), and severe OSA (≥ 10.0 events/h).40
ODI3 was defined as the number of times SpO2 dropped to ≥ 3% per hour of recording. The subjects were further categorized into three desaturation subgroups based on ODI3: mild desaturation (< 5.0 events/h), moderate desaturation (≥ 5.0 events/h and < 10.0 events/h), and severe desaturation (≥ 10.0 events/h).41
The subjects were further categorized into three subgroups of sleep hypoxemia according to the mean SpO2: no sleep hypoxemia (> 95.0%), mild sleep hypoxemia (> 90.0% and ≤ 95.0%), and severe sleep hypoxemia (≤ 90.0%).42
The overall cohort was also divided into three subgroups of IH according to least SpO2: no IH (> 94.0%), mild IH (> 88% and ≤ 94%), and severe IH (≤ 88%).43,44
The subjects were further categorized into three hypoxemia time subgroups according to time with SpO2 < 85%: zero hypoxemia time (time with SpO2 < 85% = 0), short hypoxemia time (> 0 min and ≤ 3.0 min), and long hypoxemia time (> 3.0 min).43
Blood Pressure
Nocturnal BP was measured using an optimal cuff for children.45 Routine BP measurements were performed three times using a standard automatic sphygmomanometer on the night of PSG between 10:00 and 11:00 PM.46 Sleep technicians used the auscultatory method to confirm pediatric hypertension in those with a high systolic or diastolic BP. Systolic and diastolic BP z-scores were calculated after adjusting for age, sex, and height z-score. Pediatric hypertension was defined as an SBP z-score ≥ 1.645 or DBP z-score ≥ 1.645.47 The patients were then categorized into two BP subgroups: normotensive subgroup (neither SBP z-score ≥ 1.645 nor DBP z-score ≥ 1.645), and hypertensive subgroup (either SBP z-score ≥ 1.645 or DBP z-score ≥ 1.645).
Statistical Analysis
The normality of continuous variables was analyzed using the Kolmogorov–Smirnov test and none of them was normally distributed. Data were reported as medians (interquartile ranges) for non-normally distributed continuous and ordinal variables, and absolute numbers (percentages) for nominal variables. Skewed continuous and ordinal data were compared using the Mann–Whitney U-test. Categorical data were compared using the X2 test or Mantel-Haenszel test for trend, as appropriate. Associations between the selected variables were analyzed using the Spearman correlation test and point biserial correlation test, as appropriate.
For the best trade-off between sensitivity and specificity of the selected variables to detect pediatric hypertension, the Youden’s J static was used to determine the optimal cut-off value of receiver operating characteristic curves.48 Furthermore, univariate and multivariate logistic regression models were used to assess the categorical and dichotomized variables. To improve the regression performance, variables with a P-value ≤ 0.10 were included in the full model, and forward selected to obtain the parsimonious model. Statistical significance was accepted at a two-sided P-value < 0.05. The collected data were statistically analyzed using SPSS software version 25.0 (International Business Machines Corp., Armonk, NY, USA).
Results
Case Inclusion Flow Chart
Figure 1 demonstrates the case inclusion flow chart. A total of 458 surgery-naïve children with OSA were identified, of whom 35 were not included due to being < 2 years of age (n = 5) and not undergoing standard PSG (n = 30). Among the remaining 423 eligible patients, 58 were excluded due to a lack of complete PSG data (n = 29), lack of BP data (n = 18), chronic inflammation disorders (n = 9), and craniofacial/neuromuscular disorders (n = 2). Consequently, 365 children with OSA (265 [72.6%] boys and 100 [27.4%] girls) were analyzed (Table 1). Ninety-nine (27.1%) of the children had hypertension, and 266 (72.9%) had normal BP.
 |
Table 1 Demographic, Anthropometric, and Polysomnographic Measures of the Overall Cohort as Well as Normotensive and Hypertensive Subgroups |
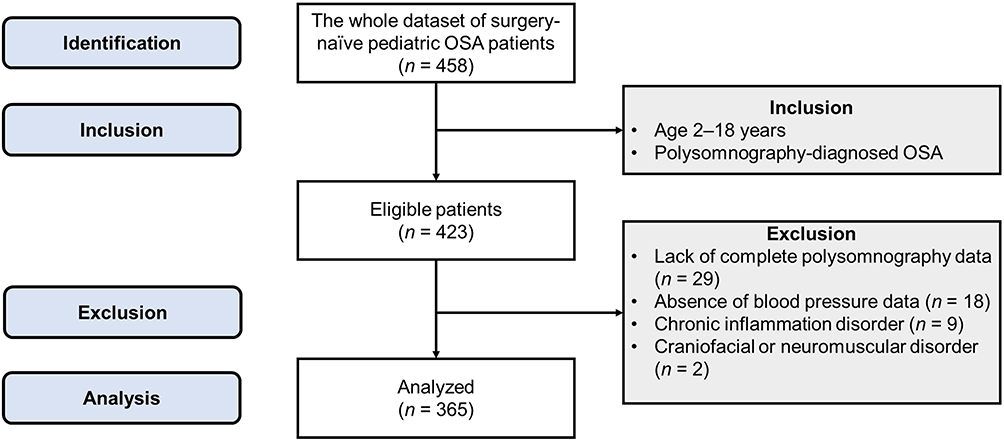 |
Figure 1 Inclusion flow chart of the study participants. Abbreviation: OSA, obstructive sleep apnea. |
The median age was 7 (interquartile range = 5–9) years. There were 133 (36.4%) toddlers/preschoolers, 129 (35.1%) early childhood patients, and 104 (28.5%) late childhood patients/adolescents.
The median BMI z-score was 0.800 (interquartile range = −0.285–1.810). Of the enrolled children, 22 (6.0%) were underweight, 237 (64.9%) had normal weight, and 106 (29.0%) had overweight/obesity. Furthermore, the median NC was 28 (26–31) cm, including 83 (22.7%) children with a small neck size, 188 (51.5%) with a middle neck size, and 94 (25.8%) with a large neck size.
The median tonsil size was grade 3 (interquartile range: 3–4), including 60 (16.4%) patients who had grade 1 or grade 2 tonsils, 173 (47.4%) who had grade 3 tonsils, and 132 (36.2%) who had grade 4 tonsils. The median adenoid size was grade 3 (2–4). The three tonsil size subgroups included 102 (28.0%) with grade 1 and 2 adenoids, 126 (34.5%) with grade 3 adenoids, and 137 (37.5%) with grade 4 adenoids.
The median AHI was 9.1 (4.1–20.8) events/h, including 108 (29.6%) children with mild OSA, 87 (23.8%) with moderate OSA, and 170 (46.6%) with severe OSA. The median ODI3 was 6.4 (2.4–17.9) events/h, including 149 (40.8%) children with mild desaturation, 69 (18.9%) with moderate desaturation, and 147 (40.3%) with severe desaturation. In addition, the median ODI3 was 6.4 (2.4–17.9) events/h, including 149 children (40.8%) with mild desaturation, 69 (18.9%) with moderate desaturation, and 147 (40.3%) with severe desaturation. The median mean SpO2 was 96% (95–97%), including 258 (70.7%) children with no sleep hypoxemia, 87 (23.8%) with mild sleep hypoxemia, and 20 (5.5%) with severe sleep hypoxemia. The median least SpO2 was 87% (82–91%), including 26 (7.1%) children with no IH, 108 (29.6%) with mild IH, and 231 (63.3%) with severe IH. Finally, the median time with SpO2 < 85% was 0 (0–0.45) min, including 218 (59.7%) children with zero hypoxemia time, 102 (28.0%) with a short hypoxemia time, and 45 (12.3%) with a long hypoxemia time.
Demographic, Anthropometric, and Polysomnographic Characteristics of the Two Subgroups Stratified by Pediatric Hypertension
Notably, significantly more of the children with hypertension were male (P = 0.02), had a higher BMI z-score (P < 0.001; Figure 2A), and had a higher NC (P < 0.001) compared to the children without hypertension (Table 1). Furthermore, the hypertensive subgroup had a higher median AHI (P ≤ 0.001), ODI3 (P ≤ 0.001; Figure 2B), and time with SpO2 ≤ 85% (P = 0.004), and a lower median mean SpO2 (P = 0.002) and least SpO2 (P = 0.01) than the normotensive subgroup. Trends of the increasing prevalence of pediatric hypertension were observed in the overweight/obesity subgroup (P ≤ 0.001; Figure 3A), in the large neck size subgroup (P = 0.002), in the severe OSA subgroup (P ≤ 0.001; Figure 3B), severe desaturation subgroup (P = 0.001; Figure 3C), mild/severe sleep hypoxemia subgroup (P = 0.004; Figure 3D), severe IH subgroup (P = 0.04; Figure 3E), and in the long hypoxemia time subgroup (P ≤ 0.001; Figure 3F).
 |
Figure 2 Violin charts showing the distributions of the (A) body mass index z-score and (B) oxygen desaturation index ≥ 3% between the normotensive and hypertensive subgroups. Non-normally distributed continuous data were compared using the Mann–Whitney U-test. Abbreviations: BMI, body mass index; ODI3, oxygen desaturation index 3%. |
 |
Figure 3 Bart charts showing the relationships between hypertension and various subgroups. (A) Weight status subgroups; (B) Obstructive sleep apnea severity subgroups; (C) Desaturation degree subgroups; (D) Sleep hypoxemia subgroups; (E) Intermittent hypoxemia subgroups; (F) Hypoxemia time subgroups. Categorical data were compared using the Mantel-Haenszel test for trend. Abbreviation: OSA, obstructive sleep apnea. |
Associations Between Pediatric Hypertension and Selected Variables in the Overall Cohort
In the overall cohort, hypertension was significantly associated with male sex (r = 0.13, P = 0.02), BMI z-score (r = 0.21, P < 0.001), weight status (r = 0.22, P < 0.001), NC (r = 0.19, P < 0.001), neck size (r = 0.16, P = 0.002), AHI (r = 0.21, P < 0.001), OSA severity (r = 0.20, P < 0.001), ODI3 (r = 0.19, P < 0.001), desaturation severity (r = 0.18, P = 0.001), mean SpO2 (r = −0.16, P = 0.002), sleep hypoxemia (r = 0.19, P = 0.001), least SpO2 (r = −0.14, P = 0.01), IH (r = 0.12, P = 0.03), time with SpO2 < 85% (r = 0.15, P = 0.004), and hypoxemia time (r = 0.16, P = 0.002). In contrast, pediatric hypertension was not statistically significantly associated with age (r = 0.06, P = 0.28), development stage (r = 0.09, P = 0.10), tonsil size (r = 0.05, P = 0.34), tonsil size subgroup (r = 0.05, P = 0.34), adenoid size (r = 0.05, P = 0.31), or adenoid size subgroup (r = 0.05, P = 0.34).
Male sex was associated with age (r = 0.13, P = 0.01), BMI z-score (r = 0.13, P = 0.01), NC (r = 0.16, P = 0.003), and adenoid size (r = −0.11, P = 0.04). Age was also associated with NC (r = 0.63, P < 0.001), BMI z-score (r = 0.27, P < 0.001), adenoid size (r = −0.34, P < 0.001), ODI3 (r = 0.11, P = 0.046), and mean SpO2 (r = −0.13, P = 0.02). In addition, BMI z-score was further correlated with NC (r = 0.72, P < 0.001), AHI (r = 0.22, P < 0.001), ODI3 (r = 0.29, P < 0.001), mean SpO2 (r = −0.27, P < 0.001), least SpO2 (r = −0.26, P < 0.001), and time with SpO2 < 85% (r = 0.28, P < 0.001).
Important Variables Predicting Hypertension Using Univariate Logistic Regression Analysis
Table 2 shows the regression performance of the important variables predicting pediatric hypertension in the overall cohort according to the Youden’s J static.49 Using univariate logistic regression analysis, male sex (odds ratio [OR]= 2.01, 95% confidence interval [CI] = 1.13–3.56), late childhood/adolescence (OR = 1.89, 95% CI = 1.16–3.09), overweight/obesity (OR = 2.98, 95% CI = 1.83–4.86), large neck size (OR = 2.34, 95% CI = 1.42–3.86), severe OSA (OR = 2.93, 95% CI = 1.81–4.75), severe desaturation (OR = 2.36, 95% CI = 1.48–3.78), mild/severe sleep hypoxemia (OR = 2.28, 95% CI = 1.40–3.71), severe intermittent hypoxemia (OR = 1.83, 95% CI = 1.15–3.20), and long hypoxemia time (OR = 3.36, 95% CI = 1.13–2.96) best predicted pediatric hypertension in the children.
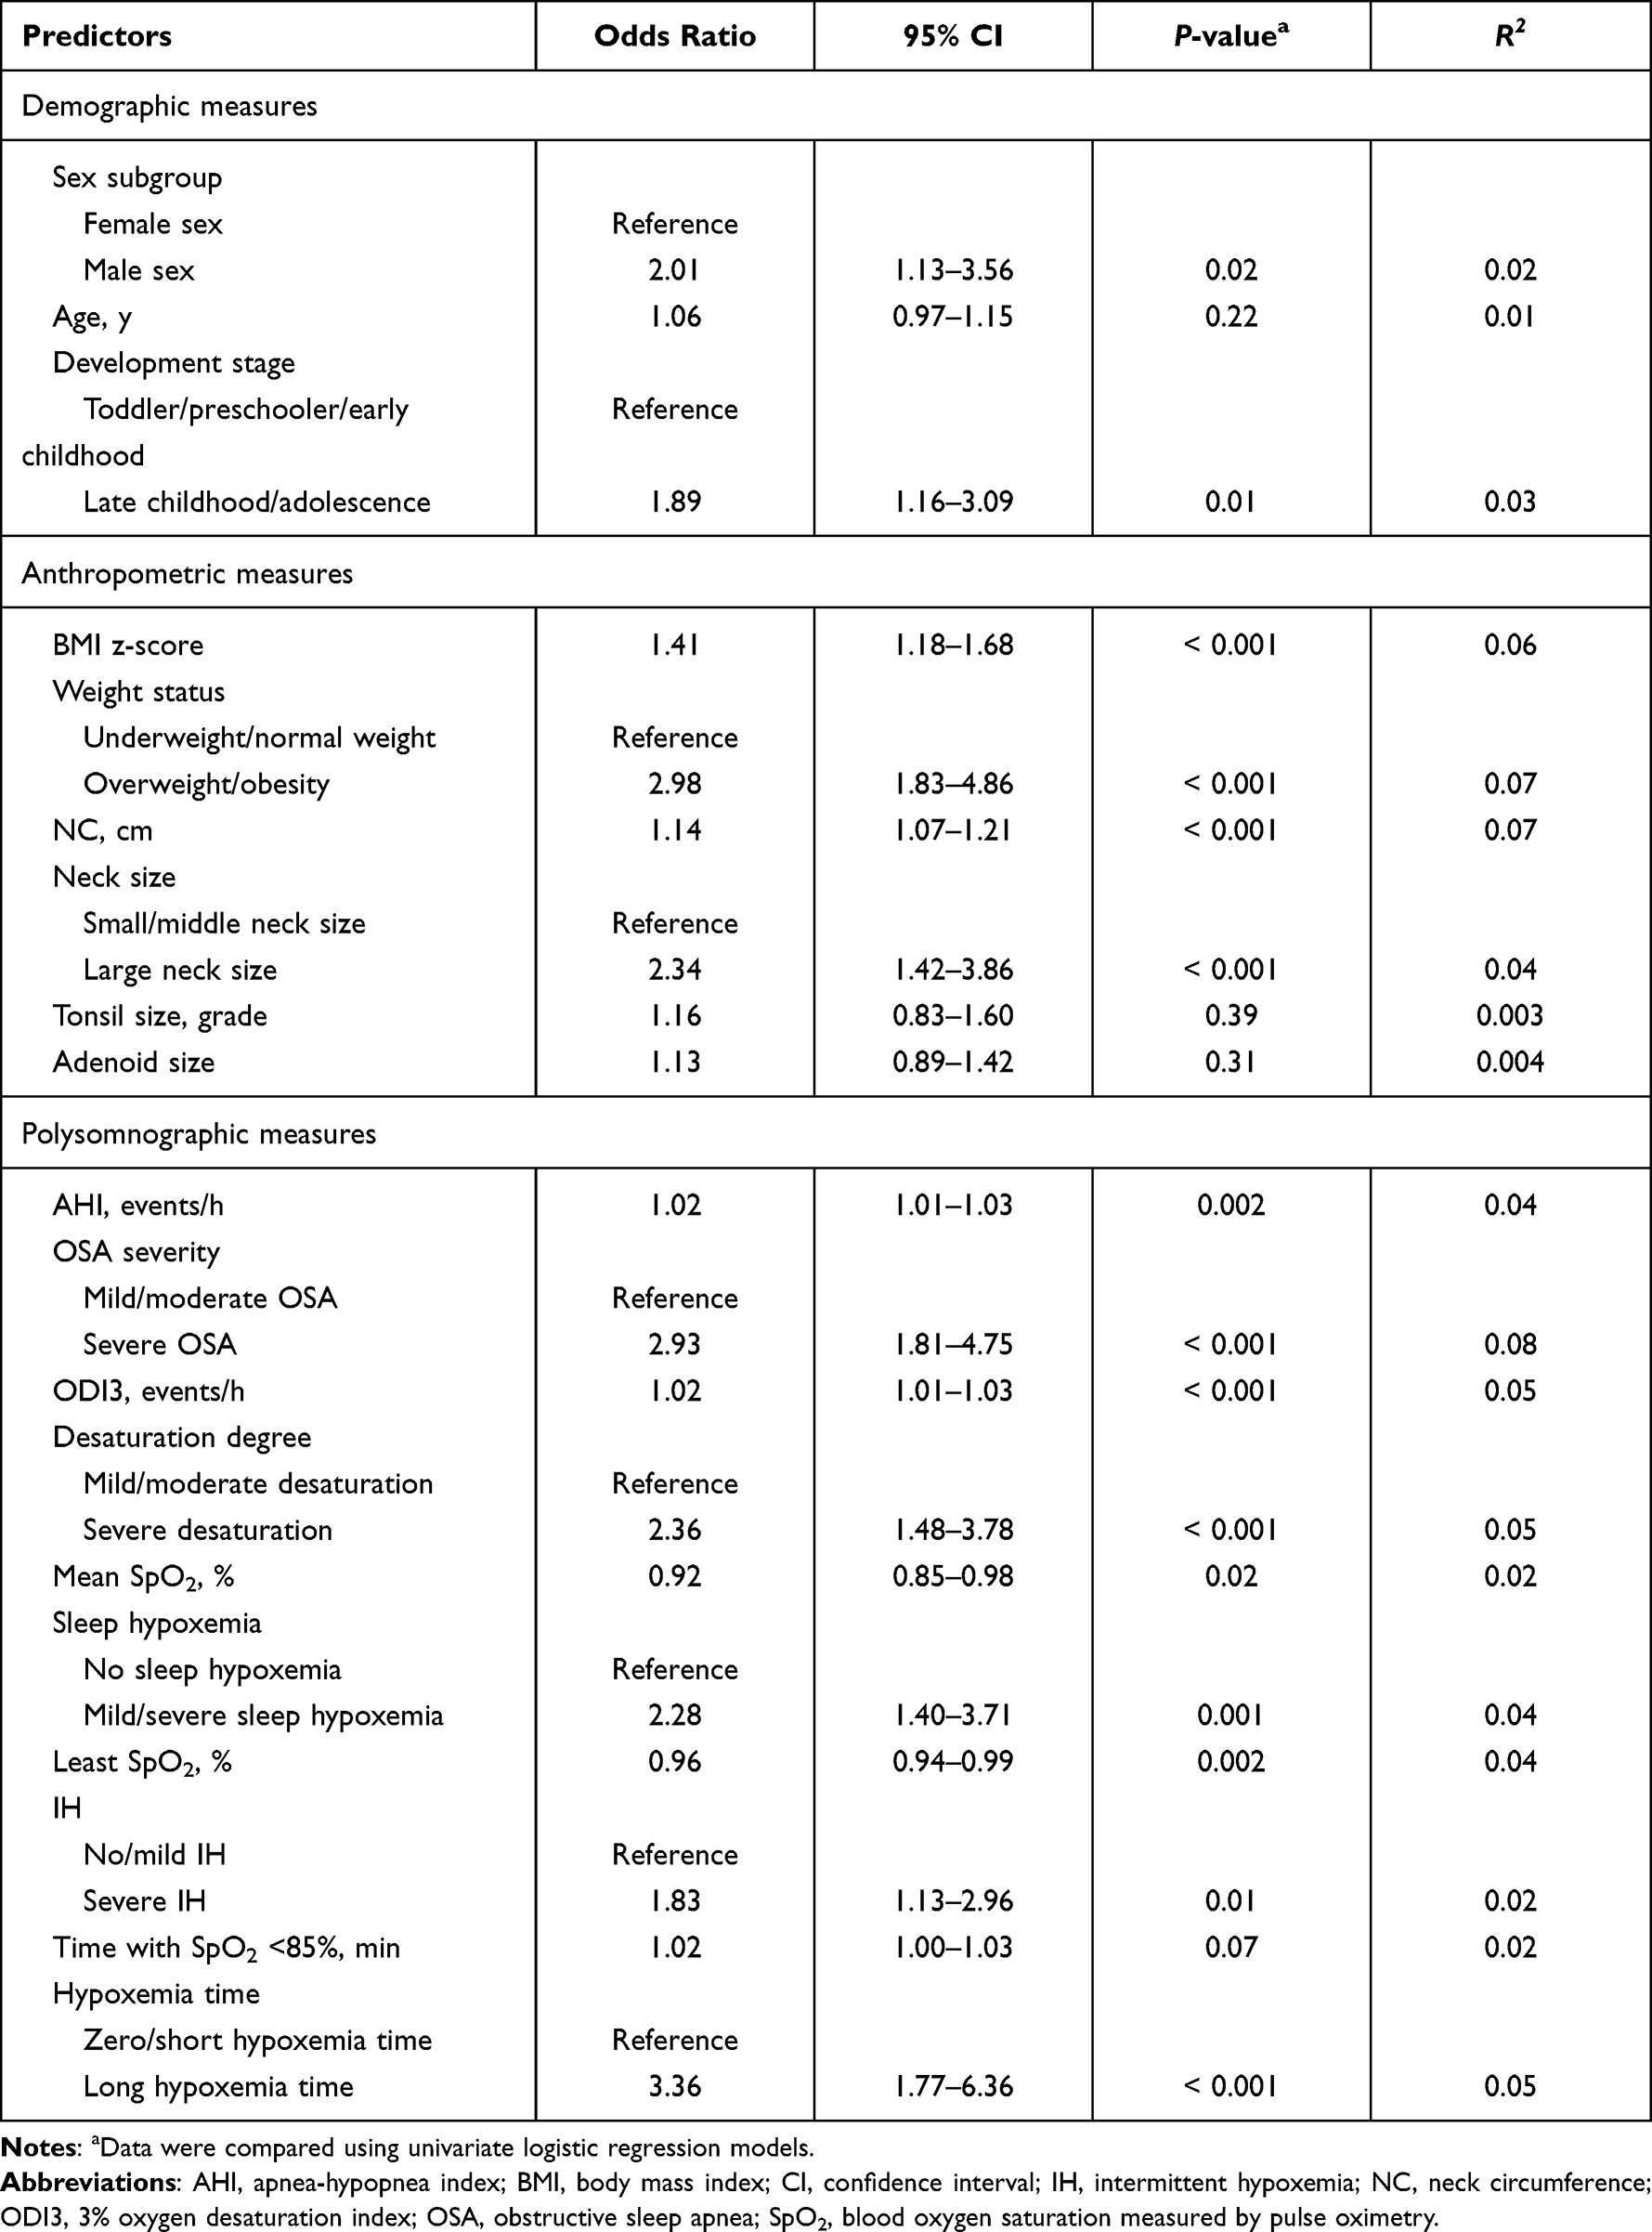 |
Table 2 Single Epidemiologic, Anthropometric, and Polysomnographic Measure as a Predictor of Pediatric Hypertension in Children with OSA |
Variables Independently Predicting Pediatric Hypertension Using Multivariate Logistic Regression Models
To improve regression performance, traditional hypertensive risk factors such as male sex, age (or development stage or late childhood/adolescence), and BMI z-score (or weight status or overweight/obesity) were included in multivariate logistic regression models. Furthermore, known or potential risk factors for hypertension with an alpha level of 0.50 were also included in the multivariate regression models,49 including NC (or large neck size), tonsil size, adenoid size, AHI (or severe OSA), ODI3 (or severe desaturation), mean SpO2 (or mild/severe sleep hypoxemia), least SpO2 (severe IH), and time with SpO2 < 85% (or long hypoxemia time). Notably, overlapping information were not simultaneously included for the multivariate logistic regression analyses and variables with an incorrect sign of regression coefficient were further removed from the regression models. Table 3 shows the multivariate regression models used to predict pediatric hypertension in the children.
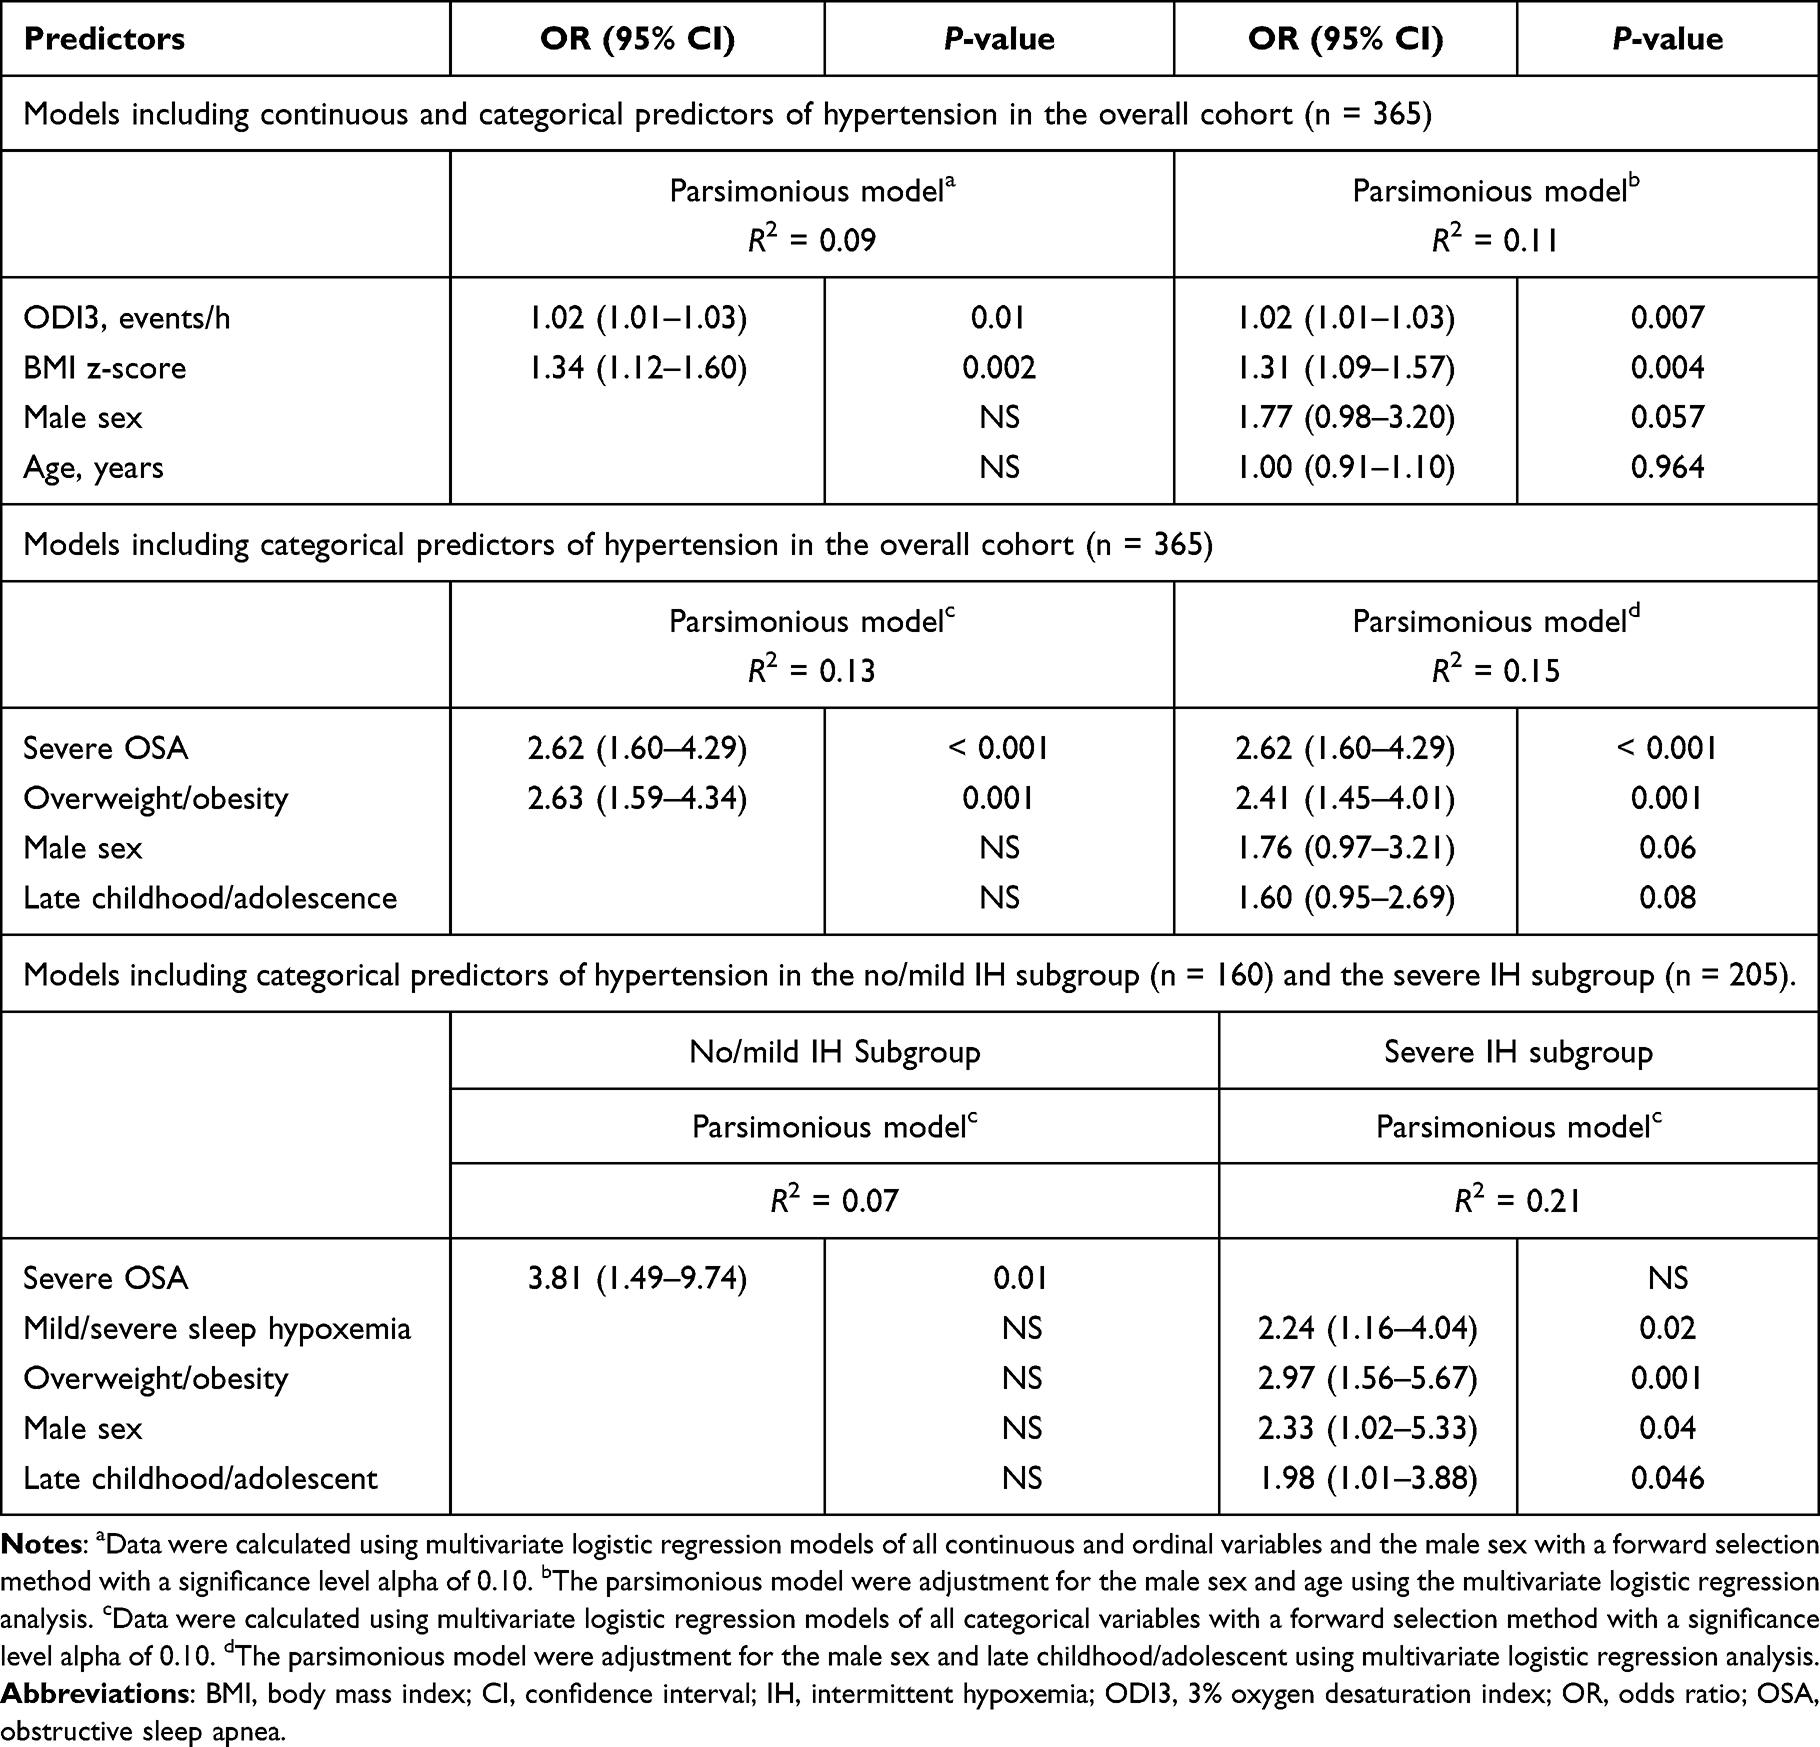 |
Table 3 Multivariate Logistic Regression Models for Predicting Pediatric Hypertension of the Overall Cohort as Well as No/Mild IH and Severe IH Subgroups |
Using continuous variables and traditional hypertension risk factors in the multivariate regression models, ODI3 (OR = 1.02, 95% CI = 1.01–1.03) and BMI z-score (OR = 1.34, 95% CI = 1.12–1.60) were independent predictors of pediatric hypertension (R2 = 0.09). After adjusting for male sex and age, ODI3 (OR = 1.02, 95% CI = 1.01–1.03) and BMI z-score (OR = 1.31, 95% CI = 1.09–1.57) remained significant predictors of pediatric hypertension (R2 = 0.11).
Furthermore, severe OSA (OR = 2.62, 95% CI = 1.60–4.29) and overweight/obesity (OR = 2.63, 95% CI = 1.59–4.34) were independent predictors of pediatric hypertension (R2 = 0.13) in the multivariate regression models of all categorical variables. Notably, severe OSA (OR = 2.62, 95% CI = 1.60–4.29) and overweight/obesity (OR = 2.41, 95% CI = 1.45–4.01) remained significant predictors of pediatric hypertension after controlling for male sex and late childhood/adolescence (R2 = 0.16).
Variables Independently Associated with Hypertension in the Children with or Without Severe Intermittent Hypoxemia Using Logistic Regression Analysis
We wondered whether some classifications based on categorical hypoxemia indexes may be associated with the prediction of hypertension. Therefore, we compared differences in the associations of categorical variables between various subgroups (mild/moderate desaturation and severe desaturation; no sleep hypoxemia and mild/severe sleep hypoxemia; no/mild IH and severe IH; zero/short hypoxemia time and long hypoxemia time).
In the no/mild IH subgroup (n = 160), the prevalence rate of hypertension was 20.6%, and severe OSA (OR = 3.81, 95% CI = 1.49–9.74, P = 0.01) was shown to be an independent risk factor using multivariate logistic regression (R2 = 0.07).
In the severe IH subgroup (n = 205), the prevalence rate of hypertension was 32.2%. Severe sleep hypoxemia (OR = 2.24, 95% CI = 1.16–4.04, P = 0.02), male sex (OR = 2.33, 95% CI = 1.02–5.33, P = 0.04), late childhood/adolescence (OR = 1.98, 95% CI = 1.01–3.88, P = 0.046), and overweight/obesity (OR = 2.97, 95% CI = 1.56–5.67, P = 0.001) were shown to be independent predictors of hypertension in multivariate analysis (R2 = 0.21).
Discussion
In the present study, we investigated the relationships of IH and weight status with hypertension among pediatric OSA patients. Significant associations were observed between pediatric hypertension and its known demographic and anthropometric risk factors, namely male sex, older age, BMI z-score, and overweight/obesity. Moreover, polysomnographic measures including severe OSA (defined with AHI), severe desaturation (defined with ODI3), sleep hypoxemia (defined with mean SpO2), severe IH (defined with least SpO2), and long hypoxemia time (defined with time with SpO2 < 85%) were significantly associated with pediatric hypertension in the overall cohort. ODI3 and BMI z-score were independent predictors in the parsimonious model of continuous variables (unadjusted R2 = 0.09, adjusted R2 = 0.11), whilst severe OSA and overweight/obesity were independent predictors in the parsimonious model of categorical variables (unadjusted R2 = 0.13, adjusted R2 = 0.15). After the patients were stratified by IH level, traditional risk factors combined with hypoxemia-related variables predicted hypertension in the severe IH subgroup (R2 = 0.21), while the no/mild IH subgroup had an entirely different predictor, severe OSA (R2 = 0.07).
In our cohort, hypertension was more prevalent in the boys than in the girls. This finding is consistent with national data showing that the prevalence of hypertension has been consistently higher in male children and adolescents for over a decade in Taiwan.50 Also, it has been long evident that the risk for OSA differs by sex. Male sex is a key risk factor for severe adolescent OSA51 and OSA evolving from childhood to young adulthood.52 In this study, male sex was an independent risk factor for pediatric hypertension in the severe IH subgroup. Although the exact mechanisms are unknown, sex difference may be a confounding factor for both OSA53 and BP.54 Sex differences warrant special considerations among pediatric OSA patients in the management of co-morbid secondary hypertension.
Another finding was the higher prevalence of hypertension in the late childhood/adolescence subgroup compared to the toddler/preschool/early childhood subgroup. A recent meta-analysis found that the global prevalence of hypertension increased significantly from 6 to 12 years old and reached a peak in late puberty.55 Hormonal changes and growth spurts are widely accepted mechanisms to explain the elevation in BP during puberty.55 However, considering the discrepancy in the prevalence of hypertension between children with OSA and the general pediatric population, we postulate that the increase in BP along with age may also be partly due to the accumulative effect of OSA over time.
Obesity is a well-established risk factor for hypertension and cardiovascular diseases.56 Possible mechanisms of hypertension development in overweight/obese children and adolescents include increased intravascular volume, disturbed sodium excretion, abnormal adipocyte secretory function, insulin resistance, and dysregulated renin-angiotensin-aldosterone axis.57 The positive association between obesity and hypertension observed in our study is compatible with the literature.55,58 In addition, we found that BMI z-score was closely related to IH indexes. Both obesity and IH worsen metabolic dysregulation59 and consequently worsen hypertension60 in children, and the effects of weight status and OSA severity on BP may be age-dependent.61 In obese children, AHI and ODI have been associated with elevated systolic BP.62 Moreover, in adolescents, the relationship between obesity and hypertension has been shown to be stronger than that between OSA and hypertension.63 Obesity, OSA, and hypertension can all be improved by diet control and physical activity.64,65 Our findings support the importance of weight control to manage hypertension in children with OSA.
In this study, hypertension was notably more prevalent among the children with OSA (27.1%) compared to the global prevalence of childhood hypertension (4%).55 As mentioned above, OSA is a well-known risk factor for secondary hypertension in adults21 and in children.47 Obstructive events and oxygen desaturations have been shown to induce acute cardiovascular changes, such as increased pulse transit time, in children with OSA, consequently causing an elevation in BP.66 Hypertension, in turn, has been shown to exacerbate OSA.9,67,68 Higher BP itself has been associated with a reduction in genioglossus activity and disruption of upper airway stability.69 Moreover, primary aldosteronism, which is not uncommon in hypertensive patients, can cause rostral fluid accumulation and increase upper airway collapsibility.70 The use of diuretics to control BP has been shown to confer a small but significant reduction in OSA severity.71 In addition, Lee et al reported that adenotonsillectomy resulted in a dramatic decrease in the prevalence of hypertension from 34% to 14%.9
However, despite the known bidirectional effects of OSA on BP,25,26 inconsistencies and knowledge gaps still exist within the current understanding of the interactions between OSA and hypertension in children. A meta-analysis conducted by Zintzaras and Kaditis (2007) found that moderate-to-severe SDB in children did not significantly increase the risk of elevated BP.72 In addition, contradicting the known epidemiology of hypertension, Chuang et al reported that neither family history of hypertension nor family history of SDB predicted pediatric hypertension for children with SDB.14 Furthermore, Kang et al reported that adenotonsillectomy had no significant effect on BP, except in children with both OSA and hypertension.8 In our previous work, we found that considerable heterogeneity existed among pediatric patients diagnosed with SDB or OSA regarding their comorbidities, inflammatory status, microbiome, and treatment responses, even after adjusting for disease severity, and that the phenotype subgroups were mainly stratified by weight status and hypoxemic level.9,14,30,31,39,73 We postulated that the pathogenesis and progression of BP elevation were diverse across different phenotype patient groups.
The results of the current study support our hypotheses of IH relating to elevated BP. The severe IH subgroup had a notably higher prevalence of hypertension, suggesting the role of IH in BP elevation. OSA-induced IH has been shown to activate the sympathetic nervous system,74 dysregulate the renin-angiotensin-aldosterone system,75 and then contribute to hypertension.76 A considerable volume of evidence suggests that IH is more severe during rapid eye movement sleep.77,78 In 2020, Brooks et al further indicated that OSA patients have higher BP during rapid eye movement sleep.79 Chronic IH changes the neurotransmission direction of the brain stem to decrease cardioprotective parasympathetic activity and increase cardiovascular events.77 Taken together with the present study, these findings suggest that for pediatric OSA patients who have profound desaturation as the disease presentation, IH may be the cardinal pathogenic driver of BP elevation. On the other hand, for those with none or only mild desaturation, disease severity itself, defined by respiratory events, may play a more important role in the development of hypertension.
According to the American Academy of Pediatrics clinical practice guideline for screening and management of high BP in children and adolescents, adenotonsillar hypertrophy should be assessed because the large size of the tonsils and adenoids is a sign of pediatric SDB, and the latter is a secondary cause of pediatric hypertension (Flynn et al). In the current study, we further discovered that in this cohort of pediatric OSA patients, neither tonsil size (odds ratio = 1.16; 95% CI: 0.83–1.60; P = 0.39) nor adenoid size (odds ratio = 1.13; 95% CI: 0.89–1.42; P = 0.31) was a significant risk factor for hypertension (Table 2). Adenotonsillar hypertrophy is an essential risk factor for secondary hypertension in the general pediatric population; however, as for children with OSA, neither seems to be an independent factor for hypertension. The literature and our data in combination suggest that the greater risk of secondary hypertension possessed by children with adenotonsillar hypertrophy is probably not caused by the gland sizes themselves, but more likely mediated by OSA, and severe desaturation may be implicated as a cardinal pathogenic pathway. This finding is novel and yields important clinical implications, suggesting that severe desaturation should be identified and managed promptly in children with OSA to better prevent or minimize secondary hypertension.
A very interesting and similar result was observed with NC as with adeno/tonsillar sizes. NC is closely related to body weight status and elevated BP in children.80 In a very recent meta-analysis, NC was an anthropometric predictor of elevated BP in children and adolescents regardless of the presence of OSA.81 We also demonstrated that NC was significantly associated with OSA in younger children.30 Wide NC (ie, large neck size) cluster many risk factors for pediatric hypertension. However, from our data, neither NC nor neck size was an independent predictor for hypertension among children and adolescents with OSA. The greater risk of secondary hypertension possessed by children with wider NC may not be brought by the neck size itself but more likely mediated by pathophysiological effects caused by obesity or OSA. Nevertheless, NC is a readily available measurement in general clinical settings and can be used to screen pediatric hypertension before polysomnography in children with SDB.
In the current study, we identified relationships among IH, weight status, demographic variables, and hypertension in a sample of children with OSA. ODI3, severe OSA, BMI z-score, and overweight/obesity were important risk factors for hypertension. However, independent predictors of hypertension differed across the patients with different IH levels. There were several limitations to the study. First, the investigation was conducted at a tertiary medical center in Taiwan, and the sample was predominantly male, mostly of Han ethnicity, and had severe OSA, which may limit the generalizability of our findings. Second, this study was cross-sectional, thus we could not assess causality. Longitudinal case-control or interventional studies are warranted to confirm the roles of IH and weight status in hypertension among children with OSA.
Conclusion
We found that ODI3 was a major risk factor for hypertension in the children with OSA. In the children with less significant IH, AHI was a better predictor of hypertension, whereas in the children with more significant IH, mean SpO2 was a suitable predictor of hypertension together with overweight/obesity, older age, and male sex.
Acknowledgments
This study was supported by the Ministry of Science and Technology, Taiwan, ROC, grant number 109-2314-B-182A-017-MY3 and the Chang Gung Medical Foundation, Taiwan, grant number CMRPG3J1701 (LAL). We thank Ruo-Chi Wang and Chung-Fang Hsiao (Department of Otorhinolaryngology, Head and Neck Surgery, Chang Gung Memorial Hospital, Linkou Main Branch, Taoyuan City, Taiwan, ROC) for their technical assistance.
Author Contributions
All authors made a significant contribution to the work reported, whether that is in the conception, study design, execution, acquisition of data, analysis and interpretation, or in all these areas; took part in drafting, revising or critically reviewing the article; gave final approval of the version to be published; have agreed on the journal to which the article has been submitted; and agree to be accountable for all aspects of the work.
Disclosure
The authors declare no conflicts of interest in this work.
References
1. Li HY, Lee LA, Hsin LJ, et al. Intrapharyngeal surgery with integrated treatment for obstructive sleep apnea. Biomed J. 2019;42(2):84–92. doi:10.1016/j.bj.2019.02.002
2. Gallucci M, Gessaroli M, Bronzetti G, et al. Cardiovascular issues in obstructive sleep apnoea in children: a brief review. Paediatr Respir Rev. 2021;38:45–50. doi:10.1016/j.prrv.2020.05.007
3. Javaheri S, Barbe F, Campos-Rodriguez F, et al. Sleep apnea: types, mechanisms, and clinical cardiovascular consequences. J Am Coll Cardiol. 2017;69(7):841–858. doi:10.1016/j.jacc.2016.11.069
4. Gonzaga C, Bertolami A, Bertolami M, Amodeo C, Calhoun D. Obstructive sleep apnea, hypertension and cardiovascular diseases. J Hum Hypertens. 2015;29(12):705–712. doi:10.1038/jhh.2015.15
5. Prabhakar NR, Peng YJ, Nanduri J. Hypoxia-inducible factors and obstructive sleep apnea. J Clin Invest. 2020;130(10):5042–5051. doi:10.1172/JCI137560
6. Tkacova R, McNicholas WT, Javorsky M, et al. Nocturnal intermittent hypoxia predicts prevalent hypertension in the European Sleep Apnoea Database cohort study. Eur Respir J. 2014;44(4):931–941. doi:10.1183/09031936.00225113
7. Wang N, Meng Z, Ding N, et al. Oxygen desaturation rate as a novel intermittent hypoxemia parameter in severe obstructive sleep apnea is strongly associated with hypertension. J Clin Sleep Med. 2020;16(7):1055–1062. doi:10.5664/jcsm.8396
8. Kang KT, Chiu SN, Lee CH, Lin MT, Hsu WC. Effect of adenotonsillectomy on blood pressure in children with obstructive sleep apnea: a meta-analysis. Sleep Med. 2021;84:334–342. doi:10.1016/j.sleep.2021.06.017
9. Lee LA, Li HY, Lin YS, et al. Severity of childhood obstructive sleep apnea and hypertension improved after adenotonsillectomy. Otolaryngol Head Neck Surg. 2015;152(3):553–560. doi:10.1177/0194599814561203
10. Bass JL, Corwin M, Gozal D, et al. The effect of chronic or intermittent hypoxia on cognition in childhood: a review of the evidence. Pediatrics. 2004;114(3):805–816. doi:10.1542/peds.2004-0227
11. Seravalle G, Grassi G. Obesity and hypertension. Pharmacol Res. 2017;122:1–7. doi:10.1016/j.phrs.2017.05.013
12. Hsu CY, Lin RH, Lin YC, et al. Are body composition parameters better than conventional anthropometric measures in predicting pediatric hypertension? Int J Environ Res Public Health. 2020;17(16):16. doi:10.3390/ijerph17165771
13. Kuczmarski RJ, Ogden CL, Guo SS, et al. CDC growth charts for the United States: methods and development. Vital Health Stat. 2000;2002(246):1–190.
14. Chuang HH, Hsu JF, Wang CY, et al. Hypertension in children with obstructive sleep apnea syndrome-age, weight status, and disease severity. Int J Environ Res Public Health. 2021;18(18):9602. doi:10.3390/ijerph18189602
15. Chang IS, Kang KT, Tseng CC, et al. Revisits after adenotonsillectomy in children with sleep-disordered breathing: a retrospective single-institution study. Clin Otolaryngol. 2018;43(1):39–46. doi:10.1111/coa.12899
16. Fox C. Pediatric Hypertension. Prim Care. 2021;48(3):367–378. doi:10.1016/j.pop.2021.04.001
17. Wuhl E. Hypertension in childhood obesity. Acta Paediatr. 2019;108(1):37–43. doi:10.1111/apa.14551
18. Chen HC, Wang CJ, Lo YL, et al. Parapharyngeal fat pad area at the subglosso-supraglottic level is associated with corresponding lateral wall collapse and apnea-hypopnea index in patients with obstructive sleep apnea: a pilot study. Sci Rep. 2019;9(1):17722. doi:10.1038/s41598-019-53515-5
19. Avraam J, Dawson A, Rochford PD, et al. The effect of sex and body weight on lung volumes during sleep. Sleep. 2019;42(10). doi:10.1093/sleep/zsz141
20. Brady TM. Obesity-related hypertension in children. Front Pediatr. 2017;5:197. doi:10.3389/fped.2017.00197
21. Hou H, Zhao Y, Yu W, et al. Association of obstructive sleep apnea with hypertension: a systematic review and meta-analysis. J Glob Health. 2018;8(1):010405. doi:10.7189/jogh.08.010405
22. Salman LA, Shulman R, Cohen JB. Obstructive sleep apnea, hypertension, and cardiovascular risk: epidemiology, pathophysiology, and management. Curr Cardiol Rep. 2020;22(2):6. doi:10.1007/s11886-020-1257-y
23. Chiang CL, Chen YT, Wang KL, et al. Comorbidities and risk of mortality in patients with sleep apnea. Ann Med. 2017;49(5):377–383. doi:10.1080/07853890.2017.1282167
24. Young T, Finn L, Peppard PE, et al. Sleep disordered breathing and mortality: eighteen-year follow-up of the Wisconsin sleep cohort. Sleep. 2008;31(8):1071–1078.
25. Torres G, Sanchez-de-la-Torre M, Barbe F. Relationship between OSA and hypertension. Chest. 2015;148(3):824–832. doi:10.1378/chest.15-0136
26. Wang Y, Li CX, Lin YN, et al. The role of aldosterone in OSA and OSA-related hypertension. Front Endocrinol. 2021;12:801689. doi:10.3389/fendo.2021.801689
27. World Medical Association. World Medical Association Declaration of Helsinki: ethical principles for medical research involving human subjects. JAMA. 2013;310(20):2191–2194. doi:10.1001/jama.2013.281053
28. von Elm E, Altman DG, Egger M, et al. The Strengthening the Reporting of Observational Studies in Epidemiology (STROBE) statement: guidelines for reporting observational studies. PLoS Med. 2007;4(10):e296. doi:10.1371/journal.pmed.0040296
29. Marcus CL, Moore RH, Rosen CL, et al. A randomized trial of adenotonsillectomy for childhood sleep apnea. N Engl J Med. 2013;368(25):2366–2376. doi:10.1056/NEJMoa1215881
30. Chuang HH, Hsu JF, Chuang LP, et al. Differences in anthropometric and clinical features among preschoolers, school-age children, and adolescents with obstructive sleep Apnea-A Hospital-Based Study in Taiwan. Int J Environ Res Public Health. 2020;17:13. doi:10.3390/ijerph17134663
31. Huang YS, Guilleminault C, Hwang FM, et al. Inflammatory cytokines in pediatric obstructive sleep apnea. Medicine. 2016;95(41):e4944. doi:10.1097/MD.0000000000004944
32. Flegal KM, Cole TJ. Construction of LMS parameters for the Centers for Disease Control and Prevention 2000 growth charts. Natl Health Stat Report. 2013;2013(63):1–3.
33. Kaditis AG, Alexopoulos EI, Hatzi F, et al. Adiposity in relation to age as predictor of severity of sleep apnea in children with snoring. Sleep Breath. 2008;12(1):25–31. doi:10.1007/s11325-007-0132-z
34. Androutsos O, Grammatikaki E, Moschonis G, et al. Neck circumference: a useful screening tool of cardiovascular risk in children. Pediatr Obes. 2012;7(3):187–195. doi:10.1111/j.2047-6310.2012.00052.x
35. Nafiu OO, Burke C, Lee J, Voepel-Lewis T, Malviya S, Tremper KK. Neck circumference as a screening measure for identifying children with high body mass index. Pediatrics. 2010;126(2):e306–e310. doi:10.1542/peds.2010-0242
36. Brodsky L. Modern Assessment of Tonsils and Adenoids. Pediatr Clin North Am. 1989;36(6):1551–1569. doi:10.1016/S0031-3955(16)36806-7
37. Al-Ammar AY, Shebib D, Bokhari M, Jomah M. Grading adenoid utilizing flexible nasopharyngoscopy. Ann Saudi Med. 2013;33(3):265–267. doi:10.5144/0256-4947.2013.265
38. Li HY, Lee LA. Sleep-disordered breathing in children. Chang Gung Med J. 2009;32(3):247–257.
39. Huang YS, Guilleminault C, Lee LA, Lin CH, Hwang FM. Treatment outcomes of adenotonsillectomy for children with obstructive sleep apnea: a prospective longitudinal study. Sleep. 2014;37(1):71–76. doi:10.5665/sleep.3310
40. Berry RB, Budhiraja R, Gottlieb DJ, et al. Rules for scoring respiratory events in sleep: update of the 2007 AASM manual for the scoring of sleep and associated events. deliberations of the sleep apnea definitions task force of the American Academy of sleep medicine. J Clin Sleep Med. 2012;8(5):597–619. doi:10.5664/jcsm.2172
41. Wu WT, Tsai SS, Lin YJ, et al. Utility of overnight pulse oximeter as a screening tool for sleep apnea to assess the 8-year risk of cardiovascular disease: data from a large-scale bus driver cohort study. Int J Cardiol. 2016;225:206–212. doi:10.1016/j.ijcard.2016.09.110
42. World Health Organization. Pocket Book of Hospital Care for Children: Guidelines for the Management of Common Illnesses with Limited Resources.
43. Urschitz MS, Wolff J, Sokollik C, et al. Nocturnal arterial oxygen saturation and academic performance in a community sample of children. Pediatrics. 2005;115(2):e204–e209. doi:10.1542/peds.2004-1256
44. Shafiek H, Evangelisti M, Abd-Elwahab NH, Barreto M, Villa MP, Mahmoud MI. Obstructive sleep apnea in school-aged children presented with Nocturnal Enuresis. Lung. 2020;198(1):187–194. doi:10.1007/s00408-019-00304-6
45. Ostchega Y, Hughes JP, Prineas RJ, Zhang G, Nwankwo T, Chiappa MM. Mid-arm circumference and recommended blood pressure cuffs for children and adolescents aged between 3 and 19 years: data from the National Health and Nutrition Examination Survey, 1999–2010. Blood Press Monit. 2014;19(1):26–31. doi:10.1097/MBP.0000000000000008
46. National High Blood Pressure Education Program Working Group on High Blood Pressure in C, Adolescents. The fourth report on the diagnosis, evaluation, and treatment of high blood pressure in children and adolescents. Pediatrics. 2004;114(2 Suppl):555–576. doi:10.1542/peds.114.S2.555
47. Flynn JT, Kaelber DC, Baker-Smith CM, et al. Clinical practice guideline for screening and management of high blood pressure in children and adolescents. Pediatrics. 2017;140(3). doi:10.1542/peds.2017-1904
48. Reibnegger G, Schrabmair W. Optimum binary cut-off threshold of a diagnostic test: comparison of different methods using Monte Carlo technique. BMC Med Inform Decis Mak. 2014;14:99.
49. Steyerberg EW, Eijkemans MJC, Harrell FE, Habbema JDF. Prognostic modelling with logistic regression analysis: a comparison of selection and estimation methods in small data sets. Stat Med. 2000;19(8):1059–1079. doi:10.1002/(SICI)1097-0258(20000430)19:8<1059::AID-SIM412>3.0.CO;2-0
50. Hsu WF, Kao YW, Chen M, et al. A reappraisal of the prevalence of pediatric hypertension through a nationwide database in Taiwan. Sci Rep. 2021;11(1):4475. doi:10.1038/s41598-021-84001-6
51. Baker M, Scott B, Johnson RF, Mitchell RB. Predictors of obstructive sleep apnea severity in adolescents. JAMA Otolaryngol Head Neck Surg. 2017;143(5):494–499. doi:10.1001/jamaoto.2016.4130
52. Chan KC, Au CT, Hui LL, Ng SK, Wing YK, Li AM. How OSA evolves from childhood to young adulthood: natural history from a 10-year follow-up study. Chest. 2019;156(1):120–130. doi:10.1016/j.chest.2019.03.007
53. Lin CM, Davidson TM, Ancoli-Israel S. Gender differences in obstructive sleep apnea and treatment implications. Sleep Med Rev. 2008;12(6):481–496. doi:10.1016/j.smrv.2007.11.003
54. Dasgupta K, O’Loughlin J, Chen S, et al. Emergence of sex differences in prevalence of high systolic blood pressure: analysis of a longitudinal adolescent cohort. Circulation. 2006;114(24):2663–2670. doi:10.1161/CIRCULATIONAHA.106.624536
55. Song P, Zhang Y, Yu J, et al. Global prevalence of hypertension in children: a systematic review and meta-analysis. JAMA Pediatr. 2019;173(12):1154–1163. doi:10.1001/jamapediatrics.2019.3310
56. Fortuno A, Rodriguez A, Gomez-Ambrosi J, Fruhbeck G, Diez J. Adipose tissue as an endocrine organ: role of leptin and adiponectin in the pathogenesis of cardiovascular diseases. J Physiol Biochem. 2003;59(1):51–60. doi:10.1007/BF03179868
57. Wojcik M, Koziol-Kozakowska A. Obesity, sodium homeostasis, and arterial hypertension in children and adolescents. Nutrients. 2021;13(11):4032. doi:10.3390/nu13114032
58. Sorof J, Daniels S. Obesity hypertension in children: a problem of epidemic proportions. Hypertension. 2002;40(4):441–447. doi:10.1161/01.HYP.0000032940.33466.12
59. Lesser DJ, Bhatia R, Tran WH, et al. Sleep fragmentation and intermittent hypoxemia are associated with decreased insulin sensitivity in obese adolescent Latino males. Pediatr Res. 2012;72(3):293–298. doi:10.1038/pr.2012.73
60. Magge SN, Goodman E, Armstrong SC. The metabolic syndrome in children and adolescents: shifting the focus to cardiometabolic risk factor clustering. Pediatrics. 2017;140(2). doi:10.1542/peds.2017-1603
61. Baker-Smith CM, Isaiah A, Melendres MC, et al. Sleep-disordered breathing and cardiovascular disease in children and adolescents: a scientific statement from the American Heart Association. J Am Heart Assoc. 2021;10(18):e022427. doi:10.1161/JAHA.121.022427
62. Tagetti A, Bonafini S, Zaffanello M, et al. Sleep-disordered breathing is associated with blood pressure and carotid arterial stiffness in obese children. J Hypertens. 2017;35(1):125–131. doi:10.1097/HJH.0000000000001123
63. Khan MA, Mathur K, Barraza G, et al. The relationship of hypertension with obesity and obstructive sleep apnea in adolescents. Pediatr Pulmonol. 2020;55(4):1020–1027. doi:10.1002/ppul.24693
64. Aguilar-Cordero MJ, Rodriguez-Blanque R, Leon-Rios X, Exposito Ruiz M, Garcia Garcia I, Sanchez-Lopez AM. Influence of physical activity on blood pressure in children with overweight/obesity: a randomized clinical trial. Am J Hypertens. 2020;33(2):131–136. doi:10.1093/ajh/hpz174
65. Roche J, Isacco L, Masurier J, et al. Are obstructive sleep apnea and sleep improved in response to multidisciplinary weight loss interventions in youth with obesity? A systematic review and meta-analysis. Int J Obes. 2020;44(4):753–770. doi:10.1038/s41366-019-0497-7
66. Nisbet LC, Yiallourou SR, Nixon GM, et al. Characterization of the acute pulse transit time response to obstructive apneas and hypopneas in preschool children with sleep-disordered breathing. Sleep Med. 2013;14(11):1123–1131. doi:10.1016/j.sleep.2013.06.010
67. Lavie P, Herer P, Hoffstein V. Obstructive sleep apnoea syndrome as a risk factor for hypertension: population study. BMJ. 2000;320(7233):479–482. doi:10.1136/bmj.320.7233.479
68. Kang KT, Chiu SN, Weng WC, Lee PL, Hsu WC. 24 hour ambulatory blood pressure variability in children with obstructive sleep apnea. Laryngoscope. 2021;131(9):2126–2132. doi:10.1002/lary.29455
69. Garpestad E, Basner RC, Ringler J, et al. Phenylephrine-induced hypertension acutely decreases genioglossus EMG activity in awake humans. J Appl Physiol. 1992;72(1):110–115. doi:10.1152/jappl.1992.72.1.110
70. White LH, Motwani S, Kasai T, Yumino D, Amirthalingam V, Bradley TD. Effect of rostral fluid shift on pharyngeal resistance in men with and without obstructive sleep apnea. Respir Physiol Neurobiol. 2014;192:17–22. doi:10.1016/j.resp.2013.11.002
71. Khurshid K, Yabes J, Weiss PM, et al. Effect of antihypertensive medications on the severity of obstructive sleep apnea: a systematic review and meta-analysis. J Clin Sleep Med. 2016;12(8):1143–1151. doi:10.5664/jcsm.6054
72. Zintzaras E, Kaditis AG. Sleep-disordered breathing and blood pressure in children: a meta-analysis. Arch Pediatr Adolesc Med. 2007;161(2):172–178. doi:10.1001/archpedi.161.2.172
73. Chuang HH, Hsu JF, Chuang LP, et al. Different associations between tonsil microbiome, chronic tonsillitis, and intermittent hypoxemia among obstructive sleep apnea children of different weight status: a pilot case-control study. J Pers Med. 2021;11(6):486. doi:10.3390/jpm11060486
74. O’Driscoll DM, Horne RS, Davey MJ, et al. Increased sympathetic activity in children with obstructive sleep apnea: cardiovascular implications. Sleep Med. 2011;12(5):483–488. doi:10.1016/j.sleep.2010.09.015
75. Shamsuzzaman A, Szczesniak RD, Fenchel MC, Amin RS. Plasma renin levels and renin-blood pressure relationship in normal-weight and overweight children with obstructive sleep apnea and matched controls. Sleep Med. 2015;16(1):101–106. doi:10.1016/j.sleep.2014.05.022
76. Jehan S, Zizi F, Pandi-Perumal SR, McFarlane SI, Jean-Louis G, Myers AK. Obstructive sleep apnea, hypertension, resistant hypertension and cardiovascular disease. Sleep Med Disord. 2020;4(3):67–76.
77. Dergacheva O. Chronic intermittent hypoxia alters neurotransmission from lateral paragigantocellular nucleus to parasympathetic cardiac neurons in the brain stem. J Neurophysiol. 2015;113(1):380–389. doi:10.1152/jn.00302.2014
78. Choi E, Park DH, Yu JH, Ryu SH, Ha JH. The severity of sleep disordered breathing induces different decrease in the oxygen saturation during rapid eye movement and non-rapid eye movement sleep. Psychiatry Investig. 2016;13(6):652–658. doi:10.4306/pi.2016.13.6.652
79. Brooks DM, Kelly A, Sorkin JD, et al. The relationship between sleep-disordered breathing, blood pressure, and urinary cortisol and catecholamines in children. J Clin Sleep Med. 2020;16(6):907–916. doi:10.5664/jcsm.8360
80. Nafiu OO, Zepeda A, Curcio C, Prasad Y. Association of neck circumference and obesity status with elevated blood pressure in children. J Hum Hypertens. 2014;28(4):263–268. doi:10.1038/jhh.2013.93
81. Moradi S, Mohammadi H, Ghavami A, Rouhani MH. Neck circumference and blood pressure among children: a systematic review and meta-analysis. J Am Soc Hypertens. 2018;12(12):822–832. doi:10.1016/j.jash.2018.10.007
 © 2022 The Author(s). This work is published and licensed by Dove Medical Press Limited. The
full terms of this license are available at https://www.dovepress.com/terms
and incorporate the Creative Commons Attribution
- Non Commercial (unported, 3.0) License.
By accessing the work you hereby accept the Terms. Non-commercial uses of the work are permitted
without any further permission from Dove Medical Press Limited, provided the work is properly
attributed. For permission for commercial use of this work, please see paragraphs 4.2 and 5 of our Terms.
© 2022 The Author(s). This work is published and licensed by Dove Medical Press Limited. The
full terms of this license are available at https://www.dovepress.com/terms
and incorporate the Creative Commons Attribution
- Non Commercial (unported, 3.0) License.
By accessing the work you hereby accept the Terms. Non-commercial uses of the work are permitted
without any further permission from Dove Medical Press Limited, provided the work is properly
attributed. For permission for commercial use of this work, please see paragraphs 4.2 and 5 of our Terms.