Back to Journals » Journal of Hepatocellular Carcinoma » Volume 8
Texture Analysis Based on Gd-EOB-DTPA-Enhanced MRI for Identifying Vessels Encapsulating Tumor Clusters (VETC)-Positive Hepatocellular Carcinoma
Authors Fan Y, Yu Y, Wang X, Hu M, Du M, Guo L, Sun S, Hu C
Received 2 December 2020
Accepted for publication 25 March 2021
Published 5 May 2021 Volume 2021:8 Pages 349—359
DOI https://doi.org/10.2147/JHC.S293755
Checked for plagiarism Yes
Review by Single anonymous peer review
Peer reviewer comments 2
Editor who approved publication: Dr Ahmed Kaseb
Yanfen Fan,1,2,* Yixing Yu,1,2,* Ximing Wang,1,2 Mengjie Hu,1,2 Mingzhan Du,3 Lingchuan Guo,3 Shifang Sun,4 Chunhong Hu1,2
1Department of Radiology, The First Affiliated Hospital of Soochow University, Suzhou, Jiangsu, 215006, People’s Republic of China; 2Institute of Medical Imaging of Soochow University, Suzhou, Jiangsu, 215006, People’s Republic of China; 3Department of Pathology, The First Affiliated Hospital of Soochow University, Suzhou, Jiangsu, 215006, People’s Republic of China; 4School of Mechatronic Engineering and Automation, Shanghai University, Shanghai, 200444, People’s Republic of China
*These authors contributed equally to this work
Correspondence: Chunhong Hu
Department of Radiology, The First Affiliated Hospital of Soochow University, Suzhou, Jiangsu, 215006, People’s Republic of China
Tel +86 135 06219750
Email [email protected]
Purpose: To determine the potential findings associated with vessels encapsulating tumor clusters (VETC)-positive hepatocellular carcinoma (HCC), with particular emphasis on texture analysis based on gadolinium-ethoxybenzyl-diethylenetriamine pentaacetic acid (Gd-EOB-DTPA)-enhanced MRI.
Methods: Eighty-one patients with VETC-negative HCC and 52 patients with VETC-positive HCC who underwent Gd-EOB-DTPA-enhanced MRI before curative partial hepatectomy were retrospectively evaluated in our institution. MRI texture analysis was performed on arterial phase (AP) and hepatobiliary phase (HBP) images. The least absolute shrinkage and selection operator (LASSO) logistic regression was used to select texture features most useful for identifying VETC-positive HCC. Univariate and multivariate analyses were used to determine significant variables for identifying the VETC-positive HCC in clinical factors and the texture features of MRI. Receiver operating characteristic (ROC) analysis and DeLong test were performed to compare the identified performances of significant variables for identifying VETC-positive HCC.
Results: LASSO logistic regression selected 3 features in AP and HBP images, respectively. In multivariate analysis, the Log-sigma-4.0-mm-3D first-order Kurtosis derived from AP images (odds ratio [OR] = 4.128, P = 0.001) and the Wavelet-LHL-GLDM Dependence Non Uniformity Normalized derived from HBP images (OR = 2.280, P = 0.004) were independent significant variables associated with VETC-positive HCC. The combination of the two texture features for identifying VETC-positive HCC achieved an AUC value of 0.844 (95% confidence interval CI, 0.777, 0.910) with a sensitivity of 80.8% (95% CI, 70.1%, 91.5%) and specificity of 74.1% (95% CI, 64.5%, 83.6%).
Conclusion: Texture analysis based on Gd-EOB-DTPA-enhanced MRI can help identify VETC-positive HCC.
Keywords: hepatocellular carcinoma, texture analysis, GD-EOB-DTPA, quantitative, VETC
Introduction
Global Cancer Statistics 2018 reported about 841,000 new cases and 782,000 deaths annually for liver cancers.1 Hepatocellular carcinoma (HCC) accounts for 75%–90% of primary liver cancers and constitutes a major global health problem.1–3 For the therapeutic strategies, partial hepatectomy remains the most effective measure for resectable HCCs with preserved liver function.3–5 However, after curative resection, the recurrence rate was more than 50%, even approximately 70% at five years.6,7 The frequent relapse is mainly due to early metastasis.8 Vessels encapsulating tumor clusters (VETC), a histological vascular pattern, has been identified as a predictor of micro-metastasis in HCC after resection.9 Recently, Renne et al stated that the VETC was a powerful predictor of aggressive HCC.10 It was associated with poor prognosis after partial hepatectomy for HCC, the presence of VETC was associated with early recurrence, poor overall survival (OS) and shorter disease-free survival (DFS).9,10 Moreover, Fang et al8 and Sugino et al11,12 demonstrated the regulatory mechanisms involved in the metastasis of VETC-positive HCC, a novel vascular pattern promotes metastasis of HCC in an epithelial-mesenchymal transition-independent manner, which were associated with specific biological activities and levels of gene expression (highly expressed or lowly expressed).10,13 Then, Fang et al also showed that VETC is a predictor of Sorafenib benefit in patients with HCC.14 Although other histopathological markers such as tumor differentiated degree and microvascular invasion of HCC are widely validated and used in clinical practice to predict the prognosis and recurrence,15–17 identification of VETC status could help select HCC patients with poor prognosis, further for the development of anti-metastasis (anti-angiogenesis) therapy or molecularly targeted drugs treatment in the future.
However, VETC is a histologic finding whose diagnosis can only be gotten post-operatively. Accordingly, the preoperative diagnosis of VETC status in patients with HCC is essential to help decide therapeutic strategies. Recently, our group has revealed that qualitative imaging features (non-rim diffuse and heterogeneous arterial phase hyperenhancement) of Gd-EOB-DTPA-enhanced MRI was helpful to predict VETC-positive HCCs.18 Rhee et al19 and Mulé et al20 have also revealed that an arterial phase hypovascular component of Gd-EOB-DTPA-enhanced MRI and substantial necrosis of multiphase contrast-enhanced MRI could help identify macrotrabecular-massive HCC, which have similar pathological figures to partial VETC-positive HCC. Although previous studies have revealed the risk factors, determinations of the imaging characteristics of HCC were usually inconsistent, as qualitative imaging characteristics of MRI were subjective, which were determined by radiologists, who can vary by differences in interpretation, personal preference, and experience level.
Texture analysis recently provides an objective, quantitative assessment of tumor heterogeneity by analyzing the distribution and relationship of pixel or voxel grey levels in the images and could reflect information on the lesion microenvironment.21–23 Accordingly, we speculate it is a promising imaging approach for identifying the VETC-positive HCC.
To our best knowledge, there has been no study applying texture analysis based on GD-EOB-DTPA-enhanced MRI to identify the VETC-positive HCC. This study aimed to investigate potential MRI texture characteristics associated with VETC-positive HCC.
Materials and Methods
Patients
The procedures in this study were compliance with the Declaration of Helsinki. The Institutional Review Board (IRB) of The First Affiliated Hospital of Soochow University reviewed and approved this retrospective study. The informed consent from patient was waived, as patient consent to review their medical records was not required by the IRB. Patients’ privacy was ensured, and the data were anonymized or maintained with confidentiality. From January 2016 to October 2020, patients with a postoperative pathological diagnosis of HCC in our single institution were consecutively enrolled for this study. The inclusion criteria were as follows: (1) have received Gd-EOB-DTPA-enhanced MRI of the liver within one month before surgery; (2) immunochemical staining for a cluster of differentiation 34 (CD34); (3) if multiple lesions were present, we included the largest one with its matched immunohistochemical diagnosis. The exclusion criteria were as follows: (1) received previous treatment, such as anti-tumor therapies, radiofrequency ablation, transcatheter arterial chemoembolization (TACE), and so on. (2) incomplete clinical data; (3) inadequate specimens for histological analysis (necrosis > 90%); (4) images with noticeable artifacts.
Evaluation of VETC
Two experienced pathologists (pathologist #1 and pathologist #2, with more than 15 and 8 years of experience in abdominal pathology, respectively) evaluated all available histological slides independently. Occasional inconsistencies were discussed to reach a consensus. Both of the two pathologists blinded to the clinical, laboratory, and imaging results of the patients.
The VETC was defined as the presence of vessels that formed cobweb–like networks, encapsulated and separated individual tumor clusters with an unequivocal and continuous lining of CD34 positive endothelium.8,10 Referring to previous studies,8–10 we evaluated the VETC index from 0% to 100% in 5% of the units in this study, and defined VETC-positive HCC as VETC index ≥ 5% by CD34 immunostaining.
MRI Acquisition Sequence
All MR images were acquired using a 3.0-T MRI scanner (Magnetom Verio; Siemens Healthcare, Erlangen, Germany) with a 16-channel phase-array coil covering the whole liver. The MR acquisition sequence included: 1) three-dimensional volume interpolated breath-hold examination (3D VIBE) T1-weighted in-phase and out-phase axial imaging; 2) a respiration-triggered turbo spin-echo (TSE) T2-weighted fat-saturation (FS) axial and coronal imaging; 3) a free-breathing single-shot echo-planar diffusion-weighted imaging (DWI, b = 50, 800 sec/mm2) axial imaging; 4) The dynamic enhancement was also performed with the 3D VIBE T1-weighted FS sequence axial and coronal imaging. The detailed information of each scan sequence was shown in Table 1.
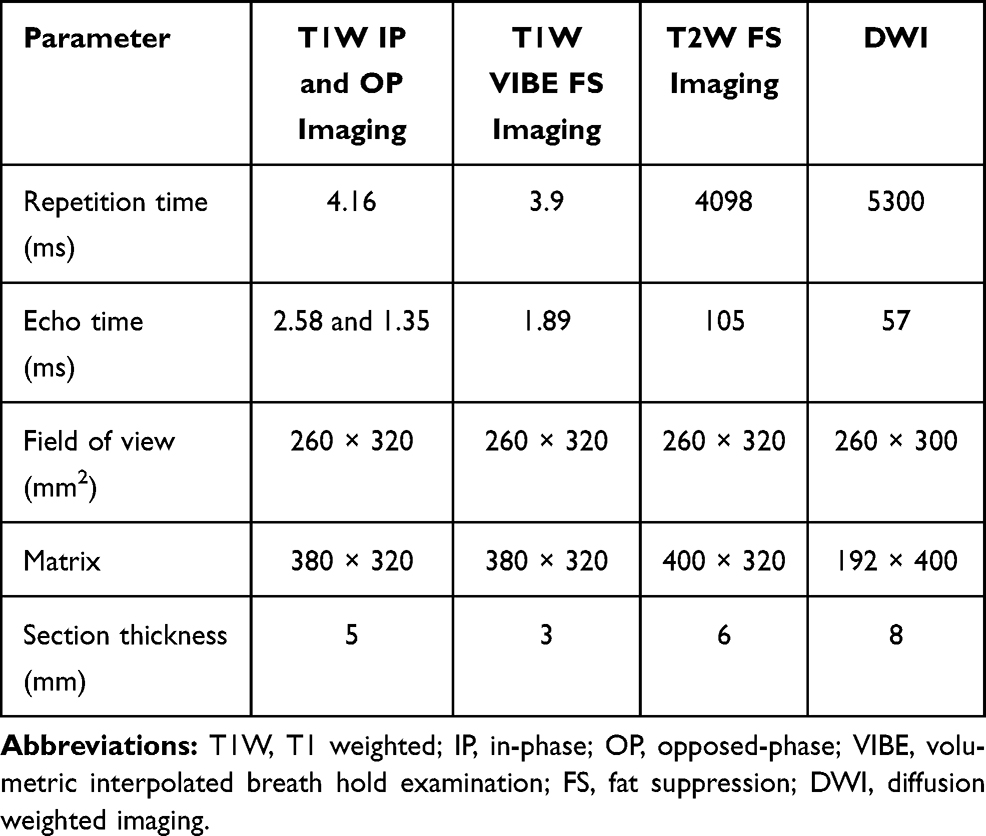 |
Table 1 MRI Scan Sequence and Parameters |
All patients needed a food-fast of more than 6 hours and a water-fast of more than 4 hours before scanning. A dose of 25 μmol per kg of body weight of Gd-EOB–DTPA (Primovist®, Bayer Schering Pharma, AG, Berlin, Germany) was administered bolus rapidly. It was immediately followed by 30 mL saline at a rate of 1 mL/s. The arterial phases (AP), portal venous phases (PVP), and transitional phase (TP) images were obtained during suspended respiration at 30–35 sec, 65–70 sec, and 180–185 sec, respectively. The HBP images were obtained at 20 min after the injection of Gd-EOB-DTPA. We retrieved the AP and HBP images from a picture archiving and communication system (PACS, Neusoft Version 5.5).
MRI Texture Analysis
MRI texture analyses include tumor segmentation, image pre-processing, feature extraction, feature selection, and MRI texture analysis. Radiologists manually segmented tumors on the AP and HBP images with 3D Slicer (http://www.slicer.org).24,25 A three-dimensional (3D) region of interest (ROI) covering the whole tumor was delineated along the edge of tumors. Two radiologists (radiologist #1, 5 years of liver imaging experience; radiologist #2, 8 years of liver imaging experience) were involved in tumor segmentation. To assess inter-observer reproducibility, radiologist #1 and radiologist #2 independently segment 30 randomly chosen patients with HCC. To assess intra-observer reproducibility, radiologists #1 repeated tumor segmentation on the same 30 randomly selected patients once, at another day in one week. The remaining image segmentation was independently completed by radiologist #1.
Image pre-processing was performed using the wavelet and Laplacian of Gaussian (LoG) filters, bin discretization referring to image biomarker standardization initiative (IBIS).26 Features were extracted from each 3D ROI using the Slicer Radiomics extension incorporating the pyradiomics library into 3D Slicer.24 For each unique tumor segmentation, extracted features included first-order statistics, shape and texture features, which were gray level co-occurrence matrix (GLCM), gray level size zone matrix (GLSZM), gray level run length matrix (GLRLM), gray level dependence matrix (GLDM) and neighboring gray tone dependence matrix (NGTDM).
The reproducibility analysis was performed by using the inter-class and intra-class correlation coefficient (ICC). Features with both intra-observer and inter-observer ICC values greater than 0.8 (indicating excellent stability) were selected for subsequent LASSO logistic regression analysis.27 By optimizing the tuning parameter (λ) in LASSO regression with five-fold cross-validation, the features with non-zero coefficients were selected for further MRI texture analysis.28 The flowchart is shown in Figure 1.
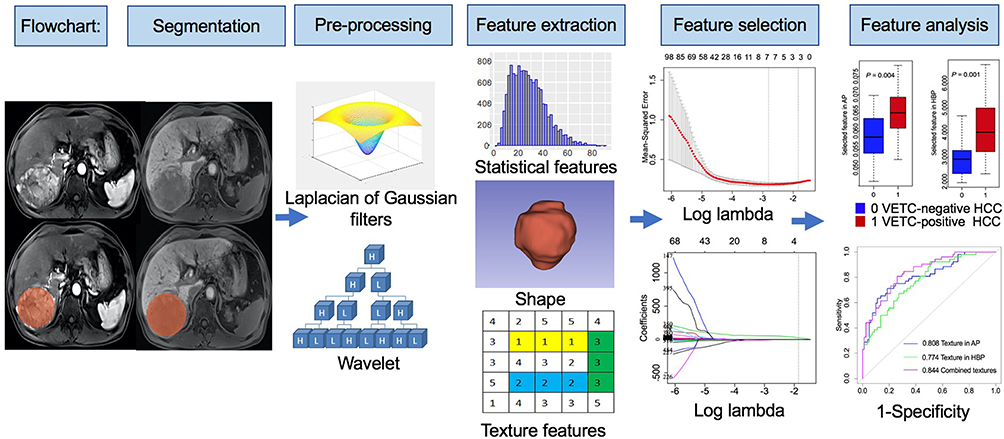 |
Figure 1 Flowchart of texture analysis. |
Statistical Analysis
Continuous variables were compared using the Mann–Whitney U nonparametric rank-sum test. Categorical variables were compared using the  test. Variables significantly associated with VETC-positive HCC by univariate analysis were considered as candidates for backward stepwise multivariate analysis. The backward stepwise selection with Akaike’s information criterion (AIC) as the stopping rule was applied to perform multivariate logistical analysis. The Hosmer–Lemeshow test was conducted to explain the goodness of fit of the multivariate logistic model. ROC analysis of the significant findings was performed to evaluate their identified performance; AUC, sensitivity, specificity, positive likelihood ratio, and negative likelihood ratio with 95% confidence intervals were calculated. AUC values were compared using the DeLong test. All tests were two-sided, and P < 0.05 was considered significant.
Statistical analysis was performed using the R software (version 3.6.3, R Project for Statistical Computing, http://www.r-project.org). LASSO and multivariable logistic regression analyses were performed using the “glmnet” and “rms” packages. ROC analysis and DeLong test were performed using the “reportROC” and “pROC” packages. The Hosmer–Lemeshow test was conducted with the “generalhoslem” package.
Results
Baseline Characteristics of Patients
Overall, 133 patients (108 men and 25 women; median age 60 years, range 30–86 years) were included in this study, 81 patients with VETC-negative HCCs and 52 patients with VETC-positive HCCs. The baseline characteristics of 133 patients are shown in Table 2. The higher serum AFP (> 400 U/L) and AST (>40 U/L) levels were more frequently observed in the VETC-positive group than that in the VETC-negative HCC group (P = 0.026 vs P = 0.003) (Tables 2 and 3). In VETC-positive HCC group, the median (IQR) of tumor maximum diameter was 6.210 (4.102, 9.644) cm; in VETC-negative HCC group, the median (IQR) of tumor maximum diameter was 3.143 (2.139, 4.504) cm (P < 0.001). The greater maximum diameter (>5 cm) of HCC was more frequently observed in the VETC-positive group than that in the VETC-negative HCC group (P < 0.001) (Tables 2 and 3). There were no significant differences in the gender, age, history of hepatitis, cirrhosis, serum GGT levels, and multiplicity between the VETC-positive group and VETC-negative group (all P > 0.05) (Table 2).
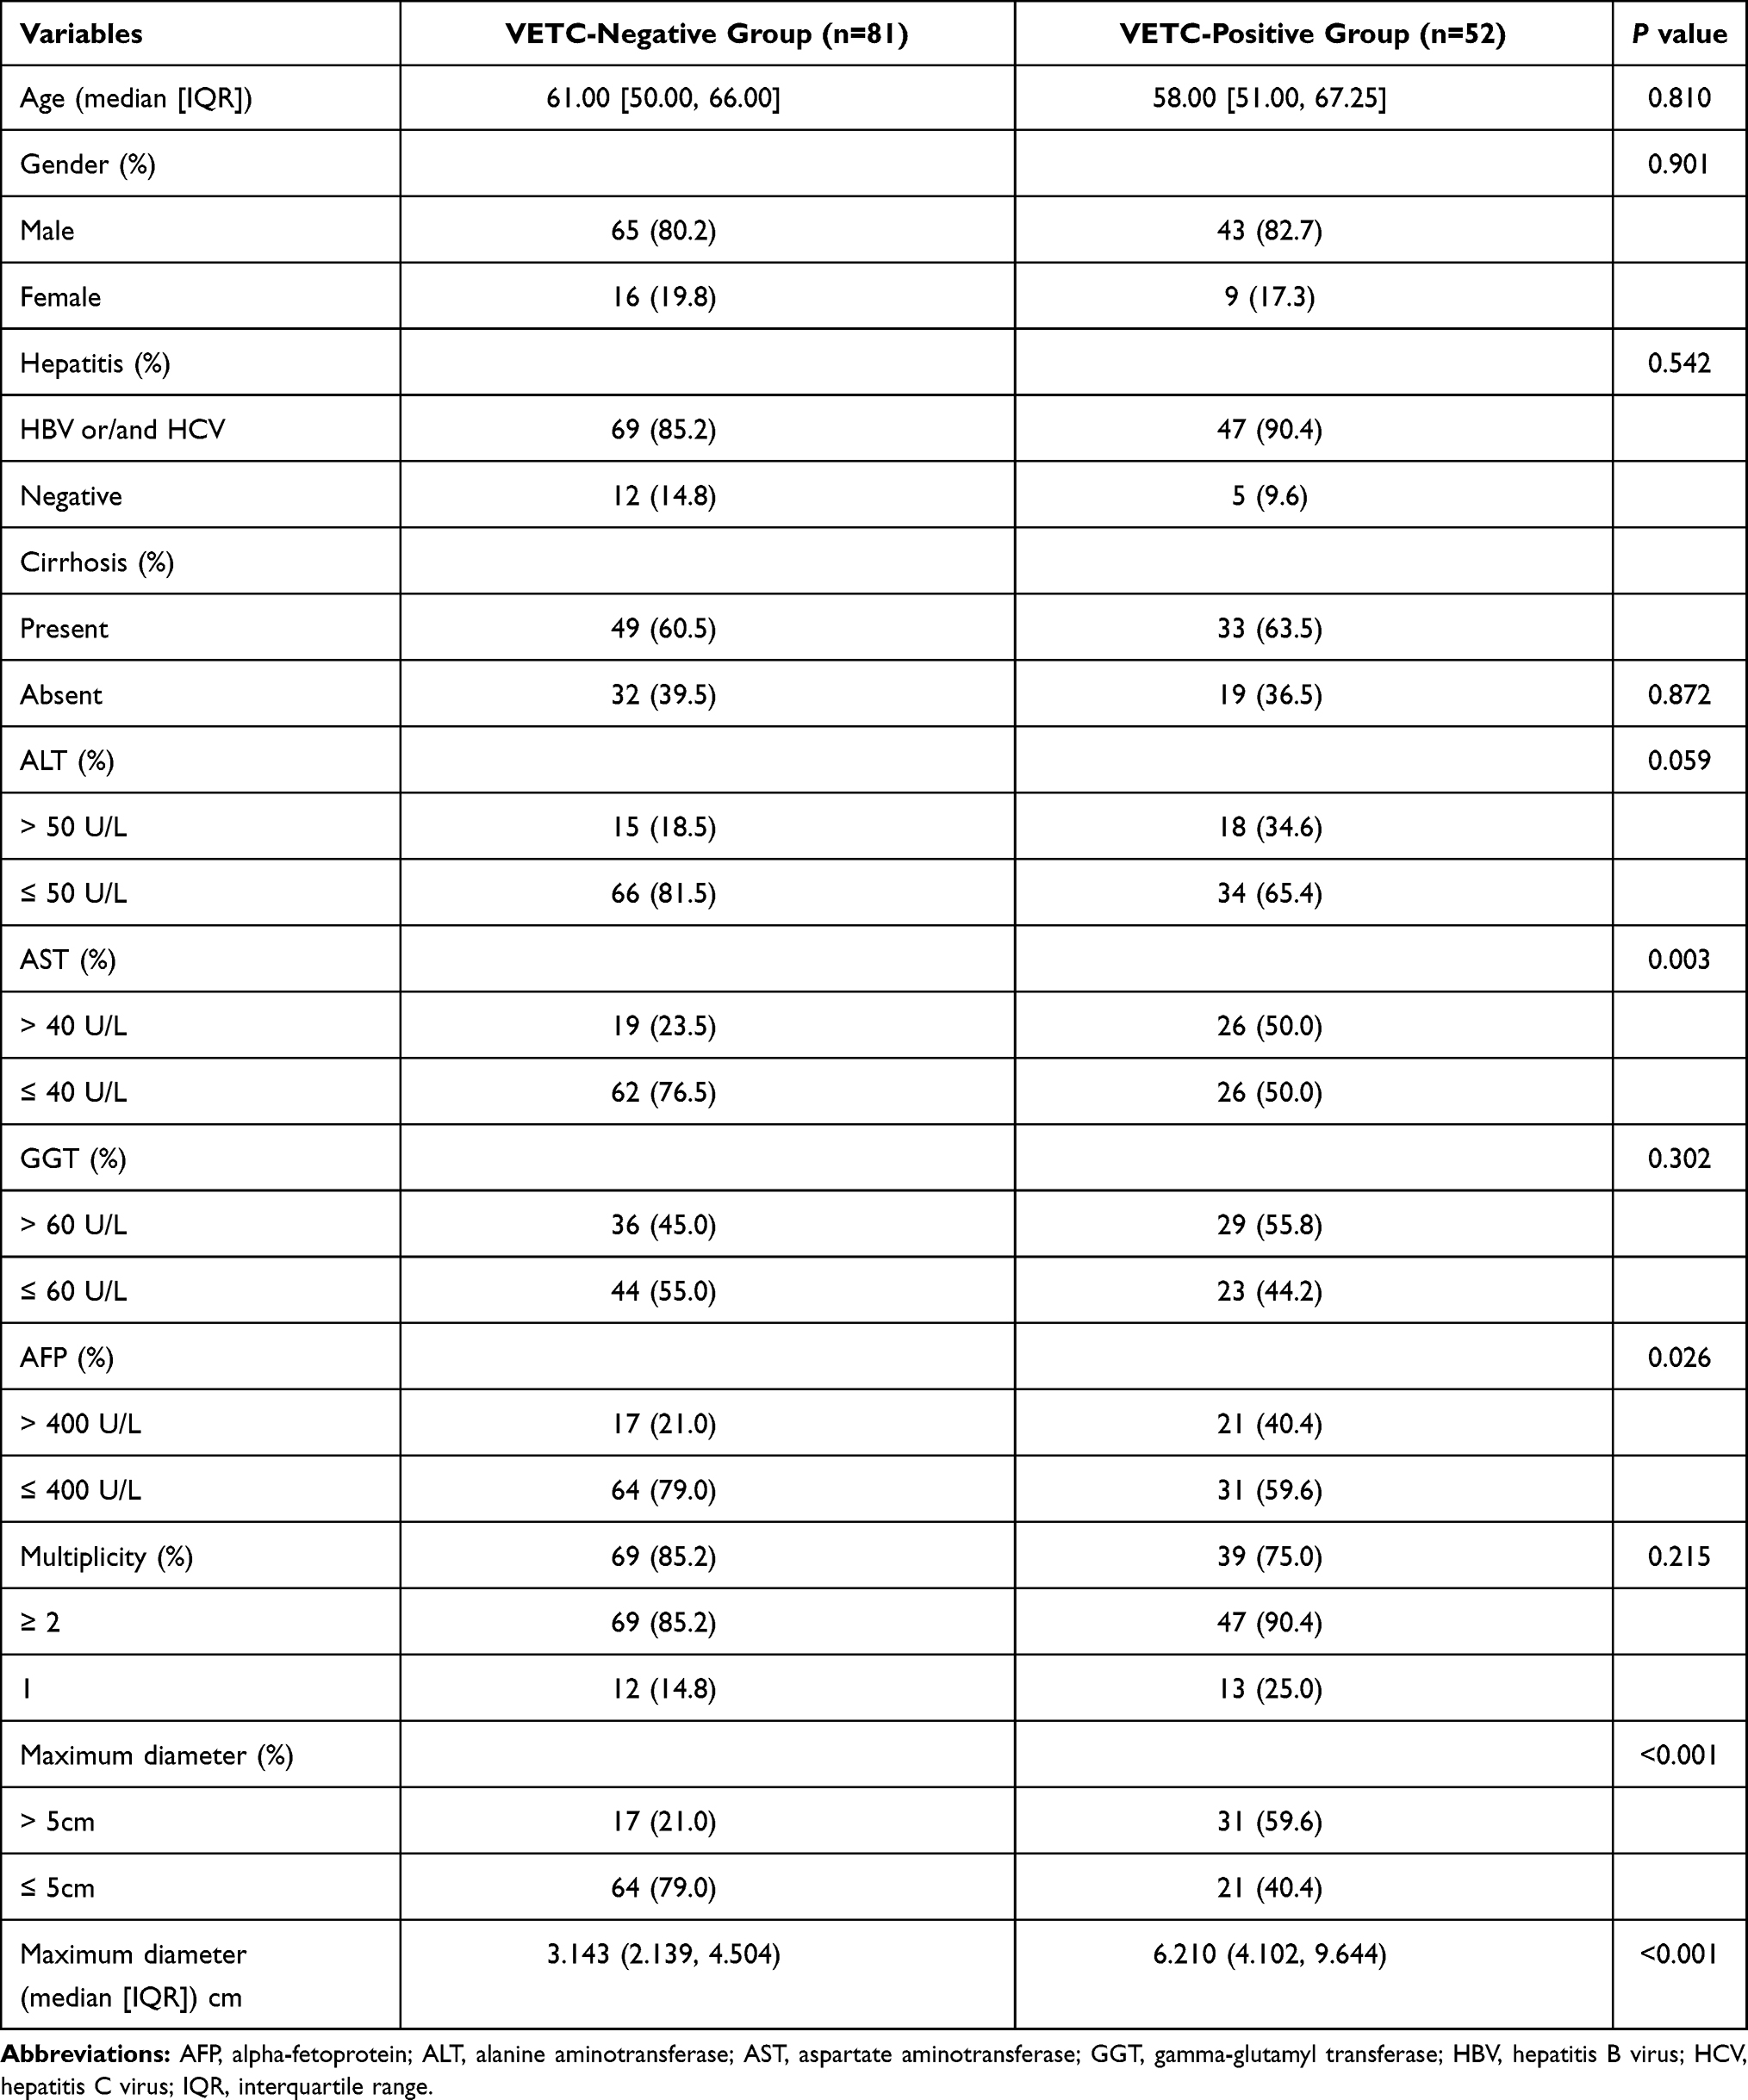 |
Table 2 Clinical Characteristics of Patients with VETC-Positive HCC and VETC-Negative HCC |
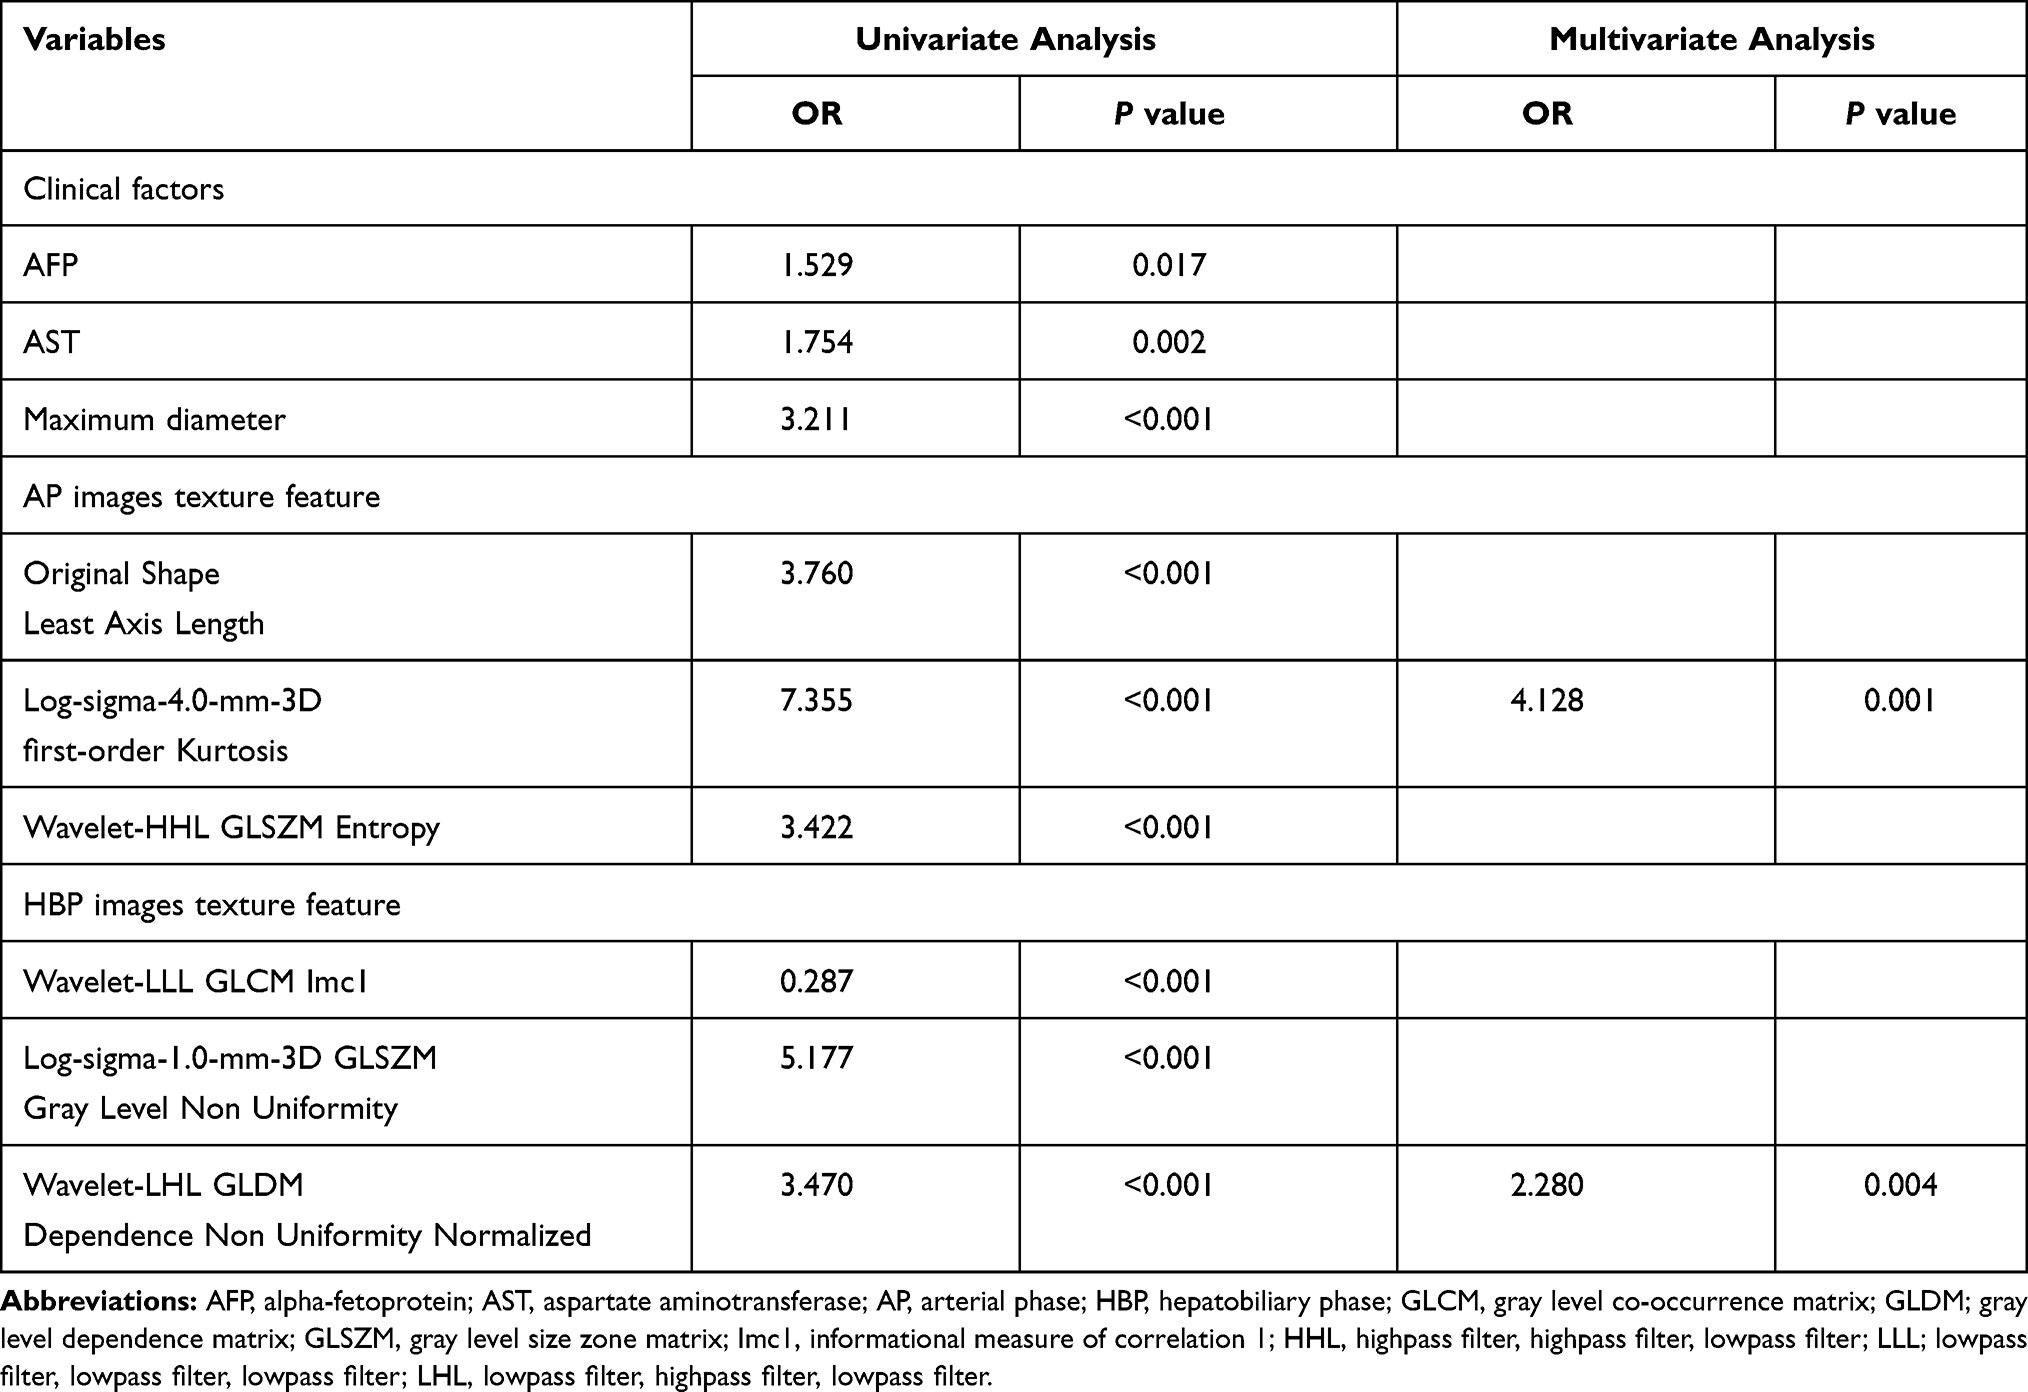 |
Table 3 Univariate and Multivariate Analyses in Identifying VETC-Positive HCC |
Reproducibility and Texture Selection
A total of 1316 features were extracted from the AP and HBP images, respectively. For AP images texture analysis, there were 555 features with the inter-observer ICC value ≥ 0.8 and 534 features with the intra-observer ICC value ≥ 0.8; for HBP images texture analysis, there were 600 features with the inter-observer ICC value ≥ 0.8 and 613 features with the inter-observer ICC value ≥ 0.8. Finally, 486 and 512 features in AP and HBP images with both inter-observer ICC and intra-observer ICC values greater than 0.8 were selected for subsequent LASSO analysis. In the 133 patients, the further LASSO analysis selected the 3 most useful features based on Gd-EOB-DTPA-enhanced MRI in the AP and HBP images, respectively.
MRI Texture Analysis
For the selected the 3 most useful features in the AP and HBP images, respectively, there was a statistically significant difference in the values of the 6 selected features by univariate analysis (Table 3). Variables significantly associated with VETC-positive HCC by univariate analysis, including clinical factors and texture features, were considered as candidates for backward stepwise multivariate analysis. In multivariate analysis, the Log-sigma-4.0-mm-3D first-order Kurtosis derived from AP images (odds ratio [OR] = 4.128, P = 0.001) and the Wavelet-LHL-GLDM Dependence Non Uniformity Normalized derived from HBP images (OR = 2.280, P = 0.004) were independent significant variables associated with VETC-positive HCC (Table 3), though the univariate analysis revealed that serum AFP level, serum AST level, and maximum diameter were associated with the VETC-positive HCC. Hosmer–Lemeshow test (Hosmer–Lemeshow Wald chi-square = 1.045, df = 3, P = 0.790) showed the goodness of fit for the combined two features to identify VETC-positive/negative HCC.
The identified performance of these two selected texture features in multivariate analysis and the combination of the two features for identifying VETC-positive/negative HCC was shown in Table 4 and Figure 2. The combination of the two texture features had an AUC value of 0.844 (95% CI, 0.777, 0.910) with a sensitivity of 80.8%, a specificity of 74.1%, and an accuracy of 76.7% (Table 4). There was no statistically significant difference in AUC values (AUC = 0.808, 0.774) between the Log-sigma-4.0-mm-3D first-order Kurtosis derived from AP images and the Wavelet-LHL-GLDM Dependence Non Uniformity Normalized derived from HBP images (z = 0.723, P = 0.470) (Table 5). The combination of the two texture features showed a better identified performance than the Wavelet-LHL-GLDM Dependence Non Uniformity Normalized derived from HBP image (z = −2.406, P = 0.016), while no significantly better than the Log-sigma-4.0-mm-3D first-order Kurtosis derived from AP image only (z = −1.523, P = 0.128) (Table 5). The optimal cut-off values for sensitivity and specificity in predicting VETC-positive HCC were 3.415 for The Log-sigma-4.0-mm-3D first-order Kurtosis derived from AP images, 0.058 for the Wavelet-LHL-GLDM Dependence Non Uniformity Normalized derived from HBP images (Table 5). The representative examples to identify VETC-positive/negative HCC by texture analysis of Gd-EOB-DTPA-enhanced MRI were shown in Figures 3 and 4.
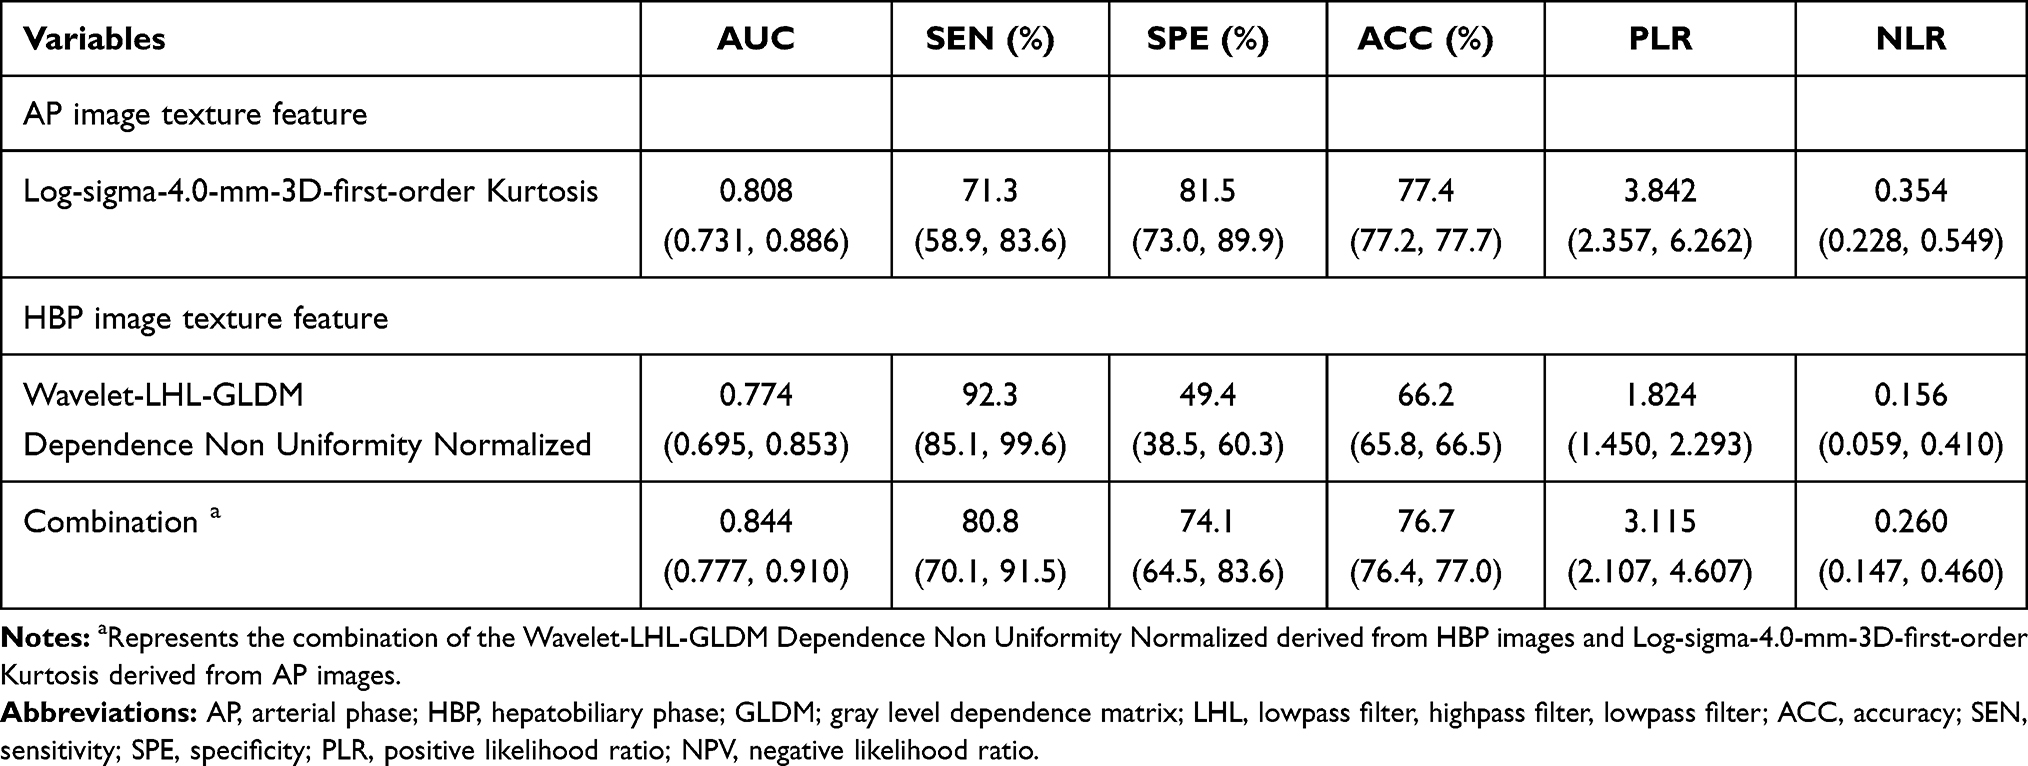 |
Table 4 Identified Performances of the Two Significant Variables and Combination for Predicting VETC-Positive HCC |
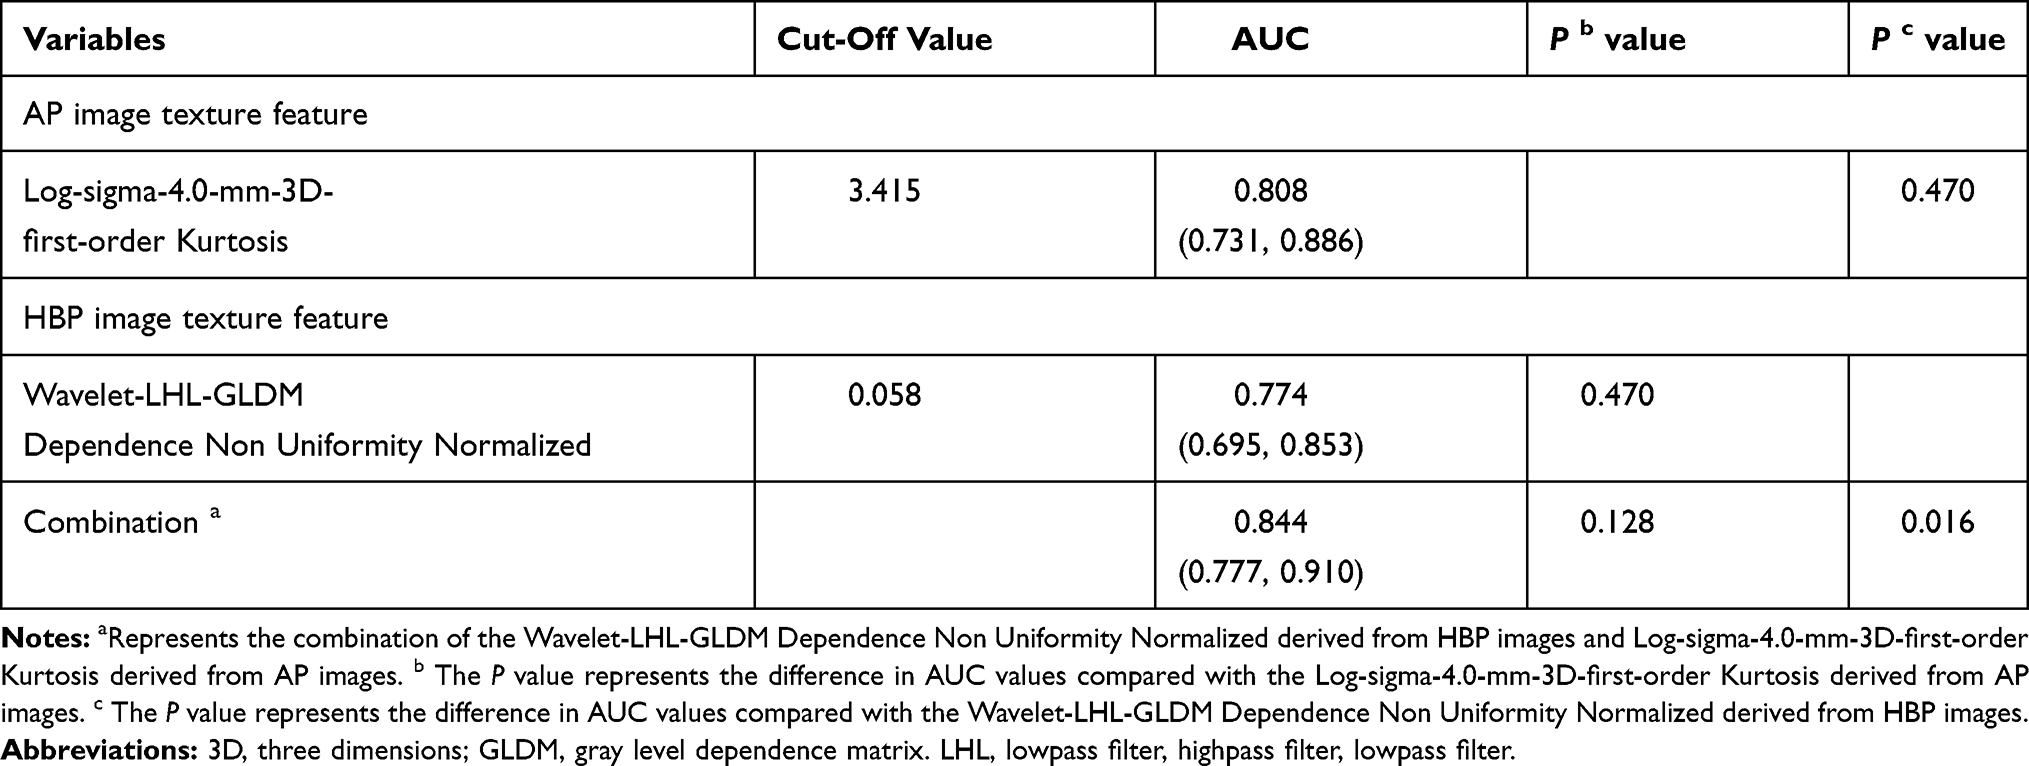 |
Table 5 Comparison of the Identified Performances of Significant Variables |
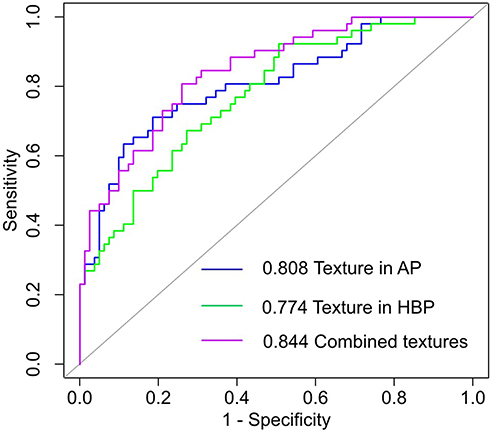 |
Figure 2 ROC for the two significant variables and the combination. Combined features represent the combination of the Log-sigma-4.0-mm-3D first-order Kurtosis derived from AP image and Wavelet-LHL-GLDM Dependence Non Uniformity Normalized derived from HBP images. Texture in AP represents the Log-sigma-4.0-mm-3D first-order Kurtosis derived from AP images. Texture in HBP represents the Wavelet-LHL-GLDM Dependence Non Uniformity Normalized derived from HBP images. Notes: AP, arterial phase; HBP, hepatobiliary phase; LHL, lowpass filter, highpass filter, lowpass filter; GLDM, gray level dependence matrix. |
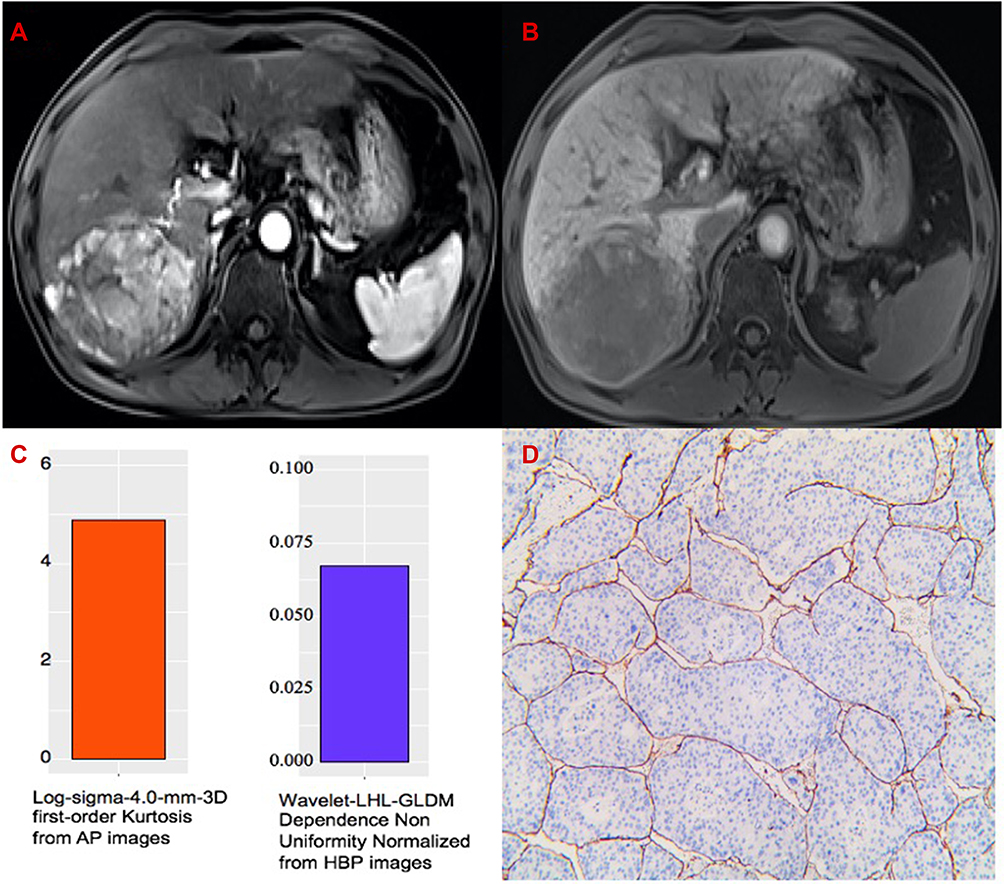 |
Figure 3 The representative example to identify VETC-positive HCC by texture analysis of Gd-EOB-DTPA-enhanced MRI. (A) AP image. (B) HBP image. (C) The values of 4.898 and 0.067 of the two textures are greater than their cut-off values. (D) Immunohistochemical staining for CD34 (original magnifications x 100). VETC-positive HCC shows clusters of tumor cells bordered by a complete rim of CD34-positive endothelial cells in more than 5% of the tumor area. Abbreviations: AP, arterial phase; HBP, hepatobiliary phase; LHL, lowpass filter, highpass filter, lowpass filter; GLDM, gray level dependence matrix. |
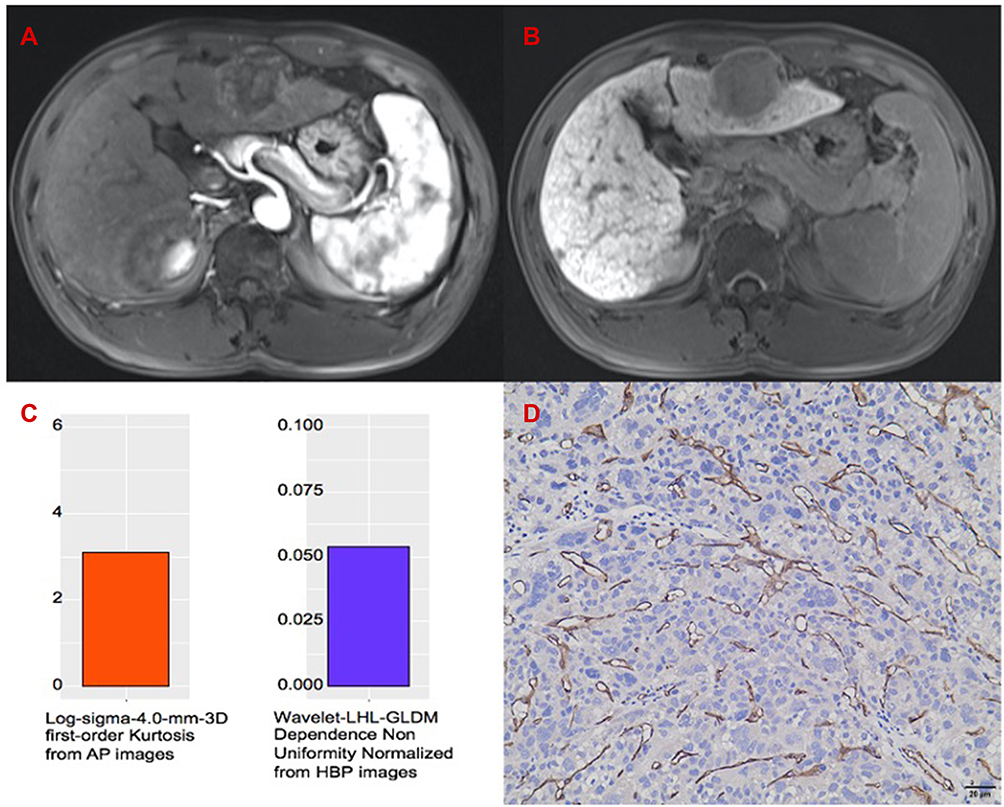 |
Figure 4 The representative example to identify VETC-negative HCC by texture analysis of Gd-EOB-DTPA-enhanced MRI. (A) AP image. (B) HBP image. (C) The values of 3.110 and 0.054 of the two textures are lower than their cut-off values. (D) Immunohistochemical staining for CD34 (Original magnifications x 200). VETC-negative HCC was absent of vessels that formed cobweb-like networks with an unequivocal and continuous lining of CD34 positive endothelium. Abbreviations: AP, arterial phase; HBP, hepatobiliary phase; LHL, lowpass filter, highpass filter, lowpass filter; GLDM, gray level dependence matrix. |
Discussion
The VETC, a histological vascular pattern, has been identified as a predictor of micro-metastasis,9 aggressive and poorer prognosis in HCC.9,14 Our study demonstrated that texture analysis based on Gd-EOB-DTPA-enhanced MRI was superior to clinical factors for the identification of VETC status of HCC. The Log-sigma-4.0-mm-3D first-order Kurtosis derived from AP image and Wavelet-LHL-GLDM Dependence Non Uniformity Normalized derived from HBP images were independent variables for identifying VETC-positive HCC. The combination of the two texture features achieved good identified performance with an AUC value of 0.844 (95% CI, 0.777–0.910). Additionally, the Log-sigma-4.0-mm-3D first-order Kurtosis derived from AP images showed comparable diagnostic performance with an AUC value of 0.808 (95% CI, 0.731, 0.886). These findings suggest that texture features based on Gd-EOB-DTPA-enhanced MRI can reflect the complex internal structure of VETC-positive/negative HCC.
In our study, we selected AP and HBP images based on Gd-EOB-DTPA-enhanced MRI because AP is characterized by lesion enhancement mediated by vascular changes in HCC and HBP by hepatocyte uptake of contrast agent. According to the definitions of the features derived from the pyradiomics library and the IBSI,26,29 the first-order Kurtosis is a measure of the ‘peakedness’ of the distribution of values in the image ROI. A higher kurtosis reflects that the mass of the distribution is concentrated towards the tail(s) rather than towards the mean; the GLDM Dependence Non Uniformity Normalized measures the similarity of dependence throughout the image, with a higher value indicating more heterogeneity among dependencies in the image. Our results showed that VETC-positive HCCs had higher values of Kurtosis and Dependence Non Uniformity Normalized than VETC-negative HCCs, which was related to pathological characteristics of VETC-positive/negative HCCs. Our results were also consistent with previous studies in which VETC has been identified as a vascular pattern composed of functional vessels with blood perfusion, and an arterial phase hypovascular component and substantial necrosis presented on MRI were associated with macrotrabecular-massive HCC, which have similar pathological figures to partial VETC-positive HCC.8,19,20 Accordingly, the pixel intensities of ROI indicated by Kurtosis was higher in VETC-positive HCCs than VETC-positive HCCs. Additionally, VETC-positive HCCs had more diverse vascular patterns, including VETC, sinusoidal capillarization/incomplete angiogenesis,30 and other neovascularization patterns, which may result in additional heterogeneity of the texture compared with VETC-negative HCCs. Conventional lesion intensity and heterogeneity were judged by a subjective assessment of radiologists, which could vary depending on individual experience level and personal preference; however, texture analysis allowed an objective assessment of lesion intensity and heterogeneity. Indeed, our group has revealed that the AUC values of textures derived from AP and HBP images were significantly higher than that of qualitative characteristics and semi-quantitative characteristics (ratio of tumor to liver signal intensity) in AP and HBP images respectively, compared with our previous study.18
Our study has several limitations. First, selection bias was inevitable because of the retrospective design. Second, we defined “VETC ≥ 5%” as the VETC-positive group in this study, referring to previous studies.8–10 However, the optimal cut-off value of VETC status is not yet standardized in patients with HCC, as the VETC is a novel vascular pattern, which has not been widely investigated. Third, we only used AP and HBP images of Gd-EOB-DTPA-enhanced MRI in this study; thus, the comparison with pre-contrast, T2W, PVP, and TP images was lacking. Fourth, this study was conducted in a single institution, findings of which have not been validated by external data. Then, multicenter and prospective studies are needed to validate the texture analysis of VETC-positive/negative HCCs as a clinical tool.
Conclusions
The Log-sigma-4.0-mm-3D first-order Kurtosis derived from AP images and the Wavelet-LHL-GLDM Dependence Non Uniformity Normalized derived from HBP image can reflect the complex internal structure of VETC-positive/negative HCC and help identify VETC-positive HCC. Then, pretreatment identifying VETC status could help select HCC patients with poor prognosis, early recurrence, and Sorafenib benefit. Therefore, it can provide valuable information for determining treatment decision-making.
Abbreviations
AP, Arterial phase; HBP, hepatobiliary phase; GLCM, gray level co-occurrence matrix; GLDM; gray level dependence matrix; GLRLM, gray level run length matrix; GLSZM, gray level size zone matrix; NGTDM, neighboring gray tone dependence matrix.
Data Sharing Statement
The datasets used or analyzed during the current study available from the corresponding author on reasonable request.
Consent for Publication
Not applicable.
Ethics Approval and Informed Consent
The Institutional Review Board (IRB) at the First Affiliated Hospital of Soochow University approved this retrospective study. The informed consent from patient was waived because of the retrospective nature of the study.
Author Contributions
All authors made a significant contribution to the work reported, whether that is in the conception, study design, execution, acquisition of data, analysis and interpretation, or in all these areas; took part in drafting, revising or critically reviewing the article; gave final approval of the version to be published; have agreed on the journal to which the article has been submitted; and agree to be accountable for all aspects of the work.
Funding
This work has been supported by the National Natural Science Foundation of China (81801692), Suzhou Municipal Science and Technology Bureau (SYS2020125, SS201808) and National Key Research and Development Program of China (2017YFC0114300).
Disclosure
The authors declare that they have no competing interests.
References
1. Bray F, Ferlay J, Soerjomataram I, et al. Global cancer statistics 2018: GLOBOCAN estimates of incidence and mortality worldwide for 36 cancers in 185 countries. CA Cancer J Clin. 2018;68:394–424.
2. Llovet JM, Montal R, Sia D, Finn RS. Molecular therapies and precision medicine for hepatocellular carcinoma. Nat Rev Clin Oncol. 2018;15:599–616.
3. Galle PR, Forner A, Llovet JM, et al. EASL clinical practice guidelines: management of hepatocellular carcinoma (vol 69, pg 182, 2018). J Hepatol. 2019;70:817.
4. Marrero JA, Kulik LM, Sirlin CB, et al. Diagnosis, staging, and management of hepatocellular carcinoma: 2018 practice guidance by the American association for the study of liver diseases. Hepatology. 2018;68:723–750.
5. Yang JD, Heimbach JK. New advances in the diagnosis and management of hepatocellular carcinoma. BMJ. 2020;371:m3544.
6. Tabrizian P, Jibara G, Shrager B, et al. Recurrence of hepatocellular cancer after resection patterns, treatments, and prognosis. Ann Surg. 2015;261:947–955.
7. Roayaie S, Obeidat K, Sposito C, et al. Resection of hepatocellular cancer ≤2 cm: results from two Western centers. Hepatology. 2013;57:1426–1435.
8. Fang J-H, Zhou H-C, Zhang C, et al. A novel vascular pattern promotes metastasis of hepatocellular carcinoma in an epithelial-mesenchymal transition-independent manner. Hepatology. 2015;62:452–465.
9. Ding T, Xu J, Zhang Y, et al. Endothelium-coated tumor clusters are associated with poor prognosis and micrometastasis of hepatocellular carcinoma after resection. Cancer. 2011;117:4878–4889.
10. Renne SL, Woo HY, Allegra S, et al. Vessels Encapsulating Tumor Clusters (VETC) . is a powerful predictor of aggressive hepatocellular carcinomaHepatology. 2020;71:183–195.
11. Sugino T, Yamaguchi T, Ogura G, et al. Morphological evidence for an invasion-independent metastasis pathway exists in multiple human cancers. BMC Med. 2004;2.
12. Sugino T, Yamaguchi T, Hoshi N, et al. Sinusoidal tumor angiogenesis is a key component in hepatocellular carcinoma metastasis. Clin Exp Metastasis. 2008;25:835–841.
13. Zhou HC, Fang JH, Shang LR, et al. MicroRNAs miR-125b and miR-100 suppress metastasis of hepatocellular carcinoma by disrupting the formation of vessels that encapsulate tumour clusters. J Pathol. 2016;240:450–460.
14. Fang J-H, Xu L, Shang L-R, et al. Vessels that Encapsulate Tumor Clusters (VETC) pattern is a predictor of sorafenib benefit in patients with hepatocellular carcinoma. Hepatology. 2019;70:824–839.
15. Zhou L, Rui JA, Zhou WX, et al. Edmondson-Steiner grade: a crucial predictor of recurrence and survival in hepatocellular carcinoma without microvascular invasio. Pathol Res Pract. 2017;213:824–830.
16. Xu X, Zhang H-L, Liu Q-P, et al. Radiomic analysis of contrast-enhanced CT predicts microvascular invasion and outcome in hepatocellular carcinoma. J Hepatol. 2019;70:1133–1144.
17. Lim KC, Chow PK, Allen JC, et al. Microvascular invasion is a better predictor of tumor recurrence and overall survival following surgical resection for hepatocellular carcinoma compared to the Milan criteria. Ann Surg. 2011;254:108–113.
18. Fan Y, Yu Y, Hu M, et al. Imaging features based on Gd-EOB-DTPA-enhanced MRI for predicting vessels encapsulating tumor clusters (VETC) in patients with hepatocellular carcinoma. Br J Radiol. 2021;94:20200950.
19. Rhee H, Cho ES, Nahm JH, et al. Gadoxetic acid-enhanced MRI of macrotrabecular-massive hepatocellular carcinoma and its prognostic implications. J Hepatol. 2021;74:109–121.
20. Mulé S, Galletto Pregliasco A, Tenenhaus A, et al. Multiphase liver MRI for identifying the macrotrabecular-massive subtype of Hepatocellular carcinoma. Radiology. 2020;295:562–571.
21. Wang HQ, Yang C, Zeng MS, et al. Magnetic resonance texture analysis for the identification of cytokeratin 19-positive hepatocellular carcinoma. Eur J Radiol. 2019;117:164–170.
22. Tabari A, Torriani M, Miller KK, et al. Anorexia nervosa: analysis of trabecular texture with CT. Radiology. 2017;283:178–185.
23. Önner H, Abdülrezzak Ü, Tutuş A. Could the skewness and kurtosis texture parameters of lesions obtained from pretreatment Ga-68 DOTA-TATE PET/CT images predict receptor radionuclide therapy response in patients with gastroenteropancreatic neuroendocrine tumors? Nucl Med Commun. 2020;41:1034–1039.
24. van Griethuysen JJM, Fedorov A, Parmar C, et al. Computational radiomics system to decode the radiographic phenotype. Cancer Res. 2017;77:e104–e107.
25. Schwier M, van Griethuysen J, Vangel MG, et al. Repeatability of multiparametric prostate MRI radiomics features. Sci Rep. 2019;9:9441.
26. Zwanenburg A, Vallières M, Abdalah MA, et al. The image biomarker standardization initiative: standardized quantitative radiomics for high-throughput image-based phenotyping. Radiology. 2020;295:328–338.
27. Wang W, Gu D, Wei J, et al. A radiomics-based biomarker for cytokeratin 19 status of hepatocellular carcinoma with gadoxetic acid-enhanced MRI. Eur Radiol. 2020;30:3004–3014.
28. Vasquez MM, Hu C, Roe DJ, et al. Least absolute shrinkage and selection operator type methods for the identification of serum biomarkers of overweight and obesity: simulation and application. BMC Med Res Methodol. 2016;16.
29. Pyradiomics. Radiomics features. Available from: https://pyradiomics.readthedocs.io/en/lastest/feature.html.
30. Sciarra A, Di Tommaso L, Nakano M, et al. Morphophenotypic changes in human multistep hepatocarcinogenesis with translational implications. J Hepatol. 2016;64:87–93.
 © 2021 The Author(s). This work is published and licensed by Dove Medical Press Limited. The
full terms of this license are available at https://www.dovepress.com/terms
and incorporate the Creative Commons Attribution
- Non Commercial (unported, 3.0) License.
By accessing the work you hereby accept the Terms. Non-commercial uses of the work are permitted
without any further permission from Dove Medical Press Limited, provided the work is properly
attributed. For permission for commercial use of this work, please see paragraphs 4.2 and 5 of our Terms.
© 2021 The Author(s). This work is published and licensed by Dove Medical Press Limited. The
full terms of this license are available at https://www.dovepress.com/terms
and incorporate the Creative Commons Attribution
- Non Commercial (unported, 3.0) License.
By accessing the work you hereby accept the Terms. Non-commercial uses of the work are permitted
without any further permission from Dove Medical Press Limited, provided the work is properly
attributed. For permission for commercial use of this work, please see paragraphs 4.2 and 5 of our Terms.