")
Back to Journals » Risk Management and Healthcare Policy » Volume 14
Temporal and Spatial Characteristics of Cataract Surgery Rates in China
Authors Wu X, Shi X, Li H , Guo Z
Received 26 April 2021
Accepted for publication 5 August 2021
Published 25 August 2021 Volume 2021:14 Pages 3551—3561
DOI https://doi.org/10.2147/RMHP.S317547
Checked for plagiarism Yes
Review by Single anonymous peer review
Peer reviewer comments 2
Editor who approved publication: Dr Jongwha Chang
Xiaoming Wu, 1, 2 Xiujing Shi, 1, 2 Honglei Li, 1, 2 Zhen Guo 1, 2
1Qingdao Eye Hospital of Shandong First Medical University, Qingdao, People’s Republic of China; 2State Key Laboratory Cultivation Base, Shandong Provincial Key Laboratory of Ophthalmology, Shandong Eye Institute, Shandong First Medical University & Shandong Academy of Medical Sciences, Qingdao, People’s Republic of China
Correspondence: Zhen Guo
State Key Laboratory Cultivation Base, Shandong Provincial Key Laboratory of Ophthalmology, Shandong Eye Institute, Shandong First Medical University & Shandong Academy of Medical Sciences, 5 Yanerdao Road, Qingdao, 26600, People’s Republic of China
Email [email protected]
Objective: The aim of the current study was to explore the spatial and temporal distribution characteristics of registered cases of cataract surgery in China from 2013 to 2017.
Methods: A database for spatial analysis of cataract surgery in China in 2013– 2017 was established using ArcGIS10.0 software as a platform for data management and presentation. Spatial autocorrelation analysis of cataract surgery was undertaken, and temporal and spatial scan analysis was done using SaTScan 9.5 software.
Results: From 2013 to 2017, annual cataract surgery rates (CSRs) in China were 1200, 1400, 1782, 2070, and 2205 per 1 million population, indicating a gradually increasing trend. Local Moran’s I autocorrelation analysis showed that there was spatial clustering of CSR in China, with Anhui being a low-high clustering region. Findings of global hotspot analysis Getis-Ord General G showed that General G index of national CSR was < 0.01, Z = 1.12, P = 0.26. Findings of staged spatial-temporal scan analysis indicated that 18 areas of aggregation were found in 2 stages. Observed differences in each clustering area were statistically significant (P < 0.05).
Conclusion: CSRs in China showed increasing trend year by year and were randomly distributed, with spatial clustering, and Anhui was reported as a low-high clustering region. However, high-risk areas still persist, requiring focused attention and targeted prevention and control measures.
Keywords: cataract surgery, geographic information system, spatial autocorrelation analysis, spatiotemporal analysis
Introduction
Cataract is the leading cause of blindness, and CSR (the number of cataract surgeries performed annually per million population) is used as a proxy indicator of access to cataract services in a country.1,2 Global data published by the World Health Organization (WHO) estimated that of the estimated 76 million people with visual impairment in China, 36.5% of the cases are believed to be attributed to cataract.3
China is still among 30 countries with a high burden of cataract surgery worldwide, with new cataracts being diagnosed yearly.2 Incidence of cataract is related to the geographical, economic, and demographic environment of the region where it is located.1,4 CSR varies greatly from country to country, and even within countries.5,6 Therefore, exploration of spatial distribution characteristics and prevalence trends of cataract surgery is important to prevent cataract blindness in China.
Geographic Information System (GIS) is a technical system based on geospatial database and supported by computer hardware and software systems to collect, store, manage, compute, analyze, display, and describe relevant geographical distribution of data in space.7 Use of GIS enables convenient description and analysis of spatial and temporal distribution patterns of population diseases, health, and health events.8 In addition, GIS enables exploration of factors affecting health status of specific populations, which helps in disease prevention and control, health promotion, and health services.9,10
In the current study, the spatial distribution and clustering of cataract surgery registrations at provincial level in China from 2013 to 2017 were analyzed using GIS technology as well as spatial and temporal scanning analyses. This provided the basis for further studies of treatment and prevention of cataract blindness as well as formulation of optimization strategies.
Methods
Source of Information
The national cataract surgery registration report of 2013–2017 was obtained from the China network of National Blindness Prevention and Treatment (http://www.moheyes.com/), which collected statistical data from the Cataract Revision Surgery Information Reporting System from 2013–2017 and estimated the cataract surgery rate (CSR) per 1 million population in each province (municipality directly under central government and autonomous region). Permission to conduct the current study was obtained from the China network of National Blindness Prevention and Treatment. The national provincial vector map (1:1.6 million) was used as base map, and the same number was created for each province (municipality and autonomous region) in the layer by referring to the number in attribute database. Collated CSRs were correlated and matched with numbers in the base map to create a complete spatial analysis database.
Research Methods
Spatial Autocorrelation Analysis
Global Moran’s I index and local Moran’s I index were used to explore spatial autocorrelation of CSRs in the study area.11 A spatial weight matrix was generated based on geographic proximity of the national provincial administrative divisions using the inverse distance-based spatial conceptualization method. Global Moran’s I index and local Moran’s I index were computed using ArcGIS 10.0 software based on defined weight matrix.12 When the correlation is high, that is, the phenomenon of spatial aggregation and distribution is significant; I<0 indicates a negative correlation, with smaller values reflecting weak correlation. When I tend towards 0, spatial distribution shows random distribution. For statistical test of Moran’s I, test statistic Z-values are used to approximate normal distribution under random conditions, with P<0.05 indicating statistically significant differences. Global spatial autocorrelation determined whether research objects showed clustering distribution in general, whereas local spatial autocorrelation described correlation between CSR in each province (municipality directly under central government or autonomous region) and its neighboring provinces (municipality directly under central government or autonomous region). Local spatial autocorrelation also identified specific clustering regions and clustering patterns, in which low-high clustering and low-low clustering were defined as a high-risk area.13
Hotspot Analysis Getis-Ord G
The presence of “positive hotspot” or “negative hotspot” in the whole study area was detected using global G statistic. G>0 and P<0.05 indicated high-value agglomerations in the study area, whereas G<0 and P<0.05 indicated low-value agglomerations in the study area.14 Comparisons of high-value agglomerations or low-value agglomerations between each province (municipality directly under central government or autonomous region) and neighboring provinces (municipality directly under central government or autonomous region) were undertaken using Local G statistic. Z>1.96 indicated existence of high-value agglomerations in and around spatial unit I, whereas Z<-1.96 indicated existence of low-value agglomerations in and around spatial unit I.15
Spatiotemporal Scan Analysis
To accurately describe characteristics of the spatiotemporal agglomeration distribution of the cataract surgery rate on the basis of spatial autocorrelation analysis, year 2016 was considered the starting year of the 13th Five-Year Plan (2016–2020) in China. The period 2013–2017 was divided into two phases: 12th Five-Year Plan (2013–2015) and 13th Five-Year Plan (2016–2017).16 Aggregation analysis was undertaken using SaTScan 9.5 software, whereas visualization of results was undertaken using ArcGIS 10.0 software.17 Furthermore, the spatial distribution of cataract surgery registration rate data from 2013–2017 was visualized in 31 provinces (municipalities and autonomous regions) across China. Natural segmentation desktop window ArcMap of ArcGIS 10.0 software was used to categorize the average annual registration rate of cataract surgery in each province, and rank classification was chosen, with color from light to dark indicating registration rates from low to high. SaTScan 9.5 software is based on statistics of spatially dynamic window scans, and applies several scanning circles to detect spatial clustering of diseases in the study area, where size and position of windows are dynamic. Log likelihood ratio (LLR) of spatial units inside and outside the dynamic window was computed to make statistical inferences. LLRs of scanned circles were ranked from largest to smallest, with larger and statistically significant LLR values indicating that the region contained under the window was the most likely region to be aggregated.18 The first aggregated region had the largest LLR value, and the second aggregated region had smaller LLR value, indicating that it is less likely to be a spatially aggregated region compared with the first aggregated region. Spatiotemporal scan analysis in the current study used Poisson distribution model in the SaTScan 9.5 software. Scan clustering was in the form of high-value clustering, whereas number of Monte Carlo simulation tests was set at 999, and temporal clustering interval was set at 1 year.19
Results
Spatial Distribution of Registered Cases of Cataract Surgery
Findings of the current study showed that the rates of cataract surgery for the five years during 2013–2017 were 1200, 1400, 1782, 2070, and 2205 per 1 million population nationwide (Table 1). Anhui Province, Xinjiang Uygur Autonomous Region, Hubei Province, Ningxia Hui Autonomous Region, and Guangxi Zhuang Autonomous Region had the lowest CSR levels and were ranked in Level 1. Most other provinces (municipalities directly under the Central Government and autonomous regions) had registration levels in Levels 2 to 4, with Shanghai, Tianjin, Beijing, Jiangsu Province, Tibet Autonomous Region, Chongqing, and Sichuan Province having the highest CSR levels and ranking in Level 5 (Figure 1).
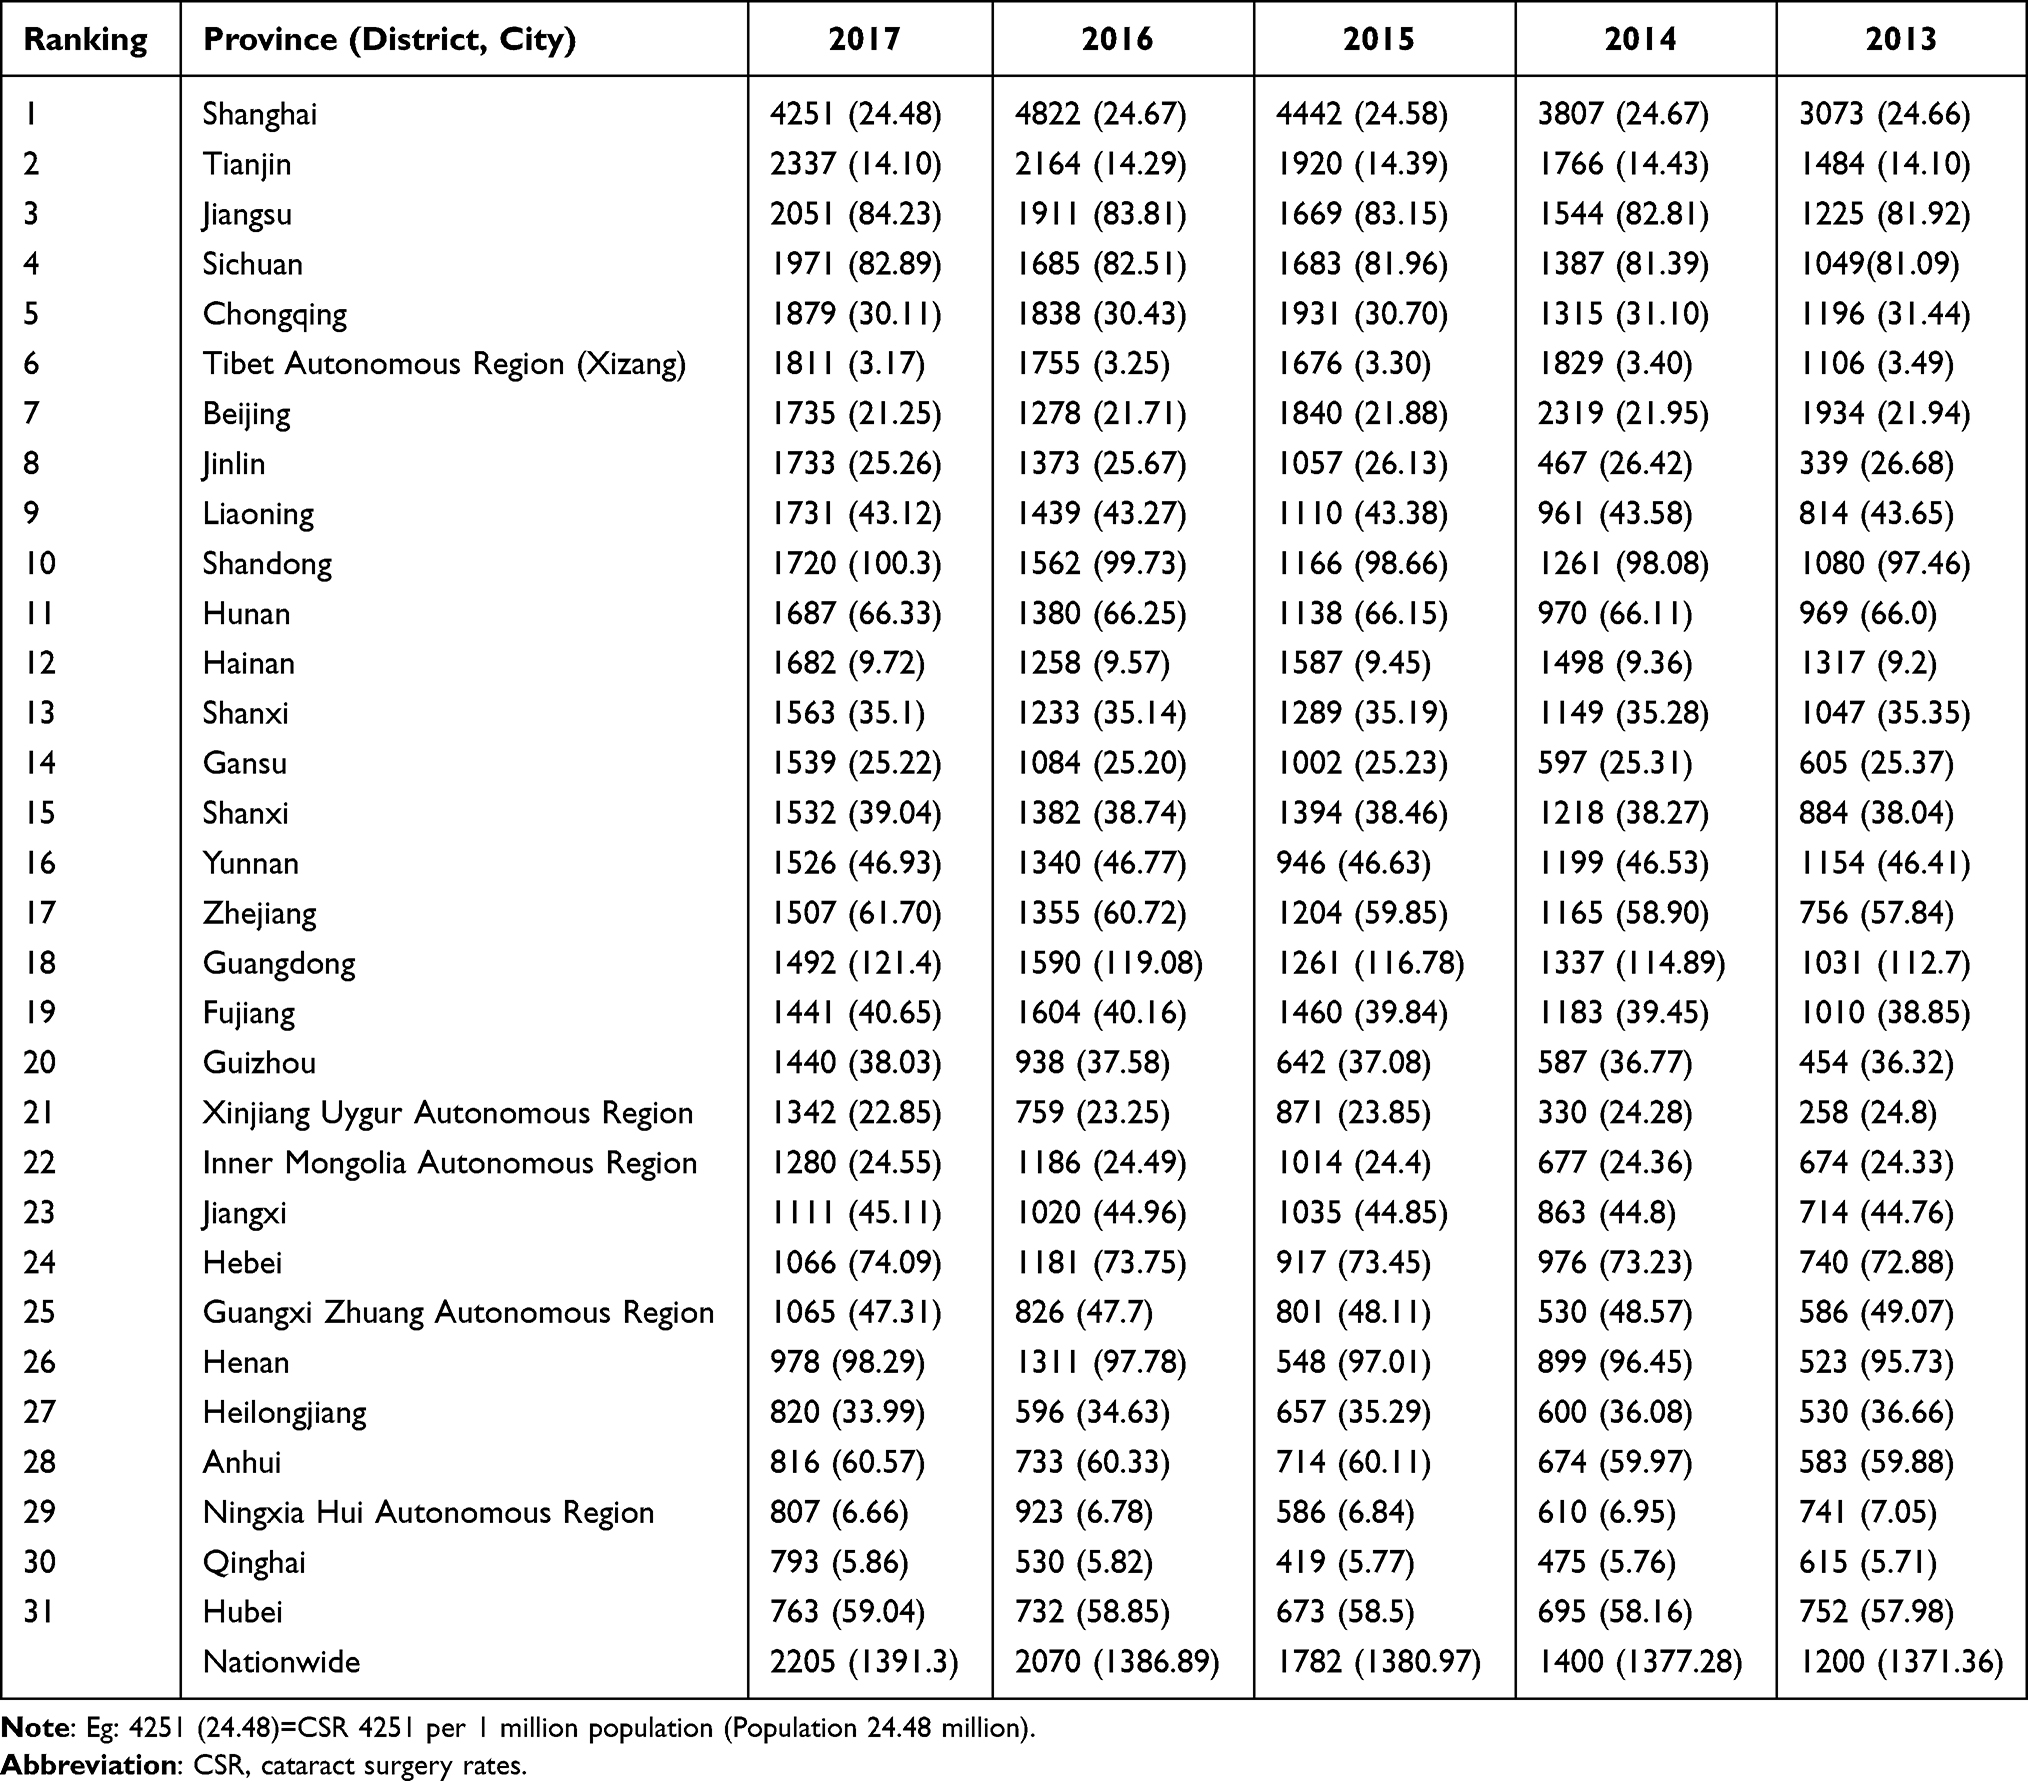 |
Table 1 Spatial Distribution of CSR |
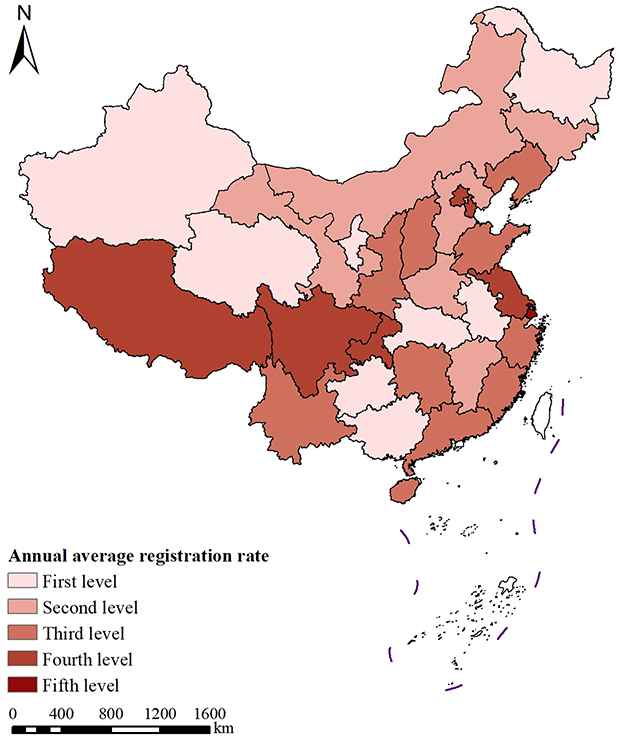 |
Figure 1 Spatial distribution of average annual registration rates for cataract surgery nationwide, 2013–2017. |
Spatial Autocorrelation Analysis
(1) Global spatial autocorrelation analysis: Findings of Moran’s I global spatial autocorrelation analysis of national cataract surgery CSR from 2013–2017 showed that the annual Moran’s I index interval was in the range of −0.072287 to 0.04323 with mean P>0.05. Autocorrelation was not statistically significant at regional scale, indicating no positive spatial correlation among national CSR (Table 2).
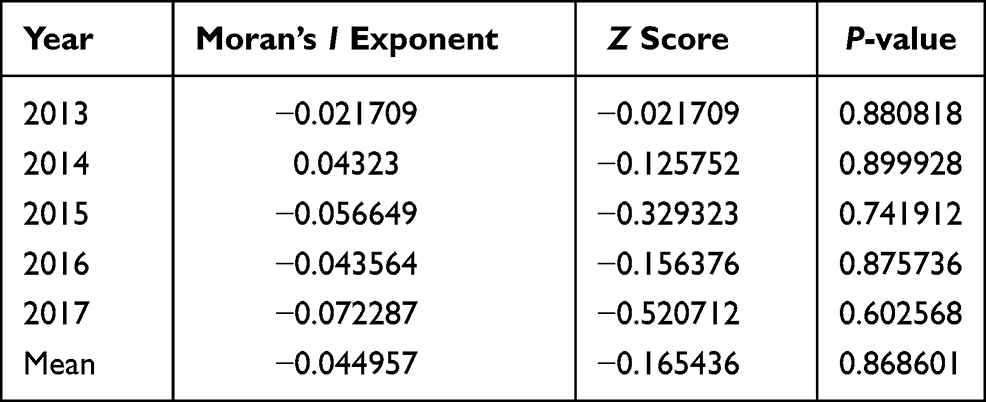 |
Table 2 Results of Global Spatial Autocorrelation Analysis of Registration Rate of Cataract Surgery in China, 2013–2017 |
(2) Local spatial autocorrelation analysis: Local Moran’s I autocorrelation analysis showed that there was spatial clustering of cataract surgery in China, with Anhui being a low-high clustering region (Figure 2).
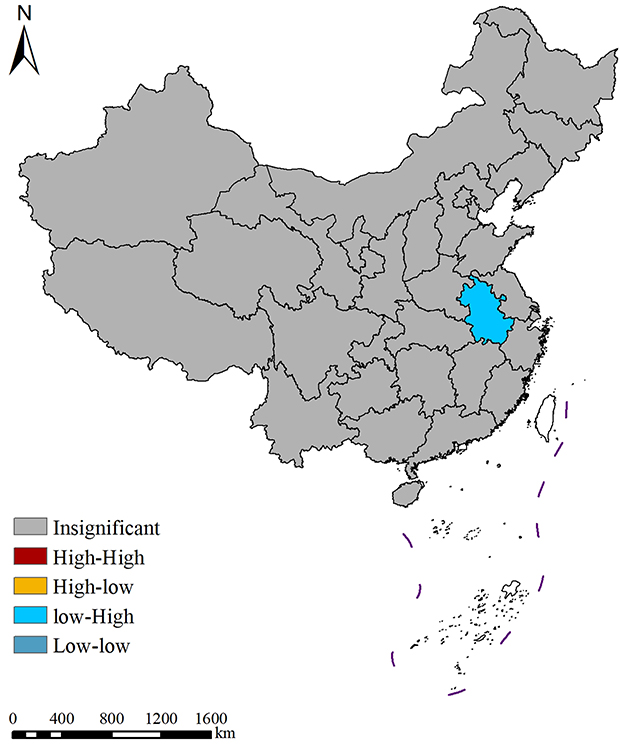 |
Figure 2 Local spatial autocorrelation analysis of national annual average cataract surgery rates, 2013–2017. |
(3) Global hotspot analysis and local hotspot analysis: Findings of global hotspot analysis Getis-Ord General G showed that General G index=0.000001, Z=1.124960, P=0.260606 for average annual registration rate of cataract surgery nationwide, indicating that cataract surgery rate was not statistically significant at regional level of correlation. Furthermore, there were no “positive hot” and “negative hot” areas, an indication that Anhui is low-high concentration area (Figures 3 and 4).
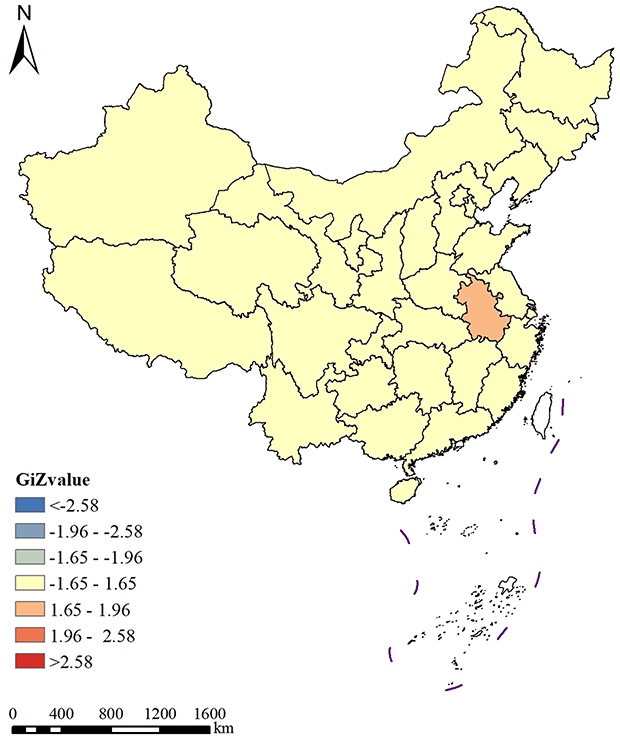 |
Figure 3 Local hotspot analysis of national annual average cataract surgery rates, 2013–2017. |
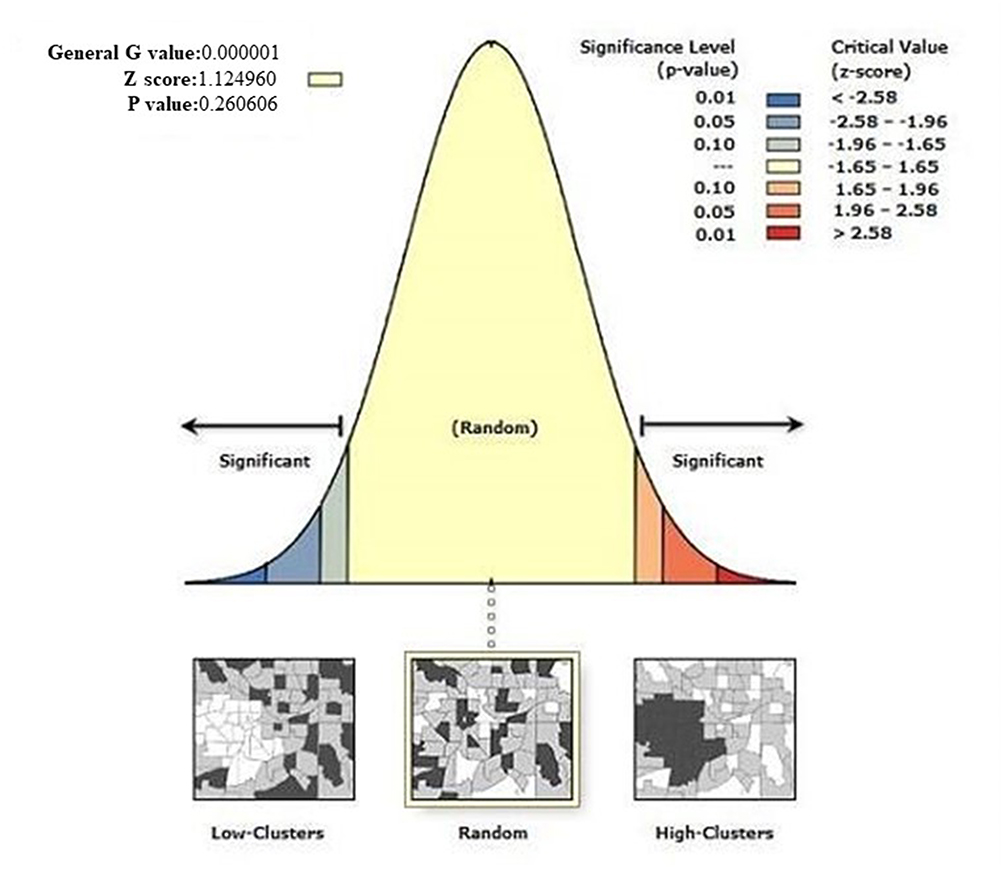 |
Figure 4 Local hotspot analysis of high/low clustering for national average annual cataract surgery rates, 2013–2017. |
Time and Spatial Scan Analysis
Time and spatial scan analysis of national cataract surgery rate from 2013 to 2017 was undertaken in two stages.18 Clustering regions were found in the two stages. Observed differences in each clustering area were statistically significant (all P<0.05; Table 3). The first level of clusters from 2013 to 2025 was largest in 2015, involving only Xinjiang, whereas second and third levels of clusters were mainly distributed in northeast (Jilin) and northwest (Ningxia, Qinghai, Gansu) of China. Clustering areas of registered cases of cataract surgery in China in the 13th Five-Year Plan period varied greatly compared with the 12th Five-Year Plan period. First agglomeration areas were east and central coastal 11 provinces and cities (Shandong, Henan, Jiangsu, Anhui, Hubei, Zhejiang, Jiangxi, Fujian, Tianjin, Hebei, and Shanghai), whereas second and third agglomeration areas were three northwestern provinces and autonomous regions (Xinjiang, Qinghai, and Gansu). In summary, cataract surgery registry in China had shifted to the eastern region since the 13th Five-Year Plan (Figure 5).
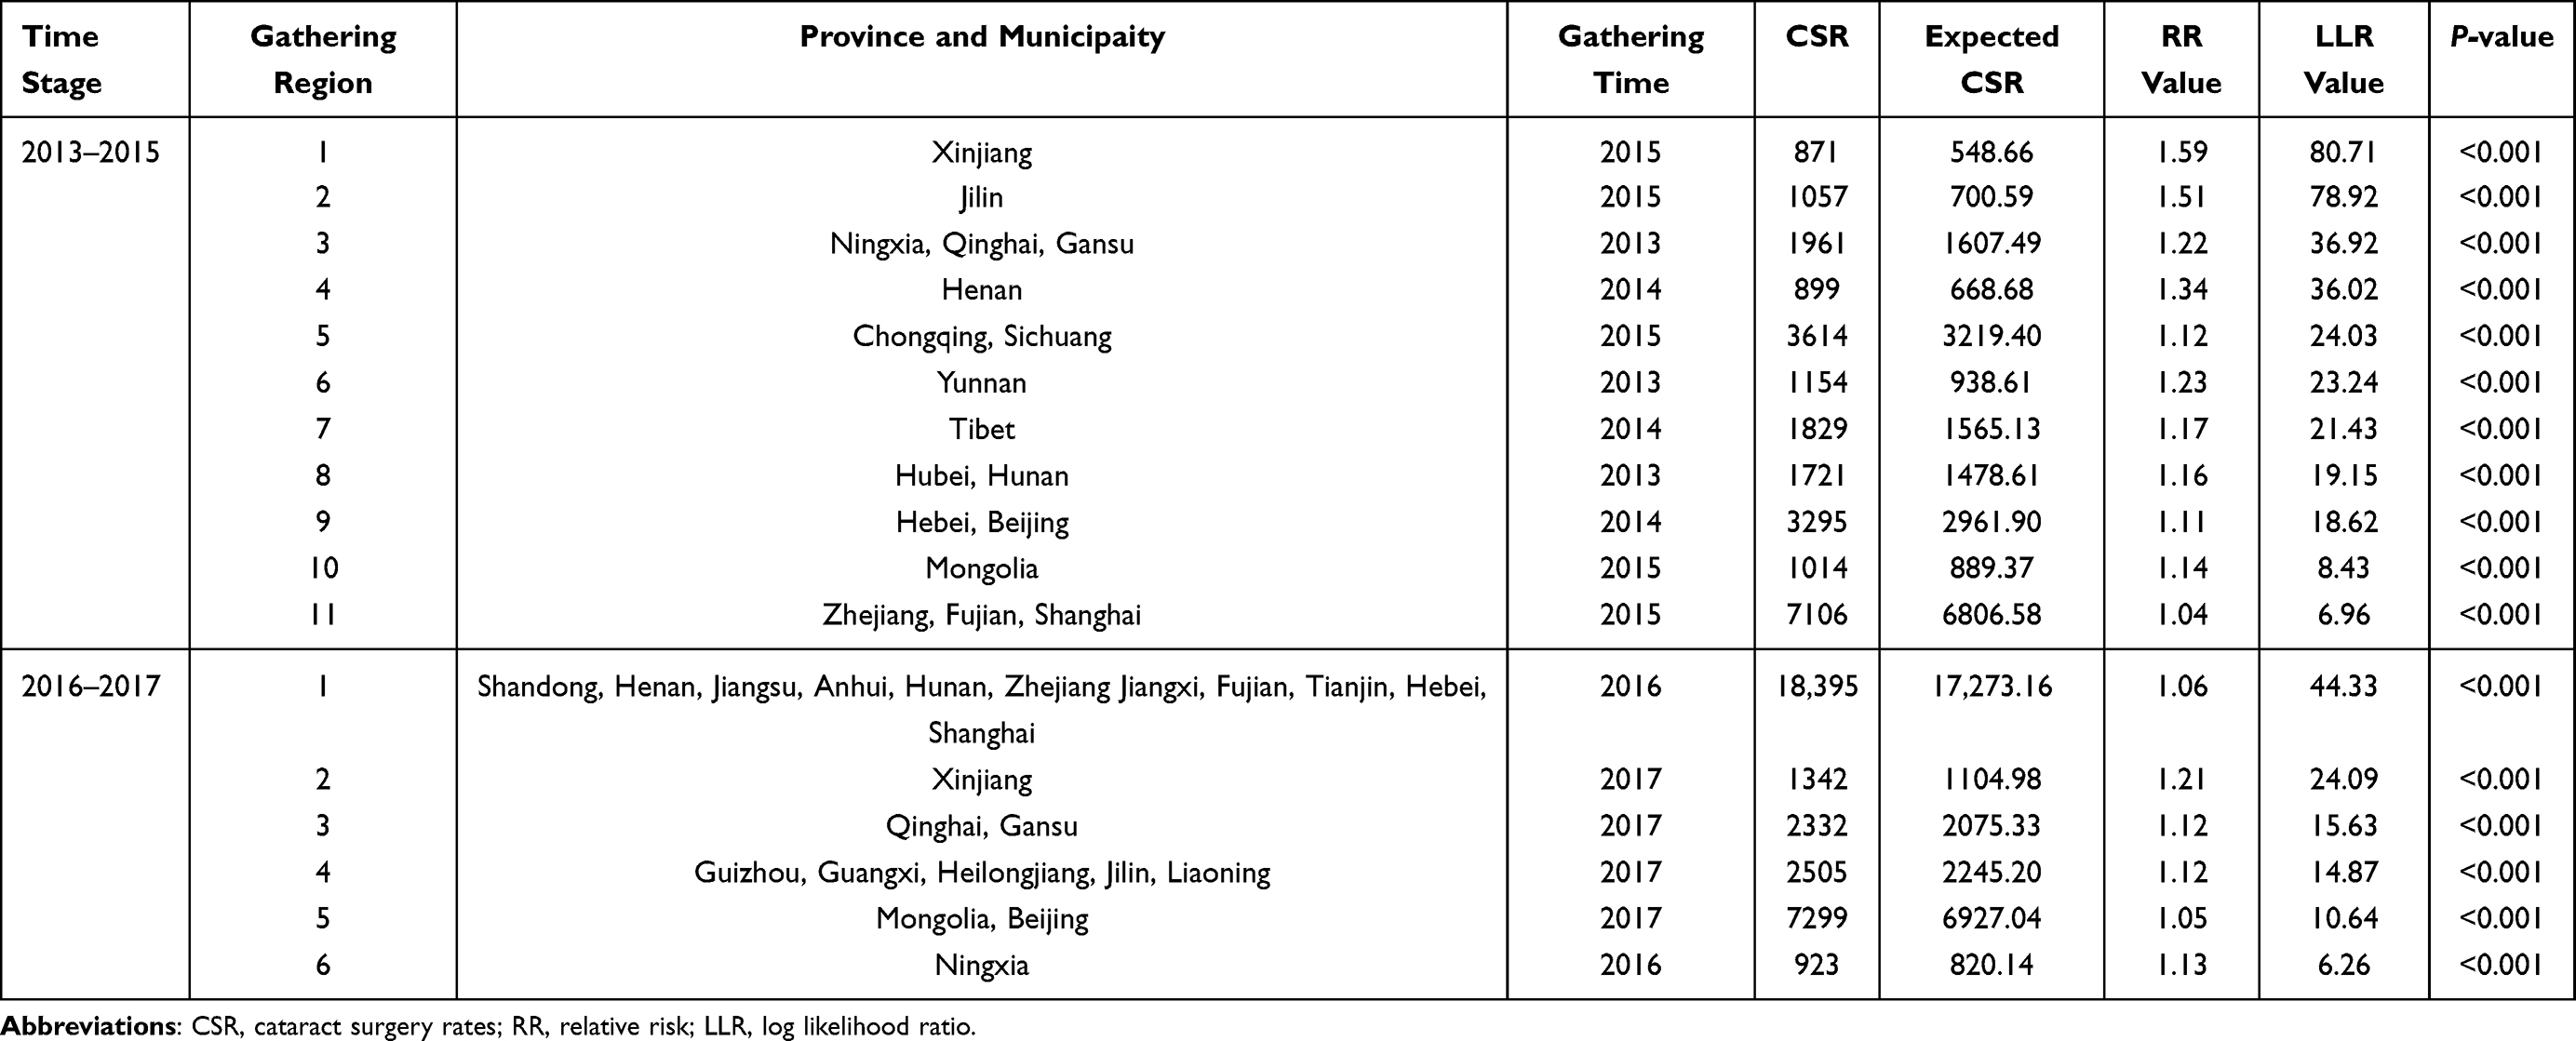 |
Table 3 Aggregation Analysis of CSR Spatiotemporal Scan of Cataract Surgery in China by Time Stage, 2013–2017 |
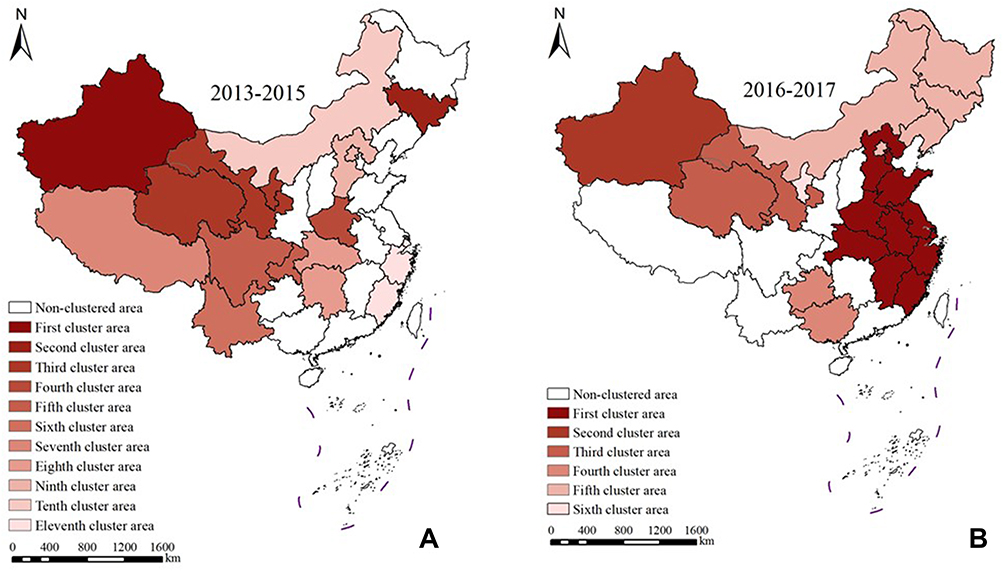 |
Figure 5 Scope of time and space scan clustering area for cataract surgery in China, 2013–2015 (A); Scope of time and space scan clustering area for cataract surgery in China, 2016–2017 (B). |
Discussion
Previous studies reported that accurate analysis of spatial distribution characteristics can reveal the distribution patterns and factors that influence CSR, and propose effective measures to prevent and treat blindness.16–18 Findings of the current study established that GIS uses its spatial analysis technique to explore spatial and temporal distribution patterns of cataract surgery in each province from time and space perspectives, and to explore “hotspots” where cataract surgery is undertaken. Temporal, spatial, and social factors are crucial in promotion of cataract surgery in China. Therefore, the distribution status of cataract surgery rates in different regions also shows some spatial heterogeneity.19,20 The current study analyzed spatial and temporal characteristics of registered cases of cataract surgery in China from 2013–2017 at provincial level. The spatial distribution map of average annual surgery rates showed that national cataract restoration surgery rates for the five years 2013–2017 were 1200, 1400, 1782, 2070, and 2205 per 1 million population, indicating a gradually increasing trend. This trend may be explained by economic development of China. Moreover, the high level of CSR in this period may be explained by the implementation of a national cataract surgery prevention and control policy.21 The National Cataract Surgery Prevention and Treatment Plan (2001–2010) proposed that efforts for cataract surgery prevention and treatment had been intensified from national to provincial level.22,23 The highest CSR in each province (municipality directly under the central government and autonomous region) was observed in Shanghai, where the 5-year average CSRs value is classified into five levels according to the natural breakpoint hierarchy. Qinghai Province, Heilongjiang Province, Anhui Province, Xinjiang Uygur Autonomous Region, Hubei Province, Ningxia Hui Autonomous Region, and Guangxi Zhuang Autonomous Region had the lowest CSR levels and were classified in first level. This is mainly due to minority residential areas, whereas most of the other provinces (municipalities directly under the central government and autonomous regions) were in the second to fourth levels of registration. Shanghai, Tianjin, Beijing, Jiangsu Province, Tibet Autonomous Region, Chongqing, and Sichuan Province had the highest CSR. This fifth ranking is partly due to the high level of local economic development and policies to prevent and treat blindness. The Chinese government has recently taken a leading role in preventing and treating blindness by implementing several programs to prevent and treat cataracts, where significant progress has been made. However, prevention and treatment of blindness is a long-term task involving livelihoods of people, and it is not enough to rely only on implementation of some projects to sustainably solve the problem of blindness with cataract in China. There is a need to focus on establishing long-term mechanisms and networks for prevention and treatment of blindness, as well as promotion of ophthalmology institutions at all levels to meet challenges due to increasing cataract blindness resulting from population growth and aging.24
The current study showed that there was no positive spatial correlation between registration rates of cataract surgery in China during 2013–2017. Local spatial autocorrelation analysis showed spatial clustering of cataract surgeries in China, with Anhui being a low-high clustering region. Furthermore, global hotspot analysis Getis-Ord General G showed no “positive hotspots” or “negative hotspots”, whereas local autocorrelation analysis showed that Anhui was a low-high concentration region, which was attributed to the irrational allocation of ophthalmic resources in the region. The current study established that ophthalmology institutions, surgical equipment, and ophthalmology technology were not well distributed, which prevented many rural and remote areas from receiving timely cataract treatment, which is among reasons why CSR could not be improved quickly. Ophthalmology resources had been allocated rationally, and capacity of comprehensive ophthalmology services at the basic level was inadequate.1 This is either because of lack of necessary facilities, or existing facilities were too old to be used properly.25,26 In addition, lack of enough skilled personnel to provide services using equipment could explain inadequate capacity of comprehensive ophthalmology services at basic levels.26,27 These require government and ophthalmology academic groups to urgently set standards for ophthalmology facilities and services at grassroot levels, strengthen ophthalmology human resource development and appropriate training, develop counterpart support from ophthalmology resource-rich areas to rural and remote areas, and effectively strengthen capacity of comprehensive ophthalmology services at the county level to increase CSR.
Spatial autocorrelation analysis determines presence of local agglomeration around an area, but not size and extent of agglomeration.28,29 Spatiotemporal scan analysis compensates for this shortcoming.29 The current study applied staged spatial and temporal scan analysis to registered cases of cataract surgery in 2013–2017. Findings showed that 18 areas of aggregation were found in 2 stages, and differences observed in each area of aggregation were statistically significant, with particularly clear scope of aggregation. First level of agglomeration was the largest in 2015, involving only Xinjiang. Second and third levels of aggregation were mainly located in northeast (Jilin) and northwest (Ningxia, Qinghai, and Gansu) of China. Findings of the current study showed that clustering areas of CSR in China varied greatly during the 13th Five-Year Plan period compared with the 12th Five-Year Plan period. Cataract surgery registered cases in China shifted to the eastern region since the 13th Five-Year Plan. In addition, phased time and space scan analyses established that the number of clustering areas in the two stages tended to decrease gradually, and clustering areas in the second stage decreased significantly compared with the previous stage, which indicated that the overall burden of cataract surgery in China is decreasing, and prevention and treatment of cataract surgery has improved. This burden is related to economic level, scientific education, and social efforts to prevent blindness.1 Many people still have misconceptions about cataracts that cause blindness, and believe that it is “natural” for the elderly to be blind, which makes them and their children reluctant to receive treatment.24–26 Some patients believe that they need to find the best “experts” and use the best equipment and materials for the operation, reportedly because some grass-roots ophthalmology institutions cannot offer adequate expertise, which has aggravated the phenomenon of “difficult and expensive medical treatment” in urban hospitals.24,30
However, this study also contains several limitations. Firstly, the CSR included all surgeries performed in the total population irrespective of visual acuity or degree of visual impairment prior to the surgery, and therefore CSR did not necessarily reflect a needs-based provision of services. Secondly, the CSR data did not incorporate other significant outcomes such as visual acuity restoration rate, as well as the cataract surgical coverage among the cataract blind. It did not reflect actual disease burden completely. Thirdly, CSR data in 2018–2020 were not available for the reports from the China network of National Blindness Prevention and Treatment, and most data from this organization did not specify the methodology for data collection. Although we identified established cataract surgery registry systems in China, most of these did not publish their data collection procedures. As a result of this, the accuracy of CSR data from these sources cannot be verified.
In conclusion, the current study established that CSR in China from 2013 to 2017 showed an increasing trend year by year. Average annual cataract surgery rates in all provinces (autonomous regions and municipalities directly under the central government) were randomly distributed, with some degree of spatial aggregation. Staged spatiotemporal scan aggregation area decreased gradually, and cataract surgery prevention and control work has made some progress. However, high-risk areas still persisted, requiring focused attention and targeted prevention and control measures. Therefore, government should further strengthen prevention and treatment of blindness, especially prevention and treatment of cataract blindness. In addition, government should further improve rational allocation of ophthalmology resources (ophthalmology institutions, surgical equipment, and ophthalmology technology), and strengthen scientific propaganda and education. The current study also recommends that CSR should be focused on as an important indicator to evaluate progress of prevention and treatment of cataract blindness in each region, and seek support from all social services (Red Cross, private eye care institutions, Lions Clubs) to form government-led, multi-agency coordination mechanisms. Moreover, government should implement financial compensation mechanisms such as government remission. Non-governmental organizations, charitable groups, enterprises, and individuals should be lobbied to participate in various ways. In addition, hospitals, at all levels, should be encouraged to offer appropriate reductions or waivers within their means, in order to build more sustainable, low-cost and high-efficiency blindness prevention and treatment systems.
Disclosure
The authors report no conflicts of interest in this work.
References
1. Wang W, Yan W, Fotis K, et al. Cataract surgical rate and socioeconomics: a Global Study. Invest Ophthalmol Vis Sci. 2016;57(14):5872–5881. doi:10.1167/iovs.16-19894
2. Blindness GBD, Vision Impairment C, Briant PS; Vision Loss Expert Group of the Global Burden of Disease, S. Causes of blindness and vision impairment in 2020 and trends over 30 years, and prevalence of avoidable blindness in relation to VISION 2020: the right to sight: an analysis for the Global Burden of Disease Study. Lancet Glob Health. 2021;9(2):e144–e160. doi:10.1016/S2214-109X(20)30489-7
3. Pascolini D, Mariotti SP. Global estimates of visual impairment: 2010. Br J Ophthalmol. 2012;96(5):614–618. doi:10.1136/bjophthalmol-2011-300539
4. Wang W, Yan W, Muller A, He M, Global A. View on output and outcomes of cataract surgery with national indices of socioeconomic development. Invest Ophthalmol Vis Sci. 2017;58:3669–3676.
5. Boyers LN, Karimkhani C, Hilton J, Richheimer W, Dellavalle RP. Global burden of eye and vision disease as reflected in the cochrane database of systematic reviews. JAMA Ophthalmol. 2015;133(1):25–31. doi:10.1001/jamaophthalmol.2014.3527
6. Lewallen S, Thulasiraj RD. Eliminating cataract blindness - how do we apply lessons from Asia to Sub-Saharan Africa? Glob Public Health. 2010;5:639–648. doi:10.1080/17441690903539541
7. Hasker E, Assoumani Y, Mzembaba A, et al. Using a geographic information system as a management tool for tuberculosis control. Int J Tuberc Lung Dis. 2020;24(3):354–356. doi:10.5588/ijtld.19.0704
8. Fletcher-Lartey SM, Caprarelli G. Application of GIS technology in public health: successes and challenges. Parasitology. 2016;143(4):401–415. doi:10.1017/S0031182015001869
9. Qianqian M, Zhang J, Yang T. Application of GIS in modern medicine. Pract Preven Med. 2017;24(7):892–896.
10. Su X, Chen X. Applications and perspectives of GIS in public health and military guard. Southwestern Def Med. 2019;29(4):506–507.
11. Chen W, Yan X, Shi J, et al. GIS-based analysis of the spatial distribution of diabetes and its influencing factors among the elderly in China. Chin J Dis Control Preven. 2017;21(11):1082–1087.
12. Chen W, Zhang Y, Zhou L, et al. Zhejiang provence spatial scanning study of tuberculosis registries, 2005–2014. Chin J Infect Dis. 2017;35(2):88–92.
13. Chen W, Wang X, Chen B, et al. Zhejiang provence characterization of the spatial distribution of patients with multidrug-resistant tuberculosis, 2010–2012. Chin J Epidemiol. 2016;37(6):831–835.
14. Zhang J, Bao C, Liu W, et al. Spatial analysis of the prevalence of viral hepatitis B in Jiangsu Province (GIS). China Health Stat. 2013;30(3):351–353,356.
15. Gao J, Zhang Z, Wang Z, et al. Spatial distribution characteristics of residential drinking water iodine in Shandong province, 2008–2010. Chin J Preven Med. 2013;47(1):18–22.
16. Zhang Z, Peng W, Zhou Y, et al. Study of quantitative indicators of disease distribution status based on spatial point pattern analysis. Chin J Preven Med. 2008;42(6):422–426.
17. Liu K, Li X, Shao Z. Space epidemiology plays an important role in disease prevention and control. Chin J Epidemiol. 2018;39(9):1143–1145.
18. Fan J, Wang Y, Zhang Z, et al. Current status and outlook of public health research based on spatial statistics. Chin J Preven Med. 2015;16(7):562–565.
19. Yaoqin L, Alim A. The application and development of GIS in disease prevention and control. Occup Health. 2016;32(3):423–425.
20. Yu Y, Wu Y, Chen H, et al. A study on the allocation needs of tertiary blindness prevention health resources in Hainan Province in the context of a hierarchical diagnosis and treatment system. China Health Ind. 2017;14(20):9–12.
21. Zhao J. Seize the opportunity to take our country’s eye health to a new level. Western China Med Univ. 2018,33(11):1335–1338. doi:10.7507/1002-0179.201810078
22. Fan J, Wu B, Wang Y. Exploring the spatial analysis method and significance of public health resource allocation: the case of Qingdao City. China Health Econ. 2015;34(3):36–39.
23. Gao Y, Liu J, Chen M, et al. Study on the spatial distribution and forecast of government health investment by province. China Health Econ. 2020;39(2):65–68.
24. Wang L, Gong R, Keel S, Zhu Z, Ten-Year HM. Incidence of cataract surgery in urban southern China: the Liwan Eye Study. Am J Ophthalmol. 2020;217:74–80. doi:10.1016/j.ajo.2020.03.034
25. He M, Chan V, Baruwa E, Gilbert D, Frick KD, Congdon N. Willingness to pay for cataract surgery in rural southern China. Ophthalmology. 2007;114(3):411–416. doi:10.1016/j.ophtha.2006.09.012
26. Yin Q, Hu A, Liang Y. A two-site, population-based study of barriers to cataract surgery in rural china. Invest Ophthalmol Vis Sci. 2009;50(3):1069–1075. doi:10.1167/iovs.08-2783
27. Zhao J, Xu X, Ellwein LB. Cataract surgical coverage and visual acuity outcomes in rural China in 2014 and comparisons with the 2006 China nine-province survey. Am J Ophthalmol. 2018;193:62–70. doi:10.1016/j.ajo.2018.06.004
28. Franch-Pardo I, Napoletano BM, Rosete-Verges F, Billa L. Spatial analysis and GIS in the study of COVID-19. A review. Sci Total Environ. 2020;739:140033. doi:10.1016/j.scitotenv.2020.140033
29. Pfeiffer DU, Stevens KB. Spatial and temporal epidemiological analysis in the big data era. Prev Vet Med. 2015;122(1–2):213–220. doi:10.1016/j.prevetmed.2015.05.012
30. Huang W, Huang G, Wang D, Yin Q, Foster PJ, He M. Outcomes of cataract surgery in urban southern China: the Liwan Eye Study. Invest Ophthalmol Vis Sci. 2011;52(1):16–20. doi:10.1167/iovs.10-5382
 © 2021 The Author(s). This work is published and licensed by Dove Medical Press Limited. The full terms of this license are available at https://www.dovepress.com/terms.php and incorporate the Creative Commons Attribution - Non Commercial (unported, v3.0) License.
By accessing the work you hereby accept the Terms. Non-commercial uses of the work are permitted without any further permission from Dove Medical Press Limited, provided the work is properly attributed. For permission for commercial use of this work, please see paragraphs 4.2 and 5 of our Terms.
© 2021 The Author(s). This work is published and licensed by Dove Medical Press Limited. The full terms of this license are available at https://www.dovepress.com/terms.php and incorporate the Creative Commons Attribution - Non Commercial (unported, v3.0) License.
By accessing the work you hereby accept the Terms. Non-commercial uses of the work are permitted without any further permission from Dove Medical Press Limited, provided the work is properly attributed. For permission for commercial use of this work, please see paragraphs 4.2 and 5 of our Terms.