")
Back to Journals » Journal of Blood Medicine » Volume 8
Techniques used for the screening of hemoglobin levels in blood donors: current insights and future directions
Authors Chaudhary R, Dubey A, Sonker A
Received 8 February 2017
Accepted for publication 10 May 2017
Published 3 July 2017 Volume 2017:8 Pages 75—88
DOI https://doi.org/10.2147/JBM.S103788
Checked for plagiarism Yes
Review by Single anonymous peer review
Peer reviewer comments 3
Editor who approved publication: Dr Martin Bluth
Rajendra Chaudhary,1 Anju Dubey,2 Atul Sonker3
1Department of Transfusion Medicine, Sanjay Gandhi Postgraduate Institute of Medical Sciences, 2Department of Transfusion Medicine, T.S. Misra Medical College and Hospital, 3Department of Transfusion Medicine, Sanjay Gandhi Postgraduate Institute of Medical Sciences, Lucknow, India
Abstract: Blood donor hemoglobin (Hb) estimation is an important donation test that is performed prior to blood donation. It serves the dual purpose of protecting the donors’ health against anemia and ensuring good quality of blood components, which has an implication on recipients’ health. Diverse cutoff criteria have been defined world over depending on population characteristics; however, no testing methodology and sample requirement have been specified for Hb screening. Besides the technique, there are several physiological and methodological factors that affect accuracy and reliability of Hb estimation. These include the anatomical source of blood sample, posture of the donor, timing of sample and several other biological factors. Qualitative copper sulfate gravimetric method has been the archaic time-tested method that is still used in resource-constrained settings. Portable hemoglobinometers are modern quantitative devices that have been further modified to reagent-free cuvettes. Furthermore, noninvasive spectrophotometry was introduced, mitigating pain to blood donor and eliminating risk of infection. Notwithstanding a tremendous evolution in terms of ease of operation, accuracy, mobility, rapidity and cost, a component of inherent variability persists, which may partly be attributed to pre-analytical variables. Hence, blood centers should pay due attention to validation of test methodology, competency of operating staff and regular proficiency testing of the outputs. In this article, we have reviewed various regulatory guidelines, described the variables that affect the measurements and compared the validated technologies for Hb screening of blood donors along with enumeration of their merits and limitations.
Keywords: blood donors, hemoglobin estimation, cut off criteria, pre-analytical variables, copper sulfate method, portable hemoglobinometers, noninvasive spectrophotometry
Introduction
Blood donor screening mandates hemoglobin (Hb) estimation as the only laboratory test to be performed prior to the process of blood donation. The purpose of this test is to serve as an important public health sentinel. As the Hb of a blood donor drops by 1–1.5 g/dL after donating a single unit of whole blood, an appropriate pre-donation test may mitigate the possibilities of rendering the blood donor anemic. A good test is also a certitude of good quality of blood components, which has an explicit implication on the recipient’s health.
The cutoff Hb criteria have been designed for different populations world over to maximize donor safety and balance for adequate availability (Table 1). Reason for diversity in the criteria is variability of Hb level with age, race, sex,1 altitude, cigarette smoking and site from which the sample has been taken.2 These regulations, however do not specify the method of Hb estimation, vascular compartment (capillary or venous), specimen type and donor position (standing or recumbent) to which they apply. This article aims to review various regulatory guidelines, variables that affect the measurements and validated technologies for Hb screening of blood donors. It is pertinent to understand the characteristics of performance of various techniques for assessing their applicability and reliability as tests for Hb screening of blood donors (Table 2).
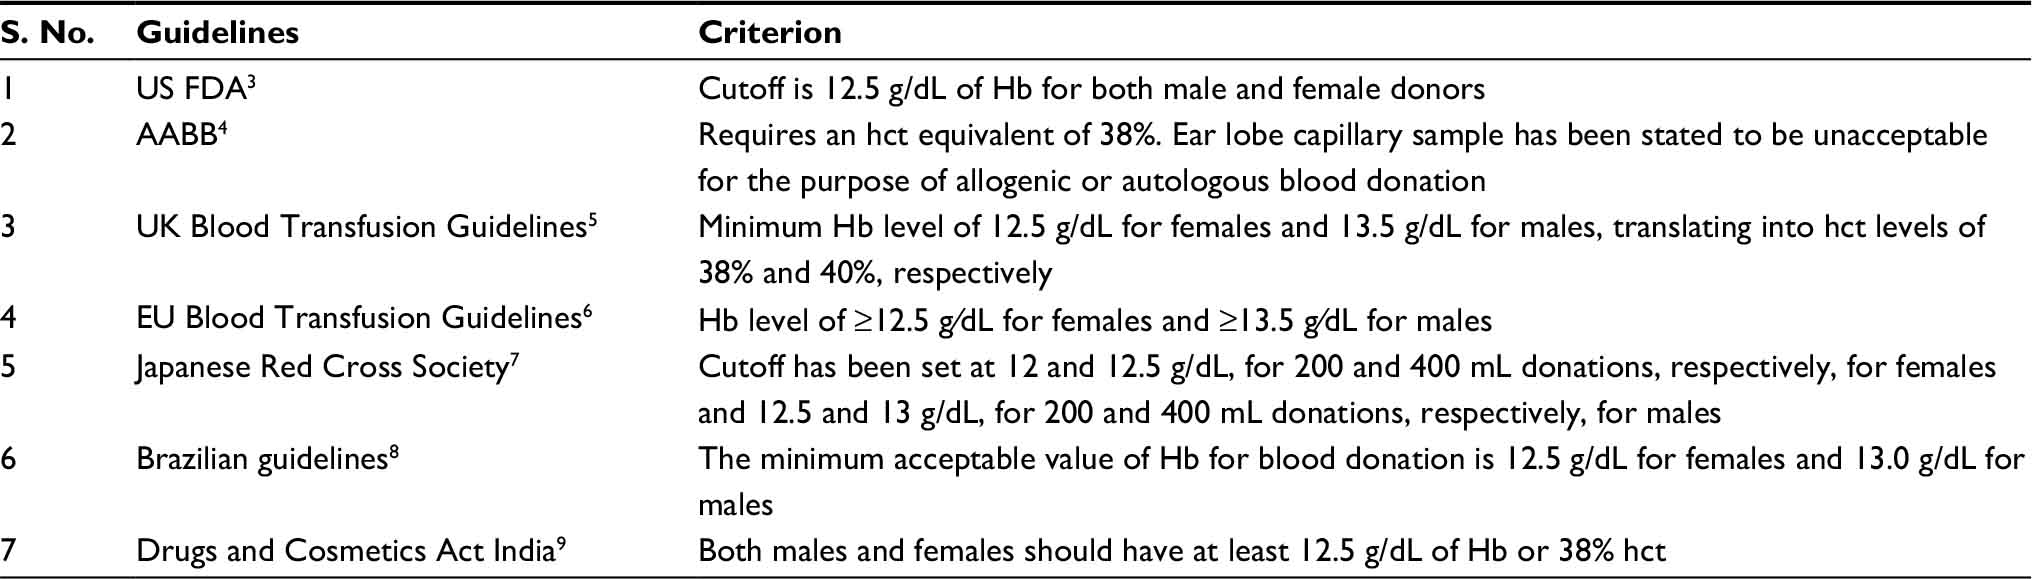 | Table 1 Hb screening criteria in various guidelines Abbreviations: Hb, hemoglobin; FDA, Food and Drug Administration; AABB, American Association of Blood Banks; hct, hematocrit; EU, European Union. |
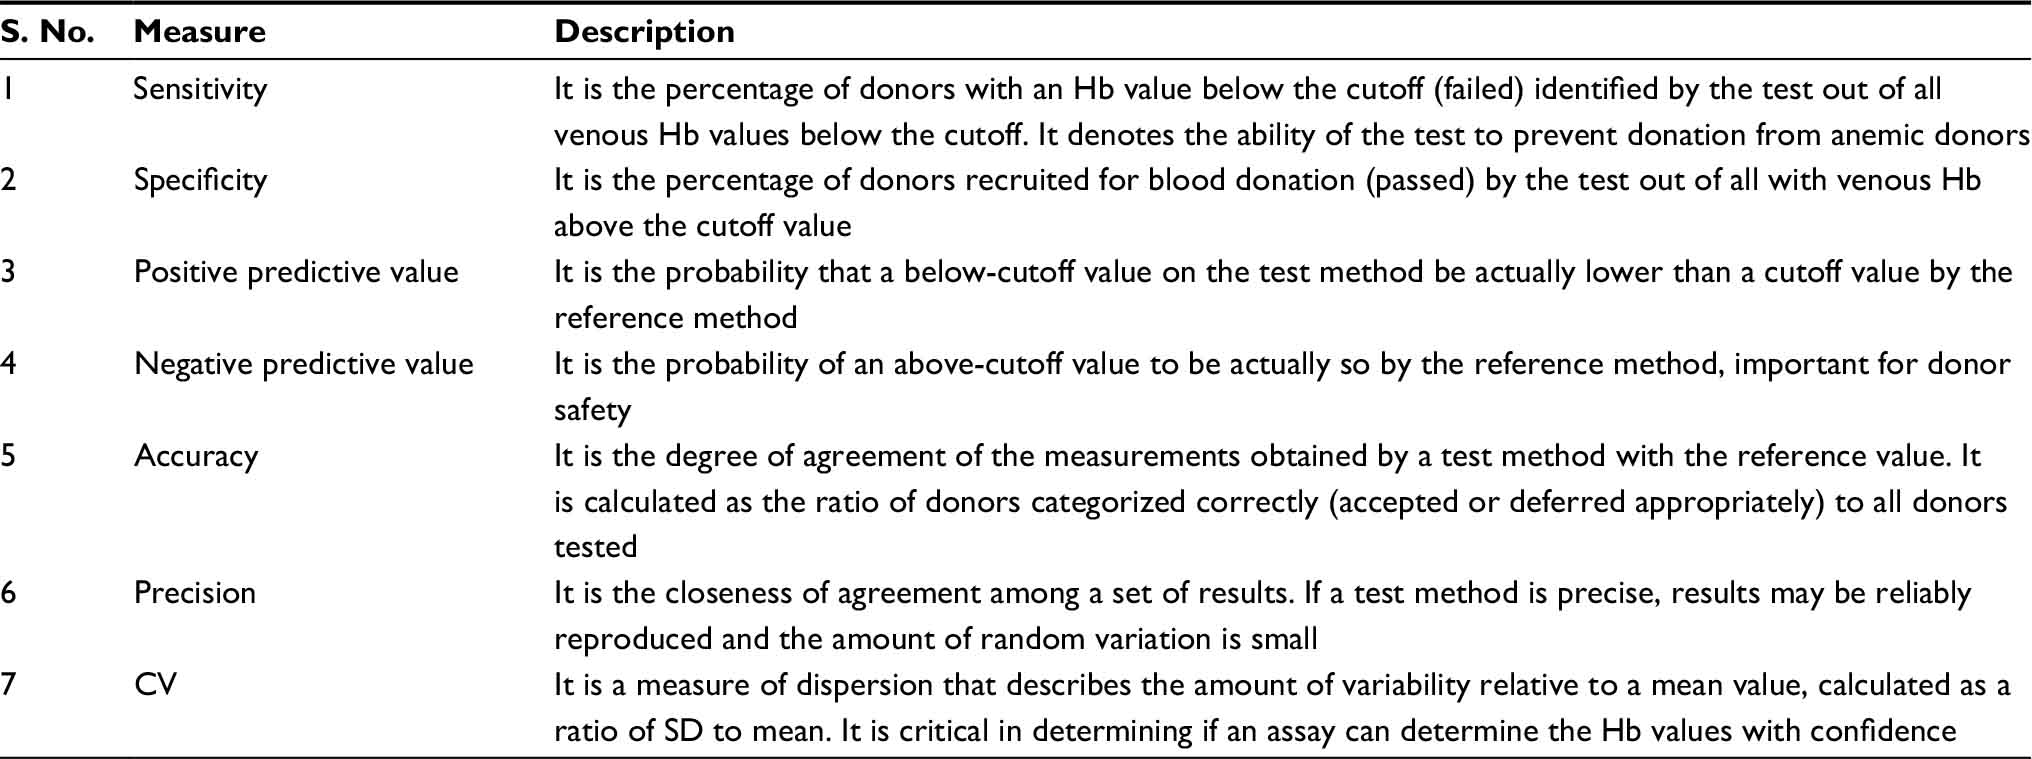 | Table 2 Measures of performance of Hb screening tests Abbreviations: Hb, hemoglobin; CV, coefficient of variation; SD, standard deviation. |
Factors affecting the Hb test result
Source of sample
The source of the blood sample is the most important variable for the accuracy of a technique and critical determinant of donor eligibility in borderline cases. The inherent variations are due to anatomical and technical reasons. The major source of blood from a finger stick is the loop capillaries, the concentration of which fluctuates with skin temperature, depth of skin penetration and dilution by extracellular tissue fluid exuded due to skin pressure. Poor reproducibility of measurements has been reported even from different fingers of same subject due to inconsistencies in the process of sample acquisition, such as the size and style of the lancet used, the manner in which the lancet is applied and innate differences in individual blood droplets from capillaries.10 The studies comparing Hb levels through blood obtained from various anatomical sites have been listed in Table 3.
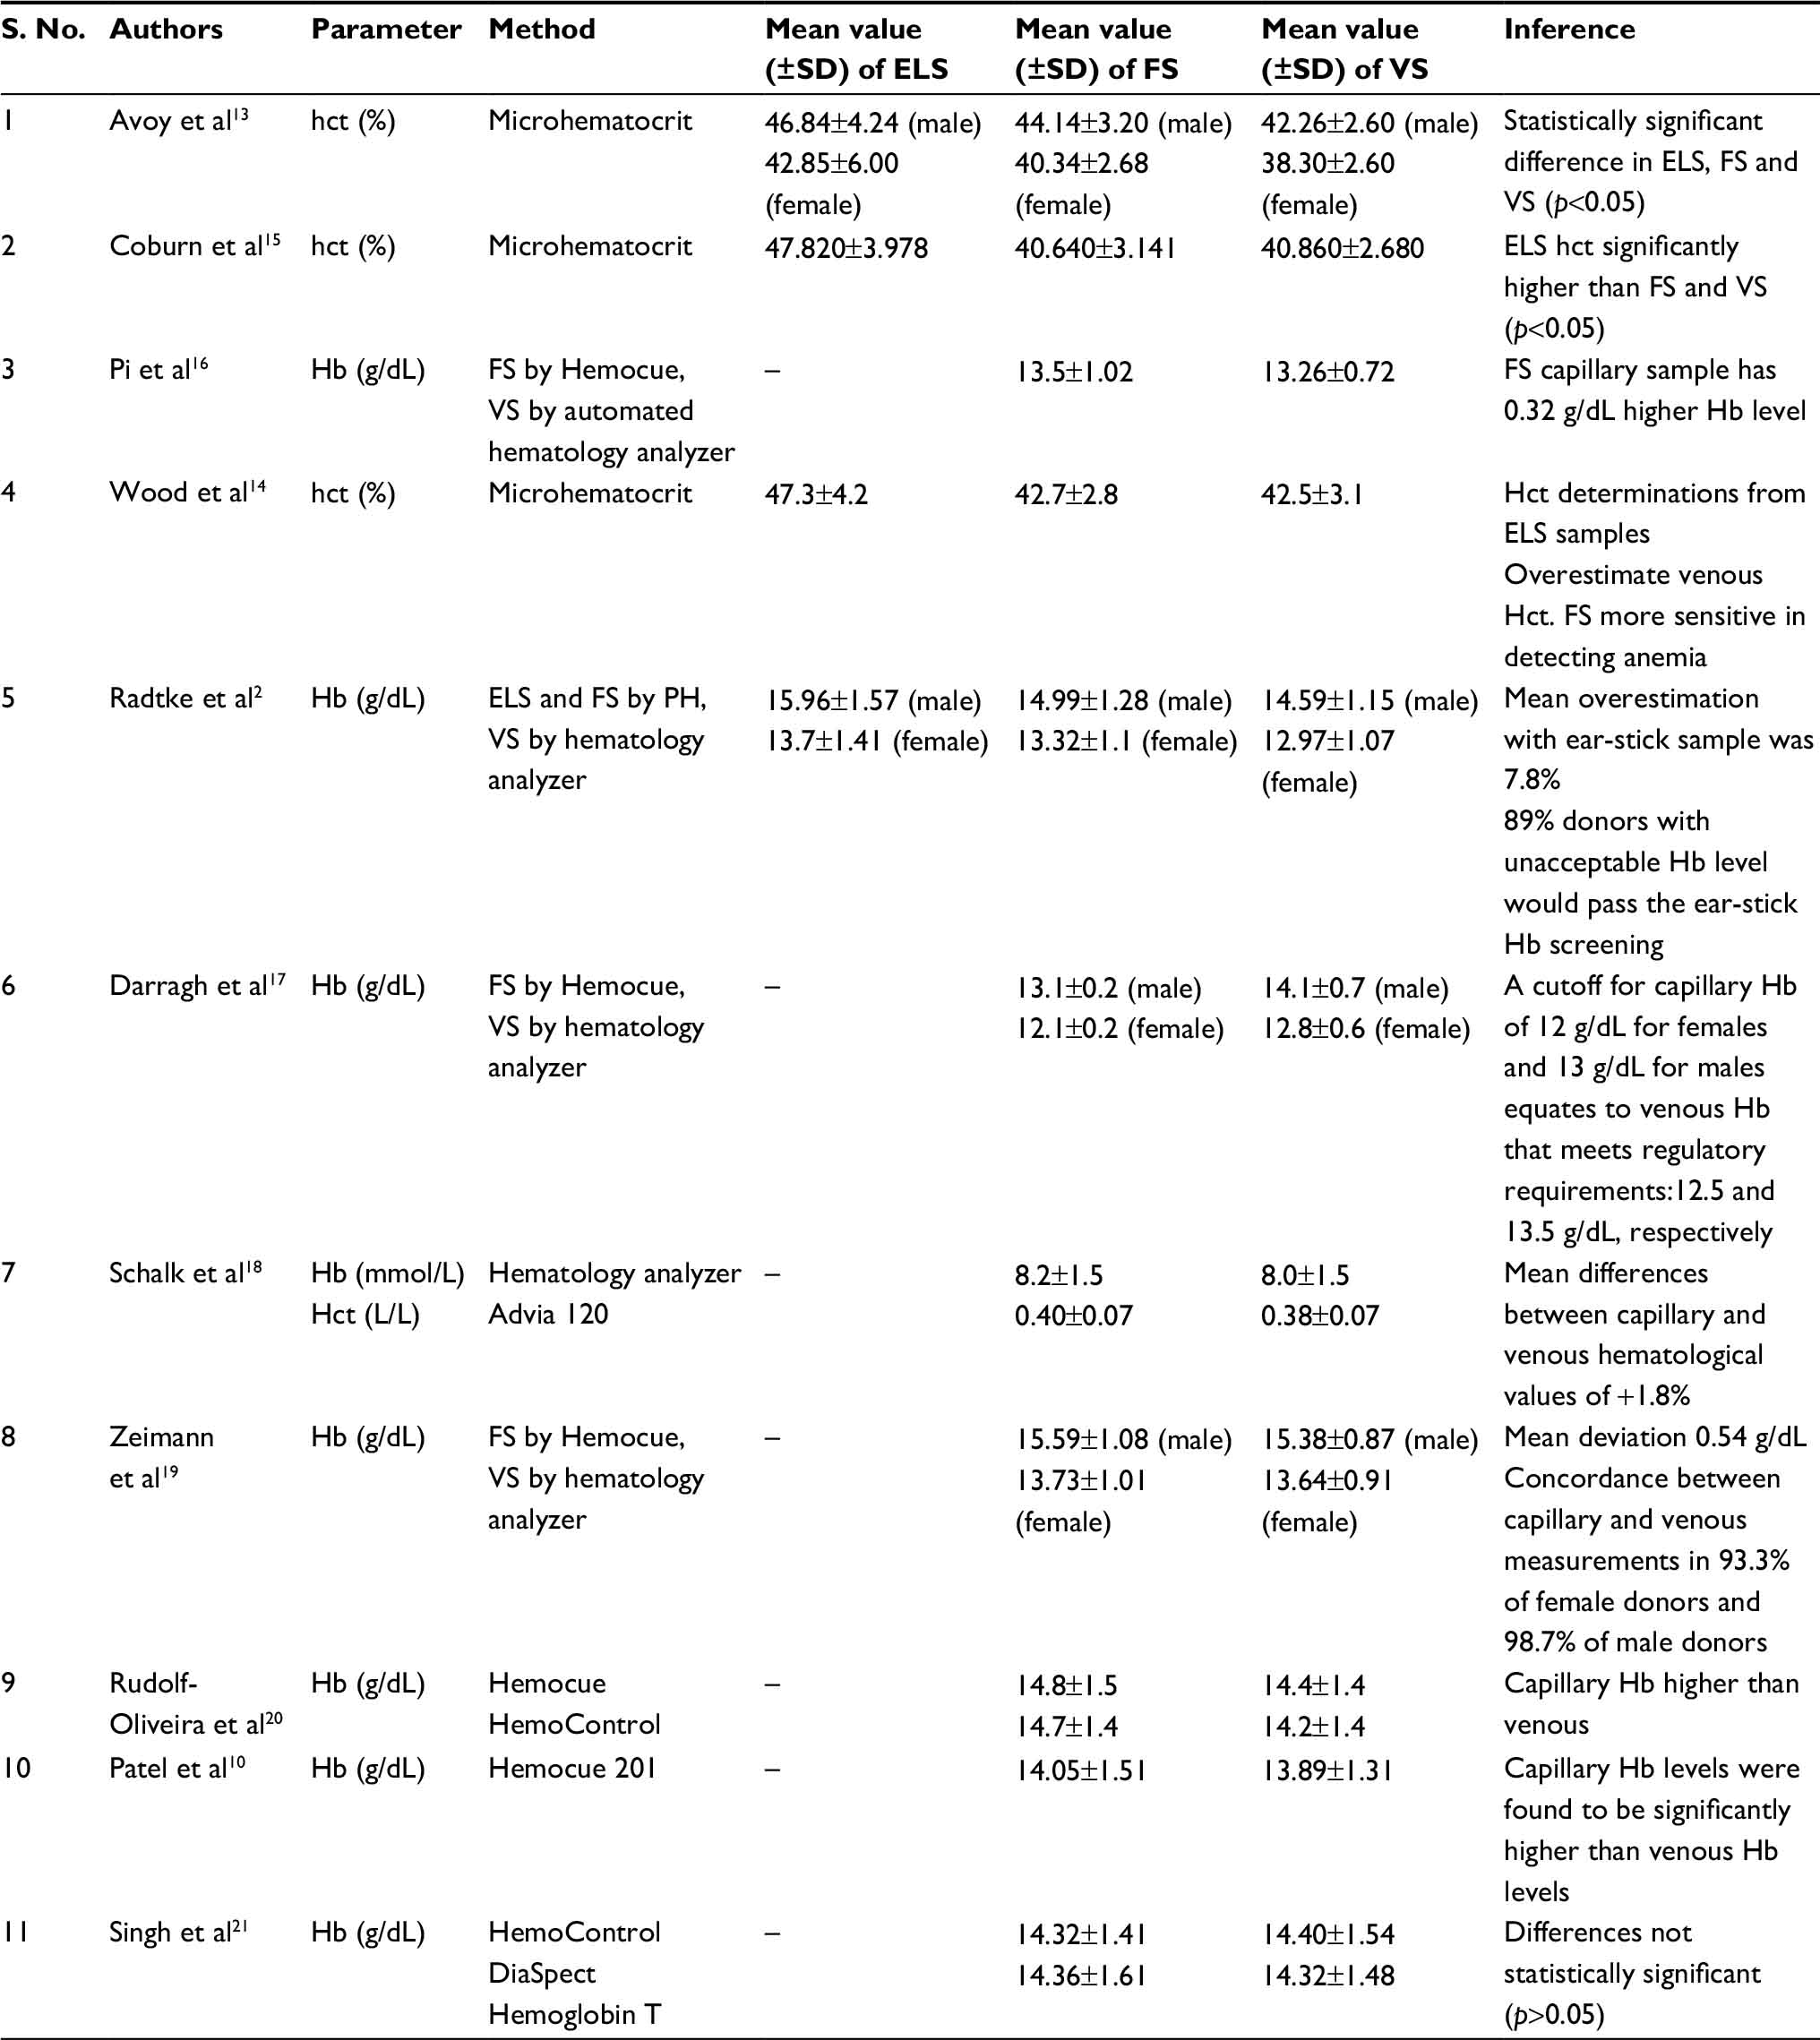 | Table 3 Studies comparing Hb and hct levels in blood obtained from various anatomical sites Abbreviations: Hb, hemoglobin; hct, hematocrit; SD, standard deviation; ELS, ear lobe sample; FS: finger-stick sample; VS, venous sample. |
Ear lobe puncture, which is now obsolete, was previously used to obtain blood for the specific gravity determination by the copper sulfate method. The reasons stated in its favor were donor comfort and a diminished potential for infection since fingers are used in several ways in which ear lobes are not.11 However, blood specimens were found to have increased hematocrit (hct) and Hb concentration attributed to variance in flow characteristics of plasma, leading to increased relative concentration of red cells in this region.12 Ear lobe samples thus have been found to overestimate the Hb concentration by as high as 2 g/dL and show higher variance than blood collected simultaneously from the fingertip.13,14
Finger stick capillary versus venous sample (VS)
There is a huge disagreement on the use of capillary blood for Hb estimation of blood donors because it is highly operator dependent with subsequently low precision and it has lower acceptance by donors due to the associated pain and discomfort. Conflicting data have been reported on the simultaneous determination of Hb on capillary and VSs. Two studies in the past reported no significant difference between finger-stick sample and VS.15,22 A large numbers of studies have subsequently reported an overestimation of Hb with capillary blood.2,14,16 Mendrone et al23 and Bahadur et al24 have reported an overestimation of venous Hb values by capillary screening using HemoCue by ~7–8 g/L. Several plausible reasons have been suggested for this. One is that capillary blood has an arterial source due to which Hb levels are higher than venous.25 Others suggest that higher capillary Hb levels are due to hemoconcentration caused by the influence of posture.18,26
A study by Darragh et al17 has shown contrasting results. They found that mean venous Hb levels are underestimated by capillary screening, on the basis of which the thresholds for whole blood donation have recently been lowered to capillary Hb levels of at least 120 and 130 g/L for females and males, respectively, in Ireland. On the same lines, another study from Ireland for Hb determinations from blood donors not meeting donation criteria (≥12.5 g/dL in women; ≥13.5 g/dL in males) also found that venous Hb levels were consistently higher than capillary levels when the Hb levels were in the lower side of the normal range. A capillary Hb level of 12.0 g/dL (for females) or 13.0 g/dL (for males) is substantively equivalent to a venous Hb level of at least 0.5 g/dL higher, permitting blood donation.27 A recent study by Ardin et al28 has also reported a falsely low Hb estimation by capillary blood, showing a bias of 0.53±0.81 g/dL from venous blood.
Most studies comparing capillary and venous blood have used different techniques for Hb estimation (hemoglobinometer for capillary and automated hematology analyzer for venous blood).2,16,17,19 Therefore, this may not be a true comparison as there is an inherent component of bias due to the technique used. Moreover, deriving a firm inference for the nature of relationship for blood obtained from different sources is complex as it also varies with sex and the underlying Hb level. Ziemann et al19 using capillary blood detected a low sensitivity (41.3% and 18.6% for females and males, respectively) for detecting donors with venous Hb values just below the cutoff guidelines, in contrast to a high sensitivity (97.4%) for detecting donors with venous Hb levels <110 g/L. The results from a multi-centric study showed that finger-stick Hb was higher than venous Hb in the higher side of the clinical range, but lower in the lower side of the range, particularly in female donors with absent iron stores. The study found that even though finger-stick Hb is a good predictor of venous Hb, females with a low–normal Hb and anemic donors are likely to be incorrectly accepted by this method.29 Similarly, in a study of 36,258 paired samples, Tong et al27 demonstrated that at the lower end of the normal range of Hb concentrations, venous Hb levels were higher than capillary levels (1.07 g/dL in males and 0.67 g/dL in females). As the Hb levels increased, the difference between the venous and the capillary measurements reversed.
Capillary blood is said to be an estimate rather than a measure of the true venous Hb, and cutoff values in the guidelines have been set on the basis of venous Hb levels. Obtaining VS is a prerequisite for accuracy but is non-pragmatic because it subjects the donor to another venipuncture, jeopardizing a potential phlebotomy site and adding to the volume of blood withdrawn. Thus, capillary blood must be used for operational purpose, but there is a need to emphasize on the efforts to increase the accuracy of capillary Hb measurements by identifying the variables that influence the results in a particular setting.
Postural effect
Standing causes hemoconcentration as fluids pool in the lower extremities and consequently intravascular fluids shift into the interstitial spaces. There is an apparent hemodilution due to flow of extravascular fluid into the circulation when a person assumes a recumbent position after sitting or standing.30 In addition, there is some hemodilution to compensate for the volume depletion due to the phlebotomy, which results in lowering of the mean venous hct. Thus, post-donation VSs tend to show lowered Hb and hct as compared to those obtained before phlebotomy. Nevertheless, obtaining a pre-donation VS is non-pragmatic as an additional venipuncture is not acceptable to most blood donors and accessing the blood collection set may risk the blood unit to bacterial contamination. Wood et al14 found a difference of 1.2% in hct, and Boulton et al31 have found a difference of 0.35 g/dL in Hb levels of pre-donation and post-donation samples.
Biological variability
Besides age, sex and race, the Hb level varies with smoking and physical activity. Black people have a ~1 g/dL lower Hb level, whereas smokers and those living at a higher altitude have a higher Hb level. Shifts in intravascular fluids also lead to diurnal and seasonal variation in Hb levels. Mean hct has been found to be 3% lower in summer as compared to winter due to hemodilution.32
Methods for Hb estimation in blood donors
The venous Hb level of a donor drops by 1–1.5 g/dL after blood donation. Thus, a screening test should be sensitive enough to detect donors with preexisting anemia or who may be rendered anemic after blood donation. Since every single blood unit matters for a blood bank, it should also be able to avoid unnecessary deferrals, should be smoothly incorporable into the operational practices and should have a reasonable cost. Donor discomfort should be minimum, handling should be easy and should be portable so as to be applicable in mobile settings. Several methods for Hb estimation of blood donors have evolved in the last few decades, each having its own set of advantages and disadvantages.
Copper sulfate gravimetric method
This method is based on the estimation of specific gravity of blood, assuming that the donor has normal protein levels. Specific gravity of 1.053 corresponds to an Hb level of 12.5 g/dL. A drop of blood, allowed to fall into a copper sulfate solution of specific gravity 1.053, becomes encased in a sac of copper proteinate, which prevents dispersion of fluid for 15 seconds. If the specific gravity of blood is higher than the solution, the drop will sink or else it will remain suspended for some time. In most cases, this method is capable of estimating Hb within ~0.5 g/dL, which is comparable to a coefficient of variation (CV) of 2%.33
Although the method has withstood the test of time in ease of performance and cost, it is criticized for having a subjective end point. This test also gives false-negative results, very commonly leading to large amounts of inappropriate donor deferrals (50%–70%).34,35 Common sources of error leading to determination of falsely low Hb are incorporation of air bubbles and the use of an inadequate height for dropping the blood. Several studies have advocated the implementation of a supplementary method, such as microhematocrit or portable hemoglobinometer (PH), in order to recover the inappropriate deferrals.22,34–36
Proteins other than Hb are also nonspecifically precipitated by copper sulfate. This may lead to determination of falsely high values of Hb if the subject has abnormally raised protein levels. For each gram of protein increased above the level of 7.4 g/100 mL, an error of 0.7 g will appear in the calculated Hb concentration. There has been a case wherein a donor with <8 g/dL of Hb passed the copper sulfate screening test due to the hyperproteinemia associated with multiple myeloma.37
Proficiency testing methodology for this method is not well established. Quality control of this method can be done by either testing with several anticoagulated samples with hemoglobin determined by a more accurate method or by a well-calibrated hydrometer. The reagent solution should be changed after every 25 tests as each drop of blood alters the specific gravity due to the protein contained.4 Disposal of biohazardous waste material is another concern and should be carried out as per local legislation.
Spun microhematocrit
This has been suggested as an ancillary test to decide eligibility for blood donors who were found to have low Hb on copper sulfate testing.38 Supplementation by this method for donor screening has been found to retrieve 46%–58% of deferred donors,34,39 salvaging a large amount of blood units. Blood is obtained from another finger after a second prick and collected in a capillary tube with an anticoagulant. It is then centrifuged in a microhematocrit centrifuge, and the percentage of packed red blood cells is estimated using an hct reader. Results show variation with the use of mobile or fixed centrifugation equipment,40 anticoagulant solution41 and the diameter of microhematocrit tube used.42 The quoted CV for this method is 3.6%.43 Although inexpensive and easy to use, it requires time of at least 5–7 minutes, which is a limitation for donor screening. A study to compare its performance with more established methods found that the results did not correlate well with either the cyanmethemoglobin or CuSO4 method.44 Another comparative study from Brazil showed that this method had a sensitivity of 39.5% and specificity of 93.2%. Overall, it had a lesser discriminating power for detecting anemia in prospective female blood donors than the HemoCue 201 system (HemoCue AB, Angelholm, Sweden).23
Hemoglobin color scale (HCS)
It was developed in 1995 as an inexpensive, simple alternative, intended for initial screening of anemia in field conditions where elaborate laboratory equipment was not available. The HCS uses a strip of chromatography paper and a standard color chart. The method compares the color of a drop of blood absorbed onto chromatography paper with colors on standard chart, varying from pink to dark red. These colors correspond to Hb levels of 4, 6, 8, 10, 12 and 14 g/dL. Intermediate shades can be identified, allowing Hb levels to be judged to 1 g/dL.45
The method has been found to be useful and convenient for anemia screening in field conditions according to many community studies,46,47 but its accuracy remains questionable. While cost, simplicity and portability add attractive propositions, the method has been found to have very low sensitivity and specificity for screening of Hb prior to blood donation.48 An Indian study has reported 25.2% false results with this method,36 whereas another study from the UK reports that only 46.08% results by this method were accurate.49 Given that the result interpretation by this method is subject dependent, a lot of factors may account for the inaccuracy such as reading of results in dim light and fading of standard cards. Another limitation for use in blood banks is its non-readability for intermediate value, i.e., a Hb value of 12.5 g/dL.
Cyanmethemoglobin (HiCN) method
This is the reference method for Hb determination in laboratories and for the calibration of hemoglobinometers. The principle is conversion of Hb to HiCN by the addition of potassium cyanide and ferricyanide whose absorbance is measured at 540 nm in a photoelectric calorimeter against a standard solution.50 The main cause of error in this method is sample dilution and presence of turbidity when measured at a single wavelength. As this method is time consuming, tedious and dependent on toxic cyanide reagents, it is no longer used in blood banks for Hb estimation.
Automated hematology analyzers
Automated hematology analyzers can provide high precision and enable high-sample throughputs but require regular maintenance, control of calibration, trained personnel and stable climatic conditions to operate them. A high cost of equipment and reagents is another constrain in developing countries. Hb determination is done by HiCN or the oxyhemoglobin method. In the former, the blood specimen is diluted with a reagent containing ferricyanide and cyanide, which converts Hb to HiCN. The absorbance of the HiCN at 540 nm wavelength is then used for quantitation. In the latter, the blood specimen is diluted with an aqueous solution tetrasodium salt of ethylenediaminetetraacetic acid (EDTA) and mixed with air to convert Hb to oxyhemoglobin. The absorbance of oxyhemoglobin at 540 nm is then measured. A typical analyzer working on venous blood has a CV of ≤1.2% for Hb measurement.51
These analyzers have become increasingly sophisticated in the last few decades with the incorporation of noncyanide methods. Hb determination is done using sodium lauryl sulfate (SLS), a surfactant that dissolves lipoproteins of the cell membrane of the red blood cells to release Hb and converts it into SLS-Hb. Concentration of SLS-Hb is measured as light absorbance and is calculated by comparison with the absorbance of the diluent measured before the sample is added.52 This method is however not suitable for routine donor screening because of non-portability, high cost and especially the need to perform additional phlebotomy to obtain venous blood.
PHs
Point-of-care testing has suitably replaced traditional laboratory setup in the modern health care arena. PH provides easy and convenient Hb estimation based on spectrophotometric reading. In earlier generation devices (HemoCue 201 and HemoControl [EKF Diagnostics, GmbH, Barleben, Germany]), the blood drop is placed on a cuvette where sodium deoxycholate hemolyzes erythrocytes and Hb is released. Sodium nitrite converts Hb to met-Hb, which together with sodium azide gives azide-met-Hb. The absorbance is measured at two wavelengths (565 and 880 nm) in order to compensate for turbidity in the sample. They are standardized against the International Committee for Standardization in Hematology HiCN method, and the CV is 1.5%.53 Studies testing the accuracy and precision of these devices have found good agreement of the HemoCue PH to hematology analyzers with correlation as high as 99% in the hands of trained operators.54–56
Sources of error are incomplete filling, trapping of air bubbles and moisture. If a microcuvette contains the air bubbles in the optical eye (the portion through which the spectrophotometric measurement is taken), erroneously low readings could be produced. Readings must be taken within 10 minutes of filling the microcuvette, otherwise false results may also be obtained. The first drop of blood from finger prick should never be used in order to avoid the chances of hemolysis of blood cells coming in contact with alcohol on the prepared skin surface. High humidity has been shown to bias the function and Hb measurements by azide-met-Hb-based systems. Cuvettes should be stored in a carefully closed canister with desiccant and removed directly before usage. An Australian study has reported that cuvettes exposed to a high humidity for ≥4 days may underestimate Hb by as much as 2 g/dL by HemoCue 201.57
These limitations have been mitigated in newer modified devices (Hemocue 301 [HemoCue AB] and DiaSpect Hemoglobin T [DiaSpect Medical GmbH, Sailauf, Germany]) using reagent-free cuvettes, which measure the absorbance of whole blood photometrically at the 506 nm isosbestic point – the wavelength in which the absorbance of the two main Hb derivatives, oxy-hemoglobin (HbO2) and deoxyhemoglobin, is the same and at 880 nm to compensate for turbidity. The reagent-free polystyrene cuvettes are not affected by the wide range of temperatures (10°C–40°C) and humidity and do not require special storage conditions. A study done in India to compare the performance of HemoCue 301 system at varied temperatures found that the device can function optimally even at temperatures >35°C and thus is suitable for use in outdoor blood donation camps in tropical counties.58 In addition, these cuvettes are cheaper and provide results more rapidly (<10 seconds).
Arrays of studies have been conducted to compare the performance of PH against various other methods of Hb estimation (Table 4). In most studies, Hb values are found to be increased by PH than the reference Hb values. In an effort to determine the source of this deviation, Bahadur et al24 compared the performance of HemoCue (model not specified) using capillary and venous blood. The capillary blood HemoCue values correlated neither with the cell counter values nor with the venous blood HemoCue values. On the other hand, there was a good correlation between venous HemoCue values and cell counter values, questioning the reliability of capillary blood. Gómez-Simón et al59 evaluated the performance of three PHs (HemoCue, STAT-Site MHgb and CompoLab HB system) and attributed the inaccuracy in their performance mainly to the use of capillary blood.
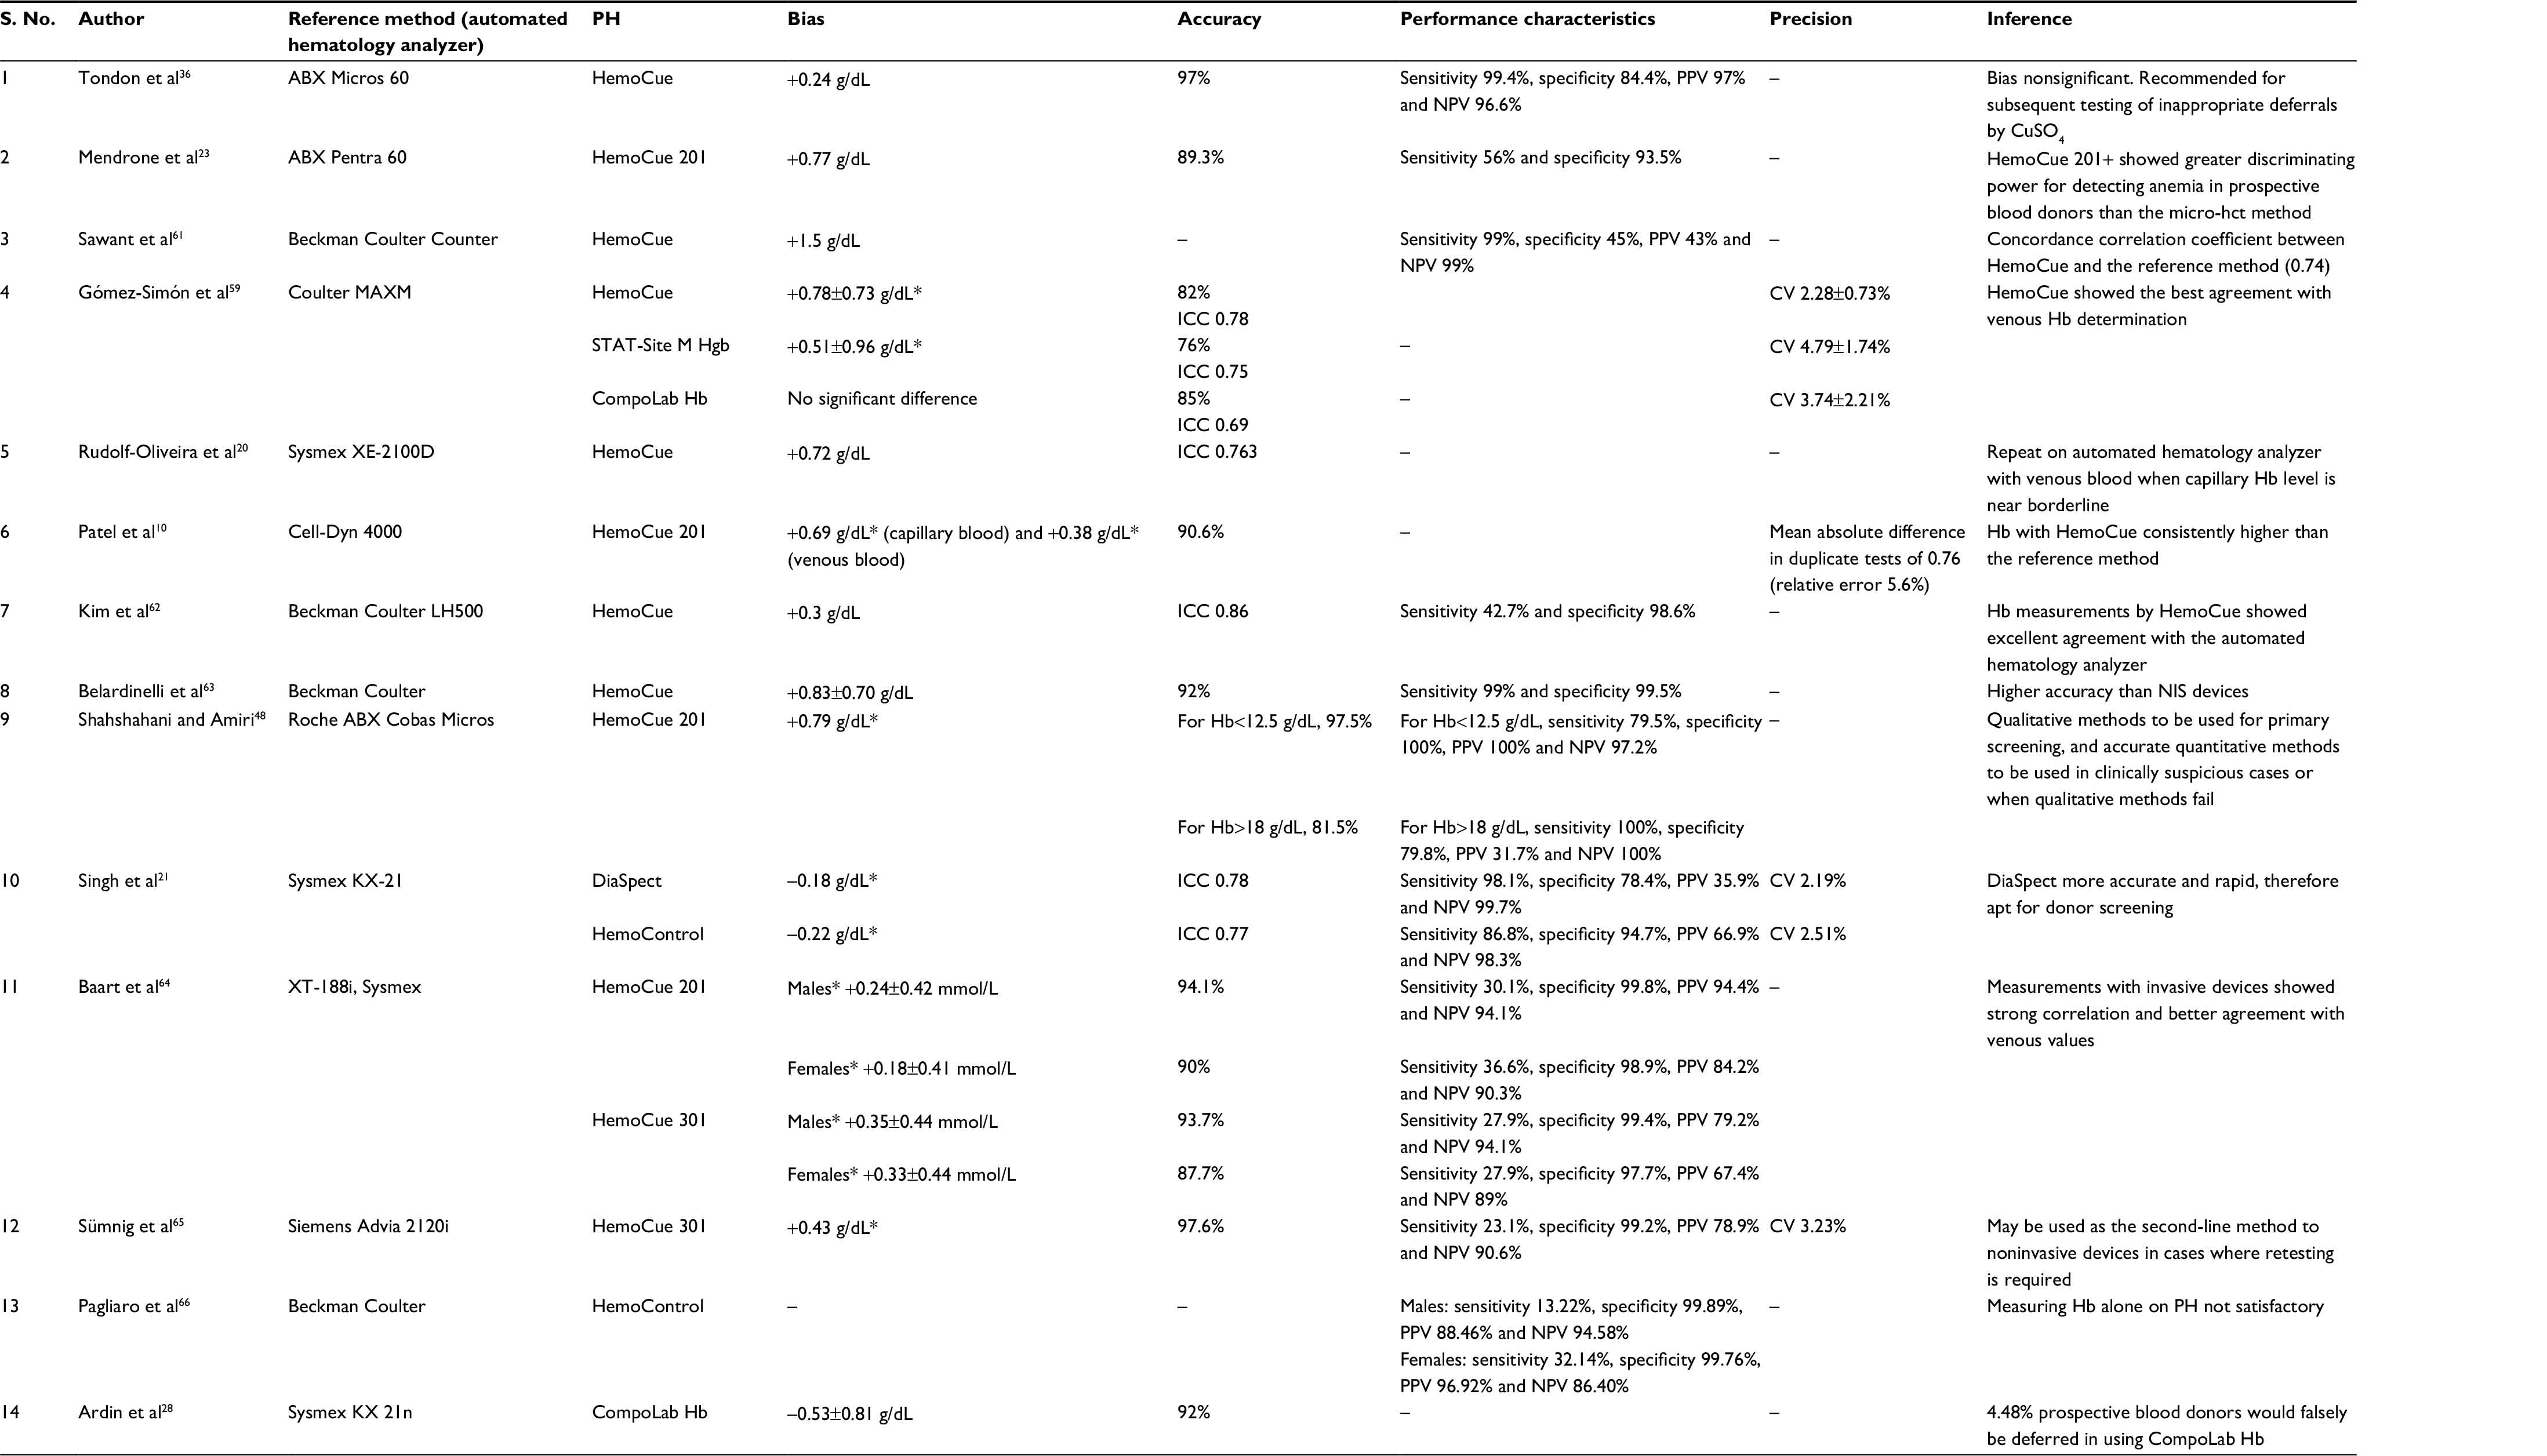 | Table 4 Evaluation of performance of PH for blood donor Hb screening Note: *Statistically significant difference between PH and the reference Hb value (p<0.05). Data presented as mean ± standard deviation. Abbreviations: PH, portable hemoglobinometer; Hb, hemoglobin; hct, hematocrit; CV, coefficient of variation; NIS, noninvasive spectrophotometry; PPV, positive predictive value; NPV, negative predictive value; ICC, intraclass correlation coefficient. |
An Iranian study48 reported that as Hb increased above the cutoff level (12.5 g/dL), the discrepancy between the Hb levels measured with HemoCue 201+ (HemoCue AB) and the reference method also increased, and at levels >18 g/dL, there was no significant correlation between the two. At Hb levels <12.5 g/dL, there was a strong correlation between HemoCue 201+ and reference method measurements. The discriminating power for detecting anemia was greater for the capillary samples (79.5%) as compared to the VSs (64%).
A study by Morris et al55 evaluated the performance, reproducibility and accuracy of HemoCue 301+ (HemoCue AB, Angelholm, Sweden) for donor Hb measurement. The device is a modified version with cheaper reagent-free cuvettes, which are claimed to show no deterioration even in adverse climate. The authors reported an excellent linearity over a wide range of Hb levels (40–180 g/L) and a low level of imprecision (CV 0.4%–0.7%).
A Canadian study60 performed to assess the accuracy and precision of DiaSpect hemoglobin analyzer (DiaSpect Medical GmbH) in comparison to HemoCue 201 photometer found greater efficiency, improved ease of use and decreased deferrals. In terms of accuracy, correlation coefficients were similar between DiaSpect and reference methods (0.736) and between HemoCue and reference methods (0.856). In terms of precision, the CV ranged from 0.81% to 1.18% per sample for the HemoCue method and from 0.53% to 1.14% per sample for the DiaSpect method.
We had conducted a study21 at our center to evaluate the performance of DiaSpect Hemoglobin T and HemoControl PH. Neither of the two devices passed any donor with the Hb level <11 g/dL. Hb values measured in venous blood by HemoControl and DiaSpect were significantly higher than the corresponding values on the standard device, which may be due to differing testing principles of the devices and automated cell counter. DiaSpect and HemoControl showed CV of 2.2% and 2.5%, respectively.
Noninvasive spectrophotometry (NIS)
It has been introduced with the aim of preventing pain to blood donor, which deters most blood donors from donating blood. Other than avoiding venipuncture, this method also minimizes the risk of infection for health care workers, reduces the need for trained personnel, eliminates the generation of biohazardous waste, cuts down on consumables and is sampling error proof. The device automatically and continuously performs a self-test and calibration check during measurement sessions.
Presently, there are three technologies that use spectrophotometry for Hb measurement, differing in the type of sensor. One is occlusion spectroscopy (NBM 200; OrSense Co., Petah-Tikya, Israel), which is a portable device operative via a ring-shaped sensor, fitted on the donor’s finger. The pneumatic cuff applies pressure and temporarily stops the blood flow, creating an optical signal and yielding a high signal-to-noise ratio. Optical elements in multi-wavelength sensor perform a sensitive measurement of the light transmitted through the finger, in the wavelengths between 600 and 1500 nm. The differential light absorption, before and after blood flow obstruction in the finger, is used to determine the Hb level.
Another technology called pulse CO-oximetry (Pronto-7; Masimo Co, Irvine, CA, USA) places a multi-wavelength pulse CO-oximetry sensor over the individual’s fingertip, which acquires blood constituent data based on light absorption through a finger probe. Based on the light attenuation characteristics, the device calculates Hb. Adequate perfusion rate is required to measure Hb levels. Dark skin color and metallic nail polishes may interfere with the results. To obviate these biases, an optimization of the software and reconstruction of the sensor are recommended.
The third technology is based on transcutaneous reflection spectroscopy (HemoSpect; MBR Optical Systems GmbH & Co. Wuppertal, Germany). It is a handheld device that uses a button sensor that adheres to the palm side of the finger of the nondominant hand. A sensor head placed on the skin projects a white light into the underlying tissue, via a waveguide. Some of the projected light is absorbed by the various components of tissue, while some of it is reflected back to the device. The spectrometer breaks the light down into its separate wavelengths, and an electronic evaluation unit connected to the system analyses the quantitative Hb value.
One study has compared all three NIS methods for Hb estimation of blood donors.28 Inappropriate donor referrals were 3.31% by HemoSpect, 5.83% by NBM 200 and 12.73% by Pronto-7. Based on lower susceptibility to failure, HemoSpect was approved by authors for donor screening at their blood center.
Several studies have been published comparing NIS point of care Hb estimation methods with standard practices in order to establish their accuracy, bias and precision (Table 5). Most studies have reported an overestimation of Hb measurements and have found lesser concordance with Hb values by the reference method as compared to PH.21,62,63
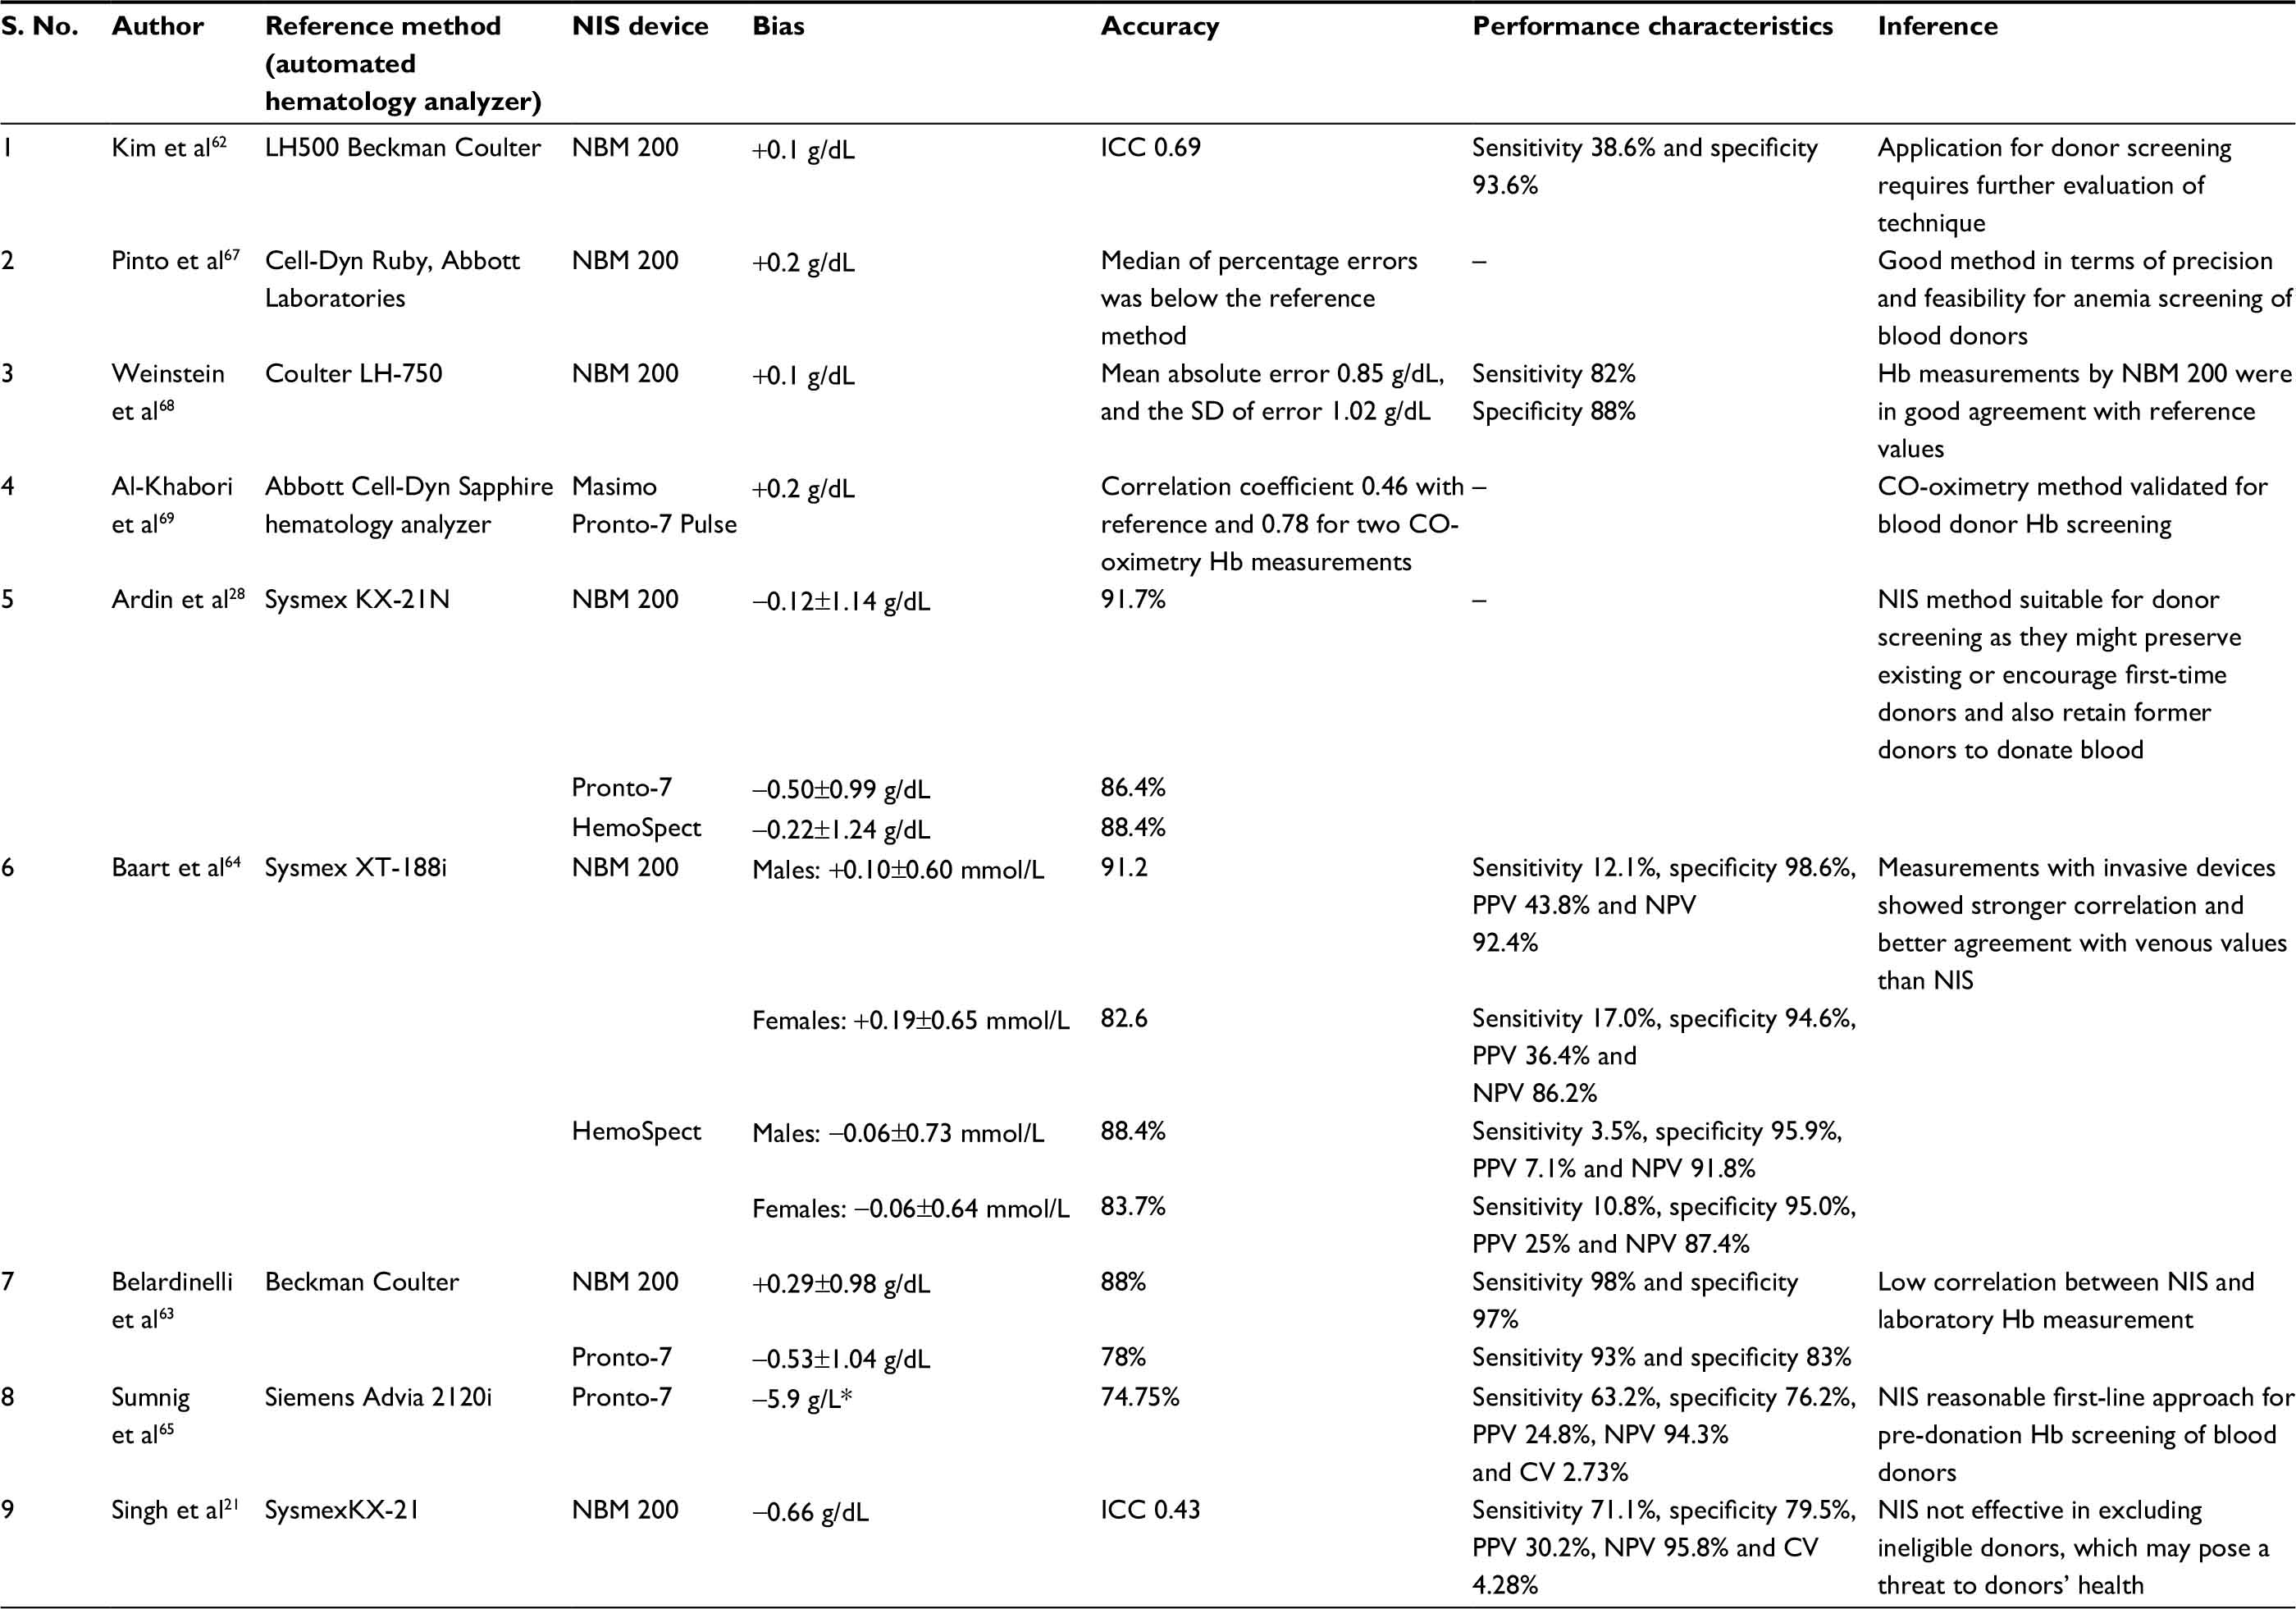 | Table 5 Evaluation of performance of NIS for blood donor screening Note: Data presented as mean ± standard deviation. Abbreviations: ICC, intraclass correlation coefficient; NIS, noninvasive spectrophotometry; SD, standard deviation; Hb, hemoglobin; CV, coefficient of variation; PPV, positive predictive value; NPV, negative predictive value. |
Baart et al64 studied the effect of skin color on differences between Hb measurements with the noninvasive test devices and the reference measurement. They found that darker skin color resulted in a smaller difference from reference for NBM 200 and HemoSpect. Similarly, smoking resulted on average in a 0.1 mmol/L smaller difference from reference values because of carboxyhemoglobin formation in smokers, which is measured with lower sensitivity by the noninvasive devices, leading to lower estimates of total Hb. The variation with oxygen saturation in blood donors has not been documented as the differences are too small to be discerned in normal healthy donors. Likewise, the frequency of hand or finger abnormalities in normal donors is too low to detect any potential effect.
Strategies and combination of techniques
Various studies have been done to establish alternatives to conventional Hb screening in an effort to reduce donor inconvenience and inappropriate deferrals. These include adoption of a combination of established techniques or varied algorithms.
Lotfi et al70 attempted to estimate blood donors’ eligibility while saving time and avoiding donors with acceptable Hb from being unnecessarily tested by finger prick. A venous blood sample was collected from donors at the end of their donation, and a post-donation Hb determination was performed with an automated hematology analyzer. Donors who qualified the criterion were permitted to donate after 6 weeks without any pre-donation Hb measurement. Donors with low post-donation Hb values were permitted to donate only after a pre-donation venous Hb determination. The sensitivity and specificity of this approach evaluated for >19,000 donors were 92.6% and 37.9%, respectively. It also saved 97% of donors from being tested unnecessarily by the capillary Hb measurement. This study was however criticized for phlebotomizing the donors at a very short interval.71 The predictive value of a previous Hb value will decrease obviously as the pre-donation interval will increase in routine settings.
Ziemann et al72 had also implemented a similar non-invasive strategy using historical Hb values, wherein pre-donation testing by venous blood was done only for donors with previous Hb values <12.9 g/dL for females or 13.9 g/dL for males. All others were allowed to donate without undergoing current Hb testing. A subsequent Hb testing for all donor candidates was done using blood in a diversion pouch of blood bag. They found this approach to be 95% accurate with a sensitivity of 57% and a specificity of 29%.
Pagliaro et al66 had used NBM 200 for Hb screening of all blood donors, and a hemocytometry test was added on a pre-donation VS drawn from donors who, though fit to donate, had critical Hb values in their previous record. The authors found this approach to improve donor selection efficiency and reduce inappropriate donations, particularly by female donors.
Future directions
A method to qualify as quintessential for blood donor screening should be valid, quick, easy to perform, donor friendly, cost effective, portable, reagent free, pre-analytical error proof and operable by all. None of the currently available devices for Hb screening offer such a miraculous package. Sneak peek into the emerging techniques provides some hope for the future. A number of smartphone applications have been developed that can estimate the Hb level noninvasively using smartphone camera and a light source. Hb measurement is done by chromatic analysis of the blood at the fingertip by measuring the absorption properties of the blood at different wavelengths of light. The ubiquity of smartphone makes this technique easily deployable. Besides, substantial amount of research is being done to refine optical and imaging-based sensing for evaluating Hb levels, which offer a great promise in time to come.
To conclude, in addition to numerical cutoff values, adequate attention should be focused on the selection of methodology and guidelines should be set so as to define the minimum standards of its optimum functioning. A standard protocol should be in place for each blood collection center to check the quality of results produced in the form of minimum acceptable performance characteristics. For obtaining optimum results using any validated technique, it is of foremost importance to avoid pre-analytical errors in the first place. For e.g., if using finger-stick blood sample, squeezing should be avoided; first, drop of blood should be wiped off and operator should be well trained in the use of lancet so as to penetrate a uniform depth. Since all the prevailing techniques in recent times are sufficiently convenient and accurate, greater emphasis should be focused on their robustness in day-to-day operations, competency of the staff in obtaining reliable outcomes, regular proficiency testing of the results, meticulous documentation and maintenance of data base. The technical personnel operating the device should be adequately trained in terms of test requirements, performance, limitations and potential interferences. Proficiency testing should be established for continuous monitoring of the quality of results with internal quality controls and external quality assessment.
Each blood centre should develop its own algorithm for donor screening based on donors population characteristics (ethnicity, proportion of female donors, repeat donation frequency etc), and economic feasibility. Looking at the ergonomics, noninvasive devices may seem to be a lucrative option both for donors and health care providers. However, implementing them as the sole method for donor screening at present may prove somewhat precarious. They may be implemented for primary screening of repeat donors after reviewing blood donors’ previous Hb level. If the previous or presently tested Hb level falls near borderline, it should be repeated on a more sensitive invasive device. For all first-time donors, Hb screening should be done on a validated point-of-care invasive device.
There are a few limitations of this review. One is that some of the cited publications lack a suitable statistical method for comparing these techniques. Second, in a few publications, model of equipment (especially HemoCue) has not been specified. Moreover, cutoff Hb guidelines and hence interpretation of results vary with the geographic location of the center where the study is carried out.
Disclosure
The authors report no conflicts of interest in this work.
References
Saxena S, Wong ET. Heterogeneity of common hematologic parameters among racial, ethnic and gender subgroups. Arch Pathol Lab Med. 1990;114(4):715–719. | ||
Radtke H, Polat G, Kalus U, Salama A, Kiesewetter H. Hemoglobin screening in prospective blood donors: comparison of different blood samples and different quantitative methods. Transfus Apher Sci. 2005;33(1):31–35. | ||
United States Code of Federal Regulations, Title 21, 640.3 (b) (3). | ||
Fung KM, Grossman BJ, Hillyer CD, Westhofl CM. Whole blood collection and component processing. American Association of Blood Banks (AABB) Technical Manual. 18th ed. Bethesda, MD: 2014. | ||
TSO. Guidelines for the Blood Transfusion Services in the United Kingdom. 7th ed. London: TSO; 2005. | ||
Council of Europe. Guide to the Preparation, Use and Quality Assurance of Blood Components. 18th ed. Strasbourg, France: Council of Europe; 2007. | ||
Japanese Red Cross Society. Blood Services 2016. Available from: http://www.bpro.or.jp/english/pdf_annual/BPRO2001.pdf. Accessed June 2, 2017. | ||
Ministerio da Saude. Gabinete do Ministro. Portaria no. 1.353, de 13 de junho de 2011. Aprova o RegulamentoTecnico de ProcedimentosHemoterapicos. Brasilia, DF: DiarioOficial da Uniao; 2011. | ||
The Drugs and Cosmetics Act 1940 and the Drugs and Cosmetics Rules 1945, Amendment upto September 30, 1999. | ||
Patel AJ, Wesley R, Leitman SF, Bryant BJ. Capillary versus venous haemoglobin determination in the assessment of healthy blood donors. Vox Sang. 2013;104(4):317–323. | ||
Bruckmann G. Blood from the ear lobe; preliminary reports. J Lab Clin Med. 1942;27:487. | ||
Lucy HC. Fortuitous factors affecting the leucocyte count in blood from the ear. J Clin Pathol. 1950;3:146–151. | ||
Avoy DR, Canuel ML, Otton BM, Mileski EB. Hemoglobin screening in prospective blood donors: a comparison of methods. Transfusion. 1977;17(3):261–264. | ||
Wood EM, Kim DM, Miller JP. Accuracy of predonation Hct sampling affects donor safety, eligibility, and deferral rates. Transfusion. 2001;41(3):353–359. | ||
Coburn TJ, Miller WV, Parrill WD. Unacceptable variability of hemoglobin estimation on samples obtained from ear punctures. Transfusion. 1977;17(3):265–268. | ||
Pi DW, Krikler SH, Sparling TG, Carter CJ, Wadsworth LD. Reappraisal of optimal hemoglobin standards for female blood donors in Canada. Transfusion. 1994;31(1):7–10. | ||
Darragh E, McSweeney E, Ekin C, Kinsella A, Murphy WG. The capillary haemoglobin level is a more physiological measure than the venous level and is less susceptible to seasonal fluctuation when the donor haemoglobin level is close to the regulatory cut-off. Transfus Med. 2006;16(s1):13–14. | ||
Schalk E, Heim MU, Koenigsmann M, Jentsch-Ullrich K. Use of capillary blood count parameters in adults. Vox Sang. 2007;93(4):348–353. | ||
Ziemann M, Lizardo B, Geusendam G, Schlenke P. Reliability of capillary hemoglobin screening under routine conditions. Transfusion. 2011;51(12):2714–2719. | ||
Rudolf-Oliveira RC, Gonçalves KT, Martignago ML, et al. Comparison between two portable hemoglobinometers and a reference method to verify the reliability of screening in blood donors. Transfus Apher Sci. 2013;49(3):578–582. | ||
Singh A, Dubey A, Sonker A, Chaudhary R. Evaluation of various methods of point-of-care testing of haemoglobin concentration in blood donors. Blood Transfus. 2015;13(2):233–239. | ||
Ross DG, Gillfillan AC, Housten DE, Heaton WA. Evaluation of haemoglobin screening methods in prospective blood donors. Vox Sang. 1986;50(2):78–80. | ||
Mendrone A, Sabino EC, Sampaio L, et al. Anemia screening in potential female blood donors: comparison of two different quantitative methods. Transfusion. 2009;49(4):662–668. | ||
Bahadur S, Jain S, Jain M. Estimation of hemoglobin in blood donors: a comparative study using hemocue and cell counter. Transfus Apher Sci. 2010;43(2):155–157. | ||
Daae LN, Halvorsen S, Mathisen PM, Mironska K. A comparison between haematological parameters in ‘capillary’ and venous blood from healthy adults. Scand J Clin Lab Invest. 1988;48:723–726. | ||
Jacob G, Raj SR, Keitch T, et al. Postural pseudoanemia: posture-dependent change in hematocrit. Mayo Clin Proc. 2005;80(5):611–614. | ||
Tong E, Murphy WG, Kinsella A, et al. Capillary and venous haemoglobin levels in blood donors: a 42-month study of 36 258 paired samples. Vox Sang. 2010;98(4):547–553. | ||
Ardin S, Störmer M, Radojska S, Oustianskaia L, Hahn M, Gathof BS. Comparison of three noninvasive methods for haemoglobin screening of blood donors. Transfusion. 2015;55(2):379–387. | ||
Cable RG, Steele WR, Melmed RS, et al; NHLBI Retrovirus Epidemiology Donor Study-II (REDS-II). The difference between fingerstick and venous hemoglobin and hematocrit varies by sex and iron stores. Transfusion. 2012;52(5):1031–1040. | ||
Eisenberg S. Effect of posture and position of the venous sampling site on the hematocrit and serum protein concentration. J Lab Clin Med. 1963;61:755–760. | ||
Boulton FE, Nightingale MJ, Reynolds W. Improved strategy for screening prospective blood donors for anaemia. Transfus Med. 1994;4(3):221–225. | ||
Thirup P. Haematocrit: within-subject and seasonal variation. Sports Med. 2003;33(3):231–243. | ||
Cable RG. Hb screening of blood donors: how close is close enough? Transfusion. 2003;43(3):306–308. | ||
Keating LJ, Gorman R, Moore R. Hemoglobin and hematocrit values of blood donors. Transfusion. 1967;7(6):420–424. | ||
Pirofsky B, Nelson HM. The determination of hemoglobin in blood banks. Transfusion. 1964;4:45–49. | ||
Tondon R, Verma A, Pandey P, Chaudhary R. Quality evaluation of four hemoglobin screening methods in a blood donor setting along with their comparative cost analysis in an Indian scenario. Asian J Transfus Sci. 2009;3(2):66–69. | ||
Mannarino AD, MacPherson AR. Copper sulfate screening of blood donors: report of a donor passing the test with less than eight grams of hemoglobin. Transfusion. 1963;3:398–400. | ||
Kliman A. The microhematocrit test as a method for evaluating deferment by copper sulfate. Transfusion. 1967;7(6):425–431. | ||
Bravo J, Hsueh Y, Gordeuk V, Querin J, Brittenham G, Keating L. Second fingerstick: a simple method to increase the blood supply. Transfusion. 1990;30(5):474–476. | ||
Ross DG, Ross WB, Schreiner DE, Heaton WA. Rejection of prospective blood donors due to systematic errors in hematocrit measurement. Transfusion. 1983;23(1):75–77. | ||
Gotch F, Torres L, Evans M, et al. Comparison of conductivity measured haematocrit to microhematocrit. Am Soc Artif Intern Organs Trans. 1991;37(3):138–139. | ||
Solomon HM, Grindon AJ. The effect of capillary tube diameter on microhematocrit value. Transfusion. 1986;26(2):199–202. | ||
Separation Technology. Hematachek Micro-Hematocrit Reference Control Direction Insert. Altamonte Springs, FL: Separation Technology; 2002. | ||
Perkins HA, Torg B. Standards for rejection of blood donors: a comparison of CuSO, specific gravity, microhematocrit and electronic hematocrit values with hemoglobin values by the cyanmethemoglobin technic. Transfusion. 1962;2:392–397. | ||
Stott GJ, Lewis SM. A simple and reliable method for estimating haemoglobin. Bull World Health Organ. 1995;73(3):369–373. | ||
Lindblade KA, Mwololo K, van Eijk AM, et al. Evaluation of the WHO Haemoglobin Colour Scale for diagnosis of anaemia in children and pregnant women as used by primary health care nurses and community health workers in western Kenya. Trop Med Int Health. 2006;11(11):1679–1687. | ||
Aldridge C, Foster HM, Albonico M, Ame SM, Montresor A. Evaluation of the diagnostic accuracy of the Haemoglobin Colour Scale to detect anaemia in young children attending primary healthcare clinics in Zanzibar. Trop Med Int Health. 2012;17(4):423–429. | ||
Shahshahani HJ, Amiri F. Validity of hemoglobincolor scale in blood donor screening based on Standard Operating Procedures of Iranian Blood Transfusion Organization. Sci J Blood Transfus Organ. 2009;5(4):281–286. | ||
Paddle JJ. Evaluation of the Haemoglobin colour Scale and comparison with the HemoCue haemoglobin assay. Bull World Health Organ. 2002;80(10):813–816. | ||
Elwood PC, Jacobs A. Haemoglobin estimation: a comparison of different techniques. Br Med J. 1966;1(5478):20–24. | ||
Abbott Diagnostics. Operations Manual, Cell-Dyn 1700 System. Abbott Park, IL: Abbott Diagnostics; 1995. | ||
Oshiro I, Takenaka T, Maeda J. New method for hemoglobin determination by using sodium lauryl sulfate (SLS). Clin Biochem. 1982;15(2):83–88. | ||
HemoCue AB [homepage on the Internet]. Available from: www.hemocue.com. Accessed November 19, 2016. | ||
Neville RG. Evaluation of portable haemoglobinometer in general practice. BMJ (Clin Res Ed). 1987;294(6582):1263–1265. | ||
Morris LD, Osei-Bimpong A, McKeown D, Roper D, Lewis SM. Evaluation of the utility of the HemoCue 301 haemoglobinometer for blood donor screening. Vox Sang. 2007;93(1):64–69. | ||
Bäck SE, Magnusson CG, Norlund LK, von Schenck HH, Menschik ME, Lindberg PE. Multiple-site analytic evaluation of a new portable analyzer, HemoCue Hb 201+, for point-of-care testing. Point Care. 2004;3(2):60–65. | ||
Nguyen HT. High humidity affects HemoCue cuvette function and HemoCue haemoglobin estimation in tropical Australia. J Paediatr Child Health. 2002;38(4):427–428. | ||
Dubey A, Murti S. Validation of a hemoglobinometer for use in outdoor blood donation camps. Asian J Transfus Sci. 2016;10(2):164–165. | ||
Gómez-Simón A, Navarro-Núñez L, Pérez-Ceballos E, et al. Evaluation of four rapid methods for hemoglobin screening of whole blood donors in mobile collection settings. Transfus Apher Sci. 2007;36(3):235–242. | ||
Goldman M, Uzicanin S, Yi QL, Acker J, Ramirez-Arcos S. Validation and implementation of a new hemoglobinometer for donor screening at Canadian Blood Services. Transfusion. 2012;52(7):1607–1613. | ||
Sawant RB, Bharucha ZS, Rajadhyaksha SB. Evaluation of hemoglobin of blood donors deferred by the copper sulphate method for haemoglobin estimation. Transfus Apher Sci. 2007;36(2):143–148. | ||
Kim MJ, Park Q, Kim MH, Shin JW, Kim HO. Comparison of the accuracy of noninvasive hemoglobin sensor (NBM-200) and portable hemoglobinometer (HemoCue) with an automated hematology analyzer (LH500) in blood donor screening. Ann Lab Med. 2013;33(4):261–267. | ||
Belardinelli A, Benni M, Tazzari PL, Pagliaro P. Noninvasive methods for haemoglobin screening in prospective blood donors. Vox Sang. 2013;105(2):116–120. | ||
Baart AM, de Kort WL, van den Hurk K, Pasker-de Jong PC. Hemoglobin assessment: precision and practicability evaluated in the Netherlands – the HAPPEN study. Transfusion. 2016;56(8):1984–1993. | ||
Sümnig A, Hron G, Westphal A, et al. The impact of noninvasive, capillary, and venous haemoglobin screening on donor deferrals and the haemoglobin content of red blood cells concentrates: a prospective study. Transfusion. 2015;55(12):2847–2854. | ||
Pagliaro P, Belardinelli A, Boko V, Salamon P, Manfroi S, Tazzari PL. A non-invasive strategy for haemoglobin screening of blood donors. Blood Transfus. 2014;12(4):458–463. | ||
Pinto M, Barjas-Castro ML, Nascimento S, Falconi MA, Zulli R, Castro V. The new noninvasive occlusion spectroscopy hemoglobin measurement method: a reliable and easy anemia screening test for blood donors. Transfusion. 2013;53(4):766–769. | ||
Weinstein A, Herzenstein O, Gabis E, Korenberg A. Non-invasive screening of anemia using occlusion spectroscopy. Vox Sang. 2010; 99:164a. | ||
Al-Khabori M, Al-Riyami AZ, Al-Farsi K, et al. Validation of a non-invasive pulse CO-oximetry based hemoglobin estimation in normal blood donors. Transfus Apher Sci. 2014;50(1):95–98. | ||
Lotfi R, Wernet D, Starke U, Northoff H, Cassens U. A noninvasive strategy for screening prospective blood donors for anemia. Transfusion. 2005;45(10):1585–1592. | ||
Goldman MR. Another stab at donor haemoglobin screening. Transfusion. 2005;45(10):1552–1553. | ||
Ziemann M, Steppat D, Brockmann C, Washington G, Kirchner H, Schlenke P. Selection of whole-blood donors for hemoglobin testing by use of historical hemoglobin values. Transfusion. 2006;46(12):2176–2183. |
 © 2017 The Author(s). This work is published and licensed by Dove Medical Press Limited. The
full terms of this license are available at https://www.dovepress.com/terms.php
and incorporate the Creative Commons Attribution
- Non Commercial (unported, v3.0) License.
By accessing the work you hereby accept the Terms. Non-commercial uses of the work are permitted
without any further permission from Dove Medical Press Limited, provided the work is properly
attributed. For permission for commercial use of this work, please see paragraphs 4.2 and 5 of our Terms.
© 2017 The Author(s). This work is published and licensed by Dove Medical Press Limited. The
full terms of this license are available at https://www.dovepress.com/terms.php
and incorporate the Creative Commons Attribution
- Non Commercial (unported, v3.0) License.
By accessing the work you hereby accept the Terms. Non-commercial uses of the work are permitted
without any further permission from Dove Medical Press Limited, provided the work is properly
attributed. For permission for commercial use of this work, please see paragraphs 4.2 and 5 of our Terms.