Back to Journals » International Journal of General Medicine » Volume 15
Tea Consumption is Associated with an Increased Risk of Hyperuricemia in an Occupational Population in Guangdong, China
Authors Li R, Zeng L, Wu C, Ma P, Cui H, Chen L, Li Q, Hong C, Liu L ![]() , Xiao L, Li W
, Xiao L, Li W
Received 22 December 2021
Accepted for publication 1 March 2022
Published 10 March 2022 Volume 2022:15 Pages 2747—2757
DOI https://doi.org/10.2147/IJGM.S355253
Checked for plagiarism Yes
Review by Single anonymous peer review
Peer reviewer comments 2
Editor who approved publication: Dr Scott Fraser
Ruining Li,1,2,* Lin Zeng,2,* Chengkai Wu,1,* Pengcheng Ma,3,* Hao Cui,2 Liya Chen,4 Qimei Li,2 Chang Hong,2 Li Liu,1,2 Lushan Xiao,2 Wenyuan Li5
1Big Data Center, Nanfang Hospital, Southern Medical University, Guangzhou, People’s Republic of China; 2Department of Infectious Diseases, Nanfang Hospital, Southern Medical University, Guangzhou, People’s Republic of China; 3Department of Radiation Oncology, Nanfang Hospital, Southern Medical University, Guangzhou, People’s Republic of China; 4Department of Medical Quality Management, Nanfang Hospital, Southern Medical University, Guangzhou, People’s Republic of China; 5Hospital Office, Nanfang Hospital, Southern Medical University, Guangzhou, People’s Republic of China
*These authors contributed equally to this work
Correspondence: Lushan Xiao, Department of Infectious Diseases, Nanfang Hospital, Southern Medical University, Guangzhou, People’s Republic of China, Email [email protected] Wenyuan Li, Hospital Office, Nanfang Hospital, Southern Medical University, Guangzhou, People’s Republic of China, Email [email protected]
Purpose: Chronic hyperuricemia leads to long-term deposition of monosodium urate crystals that may damage the joint structure and affect quality of life. Although hyperuricemia prevalence varies, most studies indicate increased cases of hyperuricemia worldwide. The relationship between hyperuricemia and tea consumption is uncertain. This cross-sectional study investigated the effect of tea consumption on the risk of hyperuricemia in the working population in Guangdong, China.
Patients and Methods: Data on weight, height, blood pressure, laboratory test results, and health questionnaire responses of 7644 adults aged ≥ 18 years were obtained from the health examinee dataset of Nanfang Hospital. The characteristics of subjects with and without hyperuricemia were compared using t-tests or non-parametric Mann–Whitney U-tests for continuous variables and chi-square tests for categorical variables. Relationships between hyperuricemia and participant characteristics (sex, age, education level, smoking history, alcohol consumption, hypertension, body mass index, tea consumption, and other dietary factors) were examined using univariate and multivariate logistic regression models to identify independent risk factors for hyperuricemia.
Results: Tea consumption was associated with a higher risk of hyperuricemia in the crude model (odds ratio [OR] 1.74, 95% confidence interval [CI] 1.48– 2.05, once a month through twice a week vs never, P< 0.001; OR 2.44, 95% CI 2.07– 2.89, ≥ 3 times a week vs never, P< 0.001). The adjusted OR for hyperuricemia was 1.30 (95% CI 1.08– 1.56, P=0.006) in participants who consumed tea once a month through twice a week and 1.35 (95% CI 1.11– 1.64, P=0.003) in those who consumed tea ≥ 3 times a week compared with the “never” reference group after adjusting for sociodemographic factors, anthropometric and biochemical indices, and dietary factors. This relationship remained significant in men but not women in subgroup analysis.
Conclusion: Tea consumption is an independent risk factor for hyperuricemia and is more pronounced in men than women.
Keywords: tea consumption, hyperuricemia, Chinese working population, risk factor
Introduction
Hyperuricemia is an important risk factor for gout and accounts for a large proportion of inflammatory arthritis cases in men.1 Chronic hyperuricemia leads to long-term deposition of monosodium urate crystals that may damage the structure of the joints and affect the quality of life.2 Moreover, hyperuricemia is an independent determinant of cardiovascular disease,3–5 chronic kidney disease,3,6 diabetes,7,8 and all-cause mortality.3,9 Although the prevalence of hyperuricemia varies depending on geographic region, ethnicity, and the research methods used, the findings of most studies indicate an increase in the number of people with hyperuricemia worldwide.10 According to the 2007–2008 US National Health and Nutrition Examination Survey, approximately 21.4% of adults in the US had hyperuricemia.11 A meta-analysis that summarized the results of studies performed in China from 2000 to 2014 showed that 13.3% of the Chinese population suffered from hyperuricemia.12 Furthermore, another study of an eastern Chinese population reported that 20.7% of men and 5.6% of women were affected by hyperuricemia.13 The rising prevalence of hyperuricemia worldwide is now considered an emerging public health problem.14 Therefore, identifying modifiable risk factors for hyperuricemia is crucial to address this public health concern.
Various factors affect the serum uric acid (SUA) concentration, including tea consumption (green, black, or other types) and other dietary factors.15 Studies have shown that low-fat dairy products (eg, milk and yogurt), vegetables, whole grains, nuts and legumes, fruits that are low in sugar, coffee, and vitamin C supplements can decrease SUA levels, while consumption of red meat, fructose-containing beverages, and alcohol can increase the risk of hyperuricemia.16
After water, tea is one of the most popular beverages worldwide, especially in Asia.17 People living in Guangdong province are fond of drinking tea. Findings on the association between tea consumption and SUA levels have been inconsistent in previous studies. For example, some studies have shown that tea consumption can reduce SUA levels in humans15,18 and animals,19 whereas others have demonstrated that tea20 or its extracts18 are associated with a higher SUA level. However, the relationship between tea intake and hyperuricemia remains unclear.20 A non-significant association between tea consumption and hyperuricemia has also been reported.21–23 Therefore, the effect of tea consumption on hyperuricemia requires further clarification.
This study aimed to assess the association between hyperuricemia and frequency of tea consumption in the working population of Guangdong, China, after adjustment for sociodemographic factors, anthropometric and biochemical indices, and dietary factors. We also estimated the risk of hyperuricemia according to sex.
Materials and Methods
Study Population
This cross-sectional study analyzed data from the health examinee dataset held at Nanfang Hospital (Southern Medical University, Guangzhou, China), which contains information on working individuals who visit Nanfang Hospital for health checkups. We extracted the data of individuals aged ≥18 years who visited the hospital between 2015 and 2020. The selection process is shown in Figure 1. In brief, participants with missing data on height and weight (n=170), education level (n=72), smoke (n=50), drink (n=84), biochemical parameters (n=130), and other characteristics (n=137) were excluded. The final sample included data for 3149 individuals with hyperuricemia and 4495 without hyperuricemia. The frequency of tea consumption (green, black, or other types) was investigated.
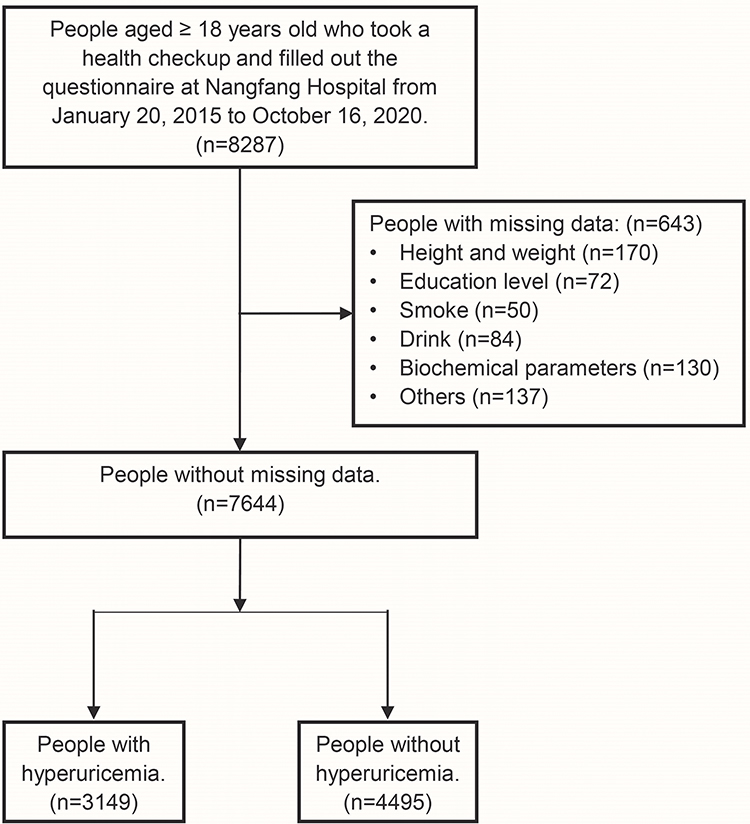 |
Figure 1 The selection of study participants. |
Survey and Measurements
We collected the resultant data from several anthropometric measurements (ie, weight, height, and blood pressure), biochemical tests (ie, SUA, serum creatinine [SCr], cholesterol [CHOL], triglyceride [TG], low-density lipoprotein cholesterol [LDL-C], high-density lipoprotein cholesterol [HDL-C], and fasting blood glucose [FBG]), and a questionnaire. The questionnaire was obtained from Guangdong Provincial Key Area R&D Program (2019B020227004) for large-scale cohort study and clinical sample bank and database construction. All investigations were performed on the same day.
Anthropometric measurements were performed by trained examiners. Body mass index (BMI) was calculated as weight in kilograms divided by the square of height in meters. Blood pressure was measured using a standard mercury sphygmomanometer. Fasting blood samples were collected between 7:00 AM and 9:30 AM after fasting overnight. All participants provided on-site blood samples at the time of their physical examination. Blood samples were centrifuged and separated for clinical laboratory testing; serum lipid profiles along with SUA, SCr, and FBG levels were examined by standard laboratory methods in the same laboratory. Although there is no consensus definition of hyperuricemia based on the SUA level, a diagnosis of hyperuricemia was made if the SUA level was >420 µmol/L in men and >360 µmol/L in women according to previous reports.24–26
Presence of a history of hypertension was determined. Smoking status and alcohol consumption were classified as “yes” and “no”. Education level was classified as senior high school or lower, college level, and bachelor’s degree or higher. In terms of dietary factors, we investigated whether the participants had a salty diet and the frequency of overeating. Midnight snacking was divided into “yes” and “no” categories. The frequencies of barbecue or fried food intake, corned or smoked food consumption, and dining out were categorized as never, 1–2 times per month, and 1–2 times per week or more. According to the distribution of the categories in the study sample, we classified the frequency of tea intake as never, once a month through twice a week, and ≥3 times a week.
Statistical Analysis
The normality of continuous variables was assessed using the Kolmogorov–Smirnov test. Descriptive statistics were calculated for all continuous variables (reported as the mean and standard deviation) and categorical variables (reported as the number and percentage). The characteristics of individuals with and without hyperuricemia were compared using the t-test or the non-parametric Mann–Whitney U-test for continuous variables and the Pearson’s chi-square test for categorical variables. The relationships between hyperuricemia and participant characteristics (sex, age, education level, smoking history, alcohol consumption, hypertension, BMI, tea intake, and other dietary factors) were first examined in a univariate logistic regression model. Variables with a P-value <0.05 in the univariate analysis were entered into a multivariate logical regression model to identify independent risk factors for hyperuricemia. Odds ratios (ORs) for effect estimation were calculated with the 95% confidence intervals (CIs).
Three models were constructed to investigate the effect of tea intake on the risk of hyperuricemia. Potential risk factors were selected for these multivariable models based on the univariate regression analysis (p<0.05) and published literature. There have been reports indicating an association between the risk of hyperuricemia and SCr, CHOL, TG, LDL-C, HDL-C, and FBG levels.13,27–33 The first model was adjusted for age, sex, and BMI. The second model was further adjusted for SCr (μmol/L), CHOL (mmol/L), TG (mmol/L), LDL-C (mmol/L), HDL-C (mmol/L), FBG (mmol/L), and hypertension. The third model was adjusted for model 2 plus educational level, smoking status, alcohol consumption, salty diet, midnight snacking, overeating, frequency of dining out, frequency of barbecue or fried food intake, and frequency of corned or smoked food intake.
Two-tailed statistical analyses were performed using IBM SPSS Statistics for Windows version 26.0 software (IBM Corp., Armonk, NY, USA). A P-value <0.05 was considered statistically significant.
Results
The characteristics of the 7644 study participants are presented in Table 1 and stratified based on the presence of hyperuricemia. In total, 3149 participants had hyperuricemia, which was significantly more common in men (77.7%) than in women (22.3%). SUA levels were normal in 4495 participants. The mean (standard deviation) age was 34.7 (8.9) years. The participants with hyperuricemia were significantly older and had a significantly higher BMI than those without hyperuricemia. There were between-group differences in smoking status, alcohol consumption, and educational level (all P<0.001). Hypertension was more common in the hyperuricemia group than in the control group (4.5% vs 2.2%, P<0.001). Mean values for most of the anthropometric and biochemical indices were within the normal range; however, the average TG level was slightly above the normal range in the hyperuricemia group. Moreover, the mean SCr, CHOL, TG, and LDL-C levels were higher in the hyperuricemia group than those in the control group; there was an inverse correlation for HDL-C. No significant difference was observed in the FBG level between the groups. Between-group differences in dietary factors, including salty diet, midnight snacking, and overeating, along with the frequencies of dining out, intake of barbecue or fried food, and intake of corned or smoked food, were statistically significant (all P<0.05). There was also a difference in the frequency of tea intake between the two groups (P<0.001).
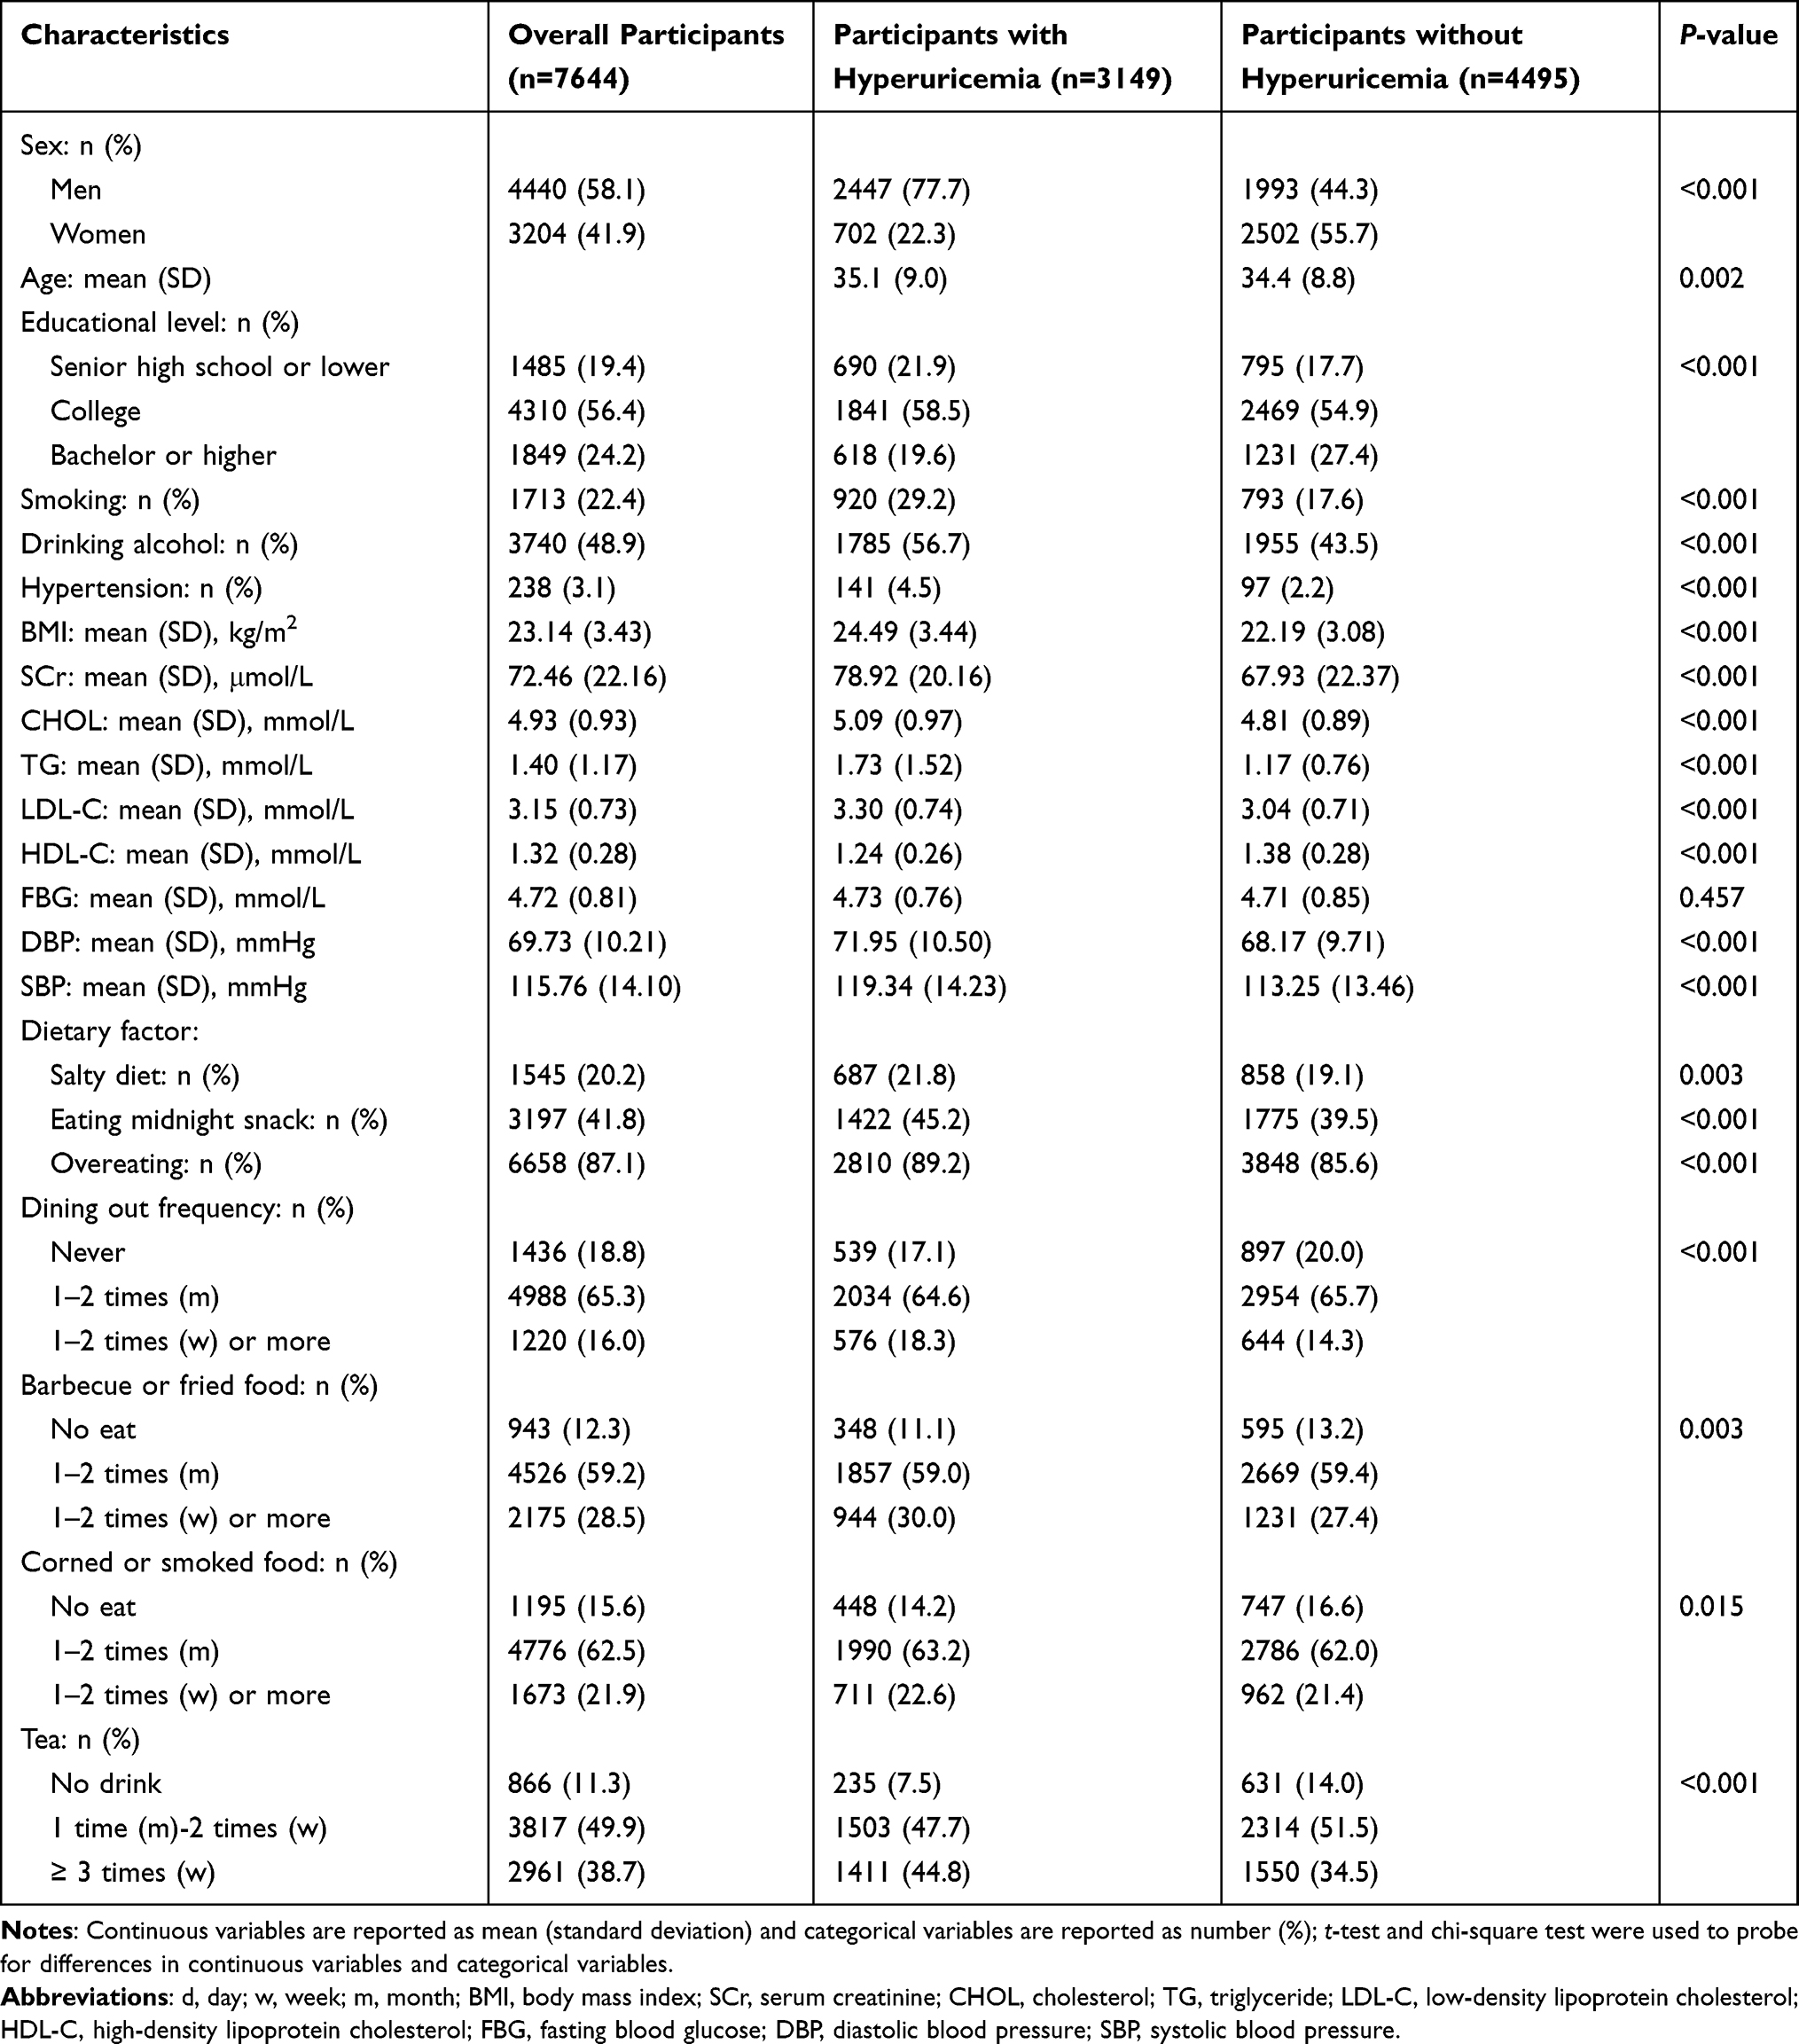 |
Table 1 Characteristics and Comparison Between Subjects with Hyperuricemia and Without Hyperuricemia |
Univariate logistic regression analysis showed a significant association between hyperuricemia and tea intake (OR 1.744, 95% CI 1.481–2.053 for once a month through twice a week vs never, P<0.001; OR 2.444, 95% CI 2.070–2.886 for ≥3 times a week vs never, P<0.001). Other categorical characteristics were also associated with hyperuricemia (Table 2).
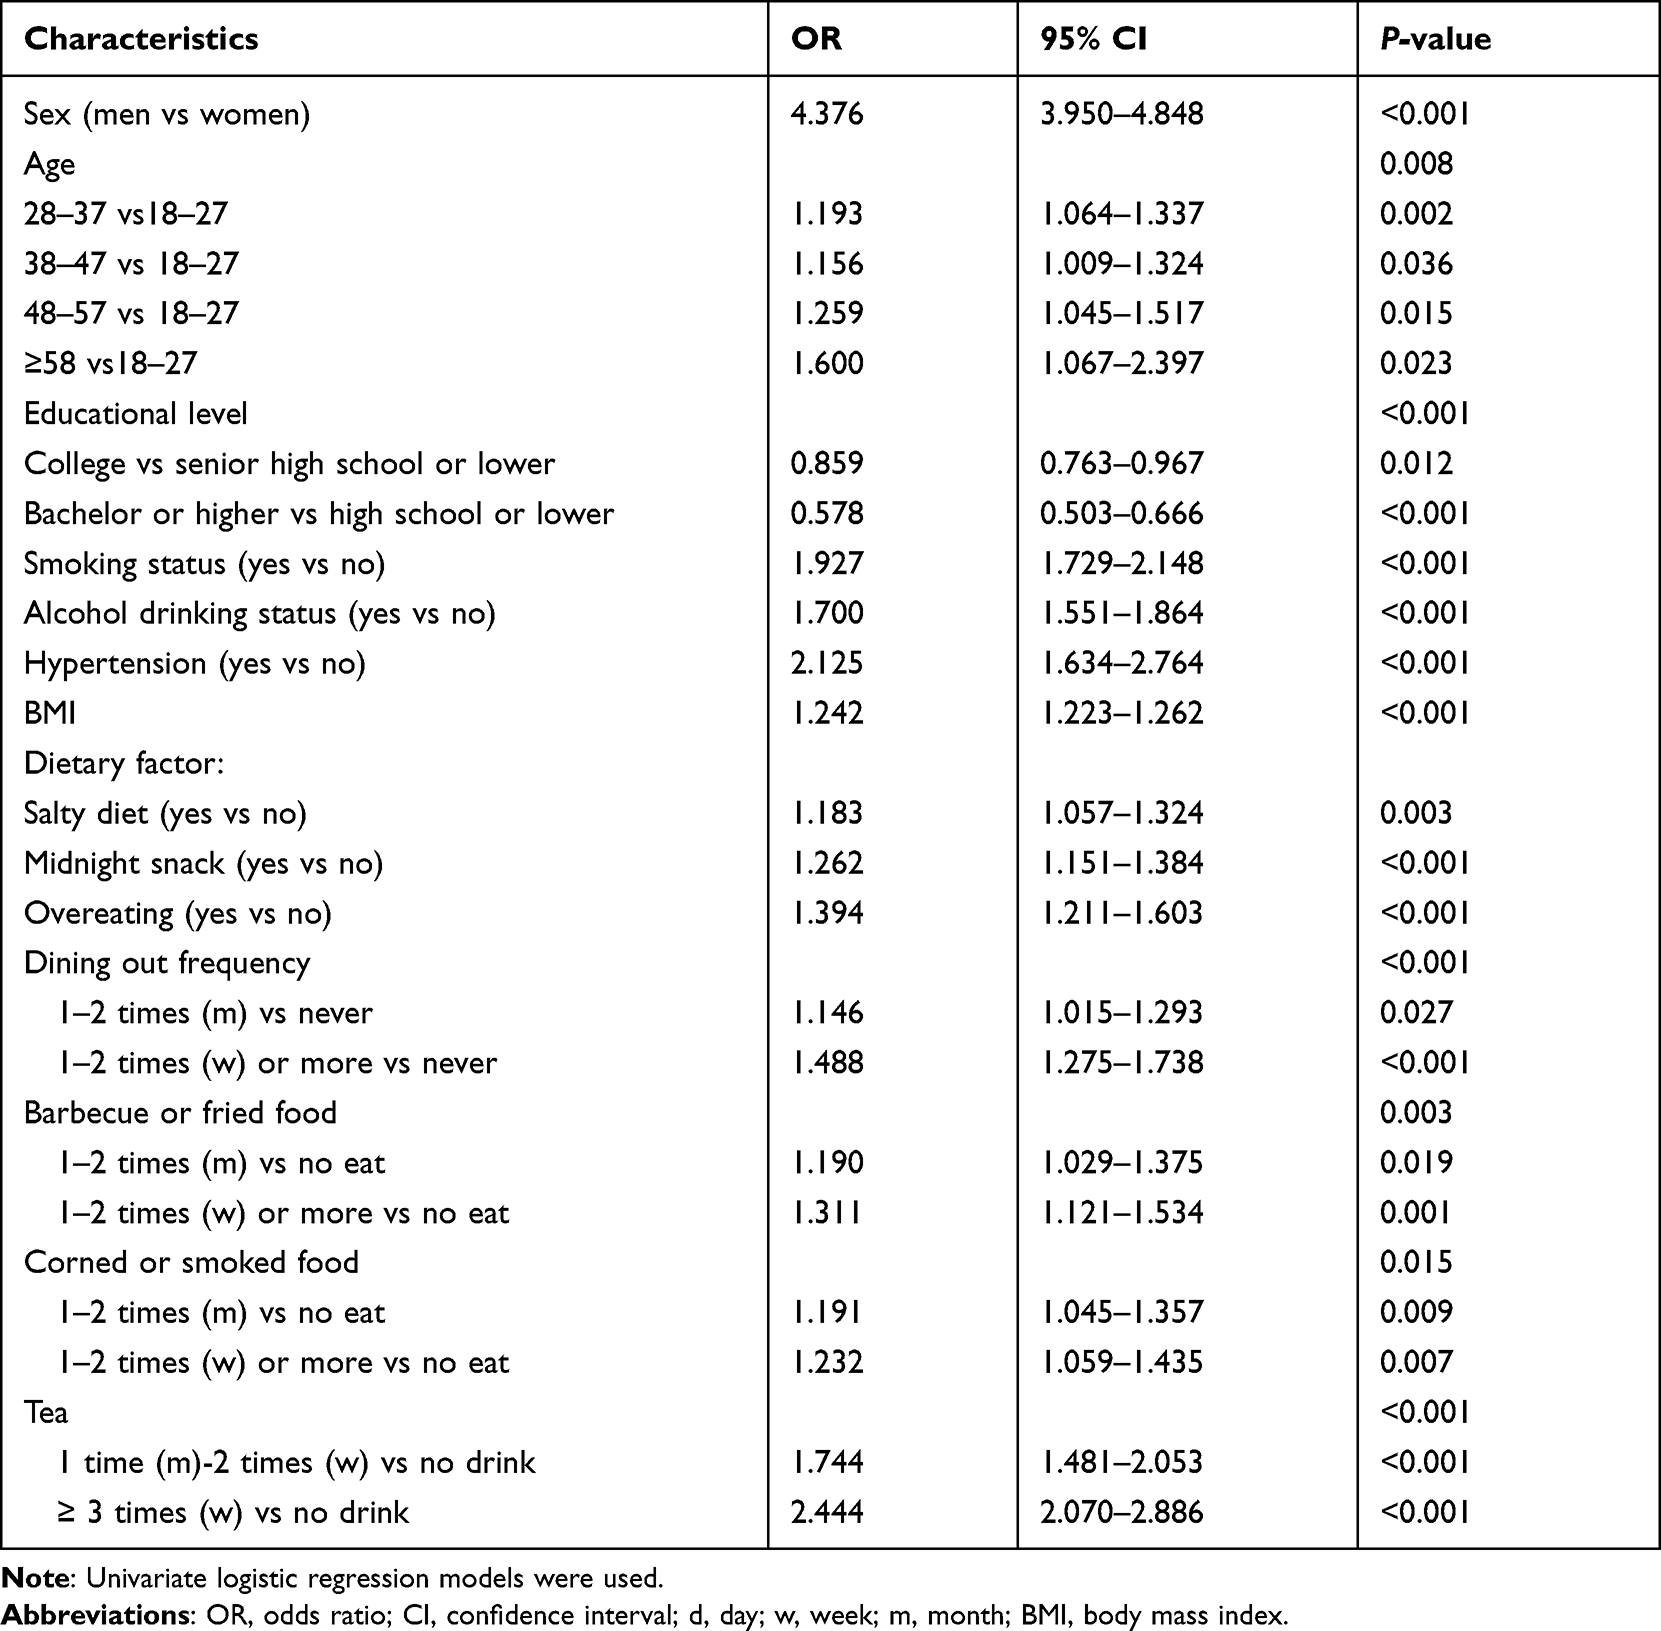 |
Table 2 Comparison of Some Characteristics with Hyperuricemia Using Univariate Logistic Regression Models |
After selecting potential risk factors based on the univariate logistic models, multivariable logistic regression was conducted based on the frequency of tea intake in the three models. The association between tea intake and increased risk of hyperuricemia remained significant in all models. In model 3, the adjusted OR for hyperuricemia was 1.30 (95% CI 1.08–1.56, P=0.006) in participants who consumed tea once a month through twice a week and 1.35 (95% CI 1.11–1.64, P=0.003) in those who consumed tea ≥3 times a week when compared with the never reference group. The results showed that tea consumption was an independent risk factor for hyperuricemia (Table 3).
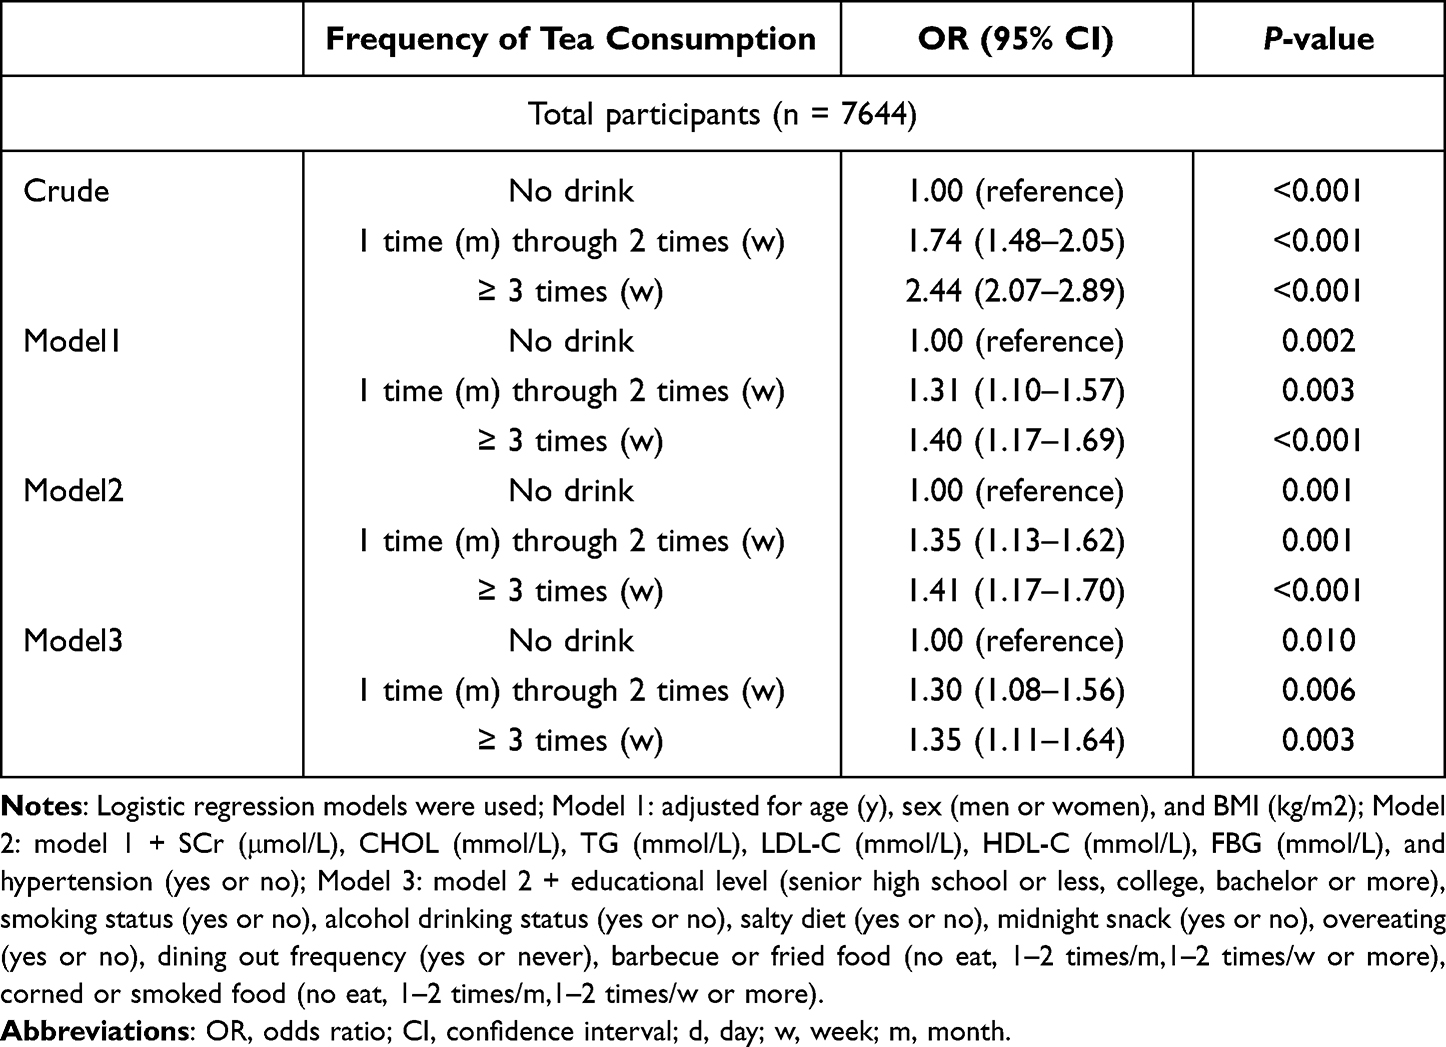 |
Table 3 Crude and Adjusted Odds Ratios (95% Confidence Interval) for Hyperuricemia According to Tea Consumption |
The prevalence of hyperuricemia was higher in male participants compared to that in the female participants. Therefore, we performed sex-based subgroup analyses. This relationship remained significant between hyperuricemia and tea consumption in the three models among the male participants. However, there was no significant relationship between hyperuricemia and tea intake among the female participants (Figures 2 and 3).
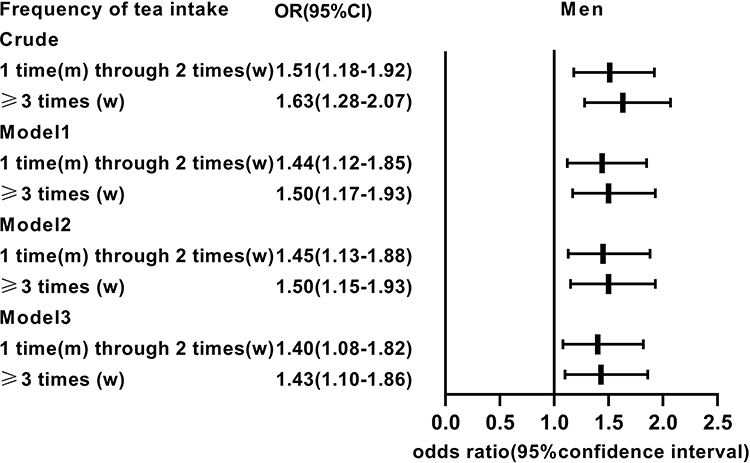 |
Figure 2 Crude and adjusted odds ratios for hyperuricemia according to tea consumption in men. |
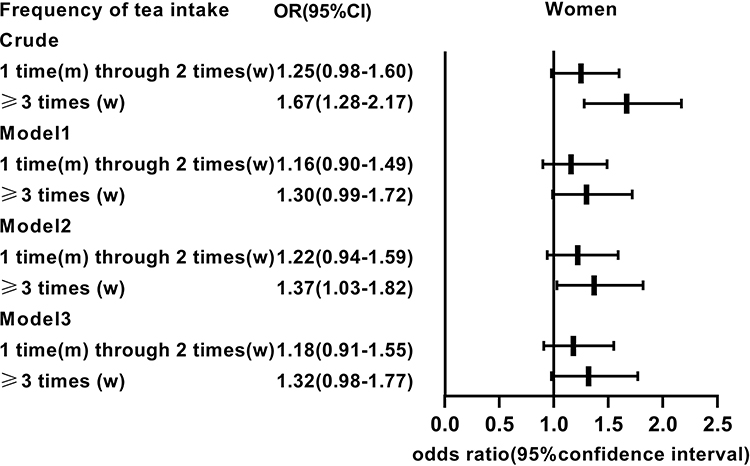 |
Figure 3 Crude and adjusted odds ratios for hyperuricemia according to tea consumption in women. |
Discussion
In this cross-sectional study, we analyzed the association between hyperuricemia and tea intake using data from the health examinee database at Nanfang Hospital and found that higher tea consumption was associated with a greater risk of hyperuricemia. This association remained after adjustment for potential confounders, including age, sex, BMI, educational level, smoking status, alcohol consumption, intake of barbecue or fried food, intake of corned or smoked food, salty diet, overeating, dining out, midnight snacking, and biochemical indices (SCr, CHOL, TG, LDL-C, HDL-C and FBG, identified by univariate regression analysis and in the published literature13,27–33). These adjustments did not change the results, suggesting that tea consumption is an independent risk factor for hyperuricemia.
The relationship between tea intake and hyperuricemia has been investigated previously. Some studies have shown that tea consumption may be negatively associated with hyperuricemia.19,34 Conversely, a meta-analysis demonstrated that tea intake did not seem to be associated with hyperuricemia.21 Furthermore, the results of two population-based studies in Asia indicated that the association between hyperuricemia and tea intake needs validation in future studies.20,23 Contrary to previous studies, our findings indicated a positive association between hyperuricemia and tea intake.
The mechanism of the effect of tea consumption on hyperuricemia has not yet been determined. Beneficial health effects have been attributed to the polyphenols in tea, which have been mainly discussed in the experimental context.17 It has been reported that catechins and theaflavins can effectively inhibit xanthine oxidase, reducing the production of uric acid.19,35 Nevertheless, there exists contradiction between the findings of experimental and epidemiological studies, and a subgroup analysis for green tea in a meta-analysis displayed that its consumption was positively associated with the SUA level,21 which is in agreement with our findings. There are three possible explanations for the inconsistency between the previous experimental and epidemiological findings. First, catechins reversely regulate the expression of organic anion transporter 1,36 a secreting protein for uric acid excretion, which could account for the increase in SUA.37 Second, the positive effects of tea extracts or polyphenols on the SUA level might be better clarified in animal models than in humans.21 Moreover, some overlooked substances in tea might increase the SUA level, and overconsumption of tea could have harmful effects. Finally, the health status of the study participants could have influenced their SUA levels. Indeed, previous studies have demonstrated associations between hyperuricemia and cardiovascular disease, renal disease, diabetes, hypertension, and other diseases.3–8
Previous research has shown that the prevalence of hyperuricemia is similar between men and women in the population aged over 50 years.38 The majority of the participants in our study were under 48 years of age, and it is possible that sex-related differences in hyperuricemia are more pronounced in this age group. We found a significant association between tea consumption and the risk of hyperuricemia in men in all three of our models but not in women. Many factors potentially contributed to the difference. One reason for this finding may be that women tend to have a healthier lifestyle than men; for example, smoking and alcohol consumption rates were lower in women in the present study. Secondly, a recent report showed a high prevalence of hyperuricemia among hypertensive patients,39 and hypertension was more common in men in our study. Furthermore, gender differences in gene function may lead to different SUA metabolism levels.40 Additionally, biological factors, including estrogen, may protect against the development of hyperuricemia in women.41
This study has several strengths. First, contrary to previous studies, which suggested that tea intake was not associated with hyperuricemia or that tea protected against hyperuricemia, we found tea intake to be a significant risk factor for hyperuricemia. Furthermore, our study included three models that accounted for a wide range of covariates, including sociodemographic, anthropometric, biochemical, and dietary factors. The study also has several potential limitations. First, the association between tea intake and hyperuricemia was investigated in a cross-sectional and single-centric manner despite the large sample size, which limited temporality and universality assessment. We anticipate involving multiple institutions in the future and following up to conduct longitudinal analyses for further research. Second, the information on tea consumption was self-reported and collected by questionnaires that used frequency categories rather than exact values, which may have introduced a degree of recall bias and misclassifications of exposure. Besides, we did not elaborate on the medical conditions about drugs affecting SUA levels in the questionnaire that were relevant to this study. Therefore, we aim to include this information for further analysis in the future follow-up study. Finally, although we controlled for several potential risk factors, we cannot exclude the possibility of unmeasured or residual confounding factors.
Conclusion
This study demonstrated a positive association between the frequency of tea consumption and the risk of hyperuricemia in the Chinese working population in Guangdong province. Subgroup analysis revealed that this effect was more pronounced in men than in women. There is a need for well-designed cohort studies with precise measurements of tea consumption to confirm our findings. Further studies are also required to elucidate the underlying mechanisms.
Abbreviations
BMI, body mass index; CHOL, cholesterol; CI, confidence interval; DBP, diastolic blood pressure; FBG, fasting blood glucose; HDL-C, high-density lipoprotein cholesterol; LDL-C, low-density lipoprotein cholesterol; OR, odds ratio; SBP, systolic blood pressure; SCr, serum creatinine; SUA, serum uric acid concentration; TG, triglyceride.
Data Sharing Statement
The data supporting the findings of this study are available from the corresponding author upon reasonable request.
Ethics Approval and Informed Consent
The study was conducted according to the guidelines of the Declaration of Helsinki and approved by the Medical Ethics Committee of Nanfang Hospital, Southern Medical University (NFEC-2019-161). All study participants provided informed consent. All methods were performed in accordance with the relevant guidelines and regulations.
Acknowledgments
We sincerely thank all the participants in the study.
Author Contributions
All authors made a significant contribution to the work reported, whether that is in the conception, study design, execution, acquisition of data, analysis, and interpretation, or in all these areas; took part in drafting, revising, or critically reviewing the article; gave final approval of the version to be published; have agreed on the journal to which the article has been submitted; and agree to be accountable for all aspects of the work.
Funding
This work was supported by the National Nature Science Foundation of China (Grant Nos. 81773008, 81972897), Clinical Research Startup Program of Southern Medical University by High-level University Construction Funding of Guangdong Provincial Department of Education (Grant No. LC2019ZD003), Key-Area Research and Development Program of Guangdong Province (Grant No. 2019B020227004), China Postdoctoral Science Foundation (Grant No.2021M701629), and the Science and Technology Program of Guangzhou (Grant No.202103000037).
Disclosure
The authors declare that they have no competing interests in this work.
References
1. Dalbeth N, Merriman TR, Stamp LK. Gout. Lancet. 2016;388(10055):2039–2052. doi:10.1016/S0140-6736(16)00346-9
2. Major TJ, Dalbeth N, Stahl EA, Merriman TR. An update on the genetics of hyperuricaemia and gout. Nat Rev Rheumatol. 2018;14(6):341–353. doi:10.1038/s41584-018-0004-x
3. Mallat SG, Al Kattar S, Tanios BY, Jurjus A. Hyperuricemia, hypertension, and chronic kidney disease: an emerging association. Curr Hypertens Rep. 2016;18(10):74. doi:10.1007/s11906-016-0684-z
4. Zheng R, Yang T, Chen Q, Chen C, Mao Y. Serum uric acid concentrations can predict hypertension: a longitudinal population-based epidemiological study. Horm Metab. 2017;49(11):873–879. doi:10.1055/s-0043-119129
5. Maloberti A, Biolcati M, Ruzzenenti G, et al. The role of uric acid in acute and chronic coronary syndromes. J Clini Med. 2021;10:20. doi:10.3390/jcm10204750
6. Yu KH, Chen DY, Chen JH, et al. Management of gout and hyperuricemia: multidisciplinary consensus in Taiwan. Int J Rheum Dis. 2018;21(4):772–787. doi:10.1111/1756-185X.13266
7. Mortada I. Hyperuricemia, type 2 diabetes mellitus, and hypertension: an emerging association. Curr Hypertens Rep. 2017;19(9):69. doi:10.1007/s11906-017-0770-x
8. Wu WC, Lai YW, Chou YC, et al. Serum uric acid level as a harbinger of type 2 diabetes: a prospective observation in Taiwan. Int J Environ Res Public Health. 2020;17(7):2277.
9. Zhao G, Huang L, Song M, Song Y. Baseline serum uric acid level as a predictor of cardiovascular disease related mortality and all-cause mortality: a meta-analysis of prospective studies. Atherosclerosis. 2013;231(1):61–68. doi:10.1016/j.atherosclerosis.2013.08.023
10. Aggarwal R, Dua D, Jain SK, Sud R, Meena SR. Hyperuricemia: a lifestyle change. Urol Nephrol Open Access j. 2018;6(4):119–121. doi:10.15406/unoaj.2018.06.00217
11. Zhu Y, Pandya BJ, Choi HK. Prevalence of gout and hyperuricemia in the US general population: the National Health and Nutrition Examination Survey 2007–2008. Arthritis Rheum. 2011;63(10):3136–3141. doi:10.1002/art.30520
12. Liu R, Han C, Wu D, et al. Prevalence of hyperuricemia and gout in mainland China from 2000 to 2014: a systematic review and meta-analysis. Biomed Res Int. 2015;2015:762820. doi:10.1155/2015/762820
13. Han B, Wang N, Chen Y, et al. Prevalence of hyperuricaemia in an Eastern Chinese population: a cross-sectional study. BMJ open. 2020;10(5):e035614. doi:10.1136/bmjopen-2019-035614
14. Cicero AFG, Fogacci F, Cincione RI, Tocci G, Borghi C. Clinical effects of xanthine oxidase inhibitors in hyperuricemic patients. Med Princ Pract. 2021;30(2):122–130. doi:10.1159/000512178
15. Li X, Song P, Li J, Wang P, Li G. Relationship between hyperuricemia and dietary risk factors in Chinese adults: a cross-sectional study. Rheumatol Int. 2015;35(12):2079–2089. doi:10.1007/s00296-015-3315-0
16. Torralba KD, De Jesus E, Rachabattula S. The interplay between diet, urate transporters and the risk for gout and hyperuricemia: current and future directions. Int J Rheum Dis. 2012;15(6):499–506. doi:10.1111/1756-185X.12010
17. Hayat K, Iqbal H, Malik U, Bilal U, Mushtaq S. Tea and its consumption: benefits and risks. Crit Rev Food Sci Nutr. 2015;55(7):939–954. doi:10.1080/10408398.2012.678949
18. Jatuworapruk K, Srichairatanakool S, Ounjaijean S, Kasitanon N, Wangkaew S, Louthrenoo W. Effects of green tea extract on serum uric acid and urate clearance in healthy individuals. J Clin Rheumatol. 2014;20(6):310–313. doi:10.1097/RHU.0000000000000148
19. Chen G, Tan ML, Li KK, Leung PC, Ko CH. Green tea polyphenols decreases uric acid level through xanthine oxidase and renal urate transporters in hyperuricemic mice. J Ethnopharmacol. 2015;175:14–20. doi:10.1016/j.jep.2015.08.043
20. Teng GG, Tan CS, Santosa A, Saag KG, Yuan JM, Koh WP. Serum urate levels and consumption of common beverages and alcohol among Chinese in Singapore. Arthritis Care Res. 2013;65(9):1432–1440. doi:10.1002/acr.21999
21. Zhang Y, Cui Y, Li XA, et al. Is tea consumption associated with the serum uric acid level, hyperuricemia or the risk of gout? A systematic review and meta-analysis. BMC Musculoskelet Disord. 2017;18(1):95. doi:10.1186/s12891-017-1456-x
22. Lee JS, Kim TJ, Hong SK, et al. Impact of coffee/green tea/soft drink consumption on the risk of hyperuricemia: a cross-sectional study. Int J Environ Res Public Health. 2021;18:14.
23. Bae J, Park PS, Chun BY, et al. The effect of coffee, tea, and caffeine consumption on serum uric acid and the risk of hyperuricemia in Korean Multi-Rural Communities Cohort. Rheumatol Int. 2015;35(2):327–336. doi:10.1007/s00296-014-3061-8
24. Lin KC, Lin HY, Chou P. Community based epidemiological study on hyperuricemia and gout in Kin-Hu, Kinmen. J Rheumatol. 2000;27(4):1045–1050.
25. Endocrinology CSO. Guideline for the diagnosis and management of hyperuricemia and gout in China (2019). Chin J Endocrinol Metab. 2020;361:1–13.
26. Multidisciplinary Expert Task Force on Hyperuricemia and Related Diseases. Chinese multidisciplinary expert consensus on the diagnosis and treatment of hyperuricemia and related diseases. Chin Med J. 2017;130(20):2473–2488. doi:10.4103/0366-6999.216416
27. Pan Z, Huang M, Fang M, Xie X, Huang Z. Socioeconomic differences in hyperuricemia and gout: a systematic review and meta-analysis. Endocrine. 2020;69(2):286–293. doi:10.1007/s12020-020-02281-w
28. Zhang X, Meng Q, Feng J, et al. The prevalence of hyperuricemia and its correlates in Ganzi Tibetan Autonomous Prefecture, Sichuan Province, China. Lipids Health Dis. 2018;17(1):235. doi:10.1186/s12944-018-0882-6
29. Zhang L, Wan Q, Zhou Y, et al. Age-related and gender-stratified differences in the association between high triglyceride and risk of hyperuricemia. Lipids Health Dis. 2019;18(1):147. doi:10.1186/s12944-019-1077-5
30. Liu F, Du GL, Song N, et al. Hyperuricemia and its association with adiposity and dyslipidemia in Northwest China: results from cardiovascular risk survey in Xinjiang (CRS 2008–2012). Lipids Health Dis. 2020;19(1):58. doi:10.1186/s12944-020-01211-z
31. Huang XB, Zhang WQ, Tang WW, et al. Prevalence and associated factors of hyperuricemia among urban adults aged 35–79 years in southwestern China: a community-based cross-sectional study. Sci Rep. 2020;10(1):15683. doi:10.1038/s41598-020-72780-3
32. Álvarez-lario B, Alonso-Valdivielso JL. [Hyperuricemia and gout; the role of diet]. Nutr Hosp. 2014;29(4):760–770. Spanish. doi:10.3305/nh.2014.29.4.7196
33. Liu Z, Su X, Xiao M, et al. Association between eating away from home and hyperuricemia: a population-based nationwide cross-sectional study in China. Biomed Res Int. 2019;2019:2792681. doi:10.1155/2019/2792681
34. Bahorun T, Luximon-Ramma A, Gunness TK, et al. Black tea reduces uric acid and C-reactive protein levels in humans susceptible to cardiovascular diseases. Toxicology. 2010;278(1):68–74. doi:10.1016/j.tox.2009.11.024
35. Maloberti A, Bombelli M, Facchetti R, et al. Relationships between diuretic-related hyperuricemia and cardiovascular events: data from the URic acid right for heArt health study. J Hypertens. 2021;39(2):333–340. doi:10.1097/HJH.0000000000002600
36. Roth M, Timmermann BN, Hagenbuch B. Interactions of green tea catechins with organic anion-transporting polypeptides. Drug Metab Dispos. 2011;39(5):920–926. doi:10.1124/dmd.110.036640
37. Liu N, Wang L, Yang T, et al. EGF receptor inhibition alleviates hyperuricemic nephropathy. J Am Soc Nephrol. 2015;26(11):2716–2729. doi:10.1681/ASN.2014080793
38. Zhao HN, Yue WW, Jia RY, Nie HW. The prevalence of hyperuricemia in China: a meta-analysis. BMC Public Health. 2011;11:832. doi:10.1186/1471-2458-11-832
39. Redon P, Maloberti A, Facchetti R, et al. Gender-related differences in serum uric acid in treated hypertensive patients from central and east European countries: findings from the blood pressure control rate and CArdiovascular risk profilE study. J Hypertens. 2019;37(2):380–388. doi:10.1097/HJH.0000000000001908
40. Kolz M, Johnson T, Sanna S, et al. Meta-analysis of 28,141 individuals identifies common variants within five new loci that influence uric acid concentrations. PLoS Genet. 2009;5(6):e1000504. doi:10.1371/journal.pgen.1000504
41. Yu KH, See LC, Huang YC, Yang CH, Sun JH Dietary factors associated with hyperuricemia in adults.
 © 2022 The Author(s). This work is published and licensed by Dove Medical Press Limited. The
full terms of this license are available at https://www.dovepress.com/terms
and incorporate the Creative Commons Attribution
- Non Commercial (unported, 3.0) License.
By accessing the work you hereby accept the Terms. Non-commercial uses of the work are permitted
without any further permission from Dove Medical Press Limited, provided the work is properly
attributed. For permission for commercial use of this work, please see paragraphs 4.2 and 5 of our Terms.
© 2022 The Author(s). This work is published and licensed by Dove Medical Press Limited. The
full terms of this license are available at https://www.dovepress.com/terms
and incorporate the Creative Commons Attribution
- Non Commercial (unported, 3.0) License.
By accessing the work you hereby accept the Terms. Non-commercial uses of the work are permitted
without any further permission from Dove Medical Press Limited, provided the work is properly
attributed. For permission for commercial use of this work, please see paragraphs 4.2 and 5 of our Terms.