")
Back to Journals » International Journal of Nanomedicine » Volume 14
Targeted lipid nanoparticle delivery of calcitriol to human monocyte-derived macrophages in vitro and in vivo: investigation of the anti-inflammatory effects of calcitriol
Authors Rafique A, Etzerodt A , Graversen JH , Moestrup SK, Dagnæs-Hansen F , Møller HJ
Received 24 October 2018
Accepted for publication 15 February 2019
Published 23 April 2019 Volume 2019:14 Pages 2829—2846
DOI https://doi.org/10.2147/IJN.S192113
Checked for plagiarism Yes
Review by Single anonymous peer review
Peer reviewer comments 2
Editor who approved publication: Dr Thomas Webster
Aisha Rafique,1 Anders Etzerodt,2 Jonas H Graversen,3 Søren K Moestrup,3 Frederik Dagnæs-Hansen,2 Holger Jon Møller1
1Department of Clinical Biochemistry, Aarhus University Hospital, Aarhus, Denmark; 2Institute of Biomedicine, Aarhus University, Aarhus, Denmark; 3Department of Molecular Medicine, University of Southern Denmark, Odense, Denmark
Background: Vitamin D3 possesses anti-inflammatory and modulatory properties in addition to its role in calcium and phosphate homeostasis. Upon activation, macrophages (M) can initiate and sustain pro-inflammatory cytokine production in inflammatory disorders and play a pathogenic role in certain cancers.
Purpose: The main purpose of this study was to encapsulate and specifically target calcitriol to macrophages and investigate the anti-inflammatory properties of calcitriol in vitro and in vivo.
Methods: In this study we have designed and developed near-infrared calcitriol PEGylated nanoparticles (PEG-LNP(Cal)) using a microfluidic mixing technique and modified lipid nanoparticles (LNPs) to target the M specific endocytic receptor CD163. We have investigated LNP cellular uptake and anti-inflammatory effect in LPS-induced M in vitro by flow cytometry, confocal microscopy and gene expression analyses. LNP pharmacodynamics, bio-distribution and organ specific LNP accumulation was also investigated in mice in vivo.
Results: In vitro, we observed the specific uptake of PEG-LNP(Cal)-hCD163 in human M, which was significantly higher than the non-specific uptake of control PEG-LNP(Cal)-IgG(h) in M. Pre-treatment with encapsulated calcitriol was able to attenuate intracellular TNF- expression, and M surface marker HLA-DR expression more efficiently than free calcitriol in LPS-induced M in vitro. Encapsulated calcitriol diminished mRNA gene levels of TNF-, NF-B, MCP-1 and IL-6, while upregulating IL-10. TNF- and IL-6 protein secretion also decreased. In mice, an in vivo pharmacodynamic study of PEG-LNP(Cal) showed a rapid clearance of IgG and CD163 modified LNPs compared to PEG-LNP(Cal). Antibody modified PEG-LNP(Cal) accumulated in the liver, spleen and kidney, whereas unmodified PEG-LNP(Cal) accumulation was only observed in the liver.
Conclusion: Our results show that calcitriol can be effectively targeted to M. Our data confirms the anti-inflammatory properties of calcitriol and this may be a potential way to deliver high dose bioactive calcitriol to M during inflammation in vivo.
Keywords: macrophages, 1.25(OH)2D3, calcitriol, lipid nanoparticles, pro-inflammatory cytokines, CD163 targeted drug delivery, gene expression analyses, in vivo pharmacodynamics
Introduction
Nanoparticle drug-delivery systems are promising tools used for delivering active molecules to target sites of action in vivo, resulting in increased bioavailability and drug efficacy and minimized off-target adverse side effects. Several targeted nanoparticle drug-delivery systems have been reported in advanced trial phases for certain cancers1 and have the potential for the treatment of autoimmune disorders and inflammatory diseases such as nonalcoholic fatty-liver disease (NAFLD).2,3
Macrophages (Mϕ) are important players in the pathogenesis of, for example, obesity-associated type 2 diabetes, inflammatory diseases such as nonalcoholic steatohepatitis (NASH) and rheumatoid arthritis and in certain cancers.4–7 These phagocytes are plastic, heterogenic immune cells capable of adapting, polarizing, and altering cytokine production and cell surface marker expression according to their microenvironment.8 Tumor necrosis factor-alpha (TNF-α) and interleukin (IL)-6 are inflammatory cytokines released by Mϕ upon endotoxin challenge9 and have been linked to insulin resistance, obesity, and chronic low-grade inflammatory disorders.10,11
Specific pro- or anti-inflammatory Mϕ subsets, mimicking in vivo phenotypes, can be generated by stimulation with either interferon-γ and lipopolysaccharide (LPS) or IL-13 and IL-4 in vitro.12 In addition, Mϕ can also be characterized by their function as inhibitory Mϕ mediated by, for example, nitric oxide or as wound healing Mϕ by producing orthinine.13 CD163 is the hemoglobin–haptoglobin scavenger receptor and is exclusively expressed on circulating monocytes, tissue-resident Mϕ, and tumor-associated Mϕ. Thus, CD163 is an ideal therapeutic target for drug delivery to Mϕ in both inflammatory disorders and cancers.14–16
The physiological role of vitamin D3 and its metabolite in calcium/phosphate homeostasis and bone metabolism has been elucidated.17 Pre-vitamin D3 is produced in the skin and transported by vitamin D-binding protein to the liver, where it is modified by Cyp27a1 into 25(OH)D3. In the kidneys, Cyp27b1 converts 25(OH)D3 into bioactive 1,25(OH)2D3 (calcitriol).18 Besides the classical role of calcitriol, there is evidence showing that calcitriol has both immunoregulatory and anti-inflammatory properties, which influence innate and adaptive immune responses.7 Most immune cells (eg, monocytes and Mϕ,19 lymphocytes, dendritic cells,20 NK cells, and activated T and B cells21,22) express both the nuclear vitamin D receptor (VDR) and Cyp27b1.23 VDR, calcitriol, and the retinoic X receptor complex together and bind to the vitamin D responsive element resulting in nonclassical gene regulation of immune cell proliferation, differentiation, and apoptosis.
Vitamin D deficiency may also be associated with chronic low-grade inflammation, insulin resistance, and type 2 diabetes,24 and the use of calcitriol as an anti-inflammatory and anticancer agent has been reported in a number of studies (eg, in type 2 diabetes,11 rheumatoid arthritis,7 colon cancer,25 and preclinical anticancer trials26). However, the risk of developing hypercalcemia prevents systemic administration.27 Chen et al demonstrated that vitamin D-VDR signaling suppresses LPS-mediated inflammation by blocking nuclear factor (NF)-κB activation and suppressing miR-155, resulting in increased SOCS1 translation and thereby enhancing negative feedback regulation of LPS-mediated inflammatory response in murine RAW 264.7 cells.28 It has been reported that VDR together with calcitriol is able to attenuate NF-κB transcriptional activity through the reduced degradation of IκBα in co-transfected HEK-293 cells.29 Calcitriol is able to counteract the effects of FGF-23 to induce TNF-α in RAW 264.7 cells.30 Delivering encapsulated calcitriol to, for example, EGFR tyrosine kinase inhibitor-resistant lung cancer or to Mϕ involved in NASH has demonstrated effective cellular uptake and drug efficacy.2,31
In the present study, we developed calcitriol lipid nanoparticles (LNP(Cal)) and PEGylated calcitriol lipid nanoparticles (PEG-LNP(Cal)) with a core of triolein–POPC (2-oleoyl-1-palmitoyl-sn-glycero-3-phosphocholine), as reported by Zhigaltsev et al.32 PEG-LNPs have an improved half-life and circulation time in vivo compared to conventional LNPs1 and are able to avoid rapid uptake by nontarget cells. Several studies have shown that the improved half-life of PEG-LNPs results in the increased accumulation of LNPs in tumor and inflamed areas, where increased presence of immune cells is observed in certain cancers and inflammatory diseases.33,34 In this study, we targeted PEG-LNP(Cal) to the Mϕ endocytic scavenger receptor CD163 using an anti-CD163 monoclonal antibody (mAB) in order to investigate the specific uptake and effect of calcitriol on Mϕ. Specifically targeting LNPs to improve drug molecule uptake by selected cells, thereby improving drug efficacy and the therapeutic index, is a promising approach for the treatment of both cancers and immune-mediated inflammatory diseases.
Materials and methods
Materials
Rat anti-mouse CD163 antibody (clone: E10B10), humanized antihuman CD163 antibody (clone: KN2/NRY), denoted as αmCD163 and αhCD163,35 polyclonal rabbit-antihuman CD163 antibody, and CD163-transfected Chinese hamster ovarian (CHO) cells36 were produced as previously described.35 Human IgG (cat no 62–8400) and DID′ oil:DiIC18(5) oil (1,1′-dioctadecyl-3,3,3′,3′-tetramethylindodicarbocyanine perchlorate) (D307) were obtained from Thermo Fisher Scientific (Waltham, MA, USA). Glyceryl trioleate (triolein) (cat no T7140-1G), POPC (42773; 100 mg), rat IgG (I4131; 10 mg), brefeldin A (B6542; 5 mg), and saponin (47036-50G-F) were obtained from Sigma-Aldrich Co (St Louis, MO, USA). pNP-PEG3400-1,2-dioleoyl-sn-glycero-3-phosphoethanolamine (DOPE) was obtained from Anders Etzerodt (Institute of Biomedicine, Aarhus University, Aarhus, Denmark). Calcitriol (CAS nr: 32222-06-3) was purchased from Cayman Chemical (Ann Arbor, MI, USA). PEG2000-DSPE (N-(carbonyl-methoxypolyethylene glycol-2000)-1,2-distearoyl-sn-glycero-3-phosphoethanolamine, sodium salt) was obtained from Lipoid AG (Steinhausen, Switzerland). Human donor buffy coats were obtained from the Blood Bank at Aarhus University Hospital. For monocyte purification, an EasySep® Human CD14 Positive Selection Kit from StemCell Technologies (Vancouver, BC, Canada) was utilized. Human TNF-α (DY210-05) and human IL-6 (DY206-05) DuoSet ELISAs were obtained from R&D Systems (Minneapolis, MN, USA). Specific antibodies for flow cytometry and confocal microscopy included the following: human CD80 HRZN V450 (clone: L307.4) was obtained from Becton Dickinson (Franklin Lakes, NJ, USA); FITC antihuman HLA-DR (clone L243) and PE-antihuman CD163 (clone: GHI) were obtained from Nordic BioSite (Taby, Sweden); wheat germ agglutinin Alexa Flour 488 (cat no W11261), Live/Dead (near-infrared stain), and antihuman TNF-α MAB11 EF450 were obtained from Thermo Fisher Scientific. Antihuman CD11b Bv510 (ICRF44) was obtained from BioLegend (Nordic BioSite). Charcoal stripped (CS)-FBS used for the in vitro studies was obtained from Thermo Fisher Scientific. For RNA purification, QIAamp RNA Blood Mini kits were purchased from Qiagen NV (Venlo, the Netherlands). The iScript Advanced cDNA Synthesis Kit for quantitative PCR (qPCR) was obtained from Bio-Rad Laboratories Inc (Hercules, CA, USA), and LightCycler 480 SYBR Green Master Mix was obtained from Hoffman-La Roche Ltd (Basel, Switzerland).
Animals
Nine-week-old RjOrl:SWISS and C57BL/6JRj mice were supplied by Janvier-Labs (Le Genest-Saint-Isle, France) and housed at least for 1 week for acclimatization prior to the experiments at the Biomedical Animal Facility (Aarhus University, Bartholin Building). The mice were housed according to Danish legislation rules and EU Directive 2010/63 on the protection of animals used for scientific purposes in groups of three to four in individually ventilated cages (Tecniplast, Buguggiate, Italy). The mice were subjected to a 12-hour light/12-hour dark schedule and were fed standard chow (Altromin #1324, Lage, Germany) and provided tap water ad libitum throughout the experiment. The animals were given nesting material, shredded paper strips, and wooden squares as environmental enrichment. Bedding consisted of aspen wood chips from Tapvei, Finland. At the end of the study, the mice were sacrificed by cervical dislocation. All animal studies were performed with the permission of the Danish Animal Experiments Inspectorate (J no 2014-15-0201-00377). All the animal experiments performed complied with the EU Directive (2010/63) as well as national and international legislations, including the Animal Welfare Policy at Aarhus University.
Preparation of calcitriol LNPs
LNPs were formulated using a microfluidic mixing method on a NanoAssemblr® (Precision NanoSystems, Vancouver, BC, Canada).32 Conventional LNPs ± calcitriol (LNP(c) or LNP(Cal) were prepared from a mixture of triolein, POPC, and ± calcitriol. Chloroform was evaporated from pNP-PEG3400-DOPE to prepare PEGylated ± calcitriol LNPs (PEG-LNP(c) or PEG-LNP(Cal)) for post-modification. The ethanol–lipid mixture consisted of POPC, triolein, calcitriol, DID, DSPE-PEG2000, and pNP-PEG3400-DOPE. The lipid composition molar ratios for all types of LNP formulations are listed in Table 1. All lipids were dissolved and vortexed in absolute EtOH. The EtOH–lipid solution was injected into the first inlet, and citrate-buffered saline (CBS) buffer (pH 5.0; 5 mM citric acid, 150 mM NaCl) was injected into the second inlet. LNP formulations were rapidly mixed, with a flow rate ratio of 1:5 and a total flow rate of 12 mL/min. LNP formulations for antibody conjugation were dialyzed twice against CBS buffer (pH 5) overnight at 4°C. Conventional LNPs were prepared in PBS and dialyzed twice against PBS (pH 7.2) overnight at 4°C. All LNP formulations were tested by dynamic light scattering (DLS) (Wyatt Technology Europe GmbH, Dernbach, Germany) to determine their size (radius, nM) and polydispersity. To determine encapsulation efficiency, 50 μL LNP samples were analyzed by reverse phase hydrophobic chromatography using a Dionex Ultimate 3000 HPLC System (GE Healthcare Europe GmbH, Freiburg, Germany) applying an Ascentis® C18 column (10 cm × 3 mM, 3 μm) (Sigma-Aldrich Co), and UV absorbance at 240 nM with the following gradient: 90%, 0.1% TFA in H2O/10%, 0.1% TFA in MeOH to 1%, 0.1% TFA in H2O/99%, 0.1% TFA in MeOH continued for 5 minutes.
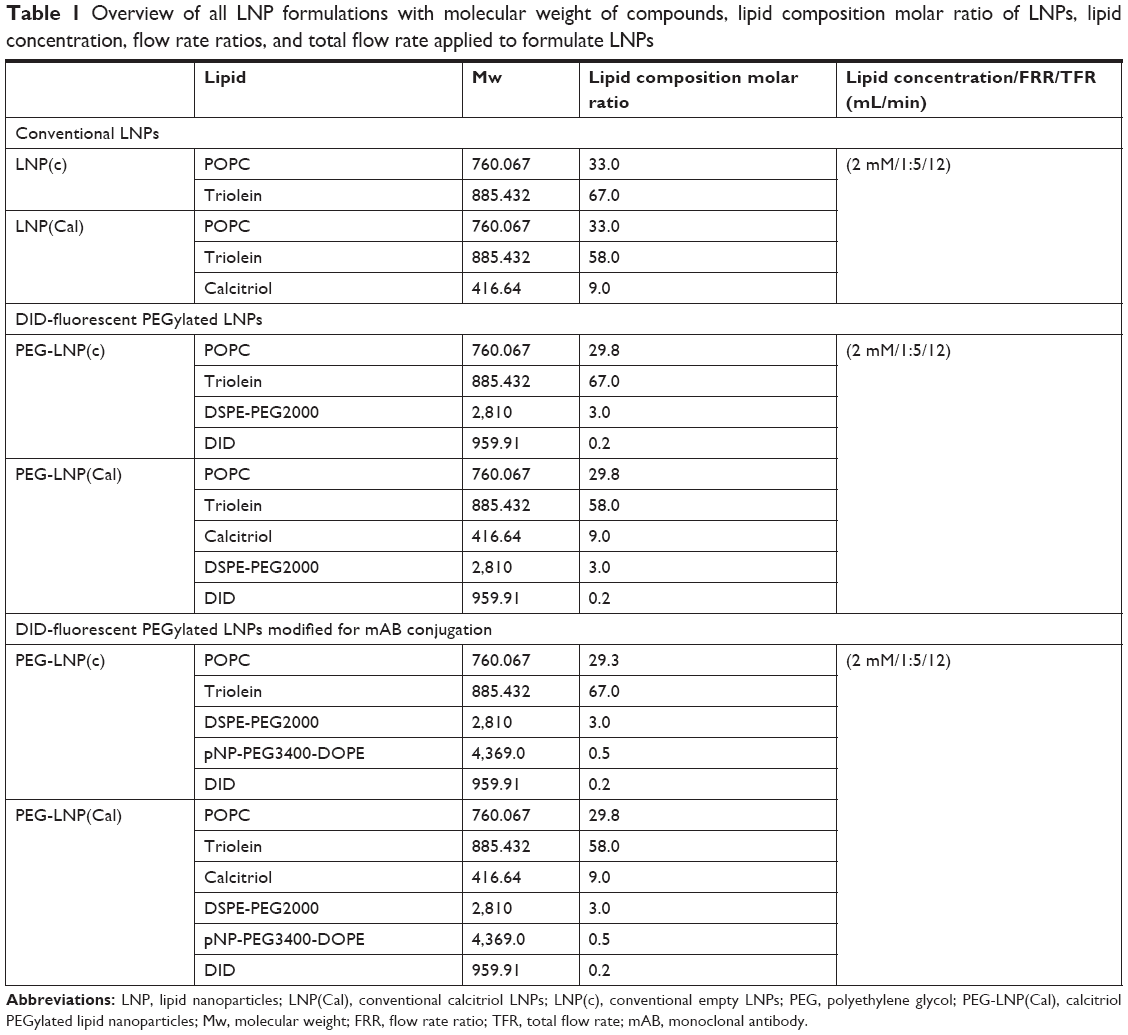 | Table 1 Overview of all LNP formulations with molecular weight of compounds, lipid composition molar ratio of LNPs, lipid concentration, flow rate ratios, and total flow rate applied to formulate LNPs |
Modification of calcitriol LNPs for CD163 targeting and surface plasmon resonance (SPR) analysis
Targeted LNPs were produced by modification with either αmCD163, αhCD163, irrelevant human IgG, or irrelevant rat IgG. Under LNP formation, the active PEG-lipid derivate pNP-PEG3000-DOPE, synthesized as described by Torchilin et al,37 was incorporated into the surface of the LNPs (0.5% of the total lipid). The antibody insertion reaction was pH dependent and performed by mixing the LNP formulation (pH 5.0), protein 1.3 mg/mL (molar ratio 1,000:1), and adding borate-buffered saline (pH 8.5; boric acid 100 mM, NaCl 150 mM, sodium tetraborate 25 mM). The reaction was incubated overnight at 4°C following dialysis twice against PBS (pH 7.2) at 4°C.37,38 Total protein concentration was measured using a Pierce BCA protein micro assay (Thermo Fisher Scientific). SPR analyses were conducted to test PEG-LNP(Cal)-αCD163 binding to human or murine CD163 using a Biacore 3000 instrument (Biacore, Uppsala, Sweden).39 Biacore sensor chips were activated with N-ethyl-N′-(3-dimethylaminopropyl) carbodiimide and 0.05 M N-hydroxysuccinimide. Recombinant human and murine CD163 were immobilized in 10 mM sodium acetate (pH 4.0), and the remaining binding positions were blocked by 1 M ethanolamine (pH 8.5). The attachment procedure resulted in immobilized 0.0483 pmol human CD163/mm2 and murine CD163/mm2 in the range of 0.01–0.05 pmol murine CD163/mm2. LNP samples were tested in three different concentrations (total antibody), 5, 2.5, and 1.25 μg/mL, including a control antibody with CaHBS running buffer (10 mM Hepes, 150 mM NaCl, 3 mM Ca2Cl2 + 0.05% Tween 20, pH 7.4). The flow cells were regenerated with 500 mM phosphoric acid (pH 1.3), and data were analyzed using the Biomolecular Interaction Analysis evaluation program.
Purification of human mononuclear cells from buffy coats
Buffy coats from healthy donors were diluted with 0.9% NaCl, layered on to a Histopaque®-1077 (Sigma-Aldrich Co), and centrifuged at 400×g at room temperature (RT) for 30 minutes without brake. The opaque interface containing mononuclear cells was added to wash buffer containing EDTA (D-PBS/2% FBS/1 mM EDTA), gently aspirated, and centrifuged at 200×g for 10 minutes at RT without brake. The monocytes were purified using an EasySep® Human CD14 Positive Enrichment kit (cat no 18058) and a Silver EasySep® Magnet (cat no 18001). Mononuclear cell suspensions were prepared at a concentration of 5×10⁷ cells/mL in D-PBS/2% FBS/1 mM EDTA. Purification of the monocytes was performed following the EasySep® protocol. The monocytes were resuspended in RPMI 1640/penstrep/10% FBS/100 ng/mL macrophage colony-stimulating factor/10 ng/mL granulocyte-macrophage colony-stimulating factor for Mϕ differentiation. The cell cultures were incubated at 37°C under a humidified atmosphere of 95% air and 5% CO2. All monocyte/Mϕ cell cultures were supplemented with fresh medium every second day, and fully differentiated Mϕ were ready for in vitro studies after a 6-day incubation period.
In vitro Mϕ setups
Fully differentiated Mϕ (1×10⁶ Mϕs/mL) were seeded in six-well plates for 24 hours. Prior to stimulation, the cell culture medium was replaced with RPMI/PS/10% CS-FBS, and Mϕ were incubated with calcitriol, LNP(Cal), PEG-LNP(Cal), PEG-LNP(Cal)-IgG, and PEG-LNP(Cal)-αhCD163 for 24 hours at 37°C in 5% CO2/95% air, following LPS challenge (1 μg/mL LPS for 4 hours). A total of 10 μM dexamethasone for 24 hours was used as the positive control. Mϕ were harvested with pre-warmed lidocaine buffer (PBS/0.5% BSA/5 mM EDTA/4 mg/mL lidocaine) for flow cytometry and in RNeasy lysis buffer buffer with β-mercaptoethanol (Qiagen NV) for RNA purification.
Flow cytometry
To evaluate cellular uptake and the effect of encapsulated calcitriol, Mϕ were incubated with DID-fluorescent PEG-LNP(Cal), PEG-LNP(Cal)-IgG, and PEG-LNP(Cal)-αhCD163 ranging from 0.5 to 100 nM for 24 hours (RPMI 1640/penstrep/10% CS-FBS at 37°C, 5% CO2/95% air). The culture medium was collected and Mϕ were detached using lidocaine buffer (PBS/0.5% BSA/5 mM EDTA/4 mg/mL lidocaine from Sigma-Aldrich Co) following washing steps with PBS/0.5% BSA/0.09% NaN3 (pH 7.4). To evaluate the Mϕ surface marker expression of HLA-DR and CD80, Mϕ were incubated with the above-mentioned LNP constructs following 1 μg/mL LPS challenge. Mϕ were harvested and blocked for unspecific antibody binding with 100 μg/mL human IgG for 15 minutes. For uptake and surface marker expression evaluation, cells were stained with allophycocyanin-Live/Dead, PE-antihuman CD163 GHI, FITC-antihuman HLA-DR, and V450 antihuman CD80 for 30 minutes at 4°C in the dark. Mϕ were washed with D-PBS (pH 7.4; with 0.5% BSA, 0.09% NaN3) and resuspended in 0.9% formaldehyde. Anti-mouse Ig, χ/negative control BSA compensation plus beads (BD Biosciences, San Jose, CA, USA) for all stains, and Live/Dead, ArC™ Amine Reactive Compensation Beads (Thermo Fisher Scientific) were prepared for compensation. Samples were analyzed using a Beckmann Coulter Navios Flow Cytometer (Brea, CA, USA). FlowJo for Macintosh software version 10.4.1 (Ashland Inc, Covington, KY, USA) was used for data analysis.
RNA extraction and gene expression analysis by qPCR
To investigate the effect of encapsulated calcitriol on pro- and anti-inflammatory cytokine mRNA gene expression, RNA was extracted using QIAamp RNA Blood Mini kits (Qiagen NV) according to the manufacturer’s protocol. First, 100 ng of total RNA was transcribed into cDNA using the following mix: MgCl2 solution 25 mM, 10× PCR buffer, Oligo 50 μM, RNAse inhibitor, RT enzyme, and Ultrapure dNTP mix (Thermo Fisher Scientific). RT-qPCR reactions were run in duplicates containing SYBR Green I Master Mix (Hoffman-La Roche), ddH2O, and target forward/reverse primers, under the following conditions: preincubation at 95°C for 10 minutes followed by cycled amplification at 95°C for 10 seconds, with primer-dependent annealing temperature for 20 seconds, and 72°C for 5 seconds for 50 cycles. RT-qPCR was carried out using a LightCycler® 480 instrument. (Hoffman-La Roche). NormFinder® software was used to determine the stable housekeeping gene.40 The relative mRNA concentration in each sample was calculated by using the second derivative max method. The target gene expression level of each sample was divided by the associated housekeeping gene GAPDH expression level. The mRNA ratios of the target gene/housekeeping gene were normalized to the untreated control. All primers and annealing temperatures are listed in Table 2.
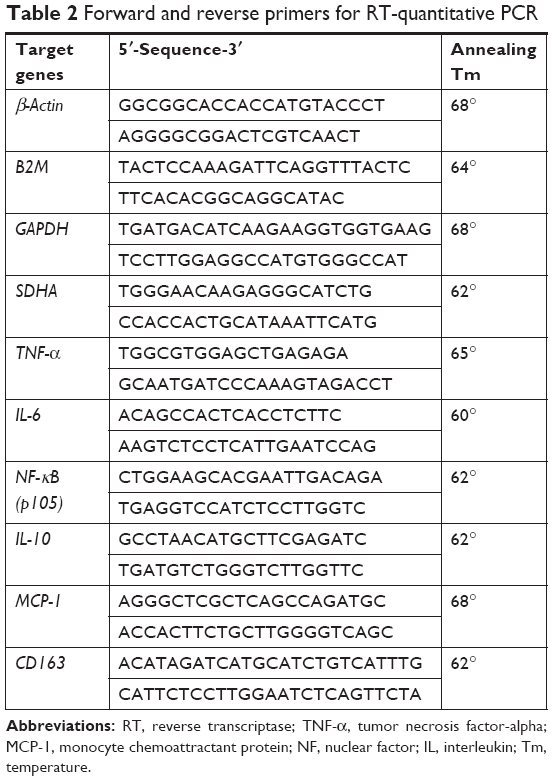 | Table 2 Forward and reverse primers for RT-quantitative PCR |
ELISA for the detection of TNF-α and IL-6
To evaluate TNF-α and IL-6 protein secretion in cell culture supernatants after treatment with calcitriol LNPs we used the ELISA technique according to the manufacturer’s standard protocol. In brief, all reagents and recombinant human TNF-α standards were prepared at RT following the manufacturer’s instructions. To detect TNF-α in cell culture supernatants, microtiter well plates were prepared with 100 μL of diluted capture antibody (4.0 μg/mL) and incubated overnight at RT. Plates were washed three times with 400 μL wash buffer (0.05% Tween® in PBS, pH 7.2–7.4), blocked with 300 μL Reagent Diluent (1% BSA in PBS, pH 7.2–7.4) and incubated for 1 hour at RT. The microtiter wells were washed again with wash buffer and 100 μL of sample or standards in Reagent Diluent were added following incubation for 2 hours at RT. After incubation, the wells were washed and 100 μL of detection antibody (50 ng/mL) diluted in Reagent Diluent was added followed by 2-hour incubation at RT. The wash steps were repeated, and the wells were incubated with 100 μL streptavidin-horseradish peroxidase (1:40 dilution) for 20 minutes in the dark. A stop solution (2 N H2SO4) was added to each well and gently mixed. Optical density was determined using a microplate reader at 540 nM. To investigate IL-6 release in the cell culture supernatant, microtiter well plates were prepared with 100 μL of diluted capture antibody (2.0 μg/mL) and incubated overnight at RT. The same procedure described above was applied for the detection of IL-6 in the cell culture supernatants.
Confocal microscopy
To investigate the cellular uptake of targeted PEG-LNP(Cal), fully differentiated Mϕ were allowed to settle on chambered coverslips (5×10⁴ cells/chamber) pre-coated with 100 μg/mL poly-D-lysine. To investigate uptake specificity, human and murine CD163-transfected CHO cells and control MOCK CHO cells were allowed to settle on chambered coverslips in serum-free HyClone CCM5 medium (± hygromycin and mycin). Mϕ, CD163-transfected CHO cells, and control CHO cells were incubated with 25 nM of targeted PEG-LNP(Cal) and targeted PEG-LNP(c) for 24 hours. Mϕ were washed and fixed with 4% paraformaldehyde in PBS (pH 7.4). Coverslips were incubated with wheat germ agglutinin 488 conjugate (5 μg/mL in Hank’s balanced salt solution, 1% BSA) for 10 minutes, washed with PBS, and counterstained with ProLong Gold mounting medium containing DAPI for identification of the cell nucleus. All images were captured on an Olympus Fluoview FV1000 confocal microscope (Olympus Corporation, Tokyo, Japan) at The Flow Cytometry and Confocal Microscopy Core Facility (The University of Southern Denmark, Odense, Denmark).
In vivo imaging and biodistribution
To investigate the biodistribution and tissue uptake of DID PEG-LNP(Cal) and targeted DID PEG-LNP(Cal) in vivo, SWISS mice (n=1/group) were injected intravenously (IV) with an LNP solution (0.05–0.1 mg/kg 1.25(OH)2D3). The animals were anesthetized with 3.75% isoflurane (IsoFlo Vet; Orion Pharma, Espoo, Finland) and scanned in a Xenogen IVIS® Spectrum in vivo imaging system (PerkinElmer Inc, Waltham, MA, USA) equipped with filters for ex680/em700 visualization. The system was used to measure LNP accumulation at 15, 45, 90, 150, and 210 minutes postinjection.
Pharmacodynamic study
To evaluate the clearance of encapsulated calcitriol in vivo, healthy C57BL/6 mice (n=4/group) were injected in the tail vein with either saline water, DID PEG-LNP(Cal), DID PEG-LNP(Cal)-IgG, or DID PEG-LNP(Cal)-αmCD163 (0.1 mg/kg calcitriol). The first blood sample (tongue blood) was collected 1 minute after injection. Multiple blood samples were collected from the tail vein at T=30 minutes, T=1, 2, 4, 6, and 24 hours after intravenous injection in 20 μL Na-heparinized pipettes (Vitrex Medical A/S, Herlev, Denmark). All blood samples were imaged using the Xenogen IVIS® Spectrum in vivo imaging system and analyzed using the Living Image software version 4.5.5 (PerkinElmer Inc). To investigate tissue distribution and LNP accumulation, ex vivo imaging was performed on the liver, spleen, and kidney for all mice.
Statistical analysis
Graph Pad Prism 7 software (GraphPad Software Inc, La Jolla, CA, USA) was used to prepare graphs and to perform statistical analyses. We used a repeated measures one-way ANOVA analysis and Dunnett’s multiple comparisons test to compare the means of IgG-targeted and CD163-targeted calcitriol LNPs with the mean of non-targeted calcitriol LNPs. To analyze the dose-dependent effect of calcitriol and targeting efficiency, we used a two-way repeated measures (RM) ANOVA along with Tukey’s multiple comparisons test. To analyze the pharmacodynamic and LNP clearance efficiency of the non-targeted and targeted LNPs, a two-way RM ANOVA combined with Tukey’s multiple comparisons test was performed. All error bars are represented as SD and significance is indicated as *P≤0.05, **P≤0.01, ***P≤0.001, and ****P≤0.0001.
Results
Vitamin D3 encapsulation efficiency and binding analysis of anti-CD163 antibody-modified LNPs
The size distribution of LNP(Cal) and PEG-LNP(Cal) was in the range of 30–35 nM radius, as measured using the DLS technique. The LNP(c) and PEG-LNP(c) mean particle radii were in the range of 35–45 nM (Figure 1A and B). Particle size distribution of PEG-LNP(Cal) prior to modification is shown in Figure 1C. The LNP mean particle radius was in the range of 50–60 nM post-IgG and anti-CD163 mAB modification (data not shown). Total calcitriol entrapment was determined by reverse phase HPLC and LNP(Cal) and PEG-LNP(Cal) were measured at 0.056 and 0.043 mg/mL, respectively, resulting in an encapsulation efficiency of 58%–76% of the total calcitriol input. SPR analysis was performed to study the binding of human and murine PEG-LNP(Cal)-αCD163 to immobilized CD163 protein. Free αCD163 mAB was used as a positive control to evaluate specific binding affinity. We observed efficient binding of PEG-LNP(Cal)-αhCD163 or PEG-LNP(Cal)-αmCD163 in contrast to no binding of LNPs modified with either irrelevant human IgG or rat IgG (Figure 1D and E). Stability studies showed that LNP formulations were stable for at least 50 days when stored at 5°C and 26°C, with no change in size and polydispersity. LNP storage at 40°C showed that around day 50, LNP size and polydispersity increased, probably due to particle aggregation (data not shown).
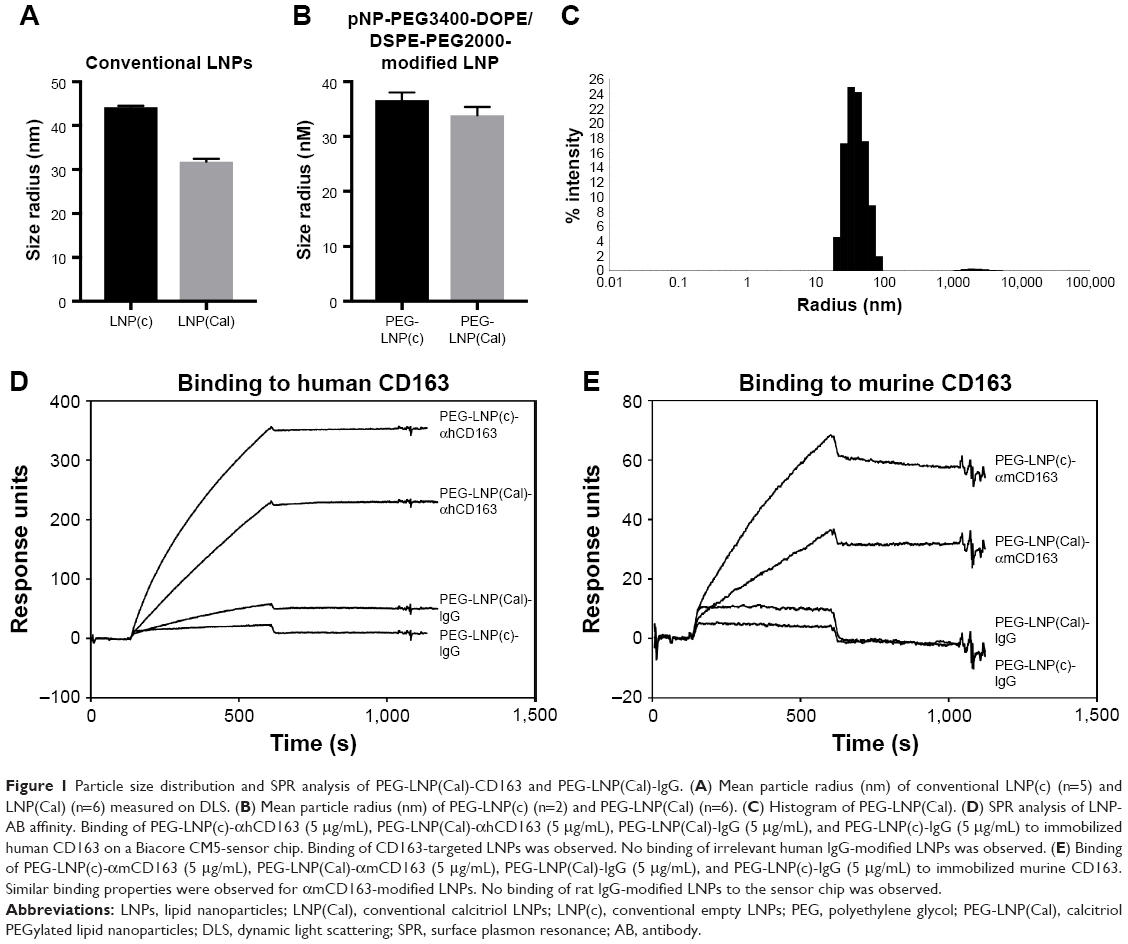 | Figure 1 Particle size distribution and SPR analysis of PEG-LNP(Cal)-CD163 and PEG-LNP(Cal)-IgG. (A) Mean particle radius (nm) of conventional LNP(c) (n=5) and LNP(Cal) (n=6) measured on DLS. (B) Mean particle radius (nm) of PEG-LNP(c) (n=2) and PEG-LNP(Cal) (n=6). (C) Histogram of PEG-LNP(Cal). (D) SPR analysis of LNP-AB affinity. Binding of PEG-LNP(c)-αhCD163 (5 μg/mL), PEG-LNP(Cal)-αhCD163 (5 μg/mL), PEG-LNP(Cal)-IgG (5 μg/mL), and PEG-LNP(c)-IgG (5 μg/mL) to immobilized human CD163 on a Biacore CM5-sensor chip. Binding of CD163-targeted LNPs was observed. No binding of irrelevant human IgG-modified LNPs was observed. (E) Binding of PEG-LNP(c)-αmCD163 (5 μg/mL), PEG-LNP(Cal)-αmCD163 (5 μg/mL), PEG-LNP(Cal)-IgG (5 μg/mL), and PEG-LNP(c)-IgG (5 μg/mL) to immobilized murine CD163. Similar binding properties were observed for αmCD163-modified LNPs. No binding of rat IgG-modified LNPs to the sensor chip was observed. |
Cellular uptake and specificity of CD163-targeted LNPs vs unmodified LNPs
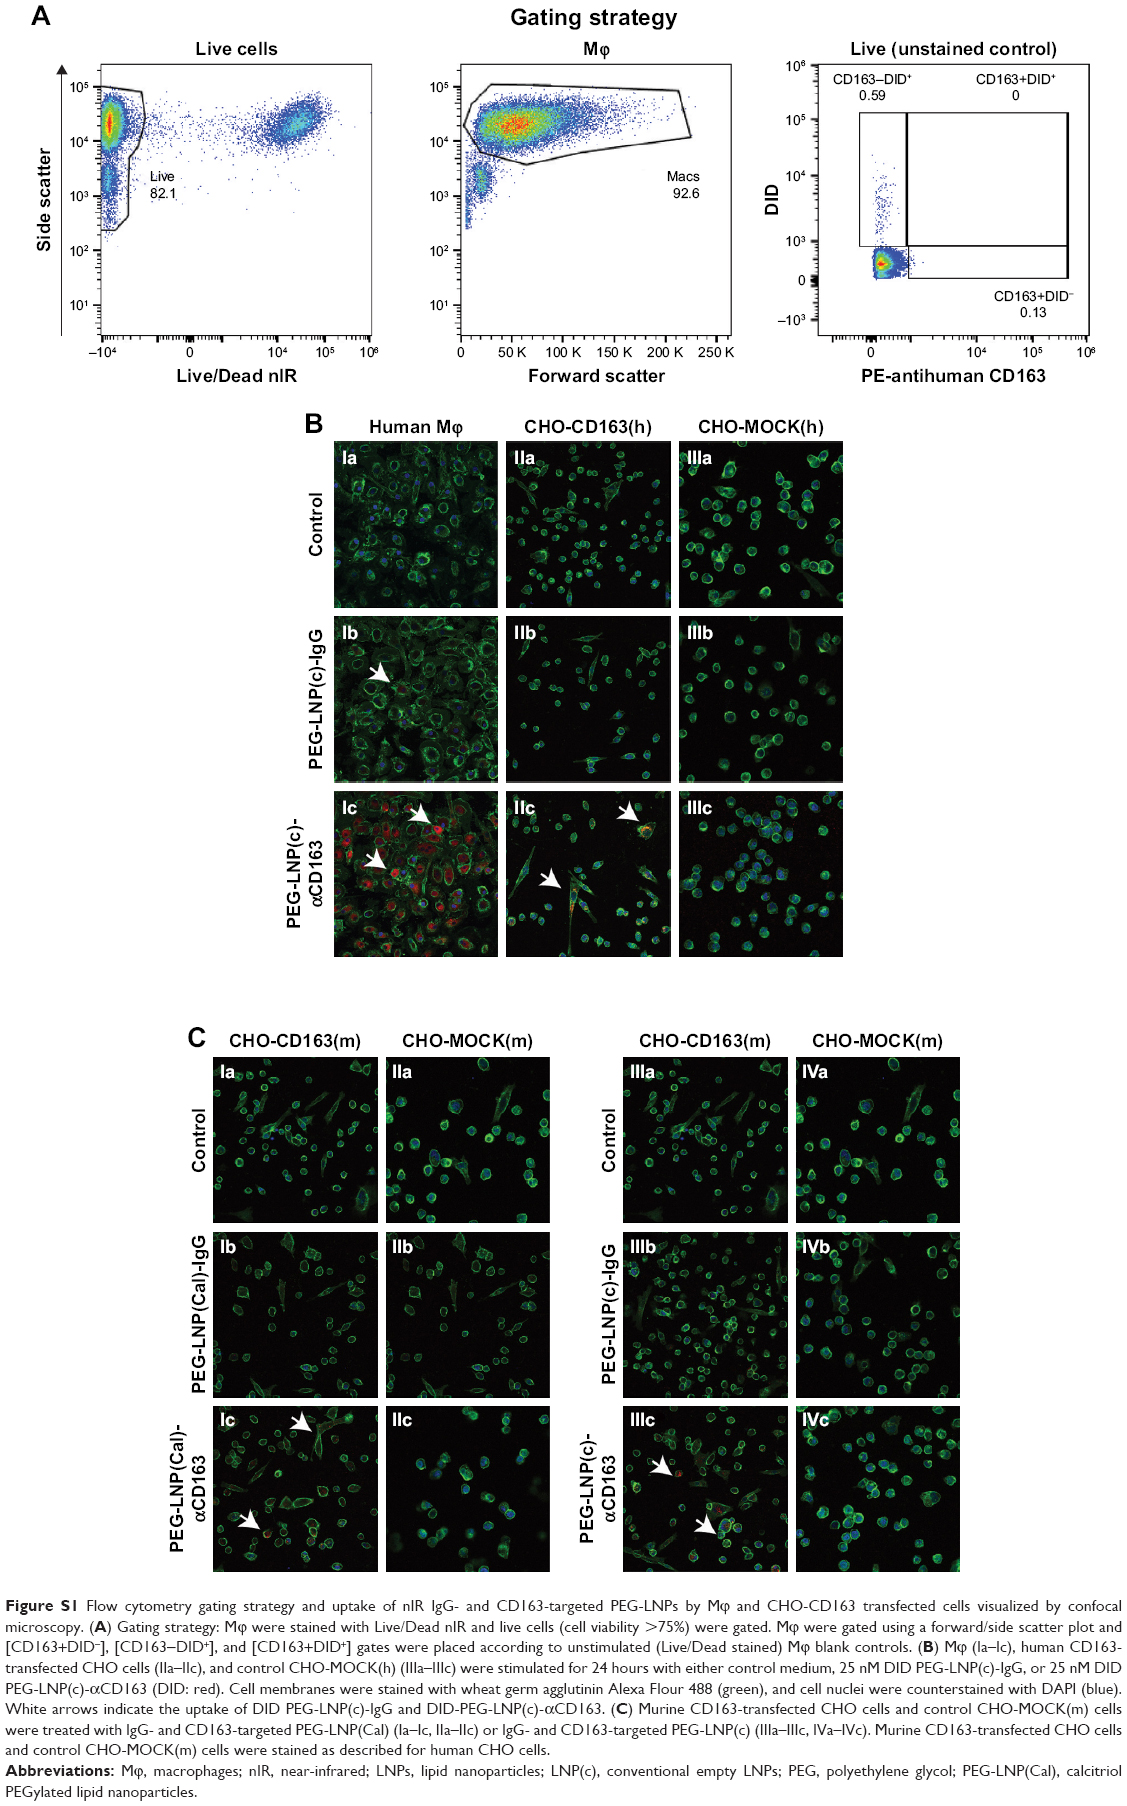
To assess the CD163-mediated cellular uptake of targeted PEG-LNP(Cal) and PEG-LNP(c), human Mϕ were treated with non-targeted IgG and CD163-targeted DID PEG-LNP(Cal) for 24 hours. LNP uptake was investigated by flow cytometry, and histograms revealed a heterogenic expression of CD163 in control Mϕ (Figures 2A and S1A). We observed an increased uptake of DID-PEG-LNP(Cal)-αhCD163 by Mϕ. In contrast, we observed modest uptake of DID-PEG-LNP(Cal) and DID-PEG-LNP(Cal)-IgG by Mϕ. Targeted calcitriol LNPs were most likely internalized via CD163; however, DID-PEG-LNP(Cal) may have been taken up by phagocytic Mϕ and PEG-LNP(Cal)-IgG may be internalized through the surface Fc-receptor. Further, as reported by Etzerodt et al, our data suggest that PEG-LNP(Cal)-αhCD163 was specifically endocytosed through CD163 in Mϕ.35 CD163-mediated cellular uptake was also visualized using confocal microscopy. Human Mϕ, human and murine CD163-transfected CHO cells, and CHO-MOCK control cells were treated with 25 nM of IgG- and CD163-targeted DID PEG-LNP(Cal) for 24 hours. We observed increased uptake of PEG-LNP(Cal)-αhCD163 and PEG-LNP(c)-αCD163 (Figures 2B and S1B) in Mϕ compared to the uptake of irrelevant PEG-LNP(Cal)-IgG and PEG-LNP(c)-IgG in Mϕ. In contrast, we observed no uptake of PEG-LNP(Cal)-IgG in CHO-CD163(h) cells, but uptake of PEG-LNP(Cal)-αCD163 in CHO-CD163(h) cells. In addition, there was no uptake of either PEG-LNP(Cal)-αCD163 or PEG-LNP(Cal)-IgG in CHO-MOCK cells. This indicates that the uptake was CD163 specific and confirms that PEG-LNP(Cal)-αCD163 is internalized through CD163. Similarly, we observed specific uptake of PEG-LNP(Cal)-αCD163 in CHO-CD163 murine cells and no uptake of PEG-LNP(Cal)-IgG in CHO-CD163 murine cells (Figure S1C). Furthermore, CHO-MOCK cells (m) did not take up PEG-LNP(Cal)-IgG and PEG-LNP(Cal)-αCD163. Similar observations apply to the uptake of IgG- and CD163-targeted PEG-LNP(c) in CHO-CD163 and CHO-MOCK murine cells (Figure S2C).
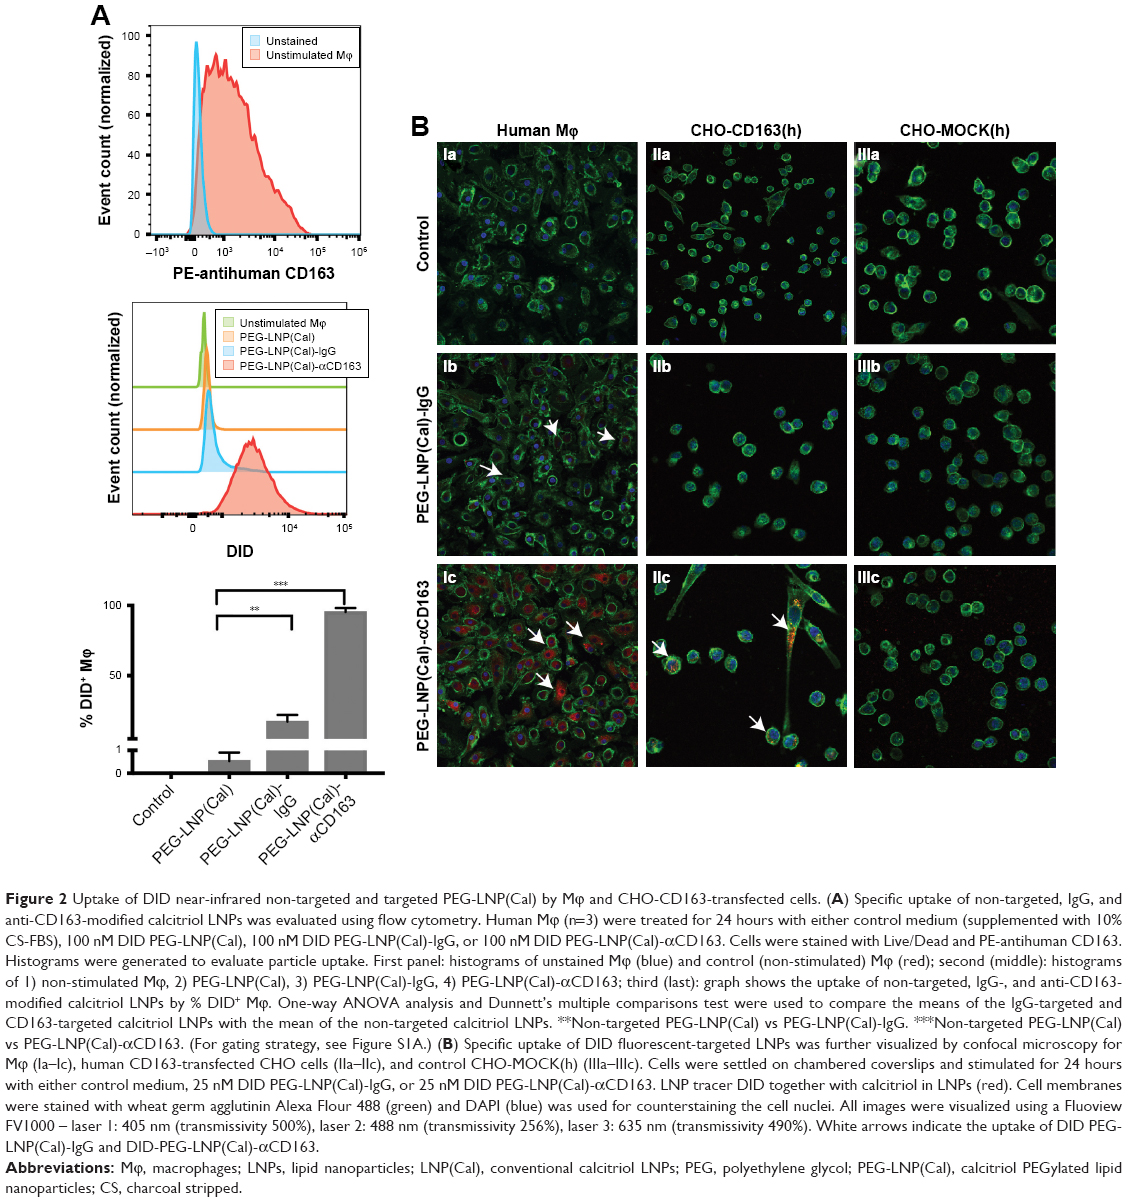 | Figure 2 Uptake of DID near-infrared non-targeted and targeted PEG-LNP(Cal) by Mϕ and CHO-CD163-transfected cells. (A) Specific uptake of non-targeted, IgG, and anti-CD163-modified calcitriol LNPs was evaluated using flow cytometry. Human Mϕ (n=3) were treated for 24 hours with either control medium (supplemented with 10% CS-FBS), 100 nM DID PEG-LNP(Cal), 100 nM DID PEG-LNP(Cal)-IgG, or 100 nM DID PEG-LNP(Cal)-αCD163. Cells were stained with Live/Dead and PE-antihuman CD163. Histograms were generated to evaluate particle uptake. First panel: histograms of unstained Mϕ (blue) and control (non-stimulated) Mϕ (red); second (middle): histograms of 1) non-stimulated Mϕ, 2) PEG-LNP(Cal), 3) PEG-LNP(Cal)-IgG, 4) PEG-LNP(Cal)-αCD163; third (last): graph shows the uptake of non-targeted, IgG-, and anti-CD163-modified calcitriol LNPs by % DID+ Mϕ. One-way ANOVA analysis and Dunnett’s multiple comparisons test were used to compare the means of the IgG-targeted and CD163-targeted calcitriol LNPs with the mean of the non-targeted calcitriol LNPs. **Non-targeted PEG-LNP(Cal) vs PEG-LNP(Cal)-IgG. ***Non-targeted PEG-LNP(Cal) vs PEG-LNP(Cal)-αCD163. (For gating strategy, see Figure S1A.) (B) Specific uptake of DID fluorescent-targeted LNPs was further visualized by confocal microscopy for Mϕ (Ia–Ic), human CD163-transfected CHO cells (IIa–IIc), and control CHO-MOCK(h) (IIIa–IIIc). Cells were settled on chambered coverslips and stimulated for 24 hours with either control medium, 25 nM DID PEG-LNP(Cal)-IgG, or 25 nM DID PEG-LNP(Cal)-αCD163. LNP tracer DID together with calcitriol in LNPs (red). Cell membranes were stained with wheat germ agglutinin Alexa Flour 488 (green) and DAPI (blue) was used for counterstaining the cell nuclei. All images were visualized using a Fluoview FV1000 – laser 1: 405 nm (transmissivity 500%), laser 2: 488 nm (transmissivity 256%), laser 3: 635 nm (transmissivity 490%). White arrows indicate the uptake of DID PEG-LNP(Cal)-IgG and DID-PEG-LNP(Cal)-αCD163. |
Effects of encapsulated calcitriol on pro-inflammatory cytokines and chemokines in Mϕ
To examine the anti-inflammatory effects of calcitriol, Mϕ were incubated with non-targeted PEG-LNP(Cal) and targeted PEG-LNP(Cal) for 24 hours prior to a 4-hour LPS challenge, followed by mRNA analysis of NF-κB, TNF-α, monocyte chemoattractant protein (MCP)-1, IL-6, and IL-10 gene expression. Both PEG-LNP(Cal) and targeted PEG-LNP(Cal) efficiently reduced NF-κB, TNF-α, MCP-1, and IL-6 mRNA gene expression in a dose-dependent manner (Figure 3A–D). However, since we observed effective uptake of CD163-targeted PEG-LNP(Cal) by Mϕ, we expected increased inhibition of pro-inflammatory markers by targeted treatment. Both PEG-LNP(Cal) and targeted PEG-LNP(Cal) upregulated IL-10 mRNA gene expression in LPS-treated Mϕ (Figure 3E), although this was not as effective as the positive glucocorticoid control, dexamethasone (Figure S2A–F). In addition, CD163 mRNA gene expression was not affected by pretreatment with either PEG-LNP(Cal) or targeted PEG-LNP(Cal) (Figure 3F). Since TNF-α and IL-6 are considered as highly important markers in inflammation because they are involved and overexpressed in most inflammatory states, we decided to assess TNF-α and IL-6 protein secretion in LPS-stimulated Mϕ pretreated with PEG-LNP(Cal) and targeted PEG-LNP(Cal) by ELISA.41 Both PEG-LNP(Cal) and targeted PEG-LNP(Cal) significantly suppressed TNF-α secretion in a dose-dependent manner as compared to treatment with free calcitriol in LPS-stimulated Mϕ (data not shown). Similarly, IL-6 secretion was slightly reduced, albeit not significantly, after treatment with both PEG-LNP(Cal) and targeted PEG-LNP(Cal) (Figure 3G and H). In addition, we further evaluated the effect of CD163-targeted PEG-LNP(Cal) on the surface marker expression of HLA-DR and CD80 in DID+ Mϕ. We observed that the expression of surface marker HLA-DR markedly declined in LPS-induced DID+ Mϕ pretreated with 100 nM of PEG-LNP(Cal)-αhCD163. Additionally, CD80 expression decreased in proportion to increasing calcitriol concentrations in DID+ Mϕ, however, but not compared to untreated LPS-induced Mϕ (Figure 3I and J).
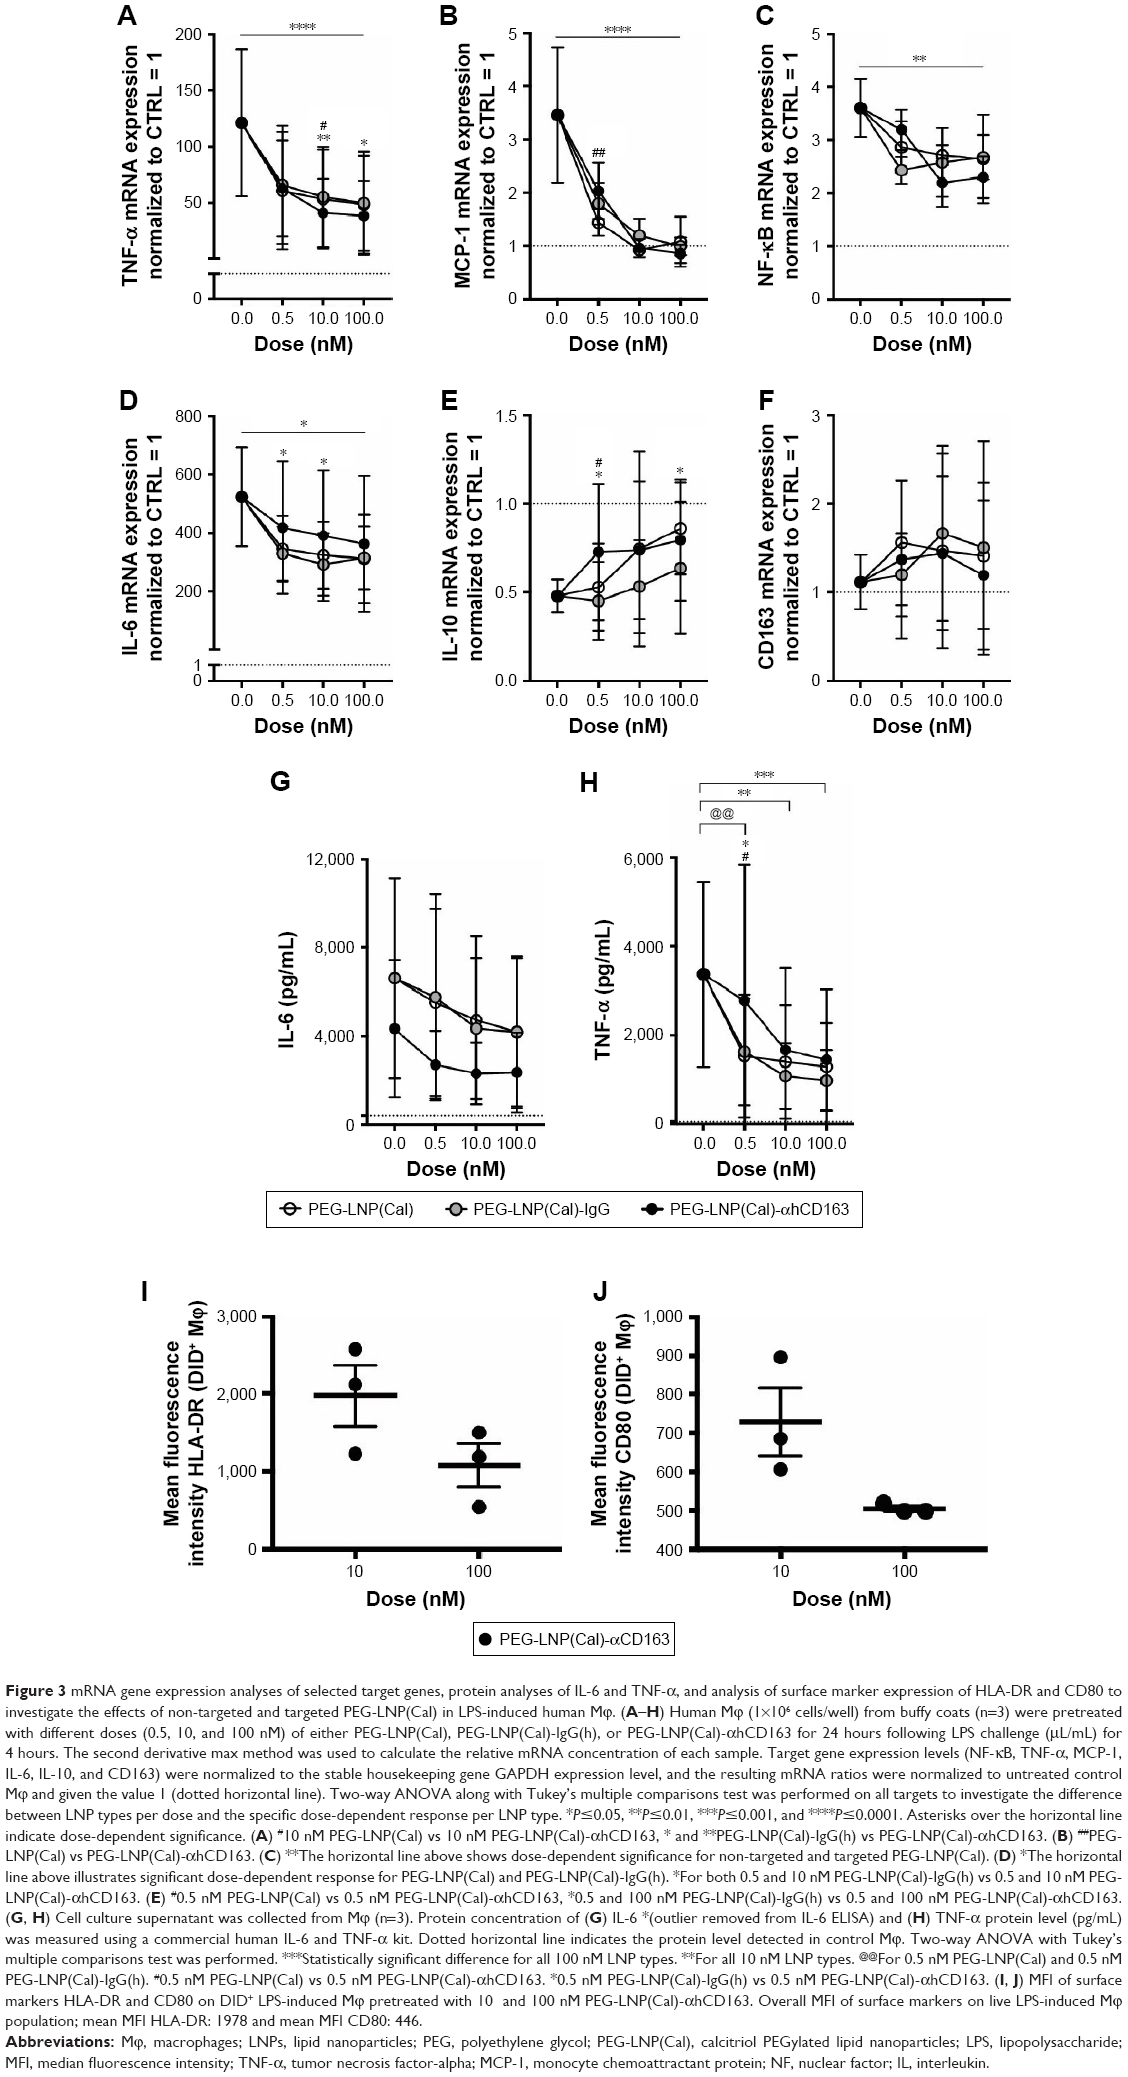 | Figure 3 mRNA gene expression analyses of selected target genes, protein analyses of IL-6 and TNF-α, and analysis of surface marker expression of HLA-DR and CD80 to investigate the effects of non-targeted and targeted PEG-LNP(Cal) in LPS-induced human Mϕ. (A–H) Human Mϕ (1×10⁶ cells/well) from buffy coats (n=3) were pretreated with different doses (0.5, 10, and 100 nM) of either PEG-LNP(Cal), PEG-LNP(Cal)-IgG(h), or PEG-LNP(Cal)-αhCD163 for 24 hours following LPS challenge (μL/mL) for 4 hours. The second derivative max method was used to calculate the relative mRNA concentration of each sample. Target gene expression levels (NF-κB, TNF-α, MCP-1, IL-6, IL-10, and CD163) were normalized to the stable housekeeping gene GAPDH expression level, and the resulting mRNA ratios were normalized to untreated control Mϕ and given the value 1 (dotted horizontal line). Two-way ANOVA along with Tukey’s multiple comparisons test was performed on all targets to investigate the difference between LNP types per dose and the specific dose-dependent response per LNP type. *P≤0.05, **P≤0.01, ***P≤0.001, and ****P≤0.0001. Asterisks over the horizontal line indicate dose-dependent significance. (A) #10 nM PEG-LNP(Cal) vs 10 nM PEG-LNP(Cal)-αhCD163, * and **PEG-LNP(Cal)-IgG(h) vs PEG-LNP(Cal)-αhCD163. (B) ##PEG-LNP(Cal) vs PEG-LNP(Cal)-αhCD163. (C) **The horizontal line above shows dose-dependent significance for non-targeted and targeted PEG-LNP(Cal). (D) *The horizontal line above illustrates significant dose-dependent response for PEG-LNP(Cal) and PEG-LNP(Cal)-IgG(h). *For both 0.5 and 10 nM PEG-LNP(Cal)-IgG(h) vs 0.5 and 10 nM PEG-LNP(Cal)-αhCD163. (E) #0.5 nM PEG-LNP(Cal) vs 0.5 nM PEG-LNP(Cal)-αhCD163, *0.5 and 100 nM PEG-LNP(Cal)-IgG(h) vs 0.5 and 100 nM PEG-LNP(Cal)-αhCD163. (G, H) Cell culture supernatant was collected from Mϕ (n=3). Protein concentration of (G) IL-6 *(outlier removed from IL-6 ELISA) and (H) TNF-α protein level (pg/mL) was measured using a commercial human IL-6 and TNF-α kit. Dotted horizontal line indicates the protein level detected in control Mϕ. Two-way ANOVA with Tukey’s multiple comparisons test was performed. ***Statistically significant difference for all 100 nM LNP types. **For all 10 nM LNP types. @@For 0.5 nM PEG-LNP(Cal) and 0.5 nM PEG-LNP(Cal)-IgG(h). #0.5 nM PEG-LNP(Cal) vs 0.5 nM PEG-LNP(Cal)-αhCD163. *0.5 nM PEG-LNP(Cal)-IgG(h) vs 0.5 nM PEG-LNP(Cal)-αhCD163. (I, J) MFI of surface markers HLA-DR and CD80 on DID+ LPS-induced Mϕ pretreated with 10 and 100 nM PEG-LNP(Cal)-αhCD163. Overall MFI of surface markers on live LPS-induced Mϕ population; mean MFI HLA-DR: 1978 and mean MFI CD80: 446. |
In vivo biodistribution and pharmacokinetic study of CD163-targeted calcitriol LNPs vs non-targeted calcitriol LNPs in mice
In order to address specific delivery and evaluate the biodistribution of the LNP system in healthy SWISS mice in vivo, DID PEG-LNP(Cal) were modified with αmCD163 or the corresponding control rat IgG. Live animals were imaged at 15, 45, 90, 150, and 210 minutes post-IV administration using a Xenogen IVIS® in vivo imaging system. Both PEG-LNP(Cal)-IgG and PEG-LNP(Cal)-αmCD163 showed increased accumulation in the upper abdominal part of the animals as compared to PEG-LNP(Cal), which seemed to circulate in the blood for a longer period of time (Figure 4A). An in vivo pharmacodynamic study was performed to assess the clearance of PEG-LNP(Cal) and IgG- and anti-CD163 mAB-modified PEG-LNP(Cal). Nine-week-old C57BL/6JRj mice (n=4) were injected IV with LNP formulations (0.1 mg/kg), and 20 μL blood samples were collected at seven different time points (T=1 and 30 minutes, and 1, 2, 4, 6, and 24 hours). The LNP DID fluorescence intensity was measured using a Xenogen in vivo imaging system (Figure 4B). Due to dilution of the total encapsulated calcitriol concentration in LNP formulations, which likely influenced the total DID fluorescence and particle concentration, a normalization factor was added to all total radiant efficiencies. We observed rapid clearance of PEG-LNP(Cal)-IgG and PEG-LNP(Cal)-αmCD163 in the first 30 minutes and up to 2 hours postinjection, compared to the prolonged circulation of PEG-LNP(Cal). We also observed a significant difference in the clearance of targeted PEG-LNP(Cal) compared to non-targeted PEG-LNP(Cal) over time from 4 to 6 hours (Figure 4B). PEG-coated particles are known as long circulating lipid particles and have longer half-lives compared to conventional or targeted LNPs.42 Blood samples collected 24 hours post-administration also confirmed the total clearance of non-targeted PEG-LNP(Cal), PEG-LNP(Cal)-IgG, and PEG-LNP(Cal)-αmCD163 in blood, comparable to the control PBS mice group (not shown). At 25 hours post-LNP administration, ex vivo imaging of the organs confirmed the accumulation of PEG-LNP(Cal) only in the liver, in contrast to the accumulation of PEG-LNP(Cal)-amCD163 in the liver and spleen. Moreover, we observed a similar accumulation of PEG-LNP(Cal)-IgG in the liver, spleen and (modestly) kidney (Figure 4C–D).
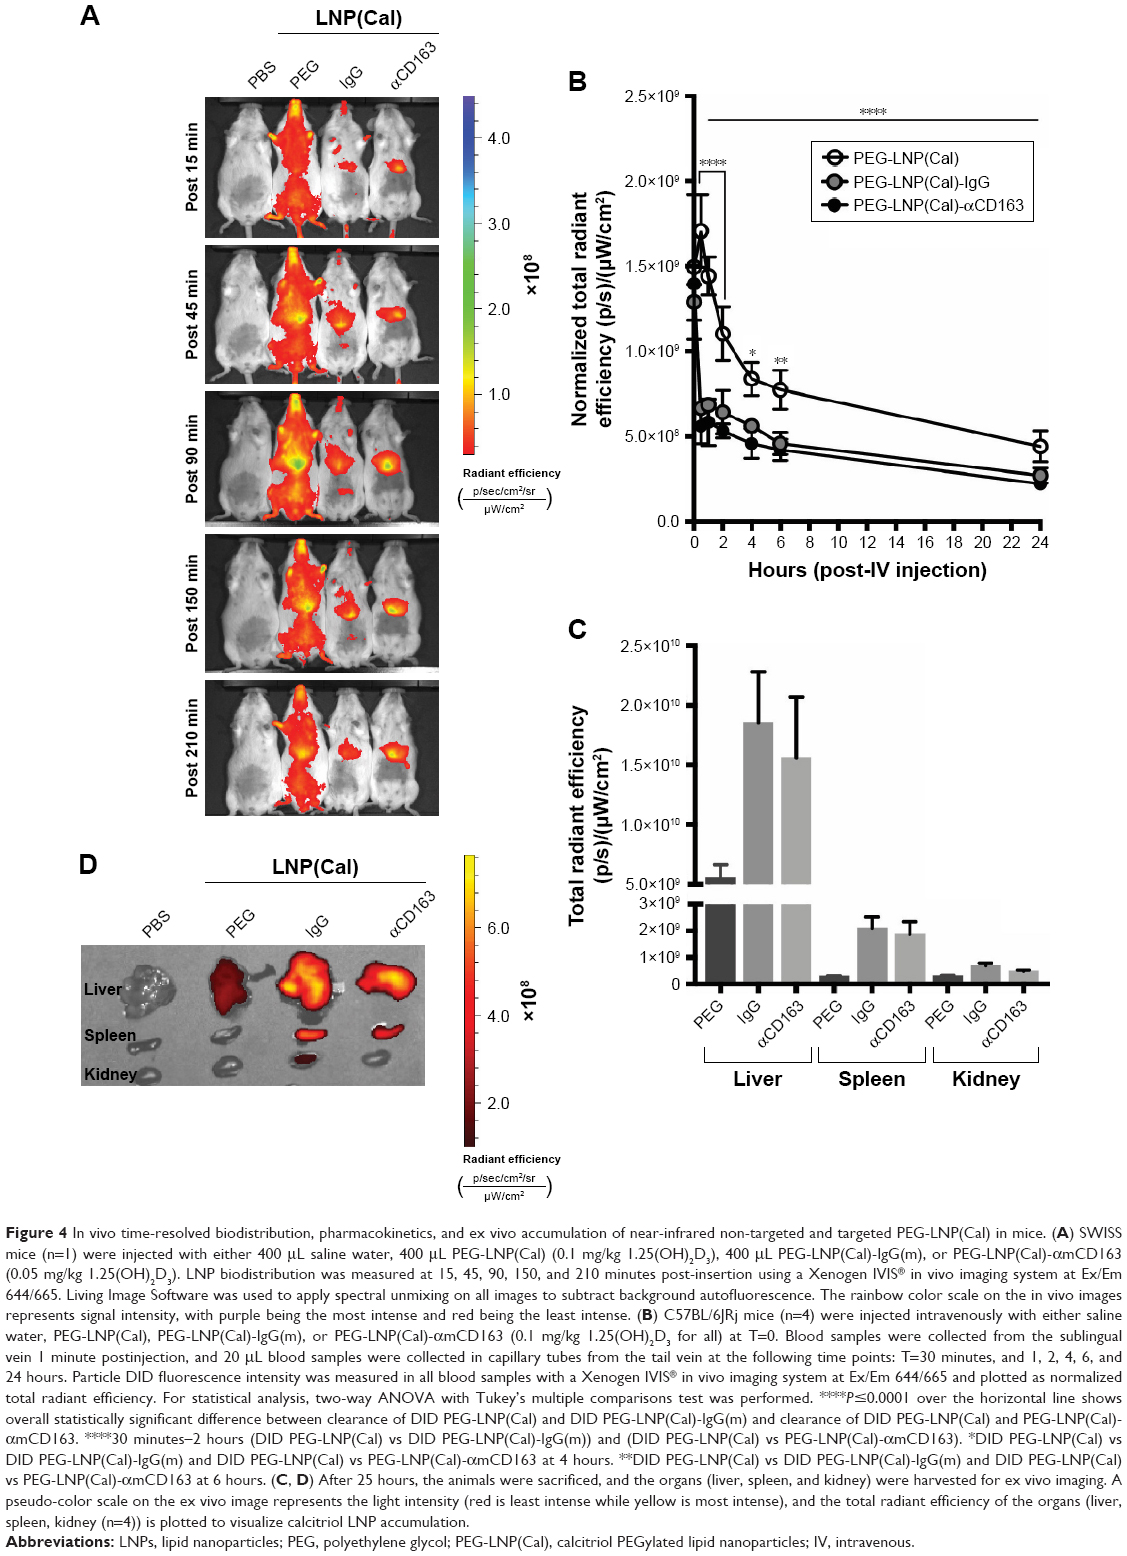 | Figure 4 In vivo time-resolved biodistribution, pharmacokinetics, and ex vivo accumulation of near-infrared non-targeted and targeted PEG-LNP(Cal) in mice. (A) SWISS mice (n=1) were injected with either 400 μL saline water, 400 μL PEG-LNP(Cal) (0.1 mg/kg 1.25(OH)2D3), 400 μL PEG-LNP(Cal)-IgG(m), or PEG-LNP(Cal)-αmCD163 (0.05 mg/kg 1.25(OH)2D3). LNP biodistribution was measured at 15, 45, 90, 150, and 210 minutes post-insertion using a Xenogen IVIS® in vivo imaging system at Ex/Em 644/665. Living Image Software was used to apply spectral unmixing on all images to subtract background autofluorescence. The rainbow color scale on the in vivo images represents signal intensity, with purple being the most intense and red being the least intense. (B) C57BL/6JRj mice (n=4) were injected intravenously with either saline water, PEG-LNP(Cal), PEG-LNP(Cal)-IgG(m), or PEG-LNP(Cal)-αmCD163 (0.1 mg/kg 1.25(OH)2D3 for all) at T=0. Blood samples were collected from the sublingual vein 1 minute postinjection, and 20 μL blood samples were collected in capillary tubes from the tail vein at the following time points: T=30 minutes, and 1, 2, 4, 6, and 24 hours. Particle DID fluorescence intensity was measured in all blood samples with a Xenogen IVIS® in vivo imaging system at Ex/Em 644/665 and plotted as normalized total radiant efficiency. For statistical analysis, two-way ANOVA with Tukey’s multiple comparisons test was performed. ****P≤0.0001 over the horizontal line shows overall statistically significant difference between clearance of DID PEG-LNP(Cal) and DID PEG-LNP(Cal)-IgG(m) and clearance of DID PEG-LNP(Cal) and PEG-LNP(Cal)-αmCD163. ****30 minutes–2 hours (DID PEG-LNP(Cal) vs DID PEG-LNP(Cal)-IgG(m)) and (DID PEG-LNP(Cal) vs PEG-LNP(Cal)-αmCD163). *DID PEG-LNP(Cal) vs DID PEG-LNP(Cal)-IgG(m) and DID PEG-LNP(Cal) vs PEG-LNP(Cal)-αmCD163 at 4 hours. **DID PEG-LNP(Cal) vs DID PEG-LNP(Cal)-IgG(m) and DID PEG-LNP(Cal) vs PEG-LNP(Cal)-αmCD163 at 6 hours. (C, D) After 25 hours, the animals were sacrificed, and the organs (liver, spleen, and kidney) were harvested for ex vivo imaging. A pseudo-color scale on the ex vivo image represents the light intensity (red is least intense while yellow is most intense), and the total radiant efficiency of the organs (liver, spleen, kidney (n=4)) is plotted to visualize calcitriol LNP accumulation. |
Discussion
To the best of our knowledge, this is the first study describing the targeting of calcitriol specifically to Mϕ using antibody-modified LNPs. Monocytes and Mϕ are key players in several inflammatory disorders and cancers, and specific targeting of these cells has been shown to result in increased drug efficacy with fewer side effects.35,43,44 In the case of vitamin D3 the risk of hypercalcemia hinders the use of high dose systemic treatment. Recent attempts have been made to overcome this involving the encapsulation of calcitriol in nanoemulsions, liposomes, and PLGA nanoparticles.2,3,31,45 Although such nanoparticles accumulate at the sites of inflammation or in tumor tissue due to the enhanced permeability and retention effect,46,47 further improvement of the therapeutic index may be obtained by specific targeting of the inflammatory cells, in essence reducing the adverse effects of toxic therapeutic agents caused by systemic uptake. We used the Mϕ specific receptor CD163 as a target for antibody-modified LNPs. CD163 is an obvious target due to its high expression on Mϕs in general and especially at sites of inflammation and cancer,48,49 as well as its endocytic nature, which results in the daily removal of gram levels of hemoglobin from the circulation.44,50 We successfully produced stable PEGylated calcitriol LNPs and were able to conjugate human and mouse mABs with a strong affinity for CD163 to the particles, as demonstrated by SPR analysis. Single cell analysis showed an increased uptake of PEG-LNP(Cal)-αCD163 by Mϕ compared to the internalization of PEG-LNP(Cal) and PEG-LNP(Cal)-IgG. Confocal microscopy confirmed that CD163-targeted calcitriol particles were effectively taken up by CD163-expressing CHO cells, whereas control IgG-modified particles were not. In Mϕ, we observed increased uptake of anti-CD163-modified calcitriol LNPs and a modest uptake of IgG-modified calcitriol LNPs. The latter result is probably due to the nonspecific uptake of IgG particles by Fc receptors. In an in vitro system of LPS stimulation of Mϕ, anti-CD163-modified, IgG-modified, and non-targeted calcitriol LNPs all showed a strong inhibitory effect on the mRNA gene expression of pro-inflammatory markers (TNF-α, NF-κB, MCP-1, and to a lesser extent, IL-6), but a stimulatory effect on anti-inflammatory IL-10. However, it has been reported that calcitriol induces MCP-1 expression in dendritic cells in multiple sclerosis patients51 but suppresses LPS-induced MCP-1 in the human monocytic cell line THP-1.52 The in vitro system, not reflecting the in vivo circulation, precludes the possibility for demonstrating a superior effect of receptor-targeted particles vs unmodified particles, as both types of LNPs will be taken up by Mϕ. Furthermore, even though we observed specific and significant increased internalization of CD163-targeted calcitriol LNPs by Mϕ, this was not fully reflected in the specific inhibitory effect of calcitriol on pro-inflammatory cytokine gene expression, as we observed an inhibitory effect on both IgG- and CD163-targeted and non-targeted LNPs. This may be due to the (short) 24-hour incubation period in vitro, as intracellular drug release and subsequent effects may be more efficient and effective after a longer incubation period (eg, 48–72 hours) with non-targeted and mAB-modified (IgG and CD163) calcitriol LNPs in vitro. Investigating the rate of drug (calcitriol) release in this specific drug-delivery system may also improve our understanding with regard to the lack of increased anti-inflammatory effects of CD163-targeted LNPs. Interestingly, we observed a dose-dependent decrease in the surface marker expression of HLA-DR and the co-stimulatory surface molecule CD80 exclusively in DID+ LPS-induced Mϕ pretreated with PEG-LNP(Cal)-αCD163. However, we observed a lower CD80 expression in untreated LPS-induced Mϕ. This may be due to the fact that the LPS-induced Mϕ mean fluorescence intensity (MFI) reflects the expression of CD80 in the total Mϕ population, whereas the surface expression of CD80 on PEG-LNP(Cal)-αCD163-treated Mϕ reflects the MFI of DID+ Mϕ. This problem could be avoided by treating Mϕ with empty targeted particles. In general, these data support the well-described anti-inflammatory and immunoregulatory role of calcitriol in myeloid cells.11,53–57 We then investigated the biodistribution and tissue accumulation of DID fluorescent non-targeted and mAB-modified (IgG and CD163) LNPs in vivo in mice. The increased circulation of PEG-LNPs in the blood flow could be due to their improved stability as well as the half-life extension of these LNPs, compared to conventional LNPs, which undergo rapid clearance due to destabilization and opsonization of plasma components.58,59 However, targeting LNPs toward specific monocyte/Mϕ receptors can provide effective uptake and thereby reduce uptake by other Mϕ subsets.35 We observed an increased accumulation of both PEG-LNP(Cal)-IgG and PEG-LNP(Cal)-αCD163 in the upper abdomen as compared to PEG-LNP(Cal). Due to the route of injection, mAB-modified calcitriol LNPs are most likely captured by hepatic Mϕ (Kupffer cells) in the liver and by splenic red-pulp Mϕ, as these cells are in direct contact with the bloodstream. Nevertheless, the uptake of IgG-targeted calcitriol LNPs, most likely by the Fc receptor, should also not be underestimated because these particles are also taken up by the majority of Mϕ in the liver and spleen. Interestingly, particle characteristics and the route of administration play a significant role in particle uptake and tissue-specific accumulation. IgG-modified LNP delivery systems administered subcutaneously have been shown to be useful for the targeting of, for example, regional lymph nodes,60 and orally administered Fc receptor-targeted nanoparticles have been shown to enter systemic circulation through transepithelial transport.61 In conclusion, our study shows for the first time the targeting of calcitriol specifically to Mϕ. In summary, we demonstrate the uptake and effect of PEGylated and AB-modified calcitriol LNPs on human Mϕ in vitro and bioavailability in vivo. We were able to deliver the bioactive metabolite to Mϕ. The targeting of CD163 for the specific delivery of calcitriol may be a useful approach for the treatment of chronic inflammatory diseases while potentially avoiding adverse side effects.
Acknowledgments
We acknowledge laboratory technicians Christina Strande Søndeskov and Helle Hausser Ryom, and animal caretaker Kristoffer Augustensen for their excellent technical assistance. Danish Council for Strategic Research (TRAIN 10-092797), Vilhelm Bangs Fund, Lily Benthine Lunds Fund of 1.6.1978, and Laegefonden supported the studies.
Author contributions
All authors contributed toward data analysis, drafting and revising the paper, gave final approval of the version to be published and agree to be accountable for all aspects of the work.
Disclosure
Dr Jonas H Graversen reports assistance from Affinicon during the conduct of the study. The authors report no other conflicts of interest in this work.
References
Immordino ML, Dosio F, Cattel L. Stealth liposomes: review of the basic science, rationale, and clinical applications, existing and potential. Int J Nanomedicine. 2006;1(3):297–315. | ||
Maradana MR, Yekollu SK, Zeng B, et al. Immunomodulatory liposomes targeting liver macrophages arrest progression of nonalcoholic steatohepatitis. Metabolism. 2018;78:80–94. doi:10.1016/j.metabol.2017.09.002 | ||
El-Sherbiny M, Eldosoky M, El-Shafey M, et al. Vitamin D nanoemulsion enhances hepatoprotective effect of conventional vitamin D in rats fed with a high-fat diet. Chem Biol Interact. 2018;288:65–75. doi:10.1016/j.cbi.2018.04.010 | ||
Tacke F. Targeting hepatic macrophages to treat liver diseases. J Hepatol. 2017;66(6):1300–1312. | ||
Svendsen P, Graversen JH, Etzerodt A, et al. Antibody-directed glucocorticoid targeting to CD163 in M2-type macrophages attenuates fructose-induced liver inflammatory changes. Mol Ther Methods Clin Dev. 2017;4:50–61. | ||
Nardin A, Lefebvre ML, Labroquere K, Faure O, Abastado JP. Liposomal muramyl tripeptide phosphatidylethanolamine: targeting and activating macrophages for adjuvant treatment of osteosarcoma. Curr Cancer Drug Targets. 2006;6(2):123–133. | ||
Neve A, Corrado A, Cantatore FP. Immunomodulatory effects of vitamin D in peripheral blood monocyte-derived macrophages from patients with rheumatoid arthritis. Clin Exp Med. 2014;14(3):275–283. | ||
Tacke F, Zimmermann HW. Macrophage heterogeneity in liver injury and fibrosis. J Hepatol. 2014;60(5):1090–1096. | ||
Schmidt-Arras D, Rose-John S. IL-6 pathway in the liver: from physiopathology to therapy. J Hepatol. 2016;64(6):1403–1415. | ||
Beilfuss J, Berg V, Sneve M, Jorde R, Kamycheva E. Effects of a 1-year supplementation with cholecalciferol on interleukin-6, tumor necrosis factor-alpha and insulin resistance in overweight and obese subjects. Cytokine. 2012;60(3):870–874. doi:10.1016/j.cyto.2012.07.032 | ||
Giulietti A, van Etten E, Overbergh L, Stoffels K, Bouillon R, Mathieu C. Monocytes from type 2 diabetic patients have a pro-inflammatory profile. 1,25-dihydroxyvitamin D(3) works as anti-inflammatory. Diabetes Res Clin Pract. 2007;77(1):47–57. doi:10.1016/j.diabres.2006.10.007 | ||
Beyer M, Mallmann MR, Xue J, et al. High-resolution transcriptome of human macrophages. PLoS One. 2012;7(9):e45466. doi:10.1371/journal.pone.0045466 | ||
Mills CD, Thomas AC, Lenz LL, Munder M. Macrophage: SHIP of immunity. Front Immunol. 2014;5:620. doi:10.3389/fimmu.2014.00620 | ||
Etzerodt A, Moestrup SK. CD163 and inflammation: biological, diagnostic, and therapeutic aspects. Antioxid Redox Signal. 2013;18(17):2352–2363. doi:10.1089/ars.2012.4834 | ||
Etzerodt A, Kjolby M, Nielsen MJ, Maniecki M, Svendsen P, Moestrup SK. Plasma clearance of hemoglobin and haptoglobin in mice and effect of CD163 gene targeting disruption. Antioxid Redox Signal. 2013;18(17):2254–2263. doi:10.1089/ars.2012.4605 | ||
Omatsu M, Kunimura T, Mikogami T, et al. Difference in distribution profiles between CD163+ tumor-associated macrophages and S100+ dendritic cells in thymic epithelial tumors. Diagn Pathol. 2014;9:215. doi:10.1186/s13000-014-0215-7 | ||
Di Rosa M, Malaguarnera G, De Gregorio C, Palumbo M, Nunnari G, Malaguarnera L. Immuno-modulatory effects of vitamin D3 in human monocyte and macrophages. Cell Immunol. 2012;280(1):36–43. doi:10.1016/j.cellimm.2012.10.009 | ||
Sylvia Christakos PD, Verstuyf A, Verlinden L, Carmeliet G. Vitamin D: metabolism, molecular mechanism of action and pleiotropic effects. Physiol Rev. 2016;96(1):365–408. | ||
Vanherwegen AS, Gysemans C, Mathieu C. Vitamin D endocrinology on the cross-road between immunity and metabolism. Mol Cell Endocrinol. 2017;453:52–67. doi:10.1016/j.mce.2017.04.018 | ||
Hewison M, Freeman L, Hughes SV, et al. Differential regulation of vitamin D receptor and its ligand in human monocyte-derived dendritic cells. J Immunol. 2003;170(11):5382–5390. | ||
Veldman CM, Cantorna MT, DeLuca HF. Expression of 1,25-dihydroxyvitamin D(3) receptor in the immune system. Arch Biochem Biophys. 2000;374(2):334–338. doi:10.1006/abbi.1999.1605 | ||
Chen S, Sims GP, Chen XX, Gu YY, Chen S, Lipsky PE. Modulatory effects of 1,25-dihydroxyvitamin D3 on human B cell differentiation. J Immunol. 2007;179(3):1634–1647. | ||
Jeffery LE, Wood AM, Qureshi OS, et al. Availability of 25-hydroxyvitamin D(3) to APCs controls the balance between regulatory and inflammatory T cell responses. J Immunol. 2012;189(11):5155–5164. doi:10.4049/jimmunol.1200786 | ||
Garbossa SG, Folli F. Vitamin D, sub-inflammation and insulin resistance. A window on a potential role for the interaction between bone and glucose metabolism. Rev Endocr Metab Disord. 2017;18:243–258. doi:10.1007/s11154-017-9423-2 | ||
Bessler H, Djaldetti M. 1alpha,25-dihydroxyvitamin D3 modulates the interaction between immune and colon cancer cells. Biomed Pharmacother. 2012;66(6):428–432. doi:10.1016/j.biopha.2012.06.005 | ||
Smith DC, Johnson CS, Freeman CC, Muindi J, Wilson JW, Trump DL. A Phase I trial of calcitriol (1,25-dihydroxycholecalciferol) in patients with advanced malignancy. Clin Cancer Res. 1999;5(6):1339–1345. | ||
Deeb KK, Trump DL, Johnson CS. Vitamin D signalling pathways in cancer: potential for anticancer therapeutics. Nat Rev Cancer. 2007;7(9):684–700. doi:10.1038/nrc2196 | ||
Chen Y, Liu W, Sun T, et al. 1,25-dihydroxyvitamin D promotes negative feedback regulation of TLR signaling via targeting microRNA-155-SOCS1 in macrophages. J Immunol. 2013;190(7):3687–3695. doi:10.4049/jimmunol.1203273 | ||
Chen Y, Zhang J, Ge X, Du J, Deb DK, Li YC. Vitamin D receptor inhibits nuclear factor kappaB activation by interacting with IkappaB kinase beta protein. J Biol Chem. 2013;288(27):19450–19458. doi:10.1074/jbc.M113.467670 | ||
Han X, Li L, Yang J, King G, Xiao Z, Quarles LD. Counter-regulatory paracrine actions of FGF-23 and 1,25(OH)2 D in macrophages. FEBS Lett. 2016;590(1):53–67. doi:10.1002/1873-3468.12040 | ||
Liu C, Shaurova T, Shoemaker S, Petkovich M, Hershberger PA, Wu Y. Tumor-targeted nanoparticles deliver a vitamin D-based drug payload for the treatment of EGFR tyrosine kinase inhibitor-resistant lung cancer. Mol Pharm. 2018;5(8):3216–3226. | ||
Zhigaltsev IV, Belliveau N, Hafez I, et al. Bottom-up design and synthesis of limit size lipid nanoparticle systems with aqueous and triglyceride cores using millisecond microfluidic mixing. Langmuir. 2012;28(7):3633–3640. | ||
Ulbrich W, Lamprecht A. Targeted drug-delivery approaches by nanoparticulate carriers in the therapy of inflammatory diseases. J R Soc Interface. 2010;7(Suppl 1):S55–S66. | ||
Alaarg A, Jordan NY, Verhoef JJ, Metselaar JM, Storm G, Kok RJ. Docosahexaenoic acid liposomes for targeting chronic inflammatory diseases and cancer: an in vitro assessment. Int J Nanomedicine. 2016;11:5027–5040. | ||
Etzerodt A, Maniecki MB, Graversen JH, Moller HJ, Torchilin VP, Moestrup SK. Efficient intracellular drug-targeting of macrophages using stealth liposomes directed to the hemoglobin scavenger receptor CD163. J Control Release. 2012;160(1):72–80. | ||
Madsen M, Moller HJ, Nielsen MJ, et al. Molecular characterization of the haptoglobin.hemoglobin receptor CD163. Ligand binding properties of the scavenger receptor cysteine-rich domain region. J Biol Chem. 2004;279(49):51561–51567. | ||
Torchilin VP, Levchenko TS, Lukyanov AN, et al. p-Nitrophenylcarbonyl-PEG-PE-liposomes: fast and simple attachment of speci¢c ligands, including monoclonal antibodies, to distal ends of PEG chains via p-nitrophenylcarbonyl groups. Biochim Biophys Acta. 2001;1511(2001):397–411. | ||
Marques-Gallego P, de Kroon AI. Ligation strategies for targeting liposomal nanocarriers. Biomed Res Int. 2014;2014:129458. | ||
Vandooren J, Born B, Solomonov I, et al. Circular trimers of gelatinase B/matrix metalloproteinase-9 constitute a distinct population of functional enzyme molecules differentially regulated by tissue inhibitor of metalloproteinases-1. Biochem J. 2015;465(2):259–270. | ||
Andersen CL, Jensen JL, Orntoft TF. Normalization of real-time quantitative reverse transcription-PCR data: a model-based variance estimation approach to identify genes suited for normalization, applied to bladder and colon cancer data sets. Cancer Res. 2004;64(15):5245–5250. | ||
Jain A, Barve A, Zhao Z, Jin W, Cheng K. Comparison of avidin, neutravidin, and streptavidin as nanocarriers for efficient siRNA delivery. Mol Pharm. 2017;14(5):1517–1527. | ||
Dong YD, Tchung E, Nowell C, et al. Microfluidic preparation of drug-loaded PEGylated liposomes, and the impact of liposome size on tumour retention and penetration. J Liposome Res. 2017;29(1):1–9. | ||
Granfeldt A, Hvas CL, Graversen JH, et al. Targeting dexamethasone to macrophages in a porcine endotoxemic model. Crit Care Med. 2013;41(11):e309–e318. | ||
Graversen JH, Svendsen P, Dagnaes-Hansen F, et al. Targeting the hemoglobin scavenger receptor CD163 in macrophages highly increases the anti-inflammatory potency of dexamethasone. Mol Ther. 2012;20(8):1550–1558. | ||
Ramalho MJ, Loureiro JA, Gomes B, Frasco MF, Coelho MA, Pereira MC. PLGA nanoparticles as a platform for vitamin D-based cancer therapy. Beilstein J Nanotechnol. 2015;6:1306–1318. | ||
Lameijer MA, Tang J, Nahrendorf M, Beelen RH, Mulder WJ. Monocytes and macrophages as nanomedicinal targets for improved diagnosis and treatment of disease. Expert Rev Mol Diagn. 2013;13(6):567–580. | ||
Jain RK, Stylianopoulos T. Delivering nanomedicine to solid tumors. Nat Rev Clin Oncol. 2010;7(11):653–664. | ||
Wynn TA, Chawla A, Pollard JW. Macrophage biology in development, homeostasis and disease. Nature. 2013;496(7446):445–455. | ||
Murray PJ, Wynn TA. Protective and pathogenic functions of macrophage subsets. Nat Rev Immunol. 2011;11(11):723–737. | ||
Kristiansen M, Graversen JH, Jacobsen C, et al. Identification of the haemoglobin scavenger receptor. Nature. 2001;409(6817):198–201. | ||
Sanseverino I, Rinaldi AO, Purificato C, et al. CCL2 induction by 1,25(OH)2D3 in dendritic cells from healthy donors and multiple sclerosis patients. J Steroid Biochem Mol Biol. 2014;144(Pt A):102–105. | ||
Wang YC, Hsieh CC, Kuo HF, et al. Effect of vitamin D3 on monocyte chemoattractant protein 1 production in monocytes and macrophages. Acta Cardiol Sin. 2014;30(2):144–150. | ||
Tokuda N, Mizuki N, Kasahara M, Levy RB. 1,25-dihydroxyvitamin D3 down-regulation of HLA-DR on human peripheral blood monocytes. Immunology. 1992;75(2):349–354. | ||
Rigby WF, Waugh M, Graziano RF. Regulation of human monocyte HLA-DR and CD4 antigen expression, and antigen presentation by 1,25-dihydroxyvitamin D3. Blood. 1990;76(1):189–197. | ||
Almerighi C, Sinistro A, Cavazza A, Ciaprini C, Rocchi G, Bergamini A. 1Alpha,25-dihydroxyvitamin D3 inhibits CD40L-induced pro-inflammatory and immunomodulatory activity in human monocytes. Cytokine. 2009;45(3):190–197. | ||
Heine G, Niesner U, Chang HD, et al. 1,25-dihydroxyvitamin D(3) promotes IL-10 production in human B cells. Eur J Immunol. 2008;38(8):2210–2218. | ||
Penna G, Adorini L. 1,25-dihydroxyvitamin D3 inhibits differentiation, maturation, activation, and survival of dendritic cells leading to impaired alloreactive T cell activation. J Immunol. 2000;164(5):2405–2411. | ||
Sercombe L, Veerati T, Moheimani F, Wu SY, Sood AK, Hua S. Advances and challenges of liposome assisted drug delivery. Front Pharmacol. 2015;6:286. | ||
Kraft JC, Freeling JP, Wang Z, Ho RJ. Emerging research and clinical development trends of liposome and lipid nanoparticle drug delivery systems. J Pharm Sci. 2014;103(1):29–52. | ||
Moghimi SM, Moghimi M. Enhanced lymph node retention of subcutaneously injected IgG1-PEG2000-liposomes through pentameric IgM antibody-mediated vesicular aggregation. Biochim Biophys Acta. 2008;1778(1):51–55. | ||
Pridgen EM, Alexis F, Kuo TT, et al. Transepithelial transport of Fc-targeted nanoparticles by the neonatal fc receptor for oral delivery. Sci Transl Med. 2013;5(213):213ra167. |
Supplementary materials
 | Figure S1 Flow cytometry gating strategy and uptake of nIR IgG- and CD163-targeted PEG-LNPs by Mϕ and CHO-CD163 transfected cells visualized by confocal microscopy. (A) Gating strategy: Mϕ were stained with Live/Dead nIR and live cells (cell viability >75%) were gated. Mϕ were gated using a forward/side scatter plot and [CD163+DID−], [CD163-DID+], and [CD163+DID+] gates were placed according to unstimulated (Live/Dead stained) Mϕ blank controls. (B) Mϕ (Ia–Ic), human CD163-transfected CHO cells (IIa–IIc), and control CHO-MOCK(h) (IIIa–IIIc) were stimulated for 24 hours with either control medium, 25 nM DID PEG-LNP(c)-IgG, or 25 nM DID PEG-LNP(c)-αCD163 (DID: red). Cell membranes were stained with wheat germ agglutinin Alexa Flour 488 (green), and cell nuclei were counterstained with DAPI (blue). White arrows indicate the uptake of DID PEG-LNP(c)-IgG and DID-PEG-LNP(c)-αCD163. (C) Murine CD163-transfected CHO cells and control CHO-MOCK(m) cells were treated with IgG- and CD163-targeted PEG-LNP(Cal) (Ia–Ic, IIa–IIc) or IgG- and CD163-targeted PEG-LNP(c) (IIIa–IIIc, IVa–IVc). Murine CD163-transfected CHO cells and control CHO-MOCK(m) cells were stained as described for human CHO cells. |
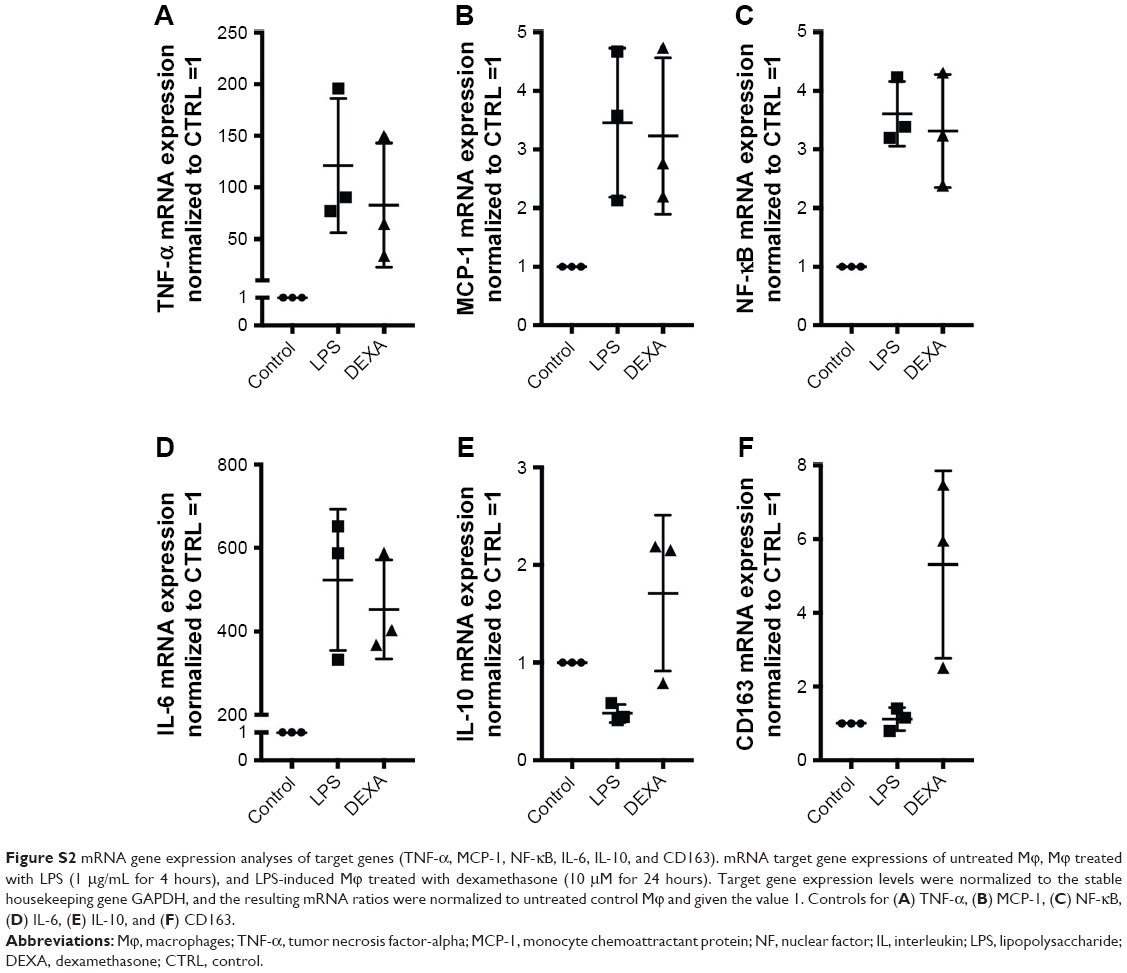 | Figure S2 mRNA gene expression analyses of target genes (TNF-α, MCP-1, NF-κB, IL-6, IL-10, and CD163). mRNA target gene expressions of untreated Mϕ, Mϕ treated with LPS (1 μg/mL for 4 hours), and LPS-induced Mϕ treated with dexamethasone (10 μM for 24 hours). Target gene expression levels were normalized to the stable housekeeping gene GAPDH, and the resulting mRNA ratios were normalized to untreated control Mϕ and given the value 1. Controls for (A) TNF-α, (B) MCP-1, (C) NF-κB, (D) IL-6, (E) IL-10, and (F) CD163. |
 © 2019 The Author(s). This work is published and licensed by Dove Medical Press Limited. The full terms of this license are available at https://www.dovepress.com/terms.php and incorporate the Creative Commons Attribution - Non Commercial (unported, v3.0) License.
By accessing the work you hereby accept the Terms. Non-commercial uses of the work are permitted without any further permission from Dove Medical Press Limited, provided the work is properly attributed. For permission for commercial use of this work, please see paragraphs 4.2 and 5 of our Terms.
© 2019 The Author(s). This work is published and licensed by Dove Medical Press Limited. The full terms of this license are available at https://www.dovepress.com/terms.php and incorporate the Creative Commons Attribution - Non Commercial (unported, v3.0) License.
By accessing the work you hereby accept the Terms. Non-commercial uses of the work are permitted without any further permission from Dove Medical Press Limited, provided the work is properly attributed. For permission for commercial use of this work, please see paragraphs 4.2 and 5 of our Terms.