")
Back to Journals » International Journal of Nanomedicine » Volume 13
Tailor-made PL-UC-C3 nanoparticles for fluorescence/computed tomography imaging-guided cascade amplified photothermal therapy
Authors Xie X, Song J, Hu Y, Zhuang S, Wang Y, Zhao Y, Lu Q
Received 20 September 2018
Accepted for publication 24 October 2018
Published 19 November 2018 Volume 2018:13 Pages 7633—7646
DOI https://doi.org/10.2147/IJN.S188169
Checked for plagiarism Yes
Review by Single anonymous peer review
Peer reviewer comments 2
Editor who approved publication: Dr Mian Wang
Xinhui Xie,1 Jialei Song,1 Yili Hu,1 Suyang Zhuang,1 Yuntao Wang,1 Yunlei Zhao,2 Qian Lu2
1Department of Orthopedics, Zhong Da Hospital, School of Medicine, Southeast University, Nanjing, Jiangsu 210093, China; 2Department of Biomedical Engineering, College of Engineering and Applied Sciences, Nanjing University, Nanjing, Jiangsu 210093, China
Background: Development of the burgeoning number of photothermal therapy (PTT) agents has drawn a huge amount of interest, since PTT treatment is a powerful and effective alternative to traditional treatments. Optimal PTT agents should integrate some essential preconditions including negligible systemic toxicity, deep penetration into tumor tissues, and maximum laser energy absorbance. Unfortunately, only few of the PTT agents reported could meet all of the above mentioned conditions.
Methods: Here, we report a brand new PTT agent through the encapsulation of NaGdF4:Yb,Tm@NaGdF4:Yb (UCNPs) and an organic compound (C3) into poly-e-caprolactone-polyethylene-polyglycol (PCL-PEG) (PL-UC-C3 NPs).
Results: UCNPs as an up-conversion material and C3 as a PTT agent both feature low cytotoxicity, and most importantly, UCNPs with superior conversion efficiency could efficiently absorb the energy of a 980 nm laser, transform the near-infrared laser light into visible light, and translate the palingenetic visible light to C3. The usage of a 980 nm laser ensures a deeper penetration and lower energy, while the highly efficient absorption and transformation process confers a cascade amplified hyperthermia for tumor treatment.
Conclusion: In this regard, our research provides a powerful and robust breakthrough for florescence/computed tomography imaging-guided PTT treatment, lighting up the clinical application in cancer treatment.
Keywords: photothermal therapy, PCL-PEG, up-conversion, excellent photothermal stability, high heat conversion efficiency
Introduction
Despite the 5-year survival rate being modestly elevated, mainly owing to the advances in traditional cancer treatments including chemotherapy, radiotherapy, and surgery, most cancer patients cannot be completely cured and continue to suffer from tumor recurrence and tumor metastasis. Two leading causes can be accounted for this condition. On the one hand, the tumor treatment is impressively blocked by the tumor microenvironment.1,2 The extreme conditions existing in tumor microenvironment, such as hypoxia, metabolic stress, insufficient blood supply, and so on, endow tumor cells with treatment resistance and the ability to survive adversity.3,4 On the other hand, traditional cancer treatments face dire challenges due to chemotherapeutic tolerance in chemotherapy, side effect in radiotherapy, and invisible small lesions in surgery.5,6 As such, seeking new avenues for tumor treatment is of paramount significance in clinical application.
Photothermal therapy (PTT), characterized by the selective transformation of absorbed light into heat, has been increasingly regarded as a potential alternative to traditional cancer treatments attributed to the noninvasive nature and highly effective tumor killing.7 To prevent the surrounding tissues from being affected in the process of tumor hyperthermia ablation, ideal photothermal agents which are capable of absorbing near-infrared (NIR) laser and converting the absorbed laser into heat are urgently desired to be designed.8–16 Recently, various PTT agents have been investigated, including noble-metal nanomaterials, polymer nanoparticles, semiconductor nanomaterials, and carbon-based nanomaterials, because they exhibit strong NIR absorbency.17–24 It is successful to some extent because NIR laser-induced PTT is bound to avoid the thermal ablation of normal tissue owing to deep penetration and low energy of NIR laser irradiation. However, most PTT agents, especially metal-based PTT agents, feature high toxicity to normal tissues, therefore restricting their clinical application.25 Research community has been attempting to leverage organic nanomaterials which have low toxicity as alternatives, and relevant studies have been recently reported.26,27
Previously, we tailor-made an organic nanomaterial named C3, which was used to eradicate tumor by combination with another photodynamic therapy (PDT) agent named indocyanine green (ICG).18 In that study, without the help of PDT, PTT alone rendered by C3 under 808 nm laser irradiation played a small role in tumor inhibition. It is reasonable that C3 has poor absorbency in NIR. Note that C3 has an extremely high absorption peak at 450 nm, thus visible light maybe more appropriate to be utilized in this platform. However, visible light suffers from a shallower penetration, thus wasting the laser energy and offering ineffective hyperthermia for tumor treatment.
It was reported that gadolinium-based up-conversion nanoparticles (Gd UCNPs) were extensively utilized to arm the phototherapy and the conversion efficiency of Gd UCNPs increased in the wake of increasing the mix proportion of ytterbium (Yb) to some extent.28 Based on this, we prepared PL-UC-C3 NPs, in which UCNPs with superior conversion efficiency were employed to absorb NIR laser light and transform it into visible light. In this platform, both C3 and UCNPs feature low cytotoxicity as demonstrated via MTT assay. Taking advantage of a 980 nm laser, deep penetration and low energy were acquired, thus causing little damage to normal tissues. After the transformation of NIR laser light into visible light and the subsequent capture of visible light by C3, an impressive hyperthermia was generated as analyzed by the in vivo data. As a proof-of-concept study, the feasibility of our platform to cascade convert NIR laser light into visible light achieves the highly effective tumor inhibition and the less damage to normal tissues. The whole process is illustrated in Figure 1. Collectively, our research provides a powerful and robust platform for the cascade conversion in PTT, providing a promising protocol for clinical application in cancer treatment.
 | Figure 1 When the PL-C3-UC or PL-C3 nanoparticles were injected into the body, they were stable and had prolonged circulation life in the blood. |
Materials and methods
Materials and animals
Thulium oxide (Tm2O3, 99.9%), gadolinium oxide (Gd2O3, 99.9%), and ytterbium oxide (Yb2O3, 99.9%) were supplied from Linen Technology Development Co. Ltd. (Shanghai, China). 1-Octadecene (ODE, >90%), oleylamine (>80%), oleic acid (OA, >90%), trifluoroacetic acid sodium salt (NaCF3COO, 99%), trifluoroacetic acid (CF3COOH, 99%), poly-e-caprolactone-polyethylene (PCL, 98%), and polyglycol (PEG, 98%) were acquired from J&K Science (Beijing, China). Ethanol (AR) and chloral hydrate (AR) were obtained from Shanghai Lingfeng Chemical Reagent Co., Ltd. (Shanghai, China). MTT, FBS, DMEM, buffered saline (PBS, pH =7.4), trypsin, LysoTracker Red DND-99 Kit, and Annexin V-FITC Apoptosis Staining/Detection Kit were purchased from KeyGEN BioTECH (Nanjing, China). All chemicals in this experiment were used as received without further purification. Both the human umbilical vein endothelial cells (HUVECs) and murine mammary carcinoma cell lines (4T1) were obtained from the Nanjing Institute of Cell Biology (Nanjing, China). All cell experiment protocols, methods, and procedures were performed in accordance with relevant guidelines and regulations of the Medical Ethics Review Committee of Nanjing University. The Balb/c mice (female, 4–6 weeks) were bought from Comparative Medicine Center of Yangzhou University. Animal experiments were approved by the Care Committee of Nanjing University (including guidelines for animal care and use, and guidelines for euthanasia of mice, Protocol #: 20170411–015).
Synthesis of Ln(CF3COO)3
An appropriate amount of lanthanide oxide was mixed with excessive deionized water and trifluoroacetic acid, and then the mixture was transferred to a flask and heated to boiling reflux for 6 hours. After that, the solvent was evaporated and the obtained power samples were dried in an air-circulating oven at 140°C for 12 hours.
Synthesis of NaGdF4:Yb,Tm@NaGdF4:Yb (UCNPs)
UCNPs were synthesized by a hot injection method. A total of 320 mg Gd(CF3COO)3, 50 mg Yb(CF3COO)3, and 130 mg NaCF3COO were dissolved in a mixture containing 3 mL OA and 3 mL ODE with stirring, and then the solution was heated to 130°C with magnetic stirring under vacuum for 30 minutes to remove dissolved oxygen and other impurities. After cooling to room temperature, the mixture was collected and marked as mixture A. Afterward, 400 mg Gd(CF3COO)3, 50 mg Yb(CF3COO)3, 10 mg Tm(CF3COO)3, and 130 mg NaCF3COO were added into a flask and dissolved in 4 mL OA and 4 mL ODE, and heated to 130°C under vacuum for 30 minutes. Subsequently, the temperature was set to 320°C at 5°C/min under the protection of Ar. Then mixture A was injected into the above system slowly and kept at 320°C for 1 hour. Finally, the product was collected with centrifugation at 16,000 rpm for 20 minutes and washed with absolute ethanol for several times.
Synthesis of (UCNPs, C3)@PCL-PEG (PL-UC-C3)
First, PEG-PCL (50 mg) was synthesized as per our previous report and dispersed in deionized water (50 mL).18 Five milligrams of C3 and 5 mg of UCNPs were dispersed in 10 mL dichloromethane and added into the above mentioned 50 mL suspension under ultrasonic stirring for 30 minutes. Then, the reaction system was heated to 70°C for 20 minutes to evaporate additional dichloromethane. Finally, the sample was separated by centrifugation at 6,000 rpm for 10 minutes, and washed with deionized water and absolute ethanol for several times.
Characterization
The morphological characteristics of the samples were observed by transmission electron microscopy (TEM, Model Tecnai 12; Philips Co., Ltd., Amsterdam, Netherlands). The size and size distribution of the samples were measured with dynamic light scattering (DLS, BI-90Plus; Brookhaven Instruments). The crystalline phases were determined by powder X-ray diffraction (XRD, Karlsruhe, Germany) using Cu Kα radiation (λ=1.5418 Å). The UV-vis absorbance spectra of the samples were recorded by UV-vis spectrophotometry (UV3100; Shimadzu, Tokyo, Japan). The up-conversion fluorescence of the sample was recorded by fluorescence instrument (FLS 980; Edinburgh, England).
In vitro cytotoxicity assay (MTT assay)
A MTT test was adopted to verify the cytotoxicity of PL-UC-C3. Briefly, 4T1 cells and HUVECs were incubated in a 96-well plate (5×10³ cells/well) overnight, and then various concentrations of PL-UC-C3 mixed with 200 μL of fresh culture medium were added into each well for 24 hours. After that, the medium was replaced with 200 μL of fresh culture medium containing 20 μL of MTT reagent (5 mg/mL) and incubated at 37°C for another 2 hours. Finally, the cell viability of each well was analyzed with an iMark Enzyme mark instrument (Bio-Rad Laboratories Inc., Hercules, CA, USA) by detecting the absorbance at 490 nm. The data were treated from the average of three tests.
Intracellular internalization analysis
4T1 cells were seeded in a glass bottom dish and incubated at 37°C for overnight. After that, 50 μL of PL-UC-C3 (1 mg/mL) was added, and the dish was placed in an incubator at 37°C for another 2 hours. Then the 4T1 cells were washed with PBS and stained with LysoTracker Red DND-99 (2 μL in 1 mL PBS). The treated samples were observed under a confocal laser scanning microscope (CLSM 700; Zeiss, Jena, Germany) with an excitation wavelength of 980 nm and an emission wavelength of 440 nm for signing PL-UC-C3, and LysoTracker Red DND-99 was treated with an excitation wavelength of 488 nm and an emission wavelength of 625 nm to mark lysosome.
PTT study
The mice bearing 4T1 tumor were injected with 200 μL of products (5 mg/mL) via vena caudalis and anesthetized with 4% chloral hydrate at 8 hours post-injection. Then the mice were placed on an operating table and irradiated with a 980 nm laser (500 mW/cm2), and the thermal images of the mice were recorded by a thermal imager (IRS 600; Fotric, Dalas, TX, USA). In addition, the thermal circulation ability of PL-UC-C3 was detected in a small beaker (5 mL). Briefly, 1 mg of PL-UC-C3 was dispersed in 1 mL of deionized water and transferred to the beaker. A 980 nm laser (500 mW/cm2) was used to activate the samples until the temperature reached 45°C, and after cooling to initial temperature, the operation was repeated for several times.
Fluorescence imaging in vivo
The nanocomposite was applied to diagnose tumor and exhibit the distribution in vivo using an imager (IVIS Spectrum; Perkin Elmer, Waltham, MA, USA). The 4T1 tumor-bearing mice were injected intravenously with 200 μL of saline containing PL-UC-C3 (5 mg/mL), and the luminescence imaging was noted down by testing the sign at 650 nm.
Computed tomography imaging
For CT imaging in vitro, different concentrations (1.25, 2.5, 5, 10, and 20 mg/mL, respectively) of PL-UC-C3 were stored in a 24-well plate and detected by a 64-Detector CT (Discovery CT 750HD; GE Amersham Healthcare System, Milwaukee, WI, USA). For CT imaging in vivo, the 4T1 tumor-bearing mice were intravenously injected with 200 μL of PL-UC-C3 (20 mg/mL) and recorded by the 64-Detector CT 8 hours post-injection.
Biodistribution of PL-UC-C3 NPs in vivo
In order to investigate the degree of nanocomposite enrichment in tumor and primary organs, the mice bearing 4T1 tumor were intravenously injected with 200 μL of PL-UC-C3 (5 mg/mL) and sacrificed at 1, 2, 4, 8, and 24 hours after the injection. Then the tumor and primary organs (heart, liver, spleen, lung, and kidney) were harvested and dissolved in the fresh aqua regia. After that, the biodistribution of PL-UC-C3 was quantified by an inductively coupled plasma mass spectrometry (Agilent 7,500 ce).
In vivo antitumor effect
Balb/c mice were inoculated in subcutaneous right forelimb armpit with 4T1 cells (1×10⁷ per mouse). While the tumor volume reached 100 mm3, 4T1 tumor-bearing mice were randomly divided into six groups with eight mice per group: saline group, 450 nm plus a 980 nm laser group, PL-C3 plus a 450 nm laser group, PL-C3 plus a 980 nm laser group, PL-UC-C3 plus a 450 nm laser group, and PL-UC-C3 plus a 980 nm laser group. The mice in saline group, PL-C3 plus a 450 nm laser group, PL-C3 plus a 980 nm laser group, PL-UC-C3 plus a 450 nm laser group, and PL-UC-C3 plus a 980 nm laser group were intravenously injected at a dose of 200 μL (5 mg/mL), and according to grouping, the mice were exposed to a 450 nm or 980 nm laser (500 mW/cm2) 8 hours after injection. Then, the tumor volume and body weight were recorded every day and the mice were sacrificed on 14th day; then the tumors were collected and fixed in 4% paraformaldehyde. H&E staining and ki67 staining of the tumors were implemented by Nanjing KeyGEN BioTECH Company and observed by a fluorescence microscope (XD-202; Jiang Nan, Nanjing, China). In addition, to study the histological changes in mice, the primary organs (heart, liver, spleen, lung, and kidney) were treated with PL-UC-C3 plus a 980 nm laser, and were later made into sections and stained with H&E at different periods of time (1, 7, 15, and 30 days). Besides, the remaining mice were prepared to study the survival situation.
Hematology and biochemical assay
In order to measure the long-term cytotoxicity in mice treated with PL-UC-C3 plus a 980 nm laser, the blood was collected in a sodium EDTA anticoagulant tube for hematology assay. The total bilirubin, total protein, and the alanine aminotransferase levels were determined to assess the liver function. Creatinine level and blood urea nitrogen were used to evaluate the kidney function. The spleen function was evaluated by the production of platelets. The immune response was evaluated by testing lymphocytes, neutrophils, and monocytes, while behavioral approach system, eosinophils, and red blood cell levels were leveraged to assess the cytotoxicity of treatment process.
Statistical analysis
All the data in this work were obtained from the average of experiments conducted in triplicate and analyzed via Student’s t-test by leveraging the GraphPad Prism (version 7.5) software at a significance level of P<0.05. The significant differences are marked by asterisks.
Results and discussion
Characterization of PL-UC-C3
The morphology and size of the products were characterized by TEM. As shown in Figure 2A and B, both UCNPs and PL-C3 NPs presented a homogeneously dispersed morphology with a size of about 16 nm and 60 nm, respectively. After the encapsulation of UCNPs into PL-C3 NPs to acquire PL-UC-C3 NPs, uniformly spherical and mono-dispersed NPs could be noticed in the TEM micrographs (Figure 2C) with a mean diameter of 80 nm, which is larger than the size of PL-C3 NPs, thereby robustly indicating the effective encapsulation of UCNPs. The corresponding size distribution was measured through the investigation of hydrodynamic diameter using the DLS. From Figure 2D, a slight increase in hydrodynamic diameter compared to TEM data and a narrow size distribution are clearly depicted. The XRD spectra of UCNPs and PL-UC-C3 are presented in Figure 2E. Compared with the standard hexagonal-NaGdF4 (JCPDS 027–0699), the corresponding peaks were observed in UCNPs and PL-UC-C3, indicating the successful synthesis of UCNPs and the successful encapsulation of UCNPs in PC-UC-C3. Furthermore, to ensure the successful encapsulation of C3 in PC-UC-C3, UV-vis absorption spectra of relevant nanoparticles were tested (Figure 2F). Quite evidently, similar absorption peaks of C3 were detected in the curve of PL-UC-C3 NPs, illustrating that C3 was successfully integrated in PCL-PEG. The up-conversion emissions of PL-UC-C3 and UCNPs were detected by exciting with a 980 nm laser. As illustrated in Figure 2G, the maximum intensity of UCNPs was found at 440 and 470 nm, which exactly matched the absorption peaks of C3, suggesting that the stimulated luminescence could be absorbed by C3 for PTT. Furthermore, the vast majority of luminous energy (less than 600 nm) emitted by UCNPs was absorbed by C3 while up-conversion emissions at 650 nm was negligibly affected, which confirmed that the tumor could be detected through fluorescence diagnosis at 650 nm (Figure 2H).
 | Figure 2 (A) TEM image of UCNPs in ethanol. (B) TEM image of PL-C3 in deionized water. (C) TEM image of PL-UC-C3 in deionized water. (D) DLS analysis of UCNPs, PL-C3, and PL-UC-C3. (E) Powder XRD diffraction patterns of UCNPs and PL-UC-C3. (F) UV-vis spectra of UCNPs, C3, and PL-UC-C3 (1 mg/mL all). (G) Up-conversion emission spectra of UCNPs and UV-vis spectrum of C3. (H) Up-conversion emission spectra of UCNPs and PL-UC-C3. |
In vitro biocompatibility and cytotoxicity profiles
Intelligent and smart nanoparticles featuring low cytotoxicity and excellent biocompatibility were a critical and essential precondition for the in vivo application. First, an intracellular internalization experiment was performed. As observed in Figure 3A, red-marked (625 nm) lysosome with an excitation wavelength of 488 nm and blue-marked (440 nm) PL-UC-C3 with an excitation wavelength of 980 nm were perfectly merged, indicating that the nanocomposites were swallowed by cells via endocytosis. Next, the biocompatibility and cell toxicity of PL-UC-C3 were tested using cancer cell (4T1) and normal cell (HUVEC) lines, respectively; as reflected in Figure 3B and C, the cell viability was sustained at high levels when co-cultured with PL-UC-C3 at low concentrations. Furthermore, 80% of the cells survived even when the concentrations reached 2,000 μg/mL, which fully demonstrated the good biocompatibility of PL-UC-C3.
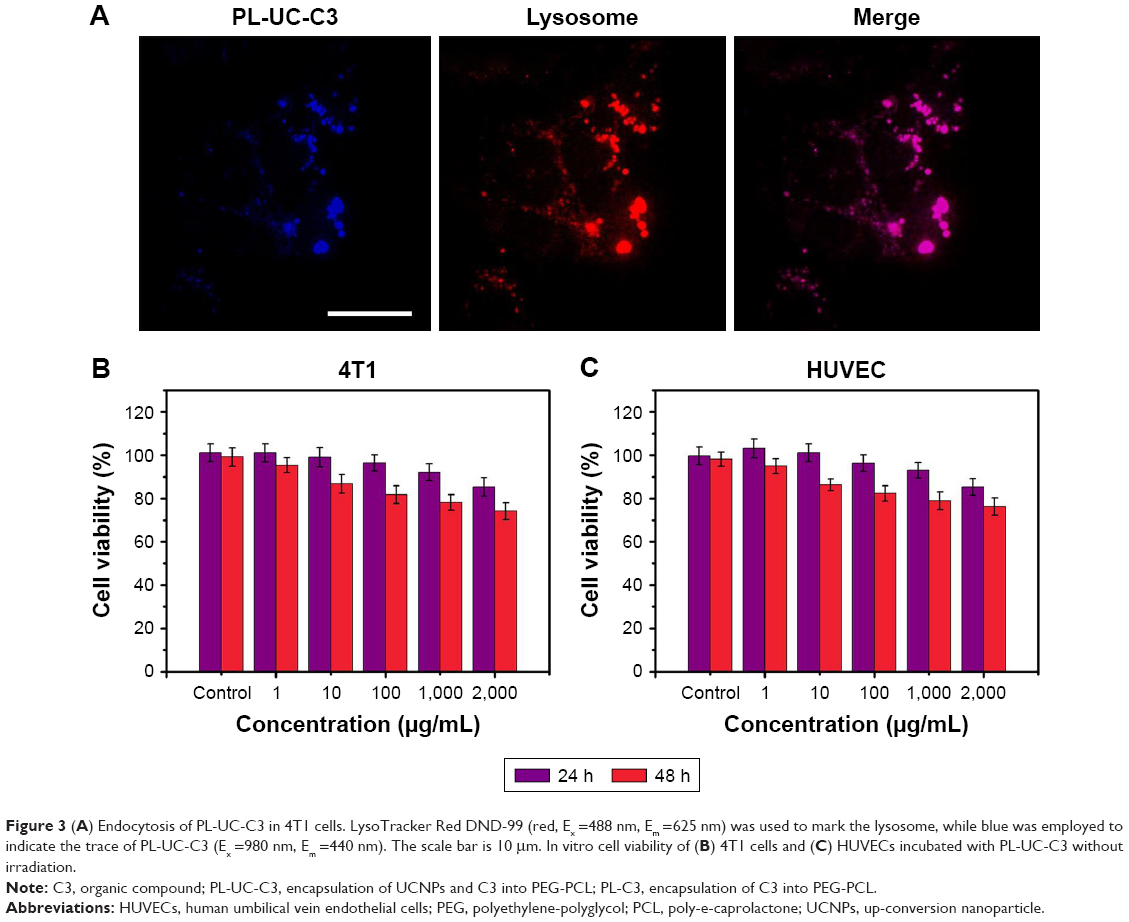 | Figure 3 (A) Endocytosis of PL-UC-C3 in 4T1 cells. LysoTracker Red DND-99 (red, Ex =488 nm, Em =625 nm) was used to mark the lysosome, while blue was employed to indicate the trace of PL-UC-C3 (Ex =980 nm, Em =440 nm). The scale bar is 10 μm. In vitro cell viability of (B) 4T1 cells and (C) HUVECs incubated with PL-UC-C3 without irradiation. |
PTT efficacy
A crucial issue in PTT treatment is the light–thermal conversion efficiency. Hence, a rational design composed of maximum light absorption and deep tumor penetration should be judiciously considered and exploited. In this platform, a 980 nm laser (500 mW/cm2) was adopted to irradiate PL-UC-C3 NPs for PTT treatment, and we hypothesized that the introduction of UCNPs would bring a phenomenal advancement in hyperthermia. From Figure 4A, we could find that compared with saline group or laser alone group, PL-C3 group only obtained a small increase in temperature, regardless of the irradiation by a 980 nm or 450 nm laser mainly because of the ignorable absorption of 980 nm laser by C3 and the low penetration of 450 nm laser. Notably, the additional engagement of UCNPs was game changing and PL-UC-C3 displayed a significant temperature change under the irradiation of a 980 nm laser owing to the highly efficient absorption and transformation ability of light. The corresponding time–temperature curves of above mentioned groups are recorded in Figure 4B, from which we could notice that the temperature in tumor site increased uninhibitedly and reached 46.6°C under the irradiation of a 980 nm laser for 10 minutes, supplying a hyperthermia beyond the tolerance of cancer cells. In contrast, in other group without the addition of UCNPs or without the help of a 980 nm laser, the temperature increased slowly and the tumor would eventually survive the sublethal hyperthermia. Besides, excellent thermal circulation ability was confirmed (Figure 4C). Taken together, PL-UC-C3 NPs have the promising potential for the cascade conversion PTT treatment.
 | Figure 4 (A) Photothermal imaging of 4T1 tumor-bearing mice intravenously injected with saline, PL-C3, or PL-UC-C3 after irradiation with a 450 nm or 980 nm (500 mW/cm2) laser for 10 minutes. (B) The time–temperature curve of A. (C) Temperature of PL-UC-C3 NP solution (1 mg dispersed in 1 mL of deionized water) after five cycles of NIR laser irradiation (500 mW/cm2, 8 minutes each time)/cooling down (1 h) process. |
Fluorescence imaging analysis
Fluorescence imaging was carried out to confirm the in vivo distribution of PL-UC-C3. The mice bearing 4T1 tumor were sacrificed 8 hours after the injection. As shown in Figure 5A, the fluorescence signal was detected in tumor site, proving the highly effective enrichment of nanoparticles in tumor tissues. Subsequently, the tumor and major organs were harvested and fluorescence imaging was conducted 8 hours after the injection (Figure 5B), and an extremely strong fluorescence signal was detected in tumor while relatively weak fluorescence signals were detected in liver and spleen, which was identical with the data of in vivo fluorescence imaging. All the above mentioned results indicated that PL-UC-C3 could be enriched in tumor site and play an indispensable role in guiding the tumor treatment.
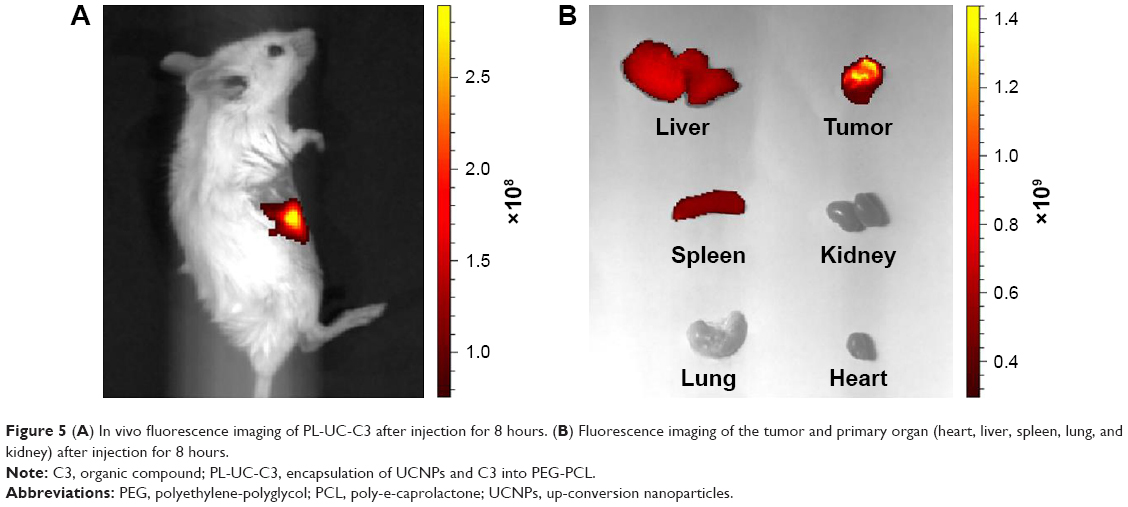 | Figure 5 (A) In vivo fluorescence imaging of PL-UC-C3 after injection for 8 hours. (B) Fluorescence imaging of the tumor and primary organ (heart, liver, spleen, lung, and kidney) after injection for 8 hours. |
CT imaging detection
CT as a very robust and smart imaging tool was employed to guild the PTT treatment rendered by PL-UC-C3 NPs. As observed in Figure 6A and B, a linear relationship was obtained between intensity and concentration, and with the increase of the concentration, the contrast ratio of material and background was increased rapidly. As depicted in Figure 6C, a moderate CT signal was detected in tumor position 8 hours after the intravenous injection, while no detective CT signal was found in control group, clarifying the feasibility of PL-UC-C3 NPs as CT agents to mark the tumor and guide the PTT treatment.
 | Figure 6 (A) In vitro CT imaging of PL-UC-C3 with different concentrations (0, 1.25, 2.5, 5, 10, and 20 mg/mL) in 24-well plates. (B) The corresponding linear relation curve of PL-UC-C3 between concentration and intensity. (C) In vivo CT imaging of PL-UC-C3 8 hours after the injection. The red circles depict the tumor positions. |
Biodistribution analysis
After the injection of 200 μL of PL-UC-C3 (5 mg/mL), tumor and primary organs were harvested to analyze the distribution condition of Gd. As seen in Figure 7, PL-UC-C3 was initially concentrated in liver, and as time went by, the nanocomposites were increasingly enriched in tumor with the Gd content decreasing in liver. The result was coincident with that of fluorescence imaging and CT imaging, suggesting that PL-UC-C3 displayed a typical enhanced permeability and retention effect.29–31
 | Figure 7 In vivo distribution profiles of PL-UC-C3 in tissues of 4T1 tumor-bearing mice at different time points post-intravenous injection. |
In vivo antitumor effect
To verify the therapeutic effect of PL-UC-C3 on a 4T1 tumor-bearing mouse model, saline or nanocomposites were intravenously injected. The body weight and tumor volume were recorded on day 14 of the treatment period, and the survival cycle of mice was also studied for a longer period of time. Obviously, the group treated with PL-UC-C3 under a 980 nm laser irradiation exhibited a great inhibition function in tumor size (Figure 8A), while the tumors rapidly increased in the saline and NIR laser groups, and for PL-C3 plus a 450 nm laser group, PL-C3 plus a 980 nm laser group, and PL-UC-C3 plus a 450 nm group, the tumor volumes grew slowly at the beginning of treatment, but the increase rate of tumor volume gradually recovered on day 10. Moreover, the subacute toxicity of material was analyzed through the body weight detection. As shown in Figure 8B, there was no obvious change in body weight of mice, indicating innocuity of the nanocomposites. Furthermore, the survival cycle of 4T1 tumor-bearing mice is presented in Figure 8C, which shows that all the mice that did not undergo treatment died at different time points, while there was no case of death in PL-UC-C3 plus a 980 nm laser group. Besides, the representative tumor pictures are presented in Figure 8D, from which we could conclude that PL-UC-C3 exhibited the most superior PTT treatment effect against 4T1 tumor.
 | Figure 8 (A) Tumor volumes of 4T1 tumor-bearing mice that received different treatments as indicated. The data are presented as mean ± SD (n=8). ***P<0.001. (B) Body weight of 4T1 tumor-bearing mice that received different treatments as displayed. (C) Survival curves of 4T1 tumor-bearing mice that received different treatments as indicated. (D) Photographs of tumors dissected from mice that received different treatments as displayed. |
After receiving different treatments, the mice were sacrificed and the tumors were collected. The H&E and ki67 staining assays were conducted to analyze the treatment effect of PTT. As analyzed by H&E staining in Figure 9A, the tissue morphology of tumor was in good condition and no obvious necrotic and apoptotic areas were observed in saline and laser irradiation group. Contrarily, a spot of necrotic and apoptotic area was observed in PL-C3 plus a 450 nm laser group, PL-C3 plus a 980 nm laser group, and PL-UC-C3 plus a 450 nm laser group, while a large amount of necrosis (red arrows) and apoptosis (green arrows) were detected in PL-UC-C3 plus a 980 nm laser group. Ki67 staining analysis and the quantification for Ki67 staining were further used to study the cell’s proliferation and differentiation (Figure 9B and C). A large amount of tumor proliferation was observed in the control group, while the game was changing in PL-UC-C3 plus a 980 nm laser group and only a slight tumor proliferation was presented, again implying that cascade amplified hyperthermia rendered by PL-UC-C3 plus a 980 nm laser for tumor treatment was superior to other groups.
 | Figure 9 (A) H&E staining of 4T1 tumors after different treatments (red arrow: necrosis; green arrow: apoptosis). The scale bar is 50 μm. (B) Ki67 staining of 4T1 tumors after different treatments. The scale bar is 50 μm. (C) The quantification study for Ki67 staining of 4T1 tumors after different treatments. *P<0.05, **P<0.01, ***P<0.001. |
Long-term cytotoxicity
In order to confirm the safety of cascade amplified PTT rendered by PL-UC-C3 plus a 980 nm laser to the body, a histological and hematology analysis was conducted. For histological analysis, the organs were treated with H&E staining. As shown in Figure 10, no obvious harm was found after treating with hyperthermia rendered by PL-UC-C3 plus a 980 nm laser in different time periods by contrast with untreated group. For the hematology analysis (Figure 11), we could find that despite indexes being unstable in the initial stage, they returned to normal level after a week. All the results of this study illustrated that the harmless PL-UC-C3 NPs could have greater prospects for application in tumor treatment and diagnosis.
 | Figure 10 Studies of the long-term toxicity of the cascade amplified PTT treatment rendered by PL-UC-C3 plus a 980 nm laser through the H&E staining of heart, liver, spleen, lung, and kidney for 1, 7, 15, and 30 days after the treatment. |
 | Figure 11 Serum biochemical study 1, 7, 15, and 30 days after the cascade amplified PTT treatment rendered by PL-UC-C3 plus a 980 nm laser (n=3 at each time point). |
Conclusion
We tailor-made PL-UC-C3 NPs which could efficiently absorb the energy of a 980 nm laser, transform them into a visible light, and deliver the light to C3, thus accomplishing a cascade amplified hyperthermia. The usage of a 980 nm laser confirms a deeper penetration and lower energy, while the highly efficient absorption and transformation process offers a phenomenal hyperthermia for tumor treatment. Finally, florescence/CT-guided PTT treatment successfully eliminated 4T1 tumor, throwing a light on its clinical application in cancer treatment.
Acknowledgment
The work was supported by the National Natural Science Foundation of China (81572109).
Author contributions
All authors contributed to data analysis, drafting and revising the article, gave final approval of the version to be published, and agree to be accountable for all aspects of the work.
Disclosure
The authors report no conflicts of interest in this work.
References
Joyce JA, Pollard JW. Wmicroenvironmental regulation of metastasis. Nat Rev Cancer. 2009;9(4):239–252. | ||
Quail DF, Joyce JA. Microenvironmental regulation of tumor progression and metastasis. Nat Med. 2013;19(11):1423–1437. | ||
Mathew R, Karantza-Wadsworth V, White E. Role of autophagy in cancer. Nat Rev Cancer. 2007;7(12):961–967. | ||
Folkman J. Angiogenesis and apoptosis. Semin Cancer Biol. 2003;13(2):159–167. | ||
Wang K, Wu X, Wang J, Huang J. Cancer stem cell theory: therapeutic implications for nanomedicine. Int J Nanomedicine. 2013;8:899–908. | ||
Dearnaley DP, Khoo VS, Norman AR, et al. Comparison of radiation side-effects of conformal and conventional radiotherapy in prostate cancer: a randomised trial. Lancet. 1999;353(9149):267–272. | ||
Lecaros RL, Huang L, Lee TC, Hsu YC. Nanoparticle delivered VEGF-A siRNA enhances photodynamic therapy for head and neck cancer treatment. Mol Ther. 2016;24(1):106–116. | ||
Zhang C, Cheng X, Chen M, et al. Fluorescence guided photothermal/photodynamic ablation of tumours using pH-responsive chlorin e6-conjugated gold nanorods. Colloids Surf B Biointerfaces. 2017;160:345–354. | ||
He Y, Shen Y, Zhou S, et al. Near infrared dye loaded copper sulfide-apoferritin for tumor imaging and photothermal therapy. RSC Adv. 2018;8(26):14268–14279. | ||
Zhang C, Ren J, Hua J, et al. Multifunctional Bi2WO6 Nanoparticles for CT-Guided Photothermal and Oxygen-free Photodynamic Therapy. ACS Appl Mater Interfaces. 2018;10(1):1132–1146. | ||
Zhao S, Tian Y, Liu W, et al. High and low molecular weight hyaluronic acid-coated gold nanobipyramids for photothermal therapy. RSC Adv. 2018;8(16):9023–9030. | ||
Sun H, Lv Y, Zhang C, et al. Materials with low dielectric constant and loss and good thermal properties prepared by introducing perfluorononenyl pendant groups onto poly(ether ether ketone). RSC Adv. 2018;8(14):7753–7760. | ||
Liu Z, Liu J, Wang R, Du Y, Ren J, Qu X. An efficient nano-based theranostic system for multi-modal imaging-guided photothermal sterilization in gastrointestinal tract. Biomaterials. 2015;56:206–218. | ||
Yang RM, Fu CP, Fang JZ, et al. Hyaluronan-modified superparamagnetic iron oxide nanoparticles for bimodal breast cancer imaging and photothermal therapy. Int J Nanomedicine. 2017;12:197–206. | ||
Thapa RK, Choi JY, Poudel BK, Choi HG, Yong CS, Kim JO. Receptor-targeted, drug-loaded, functionalized graphene oxides for chemotherapy and photothermal therapy. Int J Nanomedicine. 2016;11:2799–2813. | ||
Zhao P, Ren S, Liu Y, Huang W, Zhang C, He J. PL-W18O49-TPZ Nanoparticles for Simultaneous Hypoxia-Activated Chemotherapy and Photothermal Therapy. ACS Appl Mater Interfaces. 2018;10(4):3405–3413. | ||
Zhang C, Ren J, Yang Y, et al. Ultra-sensitive diagnosis of orthotopic patient derived hepatocellular carcinoma by Fe@graphene nanoparticles in MRI. RSC Adv. 2016;6(115):113919–113923. | ||
Ren S, Cheng X, Chen M, et al. Hypotoxic and Rapidly Metabolic PEG-PCL-C3-ICG Nanoparticles for Fluorescence-Guided Photothermal/Photodynamic Therapy against OSCC. ACS Appl Mater Interfaces. 2017;9(37):31509–31518. | ||
Cantu T, Walsh K, Pattani VP, et al. Conductive polymer-based nanoparticles for laser-mediated photothermal ablation of cancer: synthesis, characterization, and in vitro evaluation. Int J Nanomedicine. 2017;12:615–632. | ||
Wang Z, Chen Z, Liu Z, et al. A multi-stimuli responsive gold nanocage-hyaluronic platform for targeted photothermal and chemotherapy. Biomaterials. 2014;35(36):9678–9688. | ||
Madani SY, Shabani F, Dwek MV, Seifalian AM. Conjugation of quantum dots on carbon nanotubes for medical diagnosis and treatment. Int J Nanomedicine. 2013;8:941–950. | ||
Dong K, Liu Z, Liu J, et al. Biocompatible and high-performance amino acids-capped MnWO4 nanocasting as a novel non-lanthanide contrast agent for X-ray computed tomography and T(1)-weighted magnetic resonance imaging. Nanoscale. 2014;6(4):2211–2217. | ||
Liu Z, Liu X, Ran X, Ju E, Ren J, Qu X. Single-layer tungsten oxide as intelligent photo-responsive nanoagents for permanent male sterilization. Biomaterials. 2015;69:56–64. | ||
Liu Z, Liu J, Wang R, Du Y, Ren J, Qu X. An efficient nano-based theranostic system for multi-modal imaging-guided photothermal sterilization in gastrointestinal tract. Biomaterials. 2015;56:206–218. | ||
Sharifi S, Behzadi S, Laurent S, Forrest ML, Stroeve P, Mahmoudi M. Toxicity of nanomaterials. Chem Soc Rev. 2012;41(6):2323–2343. | ||
Nishiyama N, Stapert HR, Zhang GD, et al. Light-harvesting ionic dendrimer porphyrins as new photosensitizers for photodynamic therapy. Bioconjug Chem. 2003;14(1):58–66. | ||
Zhang D, Wu M, Zeng Y, et al. Chlorin e6 conjugated poly(dopamine) nanospheres as PDT/PTT dual-modal therapeutic agents for enhanced cancer therapy. ACS Appl Mater Interfaces. 2015;7(15):8176–8187. | ||
Xie X, Li Z, Zhang Y, et al. Emerging ≈ 800 nm excited lanthanide-doped upconversion nanoparticles. Small. 2017;13(6):1602843–1602857. | ||
Maeda H, Tsukigawa K, Fang J. A Retrospective 30 years after discovery of the enhanced permeability and retention effect of solid tumors: next-generation chemotherapeutics and photodynamic therapy – problems, solutions, and prospects. Microcirculation. 2016;23(3):173–182. | ||
Davidson R, Liu Y, Gerien KS, Wu JQ. Real-time visualization and quantification of contractile ring proteins in single living cells. Methods Mol Biol. 2016;1369:9–23. | ||
Maeda H. Toward a full understanding of the EPR effect in primary and metastatic tumors as well as issues related to its heterogeneity. Adv Drug Deliv Rev. 2015;91:3–6. |
 © 2018 The Author(s). This work is published and licensed by Dove Medical Press Limited. The full terms of this license are available at https://www.dovepress.com/terms.php and incorporate the Creative Commons Attribution - Non Commercial (unported, v3.0) License.
By accessing the work you hereby accept the Terms. Non-commercial uses of the work are permitted without any further permission from Dove Medical Press Limited, provided the work is properly attributed. For permission for commercial use of this work, please see paragraphs 4.2 and 5 of our Terms.
© 2018 The Author(s). This work is published and licensed by Dove Medical Press Limited. The full terms of this license are available at https://www.dovepress.com/terms.php and incorporate the Creative Commons Attribution - Non Commercial (unported, v3.0) License.
By accessing the work you hereby accept the Terms. Non-commercial uses of the work are permitted without any further permission from Dove Medical Press Limited, provided the work is properly attributed. For permission for commercial use of this work, please see paragraphs 4.2 and 5 of our Terms.