Back to Journals » International Journal of General Medicine » Volume 15
T1 Mapping and Extracellular Volume in Cardiomyopathy Showing Left Ventricular Hypertrophy: Differentiation Between Hypertrophic Cardiomyopathy and Hypertensive Heart Disease
Authors Liang L, Wang X, Yu Y, Zhang Y, Liu J, Chen M, Zhang L, Jiang T
Received 6 December 2021
Accepted for publication 10 March 2022
Published 18 April 2022 Volume 2022:15 Pages 4163—4173
DOI https://doi.org/10.2147/IJGM.S350673
Checked for plagiarism Yes
Review by Single anonymous peer review
Peer reviewer comments 2
Editor who approved publication: Dr Scott Fraser
Lu Liang,1 Xin Wang,2 Yang Yu,1 Yuan Zhang,2 Jiamei Liu,2 Mulei Chen,2 Lin Zhang,2 Tao Jiang1
1Department of Radiology, Beijing Chaoyang Hospital, Capital Medical University, Beijing, 100020, People’s Republic of China; 2Heart Center and Beijing Key Laboratory of Hypertension Research, Beijing Chaoyang Hospital, Capital Medical University, Beijing, 100020, People’s Republic of China
Correspondence: Tao Jiang, Department of Radiology, Beijing Chaoyang Hospital, Capital Medical University, No. 8 Gong-Ti South Road, Chaoyang District, Beijing, 100020, People’s Republic of China, Tel +86 10 6593 5237, Email [email protected]
Background: The aim of this study was to evaluate the capability of different magnetic resonance imaging (MRI) parameters for distinguishing between hypertrophic cardiomyopathy (HCM) and hypertensive heart disease (HHD).
Methods: Thirty-eight patients with HCM, 35 patients with HHD, and 29 healthy controls subjects were enrolled in this study. All subjects underwent cardiac MRI to measure T1 values and extracellular volume (ECV), as well as the extent and patterns of late gadolinium enhancement (LGE). Myocardial segments were categorized as non-hypertrophic, mild-hypertrophic, moderate-hypertrophic, and severe-hypertrophic based on end-diastolic wall thickness (EDWT). The differences in native T1 values between all four groups were evaluated.
Results: Native T1 values were significantly higher in patients with HCM than in patients with HHD and in healthy controls (both P < 0.001). Moreover, significantly increased ECV was shown in patients with HCM than in patients with HHD and in healthy controls (both P = 0.001). Native T1 values in the basal slice and apex slice were significantly higher in patients with HCM than in patients with HHD (P < 0.01). In patients with HCM, the non-hypertrophic myocardial segments demonstrated significantly elevated T1 values compared with patients with HHD (both P < 0.001). Using a cut-off value of 28.8% for ECV, it could differentiate between HCM and HHD with 85% sensitivity, 62.07% specificity, and an area under the curve of 0.772.
Conclusion: In patients with HCM, T1 tissue remodeling occurs in the normal-appearing myocardial segments, but not in patients with HHD. Both native T1 values and ECV can support clinically relevant discrimination between HCM and HHD, although ECV had better diagnostic efficacy.
Keywords: extracellular volume, hypertrophic cardiomyopathy, magnetic resonance imaging, T1 mapping
Introduction
Left ventricular hypertrophy (LVH) is a common clinical manifestation with many causes. It can be difficult to identify the etiology of diffuse LVH, and particularly to distinguish between hypertrophic cardiomyopathy (HCM) and hypertensive heart disease (HHD).
HCM is a relatively common genetic disorder that is most frequently characterized by asymmetric hypertrophy of the left ventricle (LV), the pathological basis of which is genetically driven hypertrophy of the cardiomyocytes.1 HCM frequently has specific features, such as asymmetrical hypertrophy or other functional and morphological abnormalities (eg, dynamic LV outflow tract obstruction, elongated mitral valve leaflets, aberrant papillary muscle configuration, apical aneurysms, and myocardial crypts). Outflow tract obstruction is common in patients with HCM. Currently, the diagnosis of HCM is based on the finding of maximal LV wall thickness (LVWT) ≥ 15 mm in the absence of increased LV wall stress. Myocardial fibrosis in HCM is mainly manifested as collagen hyperplasia, disarray of fibers and fascicles, and myocardial cell disorder and necrosis.
LVH in HHD involves many mechanisms by which the heart may become abnormal due to hypertension; additionally, the LVH may be involved in the development of hypertension in the first place, as well as being a consequence of raised systemic pressure.2,3 LVH caused by hypertension is an adaptive response of cardiomyocytes to long-term stress overload, which is manifested by cardiomyocyte hypertrophy and interstitial fibrosis.4
The degree of myocardial fibrosis in HCM is significantly more serious than that associated with hypertension. The different histopathological mechanisms of LVH in HCM and HHD provide a theoretical basis for further distinction between the two causes of LVH. Late gadolinium enhancement (LGE) of cardiac magnetic resonance imaging (CMR) is currently recognized as the gold standard for noninvasive evaluation of localized myocardial fibrosis. However, LGE-CMR cannot quantitatively evaluate LVH and cannot effectively distinguish the diffuse type of LVH.
T1 mapping is a robust CMR technique capable of measuring T1 values in any region of the myocardium; then, the myocardial extracellular volume (ECV) fraction, which can quantitatively represent the degree of interstitial fibrosis, can be measured.5,6
Native T1 and ECV are complementary measures of different (but related) aspects of the myocardium, but it remains unclear which of these can effectively distinguish the etiology of the LVH.
Therefore, in this study, we evaluated the capability of magnetic resonance imaging (MRI) to differentiate between HCM and HHD as etiologies of LVH, based on detection of diffuse or regional fibrosis by T1 mapping and ECV.
Materials and Methods
Study Population
This retrospective study was performed at the Cardiology Department of Beijing Chaoyang Hospital, Capital Medical University, from January 2017 to November 2018. All individuals undergoing transthoracic echocardiogram evaluation for LVH in the hospital were enrolled. Subjects with any contraindication to CMR were ineligible. The patients who were diagnosed with HCM by the CMR exam were included in this study. The inclusion criteria were a maximal LVWT of ≥15 mm in adults without family history of HCM or ≥13 mm in adults with family history of HCM, and no other cardiac or systemic diseases that could result in similar LVH. Patients with LVWT <15mm but clear lack of apical tapering and high suspicion of apical HCM with family history were included into this study. The patients with HHD were undergoing treatment for primary hypertension (systolic blood pressure of >140 mmHg; diastolic blood pressure of >95 mmHg) and demonstrated LVH in the basal septal and inferolateral segments, defined as a maximal LVWT > 12 mm, with no evidence of a dilated LV cavity on transthoracic echocardiography. There were four exclusion criteria: 1) patients who underwent CMR scans without an extracellular contrast agent or who did not have hematocrit measured within 7 days of the CMR study, 2) patients with segments in the T1 mapping with poor motion correction, and 3) patients with acute heart failure. 4) patient that fulfilled HCM criteria were excluded if they also had arterial hypertension. Patients were compared with 29 healthy volunteers, with a similar age and gender distribution, who served as a healthy control group; they had no evidence of heart disease on physical examination, 12-lead electrocardiography, and echocardiography, and they were taking no medications. All subjects gave informed consent to participate in the study.
Ethics Approval and Consent to Participate
The present study was performed in compliance with the principles outlined in the Declaration of Helsinki and was approved by both the Ethics Committee and the Prescription and Therapeutic Committee of Beijing Chaoyang Hospital, Capital Medical University (Beijing, China). All the patients provided written informed consent prior to enrollment.
Cardiac MRI Acquisition
Cardiac MRI was performed at 3T scanner (Prisma, Siemens Healthcare, Erlangen, Germany) by using an anterior phased-array body coil (18-element) and a posterior phased-array spine coil (24-element) within 1 week of the patient undergoing transthoracic echocardiogram. A four-lead vectorcardiogram was used for cardiac gating. The breath-holding process was carefully explained to the subjects, and the abdominal belt was wrapped tightly.
Cardiac MRI Protocol
After acquisition of scout images, retrospective electrocardiographic gating cine imaging was performed using a segmented balanced steady-state free precession sequence in continuous short-axis views, spanning the entire LV from base to apex. The imaging parameters for cine images were as follows: repetition time (45.64 ms), echo time (1.43 ms), flip angle (80°), section thickness (8 mm), field-of-view (340 mm), matrix size (256 × 169), SENSE factor 2, and 25 cardiac phases/R–R interval on the electrocardiogram. After the acquisition of cine images, native T1 data were obtained from three short-axis images (basal, center, apical) of the LV using a modified look-locker inversion recovery (MOLLI) sequence. Imaging parameters were as follows: repetition time (315.96 ms), echo time (1.12 ms), flip angle (35°), section thickness (8 mm), field-of-view (360 mm), and matrix size (256 × 169). After native T1 mapping was obtained, gadolinium-based contrast medium (gadopentetate dimeglumine, Beilu Pharmaceutical, Beijing, China) was administered intravenously at 0.1 mmol/kg body weight. LGE images were obtained in short-axis locations from the base to the apex of the LV, by using a three-dimensional inversion recovery T1 turbo field-echo sequence, 10 minutes after contrast administration. The imaging parameters were as follows: repetition time (700 ms), echo time (1.96 ms), inversion time (300‒500 ms) (adjusted to the null signal of the normal myocardium using the Look-Locker sequence), flip angle (20°), section thickness (8 mm), field-of-view (350 mm), matrix size (256 × 192), and SENSE factor 2. Fifteen minutes after contrast administration, post-contrast T1 data were obtained by using the same imaging sequence as for obtaining the native T1 data.
Image Analysis
Image analysis was carried out by using dedicated cardiac MRI software (syngo.via, Siemens Healthcare) by one author of this paper (L.L, a radiologist with 4 years of MRI experience) and the findings were reviewed by another author (J.T., a radiologist with 30 years of MRI experience). LV borders were manually traced, and papillary muscles were excluded from determination of LV mass. Maximal end-diastolic wall thickness (EDWT) of the septum was manually measured by agreement between two radiologists with experience in the reading of CMR images. T1 maps were obtained using syngo.via. T1 values were quantified in 16 segments in each of the three LV slices (basal, center, and apical). Three regions of interest (ROI) were placed within each segment to avoid the signals from the blood pool and artifacts; these regions were placed independent of the results from LGE imaging.7,8 The size of each ROI was completely consistent at approximately 0.1~0.2 cm2, and at same 5 pixels were included Figure 1D. T1 values of the segment were calculated as the average of the three ROIs. T1 values of segments and slices and reproducibility were examined in all healthy controls.
 |
Figure 1 Images of a 47-year-old man with HHD (A–D). Images of a 59-year-old man with HCM (E–H), and follow-up after 3 year (I–L). Cine-magnetic resonance imaging in the three-chamber (A and E) and four-chamber (B and F) view showing similar looking hypertrophy of the interventricular septum in HHD and HCM, and the maximum septal wall thickness was 16 mm. And late gadolinium enhancement (C and G) was not found at the myocardium. At follow-up, theHCM myocardium became more hypertrophy, and clear lack of apical tapering. Native T1 maps in the LV center-chamber short-axis (D, H, L) showed with different average value: HHD=1195ms; HCM=1218ms; follow-up HCM=1285ms. Gray scale range: 0‒2000 ms. The blue line in (B, F, J) represented the level at which the short axis mapping image is positioned on the long axis image. |
The 16 American Heart Association (AHA) segments in the patients with HCM were classified into non-hypertrophic (EDWT < 15 mm) and hypertrophic (EDWT ≥ 15 mm) based on the maximal LV EDWT. The hypertrophic segments were further stratified as mild (15 mm ≤ EDWT < 20 mm), moderate (20 mm ≤ EDWT < 25 mm), and severe (EDWT ≥ 25 mm) according to the criteria used in previous studies.9,10
The average T1 values of the three LV slices (basal, center, apical) were used to compare the HCM, HHD, and healthy controls (Figure 2). The mean T1 of the combined 16 LV segments was used to determine global T1. The average T1 values of non-hypertrophic, mild and moderate hypertrophic myocardial segments were used to compare the HCM and HHD groups.
 |
Figure 2 The mapping data. The health controls, HHD and HCM native T1 values in the basal, center, apex slice and average native T1 values. |
In addition to the native T1, the hematocrit-corrected ECV fraction—a marker of extracellular contrast agent accumulation—was also calculated.11,12 Estimation of the ECV (interstitium and extracellular matrix) requires measurement of myocardial and blood T1 before and after administration of contrast agents as well as the patient’s hematocrit value according to the formula:

LGE imaging was evaluated by agreement between two radiologists experienced in the reading of CMR. A segment with LGE was defined as the presence of visually identified LGE. Evaluation of LGE was performed independent of the evaluation of T1 values.
Statistical Analysis
The mean and standard deviation were recorded for continuous variables, and frequency and percentage were recorded for categorical variables. For each variable, a normality test was performed. Continuous variables were compared using the t-test or the nonparametric Mann–Whitney U-test, as appropriate. For analysis of values, receiver operating characteristic (ROC) curves were generated and the areas under the curves (AUCs) were calculated and compared using the method of Hanley and McNeil for comparison at a single time-point. The ROC characteristics of native T1 and ECV were compared for basal, center, apex and mean native T1 and ECV, and then diagnostic values of the parameters were confirmed. Two-tailed P values <0.05 were considered statistically significant. All statistical analyses were performed in SPSS version 22.0 (SPSS Inc., Chicago, IL, USA).
Results
Baseline Characteristics
One hundred two patients were enrolled in our study. The baseline characteristics of the HCM, HHD, and healthy groups are summarized in Table 1. More male subjects were present in the HHD group than in the other two groups (P < 0.001). Heart rate was faster in patients with HHD than in patients with HCM and in healthy controls (P < 0.001). As expected, systolic and diastolic blood pressure were the highest in patients with HHD (P < 0.01). LV function was more compromised in patients with HHD, as indicated by a higher NT-proBNP level, along with lower values of LV ejection fraction (LVEF) and higher LV end-diastolic volume (P < 0.05). The hematocrit levels in the HHD group did not differ significantly from those in the HCM group, but were a little higher than in the healthy control group. About 50% of patients with HCM had outflow tract obstruction. There were no significant differences in age, diabetes, hyperlipidemia, or smoking among the three groups (P > 0.05).
 |
Table 1 Baseline Characteristics of Healthy Controls, HHD, and HCM Patients |
Comparisons of LGE Findings Between Patients with HCM and Patients with HHD
As shown in Table 2, myocardial LGE was observed in 84.8% (28/38) of patients with HCM and in 34.6% (9/35) of patients with HHD. The number of LGE segments was also greater in patients with HCM than in those with HHD (P = 0.001). LGE in the right ventricular insertion points was most commonly observed in patients with HCM (21.2%). LGE in patients with HCM was predominantly located in the anteroseptal and inferoseptal segments, with midwall patchy or epicardial patchy patterns, as shown in Figure 3. In contrast, LGE in patients with HHD was commonly present in the septal to inferior regions at the midventricular level, with midwall linear, midwall, or epicardial patchy patterns.
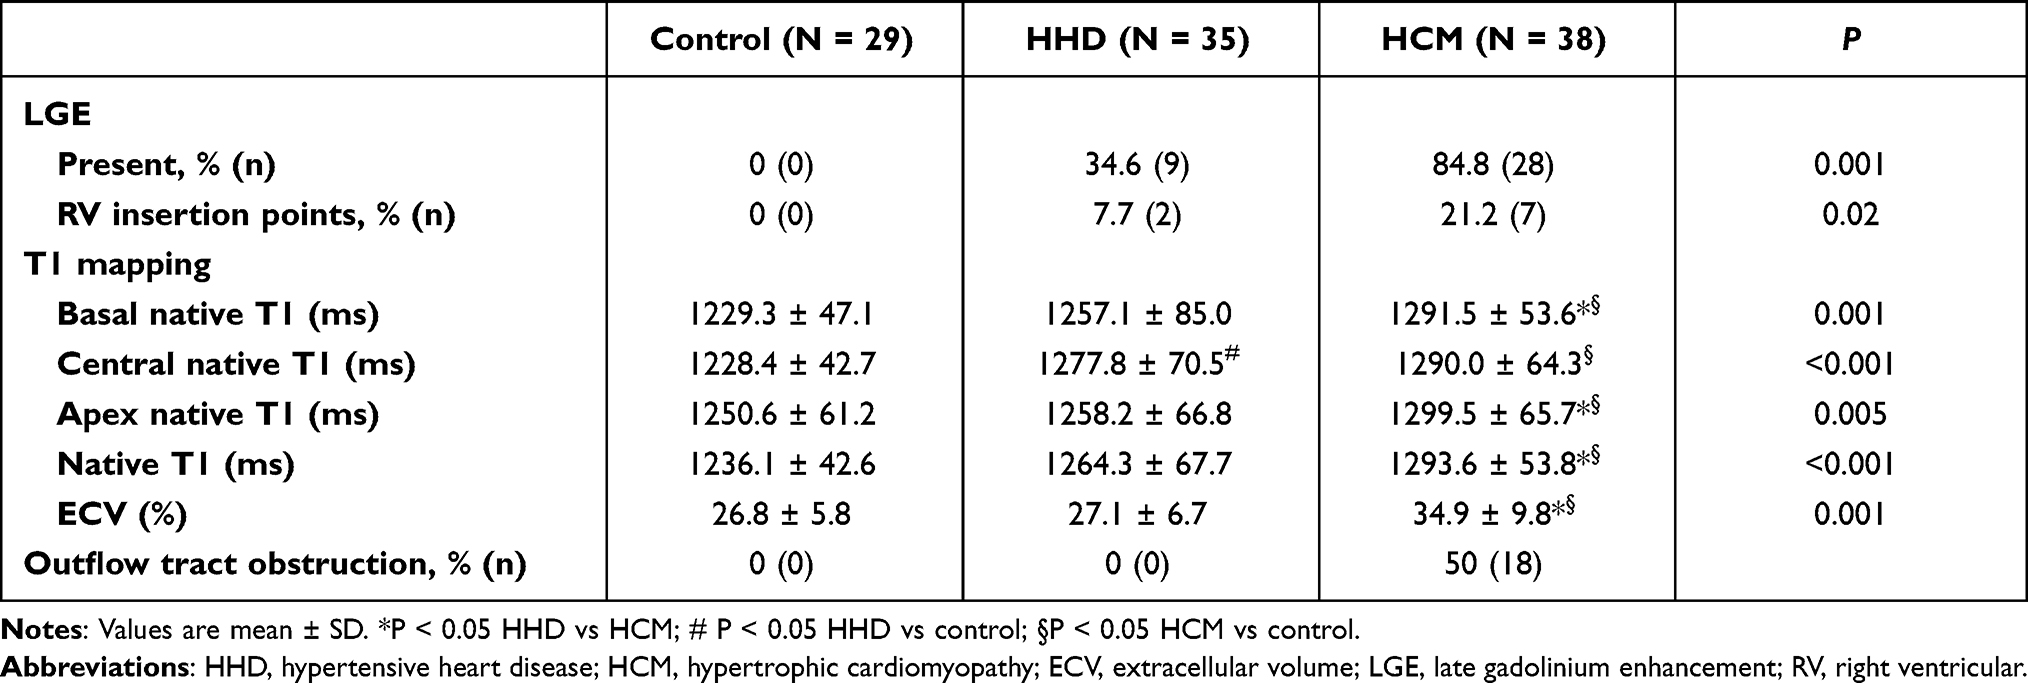 |
Table 2 Functional Measures Based on Cardiovascular Magnetic Resonance Imaging Measurements |
 |
Figure 3 Images of a 34-year-old man with hypertrophic cardiomyopathy. Cine-magnetic resonance imaging in the three-chamber (A) and four-chamber (B) view showing hypertrophy of the interventricular septum and apex. The maximum septal wall thickness was 27 mm, and the left ventricular ejection fraction was 50% in this patient. Extensive myocardial late gadolinium enhancement (C and D) was found at the mid-wall layer from the anterior region to the inferior septum (arrows), with apex involvement, which was hyperintense as compared to the blood. Native T1 maps in the LV mid-chamber short-axis and four-chamber view (E and F) showed patchy areas of increased T1 relaxation (arrows) in the septum, which was more marked in hypertrophic segments. Post-contrast T1 map (G) showed patchy areas of decreased T1 relaxation (arrows) in the septum. Gray scale range: 0‒2000 ms. |
Comparisons of T1 Values and ECV Between the Three Groups
The T1 mapping indices of all subjects are shown by group in Table 2. Native T1 values were significantly higher in patients with HCM (1293.6 ± 53.8 ms) than in those with HHD (1264.3 ± 67.7 ms) and in healthy controls (1236.1 ± 42.6 ms) (P < 0.001, Figure 2). In addition, significantly increased ECV was seen in patients with HCM (34.9 ± 9.8%) than in those with HHD (27.1 ± 6.7%) and in healthy controls (26.8 ± 5.8%) (P = 0.001). We detected native T1 values in the basal, center and apex slice of the myocardium and found that native T1 values in the basal slice and apex slice were significantly greater in patients with HCM than in patients with HHD (P < 0.01). However, there was no significant difference in the center slice between these two groups (P > 0.05).
Comparisons of Native T1 Values Between the Different Degrees of Hypertrophy Groups
HCM and HHD myocardial segments were categorized as non-hypertrophic, mild-hypertrophic, moderate-hypertrophic, and severe-hypertrophic based on EDWT. The difference in the native T1 between the four groups was evaluated. In patients with HCM, the non-hypertrophic myocardial segments demonstrated significantly elevated T1 values compared with patients with HHD (both P < 0.001). Patients with HCM also had more hypertrophic segments compared with patients with HHD (Table 3).
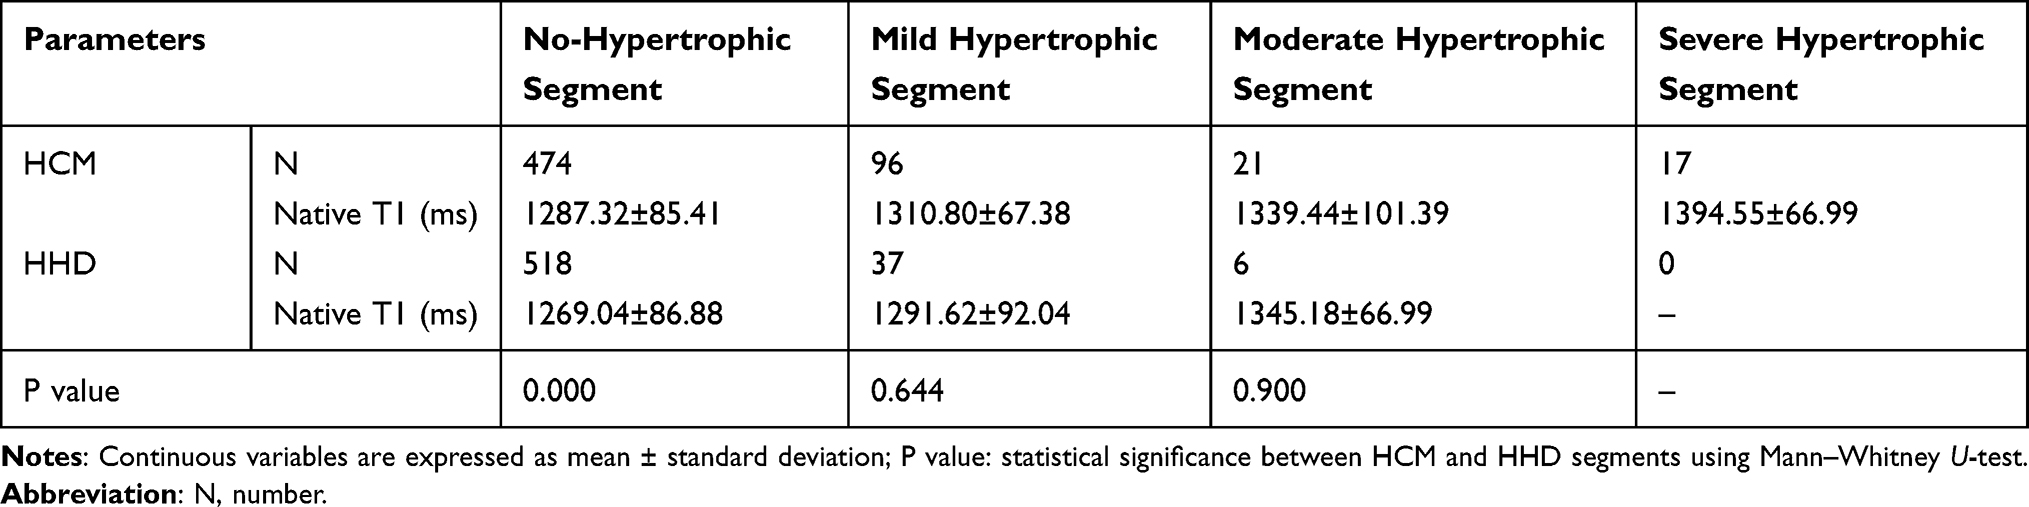 |
Table 3 Native T1 Values in Different Degrees Hypertrophic Myocardial Segments of HCM and HHD Patients |
Comparisons of Different Parameters in Discrimination LVH Etiologies
Receiver Operator Characteristic curves (ROC) were constructed to determine and compare the sensitivity and specificity of different parameters and their predictive value to diagnose or refute the diagnosis of HCM. Comparison of AUCs showed that ECV provided the best distinction between patients with HCM, patients with HHD. The ROC analysis with corresponding cut-off values for the performance of separate T1-derived measures in the differentiation of HCM from HHD myocardium is presented in Table 4 and Figure 4. All these indicators had certain diagnostic efficacy for distinguishing between LVH etiologies, among which ECV had the best diagnostic efficacy, with a cut-off value of 28.8%. We could differentiate between HCM and HHD with 85% sensitivity, 62.07% specificity, and an area under the curve of 0.772 (P < 0.001).
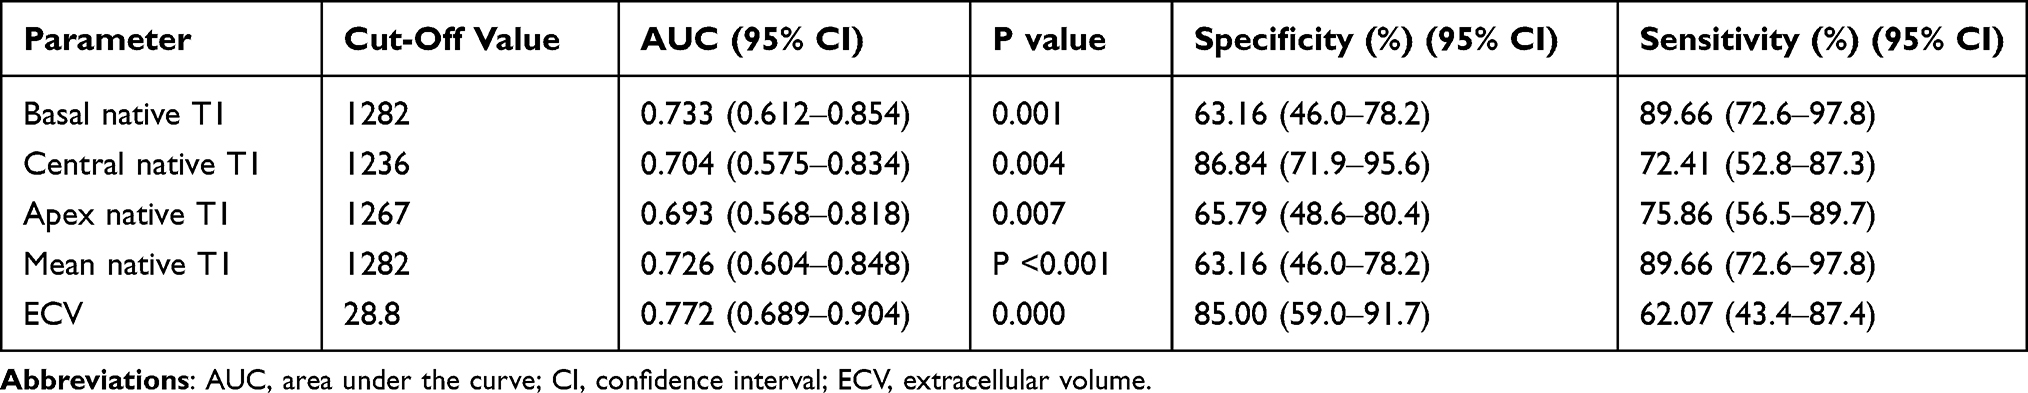 |
Table 4 Cut-off Values from Receiver-Operating Characteristic Curve Analysis |
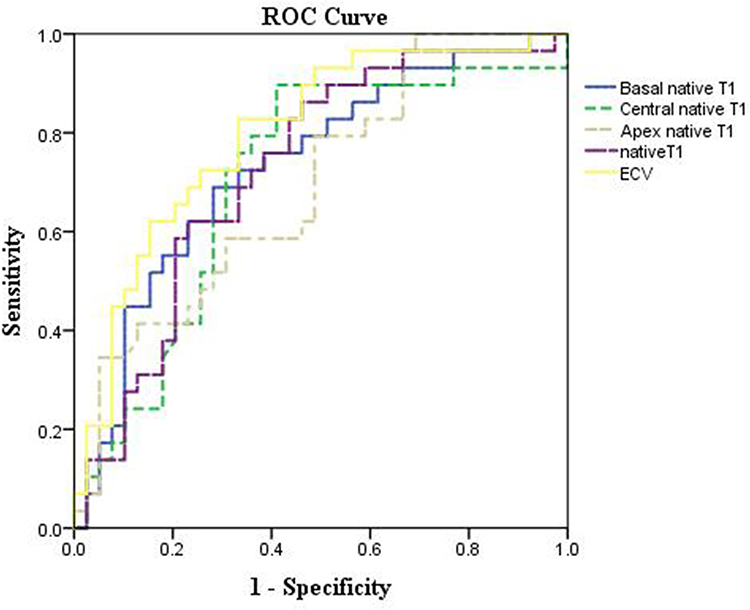 |
Figure 4 Receiver-operating characteristic (ROC) curves of native T1 and extracellular volume fraction (ECV) for distinguishing left ventricular hypertrophy. The accuracy of ECV for identifying HCM and HHD was 0.772 (95% CI: 0.689‒0.904), P < 0.001) with a cut-off value of 28.8%. Blue line, basal native T1; Green dotted line, central native T1; Yellow dotted line, apex native T1; Purple dotted line, native T1; Yellow line, ECV. |
Discussion
LVH has long been recognized as an important clinical prognostic entity, as it is associated with increased morbidity and mortality related to myocardial infarction, heart failure, and stroke. There is a continuous graded relationship between LV mass (reflecting LVH) and the development of cardiovascular disease, with no distinct threshold separating the postulated “compensatory” LVH from “pathological” LVH.13 Difficulties in discrimination of hypertrophic etiologies interfere with appropriate diagnosis, risk assessment, and clinical management. The differential diagnosis of LVH related to HCM and HHD, in particular, remains challenging in clinical practice. The complex underlying histopathology14 and the consequent functional changes in HCM result in various myocardial abnormalities, including replacement fibrosis, reduced ventricular deformation, and increased diastolic stiffness.15,16 Diffuse myocardial disease is a characteristic feature of both HCM and HHD, exacerbating the diagnostic dilemma. Thus, we evaluated whether T1 mapping and ECV on cardiac MRI could distinguish between LVH related to HCM and HHD. We found that both T1 mapping and ECV were able to distinguish between these etiologies, with ECV providing the greatest diagnostic accuracy.
Morphology and LGE
Cardiovascular MRI has emerged as a key imaging modality, providing both quantitative and qualitative assessment of cardiomyopathies, and is now the gold standard imaging technique for assessing myocardial anatomy, regional and global function, and tissue characterization.17–19 Current imaging evaluations of the heart, including LVH and the presence of scars, also rely on LGE. However, this approach commonly fails to confirm or exclude LVH disease unequivocally.12,14
Our study demonstrated some differences in LGE patterns between HHD and HCM, similar to a previous MRI study showing that the extent and pattern of LGE allowed distinction between HCM and HHD.10 The frequency and number of LGE segments were higher in HCM than in HHD, and there were differences in location and morphology. Nevertheless, although LGE was suggestive for differential diagnosis, these differences were not specific, and could not accurately distinguish HHD and HCM. In particular, the diffuse phenotype of LVH was absence LGE. In our case, there was no LGE in some HHD and HCM patients, as shown in Figure 1.
T1 Mapping and ECV in Discriminators of LVH Etiologies
Native T1 and ECV were significantly higher in patients with HCM compared with patients with hypertension. Detecting these abnormalities has been shown to help with disease confirmation in overt LVH.10,12,14
In previous studies, we (and others) have found that patients with HCM have abnormal T1 indices concordant with diffuse myocardial disease, even in the absence of LGE, as well as in the areas outside overt LGE.15,20,21
Contrast-enhanced T1 mapping with cardiac MRI, for the calculation of myocardial ECV, provides novel disease-specific information. ECV is a marker of myocardial tissue remodeling and provides a physiologically intuitive unit of measurement. In healthy individuals, ECV values of 25.3 ± 3.5% (on 1.5-T MRI) have been reported.22 Besides amyloidosis, increased ECV is most often due to excessive collagen deposition, and is thus a more robust measure of myocardial fibrosis. Low ECV values occur in thrombus and fat/lipomatous metaplasia. ECV can either be calculated for myocardial ROIs or visualized on ECV maps. A study by Brouwer et al showed that patients with HCM had similar ECV values (eg, interstitial fibrosis) in myocardium without LGE as healthy controls.23
Minimal LV coverage for the adequate assessment of T1 or ECV alterations depends on whether patchy, focal, acute, or diffuse myocardial changes are present. For diffuse alterations, a single basal and a single center-ventricular short-axis slice may provide adequate diagnostic information.24 Hence, we compared basal native T1, center native T1, apex native T1, mean T1 and mean ECV values.
In this study, we differentiated myocardium segments in our analysis; Patients with HCM has more hypertrophic segments compared with HHD patients. Myocardial tissue remodeling occurs in seemingly normal segments in HCM patients, but not in HHD patients. In the hypertrophic segments of HCM and HHD, native T1 values gradually increase with the severity of hypertrophy. The differences in T1 values for basal and apical slice, but not for mid-slice may match common locations of HCM which is asymmetrical septal hypertrophy (ASH) type or apical HCM. In another study, elevated biomarkers of myocardial collagen synthesis were found in HCM gene mutation carriers without LV hypertrophy,9 and native T1 mapping can detect early diffuse myocardial fibrosis in these subjects.10
According to our study, basal native T1, center native T1, apex native T1, and mean ECV had certain diagnostic efficacy for distinguishing LVH etiology, among which ECV demonstrated the best diagnostic efficacy. One of the reasons for this result was that the pathology is different in HHD and HCM. Cardiac myocytes of the LV are enlarged in HHD,25 and fibrosis is another feature of the adverse structural remodeling found in the myocardium in HHD.26 On the other hand, HCM is fundamentally a cardiomyocyte disease (sarcomere protein mutations), and myocardial fibrosis characterized by disproportionate collagen accumulation is a key pathogenic process.27 Nevertheless, This was a significant share of HHD and HCM patients demonstrated average T1/ECV results that would be within 2SD of the mean of healthy volunteers (considered normal range). As such, one who had the relevant clinical history, myocardial thickness and LGE extent would need to diagnose abnormality although the range is considered normal.
Native T1 is decreased in some diseases (fat infiltration and iron overload) and is increased in others (fibrosis, edema, and amyloidosis). In myocardial fibrosis, the native T1 elevation likely arises from the interstitial compartment, rather than from the cardiomyocyte compartment, but this is not clear. In contrast to native T1, ECV exploits the extracellular nature of gadolinium contrast agents. The concentration of contrast in the myocardium relative to the concentration in plasma (not in whole blood) provides a direct measure of the interstitial space after equilibration, as long as contrast agents are not protein-bound. Because the ECV and the partition coefficient are ratios, some systematic T1 biases may be canceled out. For these reasons, ECV had the best diagnostic efficacy for diagnosing LVH.
Limitations
There were some limitations to this study. First, the sample size was relatively small in this retrospective study, so we did not exclude those patients with HCM or HHD with normal or supernormal LVEF. Patients with HCM had much lower LVEF (45.5 ± 4.5%), and patients with end-stage HCM were included into this study, which could have resulted in sampling bias: obviously, patients with end-stage HCM have more severe fibrosis than the common phenotype of HCM. We also excluded patients with severe renal insufficiency because they could not undergo LGE-CMR. Second, the quantification methods (eg, standard deviation threshold, full-width at half-maximum) should be validated for each magnetic strength, cardiomyopathy, or imaging sequence. Third, we did not compare LGE, native T1 and ECV with histopathological findings because few patients underwent endomyocardial biopsy, and those samples acquired from the endocardial region were small. However, the relationship between myocardial fibrosis and LGE, native T1 and ECV is well-documented in HCM. What’s more, the potential influence by different gender ratio among different groups were not analyzed.
Conclusion
In conclusion, our findings indicate that HCM frequently has specific features. The frequency and number of LGE segments were higher in HCM than in HHD, and there were differences in location and morphology. Native T1 and ECV were significantly higher in patients with HCM than in patients with HHD. We showed that in patients with HCM, T1 tissue remodeling occurs in the normal-appearing myocardial segments, but not in patients with HHD. In addition, we demonstrated that native T1 values and ECV can both contribute clinically relevant evidence for discrimination between HCM and HHD. Of the two approaches, ECV had the better diagnostic efficacy for distinguishing between these LVH etiologies.
Disclosure
The authors report no conflicts of interest in this work.
References
1. Wang C, Zheng J, Sun J, et al. Endogenous contrast T1rho cardiac magnetic resonance for myocardial fibrosis in hypertrophic cardiomyopathy patients. J Cardiol. 2015;66:520–526. doi:10.1016/j.jjcc.2015.03.005
2. Moravsky G, Ofek E, Rakowski H, et al. Myocardial fibrosis in hypertrophic cardiomyopathy: accurate reflection of histopathological findings by CMR. JACC Cardiovasc Imaging. 2013;6:587–596. doi:10.1016/j.jcmg.2012.09.018
3. St JSM, Lie JT, Anderson KR, O’Brien PC, Frye RL. Histopathological specificity of hypertrophic obstructive cardiomyopathy. Myocardial fibre disarray and myocardial fibrosis. Br Heart J. 1980;44:433–443. doi:10.1136/hrt.44.4.433
4. Baxi AJ, Restrepo CS, Vargas D, Marmol-Velez A, Ocazionez D, Murillo H. Hypertrophic cardiomyopathy from A to Z: genetics, pathophysiology, imaging, and management. Radiographics. 2016;36:335–354. doi:10.1148/rg.2016150137
5. Zhou H, Lin X, Fang L, et al. Characterization of compacted myocardial abnormalities by cardiac magnetic resonance with native T1 mapping in left ventricular non-compaction patients- a comparison with late gadolinium enhancement. Circ J. 2016;80:1210–1216. doi:10.1253/circj.CJ-15-1269
6. Ikeda U, Minamisawa M, Koyama J. Isolated left ventricular non-compaction cardiomyopathy in adults. J Cardiol. 2015;65:91–97. doi:10.1016/j.jjcc.2014.10.005
7. Garg P, Saunders LC, Swift AJ, Wild JM, Plein S. Role of cardiac T1 mapping and extracellular volume in the assessment of myocardial infarction. Anatol J Cardiol. 2018;19:404–411. doi:10.14744/AnatolJCardiol.2018.39586
8. Dual SA, Maforo NG, McElhinney DB, et al. Right ventricular function and T1-mapping in boys with Duchenne muscular dystrophy. J Magn Reson Imaging. 2021;54:1503–1513. doi:10.1002/jmri.27729
9. Ho CY, Lopez B, Coelho-Filho OR, et al. Myocardial fibrosis as an early manifestation of hypertrophic cardiomyopathy. N Engl J Med. 2010;363:552–563. doi:10.1056/NEJMoa1002659
10. Hinojar R, Varma N, Child N, et al. T1 mapping in discrimination of hypertrophic phenotypes: hypertensive heart disease and hypertrophic cardiomyopathy: findings from the international T1 multicenter cardiovascular magnetic resonance study. Circ Cardiovasc Imaging. 2015;8:45.
11. Dabir D, Child N, Kalra A, et al. Reference values for healthy human myocardium using a T1 mapping methodology: results from the International T1 Multicenter cardiovascular magnetic resonance study. J Cardiovasc Magn Reson. 2014;16:69. doi:10.1186/s12968-014-0069-x
12. Elliott P, Andersson B, Arbustini E, et al. Classification of the cardiomyopathies: a position statement from the European society of cardiology working group on myocardial and pericardial diseases. Eur Heart J. 2008;29:270–276. doi:10.1093/eurheartj/ehm342
13. Levy D, Garrison RJ, Savage DD, Kannel WB, Castelli WP. Prognostic implications of echocardiographically determined left ventricular mass in the Framingham Heart Study. N Engl J Med. 1990;322:1561–1566. doi:10.1056/NEJM199005313222203
14. Elliott PM, Anastasakis A, Borger MA, et al. 2014 ESC guidelines on diagnosis and management of hypertrophic cardiomyopathy: the task force for the diagnosis and management of hypertrophic cardiomyopathy of the European Society of Cardiology (ESC). Eur Heart J. 2014;35:2733–2779.
15. Ellims AH, Iles LM, Ling LH, et al. A comprehensive evaluation of myocardial fibrosis in hypertrophic cardiomyopathy with cardiac magnetic resonance imaging: linking genotype with fibrotic phenotype. Eur Heart J Cardiovasc Imaging. 2014;15:1108–1116. doi:10.1093/ehjci/jeu077
16. Hinojar R, Botnar R, Kaski JC, Prasad S, Nagel E, Puntmann VO. Individualized cardiovascular risk assessment by cardiovascular magnetic resonance. Future Cardiol. 2014;10:273–289. doi:10.2217/fca.13.102
17. Karamitsos TD, Francis JM, Myerson S, Selvanayagam JB, Neubauer S. The role of cardiovascular magnetic resonance imaging in heart failure. J Am Coll Cardiol. 2009;54:1407–1424. doi:10.1016/j.jacc.2009.04.094
18. Wong TC, Piehler K, Meier CG, et al. Association between extracellular matrix expansion quantified by cardiovascular magnetic resonance and short-term mortality. Circulation. 2012;126:1206–1216. doi:10.1161/CIRCULATIONAHA.111.089409
19. Klem I, Shah DJ, White RD, et al. Prognostic value of routine cardiac magnetic resonance assessment of left ventricular ejection fraction and myocardial damage: an international, multicenter study. Circ Cardiovasc Imaging. 2011;4:610–619. doi:10.1161/CIRCIMAGING.111.964965
20. Ho CY, Abbasi SA, Neilan TG, et al. T1 measurements identify extracellular volume expansion in hypertrophic cardiomyopathy sarcomere mutation carriers with and without left ventricular hypertrophy. Circ Cardiovasc Imaging. 2013;6:415–422. doi:10.1161/CIRCIMAGING.112.000333
21. Puntmann VO, Voigt T, Chen Z, et al. Native T1 mapping in differentiation of normal myocardium from diffuse disease in hypertrophic and dilated cardiomyopathy. JACC Cardiovasc Imaging. 2013;6:475–484. doi:10.1016/j.jcmg.2012.08.019
22. Sado DM, Flett AS, Banypersad SM, et al. Cardiovascular magnetic resonance measurement of myocardial extracellular volume in health and disease. Heart. 2012;98:1436–1441. doi:10.1136/heartjnl-2012-302346
23. Brouwer WP, Baars EN, Germans T, et al. In-vivo T1 cardiovascular magnetic resonance study of diffuse myocardial fibrosis in hypertrophic cardiomyopathy. J Cardiovasc Magn Reson. 2014;16:28. doi:10.1186/1532-429X-16-28
24. Messroghli DR, Moon JC, Ferreira VM, et al. Clinical recommendations for cardiovascular magnetic resonance mapping of T1, T2, T2* and extracellular volume: a consensus statement by the Society for Cardiovascular Magnetic Resonance (SCMR) endorsed by the European Association for Cardiovascular Imaging (EACVI). J Cardiovasc Magn Reson. 2017;19:75.
25. Anversa P, Palackal T, Sonnenblick EH, Olivetti G, Capasso JM. Hypertensive cardiomyopathy. Myocyte nuclei hyperplasia in the mammalian rat heart. J Clin Invest. 1990;85:994–997. doi:10.1172/JCI114576
26. Campbell SE, Janicki JS, Matsubara BB, Weber KT. Myocardial fibrosis in the rat with mineralocorticoid excess. Prevention of scarring by amiloride. Am J Hypertens. 1993;6:487–495. doi:10.1093/ajh/6.6.487
27. Schelbert EB, Wong TC, Gheorghiade M. Think small and examine the constituents of left ventricular hypertrophy and heart failure: cardiomyocytes versus fibroblasts, collagen, and capillaries in the interstitium. J Am Heart Assoc. 2015;4:e2491. doi:10.1161/JAHA.115.002491
 © 2022 The Author(s). This work is published and licensed by Dove Medical Press Limited. The
full terms of this license are available at https://www.dovepress.com/terms
and incorporate the Creative Commons Attribution
- Non Commercial (unported, 3.0) License.
By accessing the work you hereby accept the Terms. Non-commercial uses of the work are permitted
without any further permission from Dove Medical Press Limited, provided the work is properly
attributed. For permission for commercial use of this work, please see paragraphs 4.2 and 5 of our Terms.
© 2022 The Author(s). This work is published and licensed by Dove Medical Press Limited. The
full terms of this license are available at https://www.dovepress.com/terms
and incorporate the Creative Commons Attribution
- Non Commercial (unported, 3.0) License.
By accessing the work you hereby accept the Terms. Non-commercial uses of the work are permitted
without any further permission from Dove Medical Press Limited, provided the work is properly
attributed. For permission for commercial use of this work, please see paragraphs 4.2 and 5 of our Terms.