Back to Journals » Journal of Inflammation Research » Volume 16
Systematic and Comprehensive Analysis of tRNA-Derived Small RNAs Reveals Their Potential Regulatory Roles and Clinical Relevance in Sarcoidosis
Authors Zhao M, Tian C, Di X, Cong S, Cao Y, Zhou X, Wang K
Received 31 January 2023
Accepted for publication 24 May 2023
Published 1 June 2023 Volume 2023:16 Pages 2357—2374
DOI https://doi.org/10.2147/JIR.S406484
Checked for plagiarism Yes
Review by Single anonymous peer review
Peer reviewer comments 3
Editor who approved publication: Professor Ning Quan
Min Zhao, Chang Tian, Xin Di, Shan Cong, Yingshu Cao, Xijia Zhou, Ke Wang
Department of Respiratory and Critical Care Medicine, the Second Hospital of Jilin University, Changchun, Jilin, People’s Republic of China
Correspondence: Ke Wang, The Second Hospital of Jilin University, No. 218 Ziqiang Road, Nanguan District, Changchun, 130041, People’s Republic of China, Email [email protected]
Introduction: The pathogenesis of sarcoidosis, which involves several systems, is unclear, and its pathological type is non-caseating epithelioid granulomas. tRNA-derived small RNA (tsRNA) is a novel class of short non-coding RNAs with potential regulatory functions. However, whether tsRNA contributes to sarcoidosis pathogenesis remains unclear.
Methods: Deep sequencing technology was used to identify alterations in tsRNA relative abundance profiles between patients with sarcoidosis and healthy controls and quantitative real-time polymerase chain reaction (qRT-PCR) was used to validate. The clinical parameters were analysis to evaluate the clinical feature correlations initially. Target prediction and bioinformatics analysis of validated tsRNA were conducted to explore the mechanisms of tsRNAs in sarcoidosis pathogenesis.
Results: A total of 360 tsRNAs were identified for exact matches. Among them, the relative abundance of three tRNAs (tiRNA-Glu-TTC-001, tiRNA-Lys-CTT-003, and tRF-Ser-TGA-007) was markedly regulated in sarcoidosis. The levels of various tsRNAs were significantly correlated with age, the number of affected systems, and calcium levels in the blood. Additionally, target prediction and bioinformatics analyses revealed that these tsRNAs may play roles in chemokine, cAMP, cGMP-PKG, retrograde endorphin, and FoxO signalling pathways. The related genes, APP, PRKACB, ARRB2, and NR5A1 finding may participate in the occurrence and development of sarcoidosis through immune inflammation.
Conclusion: This study provides novel insights to explore tsRNA as a novel and efficacious pathogenic target of sarcoidosis.
Keywords: sarcoidosis, tRNA-derived small RNA, tsRNA, noncoding RNAs, bioinformatics analysis
Introduction
Sarcoidosis is a multisystem inflammatory disease of unknown aetiology that is characterised by non-caseating epithelioid granulomatous lesions (aggregates of lymphocytes, macrophages, epithelioid cells, and giant cells).1 Typical clinical features include bilateral hilar lymph node lesions, pulmonary infiltration, and eye and skin lesions. Some patients may also have neurological and cardiac involvement. The diagnosis of sarcoidosis is based on the results of clinical and radiological examinations, as well as the pathological diagnosis of non-caseating granulomas on biopsy. Although the understanding of the immunopathological and genetic characteristics of sarcoidosis has increased, and there have been new developments in diagnostic techniques and biological agents for treatment,2,3 the pathogenesis of sarcoidosis remains unclear. It is generally accepted that sarcoidosis is caused by abnormal immune responses in genetically susceptible individuals exposed to specific environmental factors. As its cause is unclear, there is still a lack of truly effective treatments. In addition, due to the lack of reliable monitoring indicators for the disease process, sarcoidosis has become a clinically difficult disease to manage.4 To address these problems, methods for rapid and non-invasive identification at any time point during the disease are required; serum biomarker assessment may be used for this purpose.5 Therefore, further research on the serum of sarcoidosis patients may help to clarify the pathogenesis and discover new potential targets for the diagnosis and treatment of sarcoidosis.
A biomarker is measurable in the serum or tissue and may be of diagnostic, prognostic, or predictive value.6–8 Given its non-invasive and disease-specific features, considerable efforts have been made to identify protein blood biomarkers of sarcoidosis in the past few decades. For example, angiotensin converting enzyme (ACE), lysozyme, soluble IL-2 receptor (sIL-2R), and chitotriosidase (CTO) have all been proposed to be useful for diagnosis in the clinic;9 however, there is limited evidence regarding currently available biomarkers in determining prognosis and predicting patterns of clinical behaviour, with the lack of sufficient sensitivity and specificity.10 Therefore, it is very important to search for biomarkers with strong specificity and sensitivity and explore their regulatory role in sarcoidosis to further understand the occurrence and development of sarcoidosis.
A novel class of tRNA-derived small RNAs (tsRNAs) has attracted our attention. As the second most common small ncRNAs after miRNAs, an increasing amount of data suggests that these ncRNAs are thriving functional molecules. Similar to miRNAs, stable stem‐loop structures, stable‐formed nucleoprotein complexes, and exosome encapsulation enable tsRNAs to remain at high concentrations in serum.11–16 Recently, with the development of genomics and RNomics, increasing amounts of DNA, RNA, and non-coding RNA (ncRNA) molecules have been discovered in human serum. Cell‐free nucleic acids (cfNAs) carrying sarcoidosis-related genetic and epigenetic modifications may be effective blood biomarkers.17 Ideally, qualified biomarkers should be detected in a minimally invasive liquid biopsy, such as a blood sample, with prerequisites, including high concentrations and steady state in the biological sample. In addition, accumulating evidence has shown that tsRNA can be secreted and exist as stable entities in peripheral blood because they are protected from RNase activity by being enclosed in micro vehicles, such as exosomes, or by forming stable macromolecular complexes.18,19 The heterogeneity and stability of tsRNAs in blood make them suitable candidates for sarcoidosis diagnosis. These properties make it a potential diagnostic marker. It is helpful for early diagnosis of disease, dynamic detection of disease condition, guidance of medication and prognosis evaluation.
tsRNAs are the result of specific cleavage of mature or pre-tRNA by specific nucleases, such as Dicer and angiogenin (ANG), in specific cells or tissues or under certain conditions, such as stress and hypoxia.20,21 tsRNAs generally consist of two parts: (1) tRNA-derived fragments (tRNA-derived fragments, tRFs, or tDRs) and (2) half tRNA (tRNA halves, tRHs, or tiRNAs). Generally, tRFs are classified into four subtypes according to their original sites in pre-tRNA or mature tRNA, including tRF-1, tRF-3, tRF-5 and i-tRF. tRF-1 is derived from the 3’end of the precursor tRNA, and tRF-5 and tRF-3 are derived from the 5’and 3’ends of mature tRNA. While i-tRF is produced by internal fragments of mature tRNA. tiRNA could produce tiRNA-3 and tiRNA-5. tsRNAs have been confirmed to regulate gene expression and contribute to development, differentiation, inflammation, and tumour oncogenesis.11 For example, Zhang et al found that plasma exosomes tRF-25, tRF-38 and tRF-18 may be diagnostic biomarkers for the detection of osteoporosis by analyzing the expression level of tsRNA in the blood of patients with osteoporosis.22 Michael et al analyzed the tsRNA expression profile of prostate cancer and concluded that the ratio of Trna-LES-Ctt to TrNa-Ph-GAA may be a biomarker of progression-free survival and prognosis of prostate cancer.23 However, no studies have revealed the regulatory role of tsRNA in sarcoidosis.
We aimed to use transcriptomics high-throughput sequencing to detect the expression profile of sarcoidosis serum tRNA-derived fragments (tsRNA) and obtain differentially expressed tsRNA molecules, which may be a specific marker for the diagnosis of sarcoidosis. In combination with relevant clinical data, the clinical application value of tsRNA was analysed. Thereafter, the target mRNA of the differentially expressed tsRNA was predicted using bioinformatics technology, and the roles of tsRNA and target mRNA in the occurrence and development of sarcoidosis were preliminarily discussed.
Materials and Methods
Sample Collection
This study was conducted in accordance with the Declaration of Helsinki and was approved by the Research Ethics Board of the Second Affiliated Hospital of Jilin University (Changchun, China). Written informed consent was obtained from all individuals included in the study. Three adult patients who were diagnosed with sarcoidosis at the Department of Respiratory and Critical Care of the Second Affiliated Hospital of Jilin University were enrolled in the RNA sequencing experiment. The diagnosis of sarcoidosis was verified by histopathologic examination of mediastinal lymph nodes or lung biopsy samples. Overall, three female patients with sarcoidosis were included in this study, and were compared with three healthy female volunteers. To verify the RNA sequencing results, 22 patients with sarcoidosis were included in the study and were compared with 18 healthy volunteers. The patient characteristics are listed in Table 1. Healthy volunteers were recruited from hospital outpatient departments and consisted of patients, visitors and staff. Prior to enrolment, all healthy volunteers underwent chest radiology and had no known history of underlying respiratory or chronic disease and took no regular medication. All were non-smokers and had no history of lower respiratory tract infection during the preceding six weeks. All study subjects were members of the Chinese Han nationality in northern China. The baseline characteristics of the validation group are presented in Table 2.
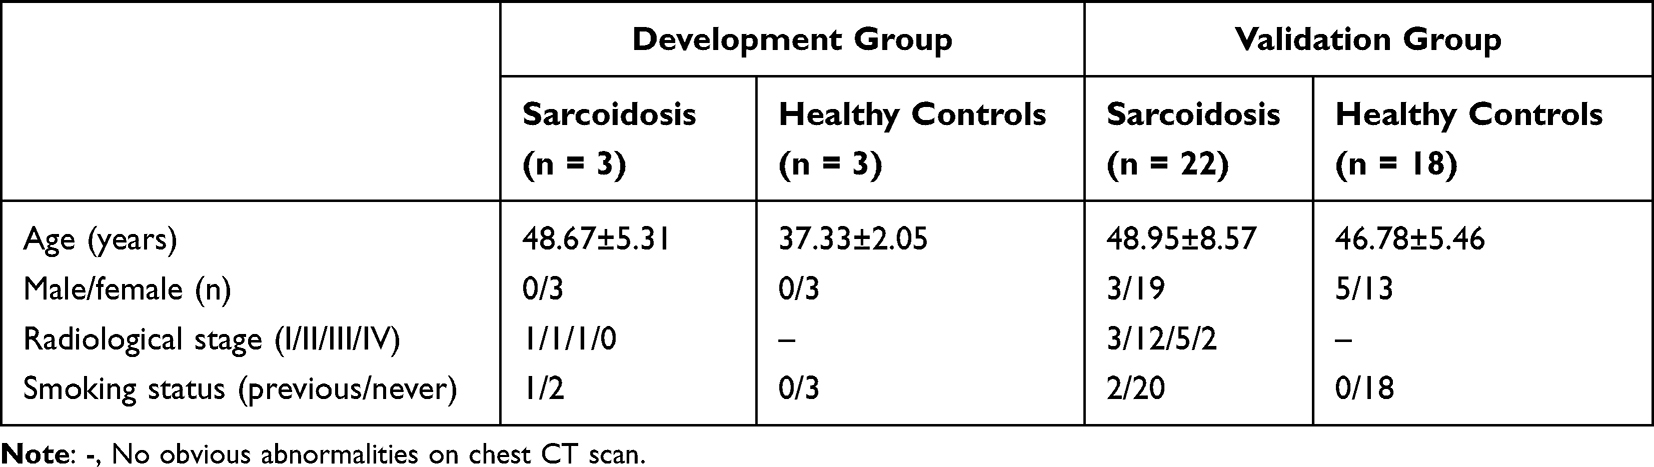 |
Table 1 The Characteristics of the Patients in the Development and Validation Groups |
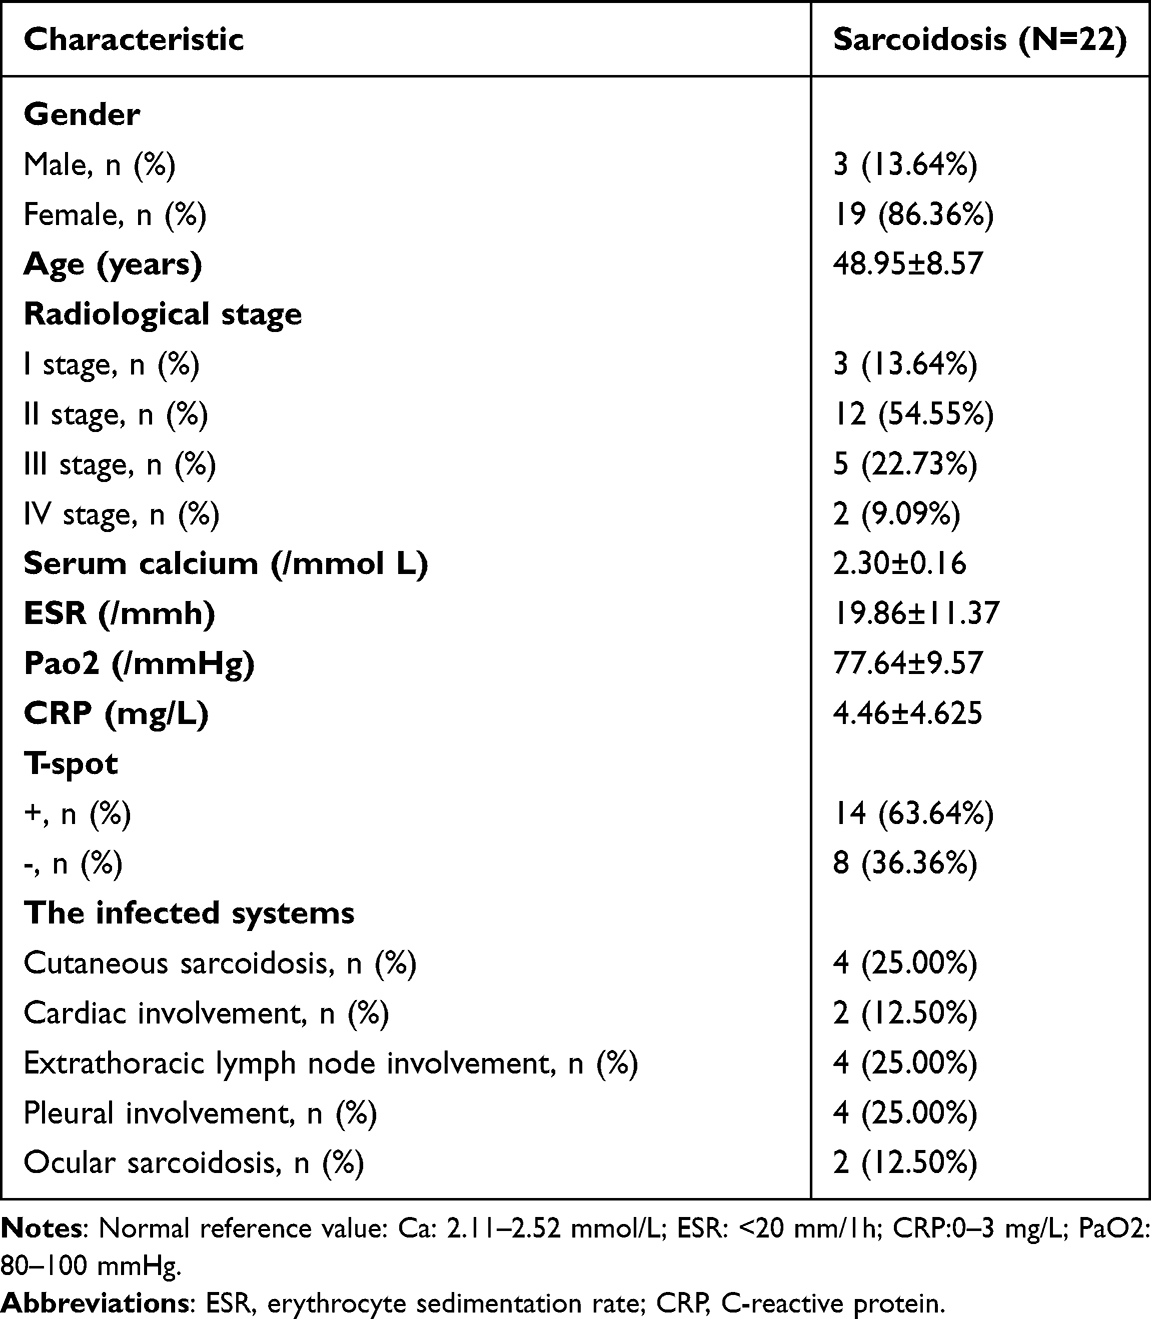 |
Table 2 Individual Key Clinical Characteristics for Sarcoidosis Patients |
Samples were collected between February 2019 and September 2021. Whole blood samples were acquired and collected into acid-citrate-dextrose-containing yellow‐top tubes before surgery. After incubation for 15 min at 25 °C and centrifugation for 10 min at 1000 × g, the serum was transferred to new RNase-free tubes. The entire sample processing procedure was performed on ice. Finally, the serum samples were stored at −80 °C for further experiments.
RNA Extraction
We used a fixed volume of serum (500 μL per sample) for tsRNA sequencing and quantitative reverse-transcriptase-polymerase chain reaction (qRT-PCR) detection. Total RNA was extracted using TRIzol® reagent. We then confirmed that all OD 260/280 absorbance ratios were between 1.8 and 2.0, using the NanoDrop ND‐1000 (Thermo Fisher Scientific, Waltham, MA, USA). Finally, the extracted RNA was preserved at −80 °C for subsequent experiments.
tRF and tiRNA High‐throughput Sequencing
Before the sequencing experiment, we determined the quality of each RNA sample using agarose gel electrophoresis and the Nanodrop™ instrument. tsRNAs are heavily decorated by RNA modifications, which interfere with small RNAseq library construction. Therefore, we performed the following treatments with the rtStar™ tRF and tiRNA Pre-treatment Kit before library preparation for the total RNA samples: 3-aminoacyl (charged) deacylation to 3-OH for 3ʹ adapter ligation; 3‐cP (2,3‐cyclic phosphate) removal to 3-OH for 3ʹ adapter ligation; 5–OH (hydroxyl group) phosphorylation to 5‐P for 5ʹ adapter ligation; and m1A and m3C demethylation for efficient reverse transcription. Pre-treated total RNA was used to prepare the sequencing library using the rtStar™ First‐Strand complementary DNA (cDNA) Synthesis Kit: (a) 3ʹ adapter ligation, (b) 5ʹ adapter ligation, (c) cDNA synthesis, (d) PCR amplification, and (e) size selection of 134–160 bp PCR-amplified fragments. The prepared samples were denatured into single-stranded DNA molecules, which were then captured on Illumina flow cells, amplified in situ, and profiled for 50 cycles on an Illumina NextSeq 500 system (Illumina, USA). Image analysis and base calling are performed using Solexa pipeline v1.8 (Off-Line Base Caller software, v1.8). Sequencing quality are examined by FastQC and trimmed reads (pass Illumina quality filter, trimmed 5’,3’-adaptor bases by cutadapt) are aligned allowing for 1 mismatch only to the mature tRNA sequences, then reads that do not map are aligned allowing for 1 mismatch only to precursor tRNA sequences with bowtie software. The remaining reads are aligned allowing for 1 mismatch only to miRNA reference sequences with miRDeep2. The abundance of tRF and tiRNA and miRNA are evaluated using their sequencing counts and is normalized as counts per million of total aligned reads (CPM). The tRFs and tiRNAs and miRNAs differentially expressed are screened based on the count value with R package edgeR. Principal Component Analysis (PCA), Correlation Analysis, Pie plots, Venn plots, Hierarchical clustering, Scatter plots and Volcano plots are performed in R or perl environment for statistical computing and graphics of the expressed tRF and tiRNA. Deep sequencing data have been deposited in the Gene Expression Omnibus database under accession no.GSE198490.
Validation Using Reverse Transcription‑quantitative PCR (RT‑qPCR)
RT-qPCR is considered the gold standard for the quantification of gene expression.24,25 To verify the RNA sequencing results, six tsRNAs were selected, and their tsRNA relative abundance levels were detected in 22 patients with sarcoidosis and 18 healthy controls. Total RNA was extracted from serum using TRIzol® reagent. RNA samples were pre-treated using the rtStar™ tRF and tiRNA Pre-treatment Kit (cat. no. AS‑FS‑005; Arraystar Inc.) to remove RNA modifications, and then reverse transcribed to cDNA using the rtStar™ First-Strand cDNA Synthesis Kit (cat. no. AS-FS-003; Arraystar Inc, USA.) according to the manufacturer’s protocol. RT-qPCR was performed using the ViiA 7 Real-time PCR system, using the Arraystar SYBR® Green Real-time qPCR Master mix (cat. no. AS-MR-005-25; Applied Biosystems; Thermo Fisher Scientific, Inc, USA.) with specific primers (Table 3). The thermocycling conditions were as follows: initial denaturation at 95 °C for 10 min, followed by 40 cycles at 95 °C for 10s, and 60 °C for 60s. The relative tsRNA abundance levels were calculated using the relative standard curve method26 and normalised to U6, as endogenous controls. All reactions were performed in triplicate.
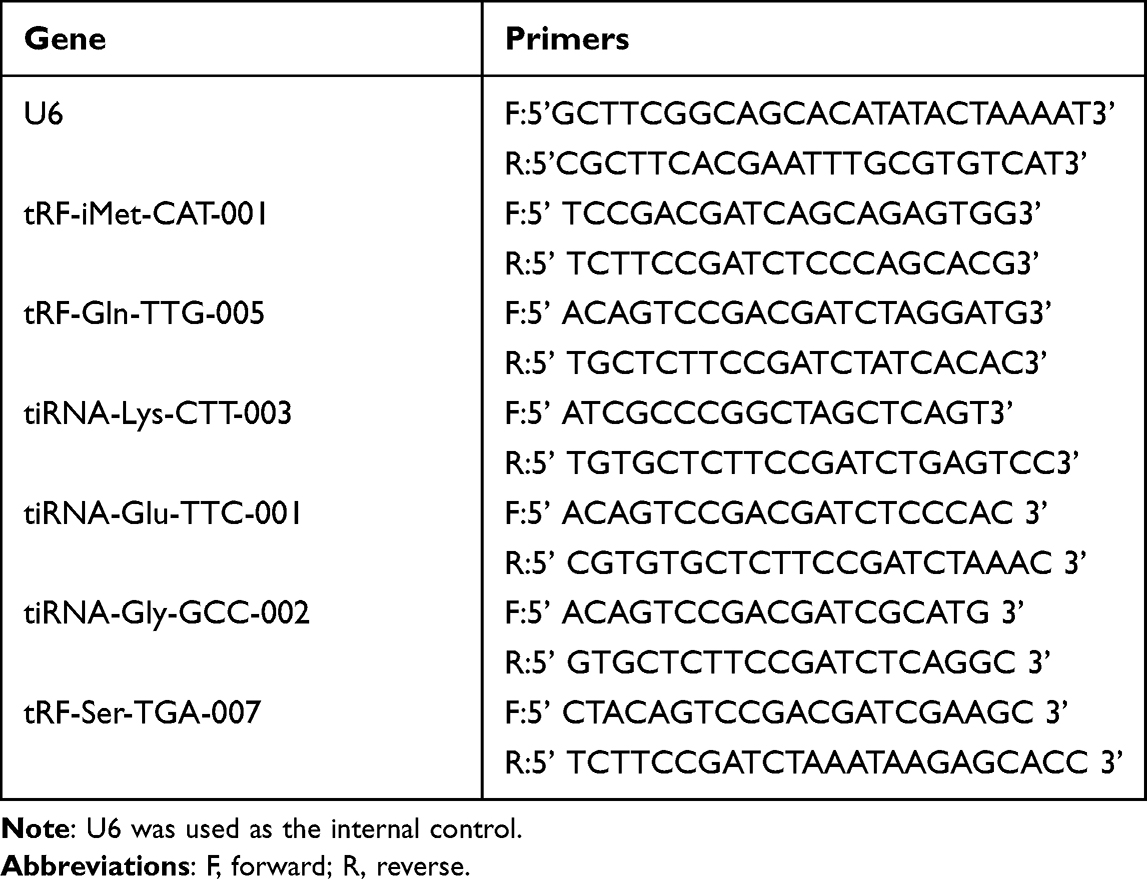 |
Table 3 Primers for Reverse Transcription-Quantitative Polymerase Chain Reaction |
Target Prediction of Treatment-Related tsRNAs
tsRNAs contained some seed sequences, which might match the crosslink-centred regions of target mRNAs.27,28 In addition, several studies strongly suggested that tsRNAs have a miRNA-like function, leading to mRNA silencing.29–31 In this study, we used two common algorithms to predict tsRNA targets: TargetScan (http://www.targetscan. org, USA) and miRDB (http://www.mirdb.org, USA). The network illustration was visualised using Cytoscape software (version 3.5.1, Cytoscape Consortium, San Diego, CA, USA).
Bioinformatics Analysis
Pathway and process enrichment analyses were performed to assign the biological annotation of the targets. Analysis was performed using several ontology sources. Gene Ontology (GO) is commonly used to determine the function(s) of genes during the analysis of high-throughput transcriptomic or genomic data. Kyoto Encyclopaedia of Genes and Genomes (KEGG) is a collection of databases associated with genomes, diseases, biological pathways, drugs, and chemical materials.31 Database for Annotation, Visualisation, and Integrated Discovery (DAVID) is an online bioinformatics tool that is used to identify the functions of genes or proteins. We used DAVID to determine the functions of differentially expressed genes (DEGs) in the biological process (BP), cellular component (CC), molecular function (MF), and pathways (P < 0.05). PPI networks help clarify the molecular mechanisms underlying biological progress. PPI networks were generated using the Search Tool for the Retrieval of Interacting Genes (STRING; https://string-db.org/, Switzerland) using a threshold interaction score of 0.4. Subsequently, we used the MCODE app in Cytoscape to analyse PPI network modules (degree cut-off = 2, max; depth = 100; k-core = 2; and node score cut-off = 0.2).
Identification of Hub Gene(s)
The hub genes in the candidate modules were identified using the Cytoscape plugin cytoHubba (top 10 nodes ranked by MCC, MNC, Radiality, Stress, Betweenness, BottleNeck, Closeness, ClusteringCoefficient, Degree, DMNC, EcCentricity, and EPC). The NCBI-GEO is a free public database of a microarray/genomic data repository. Gene expression profiles in the peripheral blood of sarcoidosis patients were obtained from the GSE19314 datasets. Microarray data of GSE1931432 were obtained using GPL570 Platforms ([HG-U133_Plus_2] Affymetrix Human Genome U133 Plus 2.0 Array), which included 37 and 20 blood samples from patients with sarcoidosis and healthy individuals, respectively. We used the expression data from the GSE19314 database to generate the receiver operating characteristic (ROC) curves of the hub genes using R/Bioconductor. The area under the ROC curve (AUC) for these genes was calculated to test their potential for diagnosing sarcoidosis. AUC > 0.5 were considered statistically significant. The RNAhybrid software (https://bibiserv.cebitec.uni-bielefeld.de/rnahybrid, Germany) was used to establish a basic complementary pairing model between the differentially expressed tsRNA and its associated central gene (AUC > 0.7) to clarify the site of action.
Statistical Analysis
The results are presented as means ± SD. Statistical analysis was conducted using SPSS 24.0 software and GraphPad Prism 7. Differences between two groups were analysed using the Student’s t-test. One-way analysis of variance (ANOVA) was employed for all three groups. Statistical significance was set at P < 0.05.
Results
Expression Profiles of tsRNAs
A total of 4021 tsRNAs mapped to 334 unique tRNAs, including tRNAs in the cytosol or mitochondria, were identified. Interestingly, some tsRNAs mapped to different tRNAs shared the same sequence. Based on this classification, we further analysed the proportion of tsRNAs subtypes in patients with sarcoidosis and healthy controls. The pie charts show the distribution of the number for each subtype of tsRNA with a threshold average CPM ≥ 20. A total of 231 tsRNAs for exact matches were identified in the serum (207 in sarcoidosis, 214 in healthy controls). In the sarcoidosis group, two tRF-2, 33 tRF-3a, 22 tRF-3b, 38 tRF-5a, 24 tRF-5b, 76 tRF-5c, and 12 tiRNA-5 were identified in the sarcoidosis group (Figure 1A). In the control group, four tRF-1, two tRF-2, 34 tRF-3a, 26 tRF-3b, 38 tRF-5a, 23 tRF-5b, 72 tRF- 5c, and 15 tiRNA-5 were identified (Figure 1B). In addition, the numbers of tsRNAs derived from the variable anticodon tRNAs are shown in the stacked plots (Figure 1C and D).
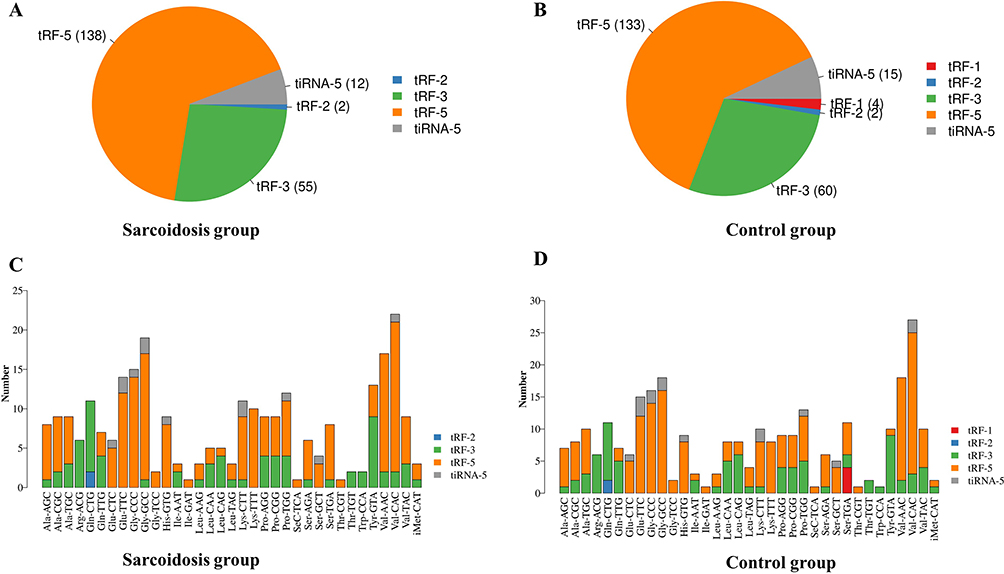 |
Figure 1 Subtype tsRNAs distribution between sarcoidosis and control samples by small RNA-Seq. (A and B) Pie chart of the distribution of subtype tsRNAs number in sarcoidosis group and control group. (C and D) The numbers of tsRNAs derived from the variable anticodon tRNAs are demonstrated in sarcoidosis group and control group. |
Differentially expressed tsRNAs in patients with sarcoidosis vs healthy controls were identified through RNA sequencing. All differentially expressed tsRNAs are shown in the cluster heatmap in Figure 2A. The heatmap revealed systematic variations between the sarcoidosis and control groups in terms of tsRNA expression. Additionally, we identified 13 significantly dysregulated tsRNAs: four were upregulated, while nine were downregulated (FC > 1.5, P < 0.05; Figure 2B and Table 4).
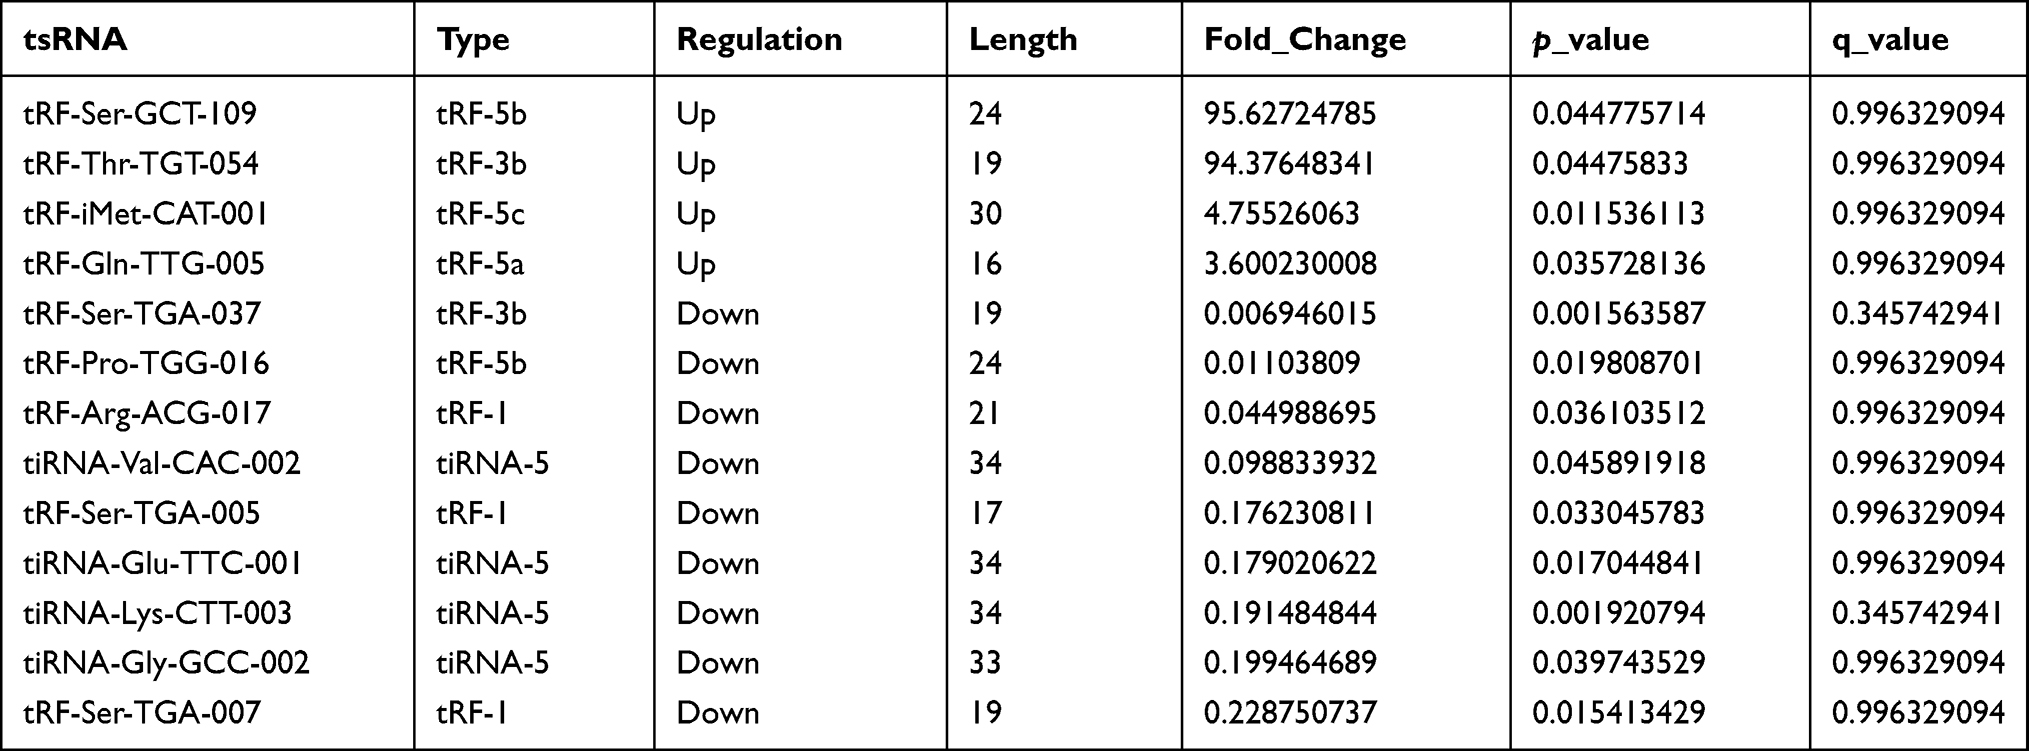 |
Table 4 Differential tsRNAs in Sarcoidosis |
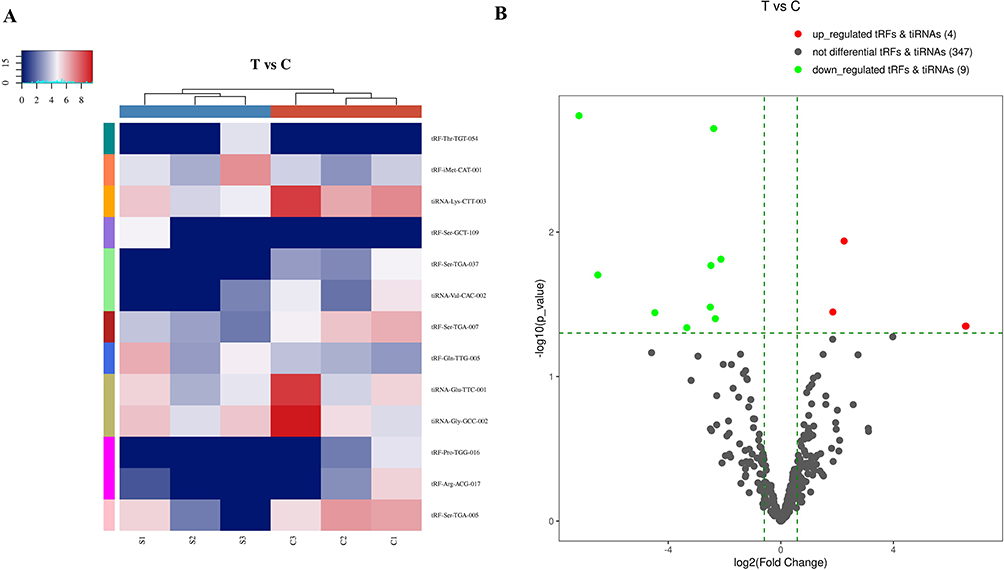 |
Figure 2 Differentially expressed tsRNAs between sarcoidosis and control samples. (A) Heat map and hierarchical clustering analysis of differentially expressed tsRNAs between sarcoidosis and control samples. (B) The volcano plots of differentially expressed tsRNAs. The green line shows the default 1.5-fold change. The red and green plots indicate the significantly upregulated and downregulated genes, respectively (fold change ≥ 1.5, P < 0.05). |
RT‑qPCR Validation of RNA Sequencing results
Although 13 significantly dysregulated tsRNAs were identified, only half of tsRNAs (tRF-iMet-CAT-001, tRF-Gln-TTG-005, tiRNA-Glu-TTC-001, tiRNA-Lys-CTT-003, tiRNA-Gly-GCC-002, and tRF-Ser-TGA-007) were selected to validate the RNA sequencing results using RT-qPCR in sarcoidosis and control samples. The main reasons for the above situation are as follows. First, the individual differences in the sarcoidosis group or the control group were large, resulting in a large P value of some tsRNA sequencing results, such as tRF-Ser-GCT-109, tRF-Thr-TGT-054, and tiRNA-Val-CAC-002. Therefore, the above tsRNAs were excluded. In addition, we found after reading the literature that there are also some tsRNAs that are also significantly different in other diseases, such as tiRNA-Glu-TTC in breast cancer18 and tiRNA-Lys-CTT in prostate cancer.23 Finally, we screened 6 more likely distinct tsRNAs for validation. The expression profiles of tiRNA-Glu-TTC-001, tiRNA-Lys-CTT-003, and tRF-Ser-TGA-007 agreed with results obtained from RNA sequencing. There were significant differences in tsRNA expression levels between patients with sarcoidosis and healthy controls (P < 0.05; Figure 3A and C). These findings indicated that the RNA sequencing data were reliable enough to warrant further analysis.
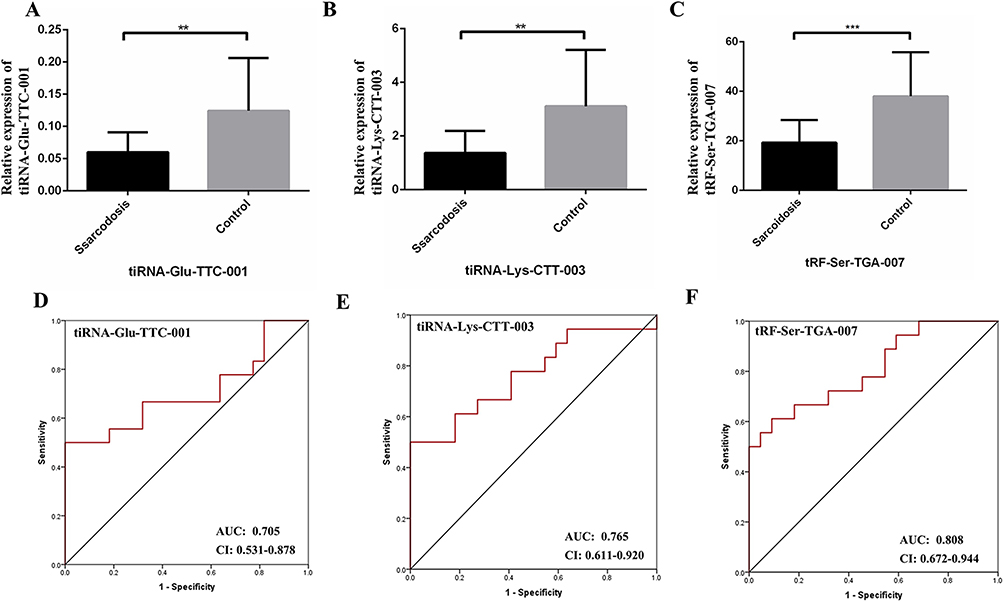 |
Figure 3 (A-C) The qPCR results showed that tiRNA-Glu-TTC-001, tiRNA-Lys-CTT-003, and tRF-Ser-TGA-007 were consistent with tsRNA-Seq data. Thus, the 3 tsRNAs were confirmed as sarcoidosis related tsRNAs and used for further analysis. (D-F) ROC curves for tiRNA-Glu-TTC-001, tiRNA-Lys-CTT-003, and tRF-Ser-TGA-007. Data were presented as mean ± SD, **P < 0.01, ***P < 0.001. Abbreviations: AUC, The area under the ROC curve; CI, 95% confidence interval. |
ROC Analysis of Differentially Expressed tsRNAs in Sarcoidosis
The results of qPCR were used to construct the ROC curve to evaluate the diagnostic value of tiRNA-Glu-TTC-001, tiRNA-Lys-CTT-003, and tRF-Ser-TGA-007 in sarcoidosis (Figure 3D and F). Compared with healthy subjects, the AUC of tiRNA-Glu-TTC-001 in sarcoidosis was 0.705 (95% confidence interval [CI]: 0.531–0.878). The tiRNA-Lys-CTT-003 in sarcoidosis was 0.765 (95% CI: 0.611–0.920). The AUC of tRF-Ser-TGA-007 in sarcoidosis was 0.808 (95% CI: 0.672–0.944).
Correlation Between Differentially Expressed tsRNAs and the Clinical Parameters of Sarcoidosis
The relative expression levels of tiRNA-Glu-TTC-001 were negatively correlated with age (P < 0.01; Figure 4A). The relative expression levels of tiRNA-Lys-CTT-003 were significantly correlated with age and the number of affected systems (P < 0.01; Figure 4B and C). There was a significant positive correlation between the relative expression of tRF-Ser-TGA-007 and blood calcium levels (P < 0.01; Figure 4D).
 |
Figure 4 Correlation between differentially expressed tsRNAs and the clinical parameters of sarcoidosis. (A) Correlation between tiRNA-Glu-TTC-001 and age. (B) Correlation between tiRNA-Lys-CTT-003 and age. (C) Correlation between tiRNA-Lys-CTT-003 and the number of affected systems. (D) Correlation between tRF-Ser-TGA-007 and blood calcium levels. |
Prediction of Target Genes of Differentially Expressed tsRNAs
Although the mechanism of tsRNA action is yet to be elucidated, recent evidence suggests a miRNA-like mode of action, and bioinformatic prediction of tsRNA (whether tRF or tiRNA) will still use similar miRNAs for prediction in some studies.23,33–36 miRNAs can recognise their mRNA targets using their seed sequence (positions 2–7nt at their 5ʹ ends) and suppress global mRNA translational activities. Based on this rule, we used two types of algorithms, TargetScan and miRDB, to predict tsRNA targets. TargetScan and miRDB are two softwares for predicting ncRNA binding sites, which is very effective for predicting ncRNA (including miRNA) binding sites in mammals. Before predicting ncRNA target genes, the 3’UTR region of the transcript needs to be determined first. The databases use a sequencing technology called 3P-seq to determine the 3’UTR region corresponding to the transcript (some tsRNAs in mammals are transcribed by binding the 3’UTR region of this sequence plays a role in post-transcriptional regulation), and combined with the analysis results of this technology and the existing 3’UTR annotation in NCBI, a comprehensive 3’UTR region sequence is provided. Additionally, to reduce false-positive results, only genes predicted by all two software programs were considered targets of tsRNAs. In total, tsRNAs that target 646 mRNAs as predicted by miRDB, tsRNAs that target 228 mRNAs as predicted by TargetScan, and the two target a total of 96 mRNAs (Figure 5B); tiRNA-Glu-TTC-001, tiRNA-Lys-CTT-003, and tRF-Ser-TGA-007 could target 637, 111, and 39 transcripts, respectively (Figure 5A and Table S1).
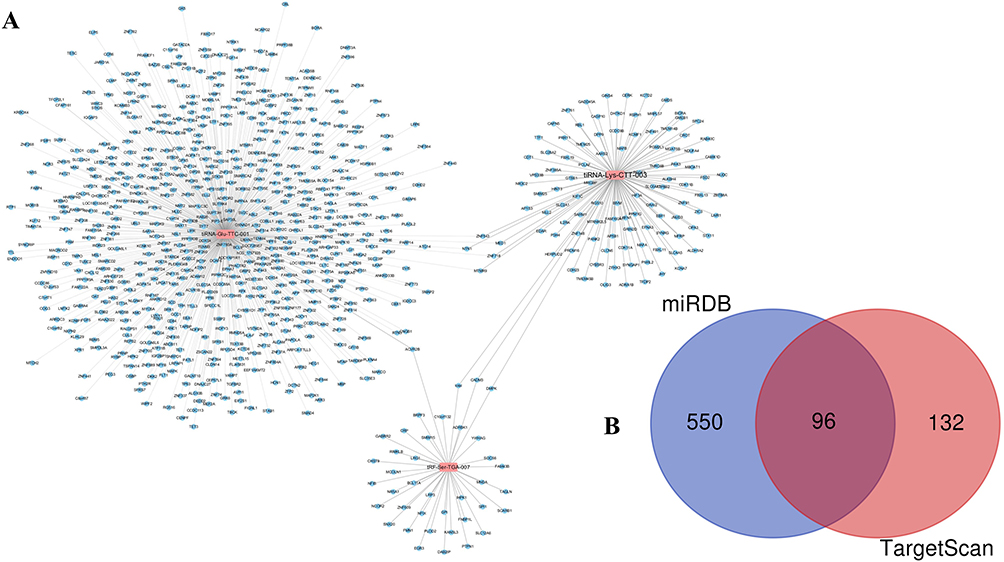 |
Figure 5 Targets genes of differentially expressed tsRNAs. (A) The targets of each tsRNA were shown respectively. (B) Venn plot to indicate that 96 mRNA targets of three tsRNAs were predicted by two prediction software simultaneously. |
Biological Function Analysis Revealing Potential Therapeutic Effects of Differentially Expressed tsRNAs
The tsRNAs regulated mRNA translational activities, therefore we conducted bioinformatics analyses of the functions of target mRNAs to understand their biological functions. We used GO biological processes and KEGG pathways to explore the functions of target mRNAs. The target mRNA of tiRNA-Glu-TTC-001 was enriched in BP and involved in the regulation of transcription, DNA-templated, transcription, negative regulation of transcription from RNA polymerase II promoter, Ras protein signal transduction, heterophilic cell-cell adhesion via plasma membrane cell adhesion molecules, transport, ERK1 and ERK2 cascade, positive regulation of transcription from RNA polymerase II promoter, small GTPase-mediated signal transduction, brain development, ER to Golgi vesicle-mediated transport, and cell proliferation (Figure 6A). The CC comprised intracellular, nucleus, cis-Golgi network, Golgi membrane, receptor complex, chromatin, early endosome, and actin cytoskeleton (Figure 6B), while MF included protein binding, metal ion binding, nucleic acid binding, transcription factor activity, sequence-specific DNA binding, DNA binding, RNA polymerase II core promoter proximal region sequence-specific DNA binding, chromatin binding, protein serine/threonine kinase activity, and transcription corepressor activity (Figure 6C).
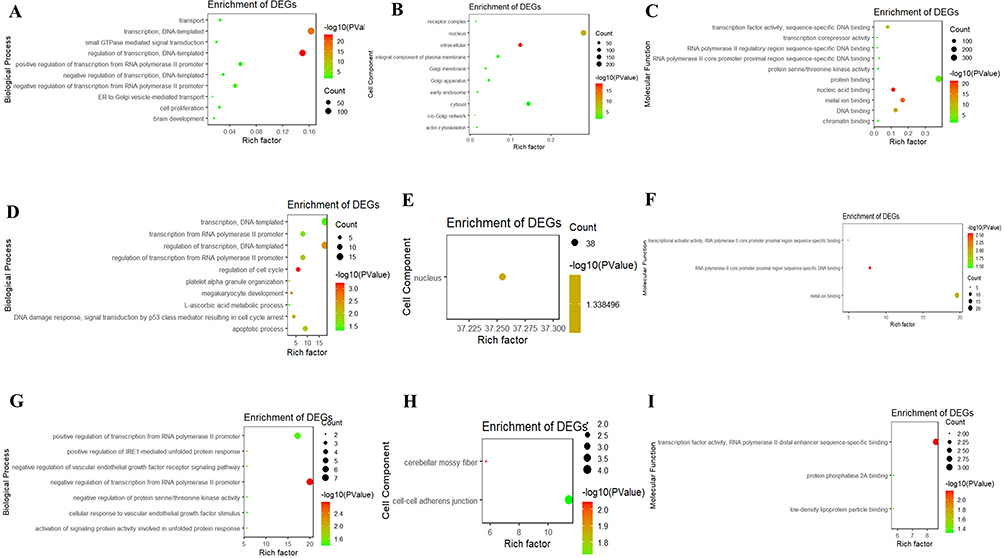 |
Figure 6 GO terms of the target mRNA of tsRNAs. (A-C) tiRNA-Glu-TTC-001. (D-F) tiRNA-Lys-CTT-003. (G-I) tRF-Ser-TGA-007. (A, D and G) biological process; (B, E and H) cellular component; (C, F and I) molecular function. GO, Gene ontology. |
The target mRNA of tiRNA-Lys-CTT-003 was enriched in BP, involved in transcription regulation, DNA-templated, regulation of cell cycle, DNA damage response, signal transduction by p53 class mediator resulting in cell cycle arrest, transcription from RNA polymerase II promoter, megakaryocyte development, platelet alpha granule organisation (Figure 6D), in CC, comprising the nucleus (Figure 6E), and MF, in RNA polymerase II core promoter proximal region sequence-specific DNA binding, metal ion binding, transcriptional activator activity, RNA polymerase II core promoter proximal region sequence-specific binding (Figure 6F).
The target mRNA of tRF-Ser-TGA-007 was enriched in BP involved in negative regulation of transcription from RNA polymerase II promoter, positive regulation of transcription from RNA polymerase II promoter, negative regulation of vascular endothelial growth factor receptor signalling pathway, positive regulation of IRE1-mediated unfolded protein response, activation of signalling protein activity involved in unfolded protein response, negative regulation of protein serine/threonine kinase activity, cellular response to vascular endothelial growth factor stimulus (Figure 6G). The CC comprised cerebellar mossy fibre, cell-cell adherens junction (Figure 6H), and MF in transcription factor activity, RNA polymerase II distal enhancer sequence-specific binding, transcription factor activity, RNA polymerase II distal enhancer sequence-specific binding, and protein phosphatase 2A binding (Figure 6I).
KEGG analysis revealed that the target mRNA of tiRNA-Glu-TTC-001 was particularly enriched in pathways in cancer, chemokine signalling, cAMP signalling, Rap1 signalling, endocytosis, Ras signalling, cGMP-PKG signalling, retrograde endocannabinoid signalling, FoxO signalling, adrenergic signalling in cardiomyocytes, and inflammatory mediator regulation of TRP channels (Table 5), while no KEGG pathway was associated with the target mRNAs of tiRNA-Lys-CTT-003 and tRF-Ser-TGA-007 (P < 0.05).
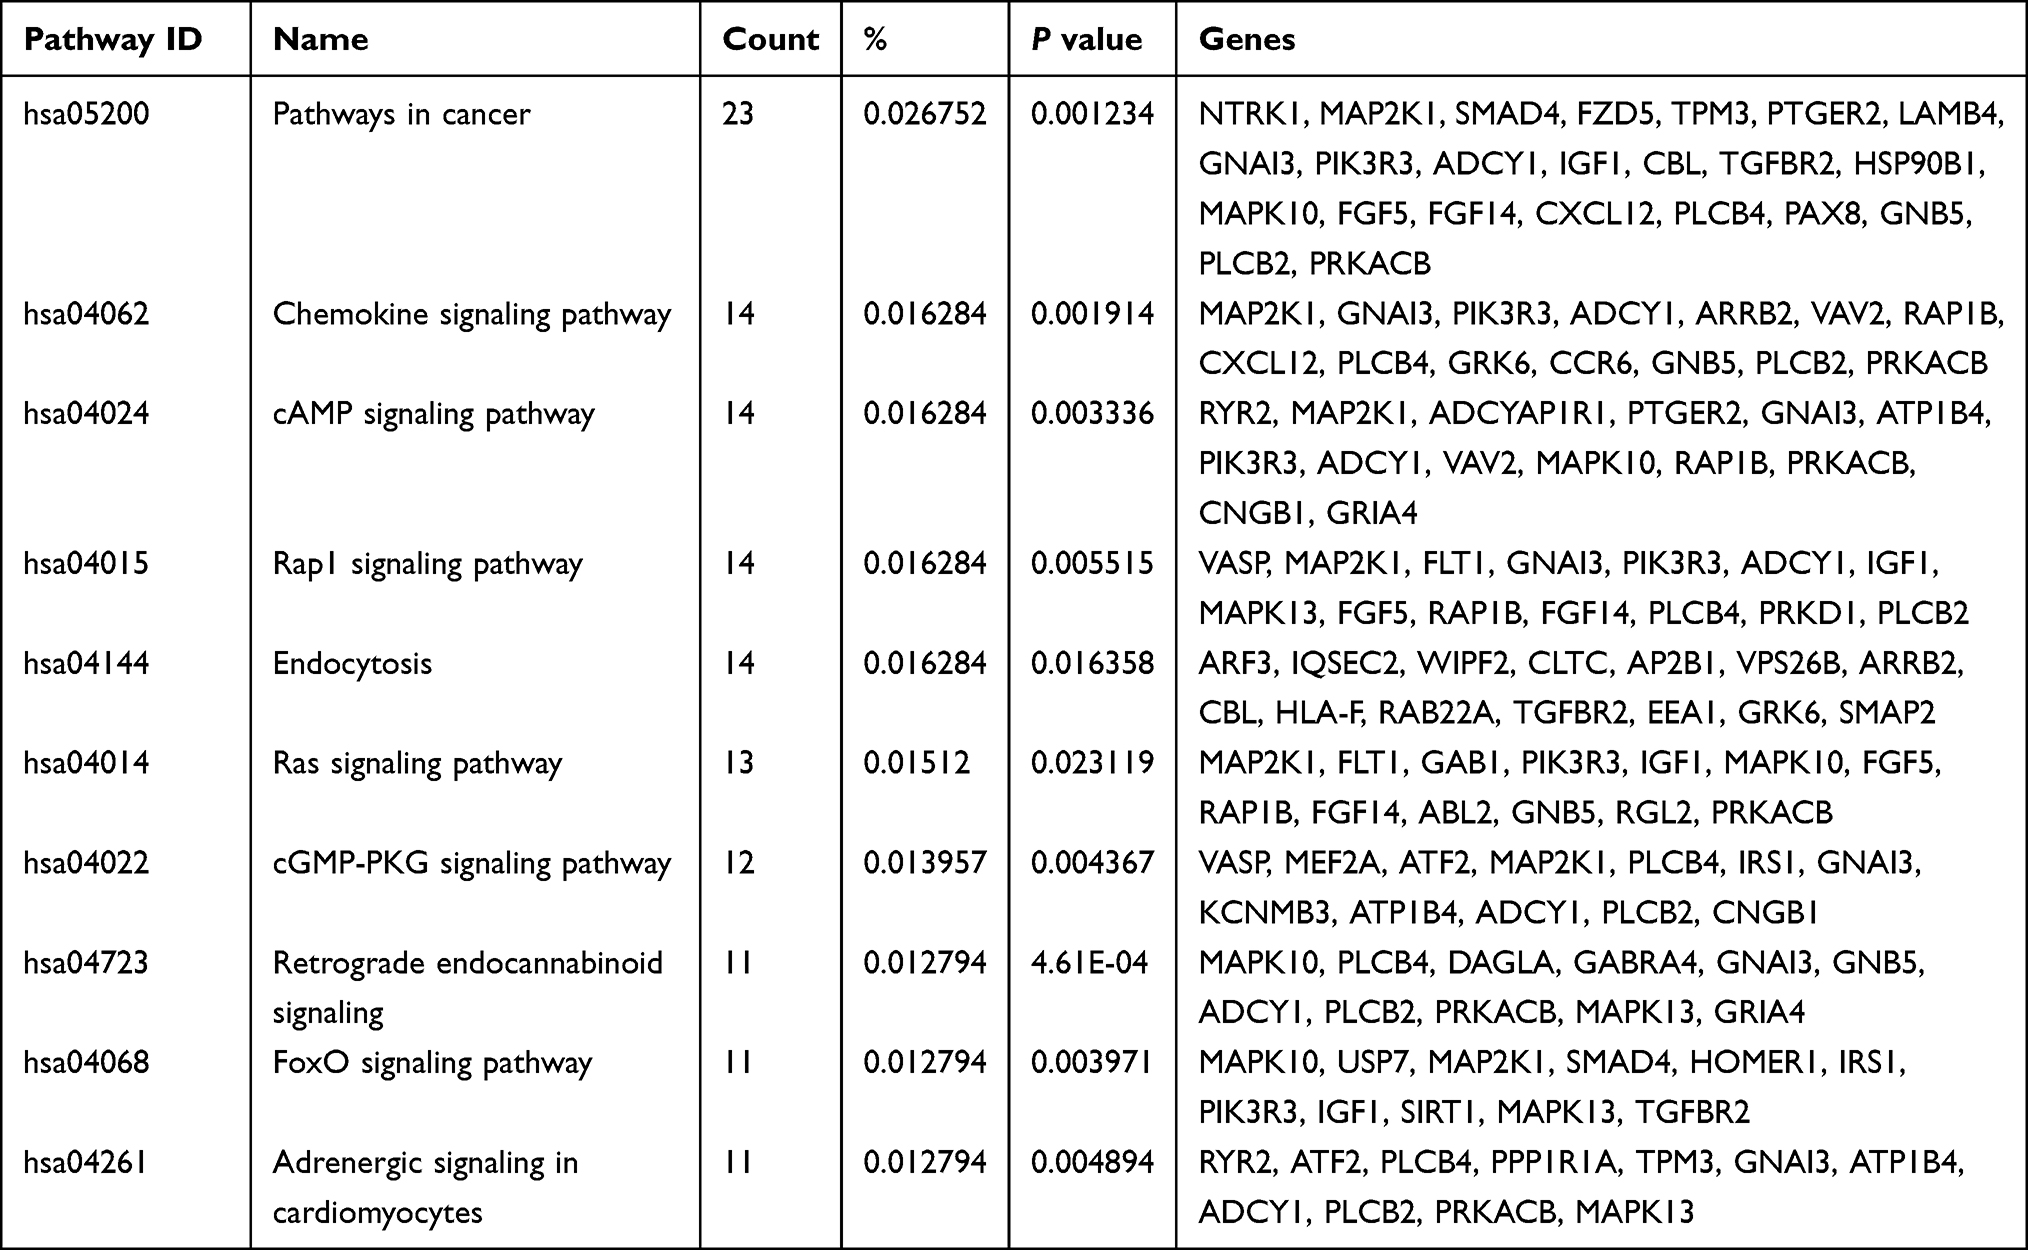 |
Table 5 KEGG Pathway Analysis of the Target mRNA of tiRNA-Glu-TTC-001 |
Hub Gene Analysis
The top ten genes of each sub-plugin in the PPI network of the target mRNAs of tiRNA-Glu-TTC-001, tiRNA-Lys-CTT-003, and tRF-Ser-TGA-007 were identified using the cytoHubba plugin, respectively (Table 6). The ten genes with the highest frequency in all sub-plugins were classified as hub genes. KEGG analysis of the hub genes showed their involvement in the insulin signalling pathway (hsa04910), chemokine signalling pathway (hsa04062), regulation of lipolysis in adipocytes (hsa04923), bacterial invasion of epithelial cells (hsa05100), neurotrophin signalling pathway (hsa04722), AMPK signalling pathway (hsa04152), platelet activation (hsa04611), FoxO signalling pathway (hsa04068), cAMP signalling pathway (hsa04024), proteoglycans in cancer (hsa05205), and pentose phosphate pathway (hsa00030).
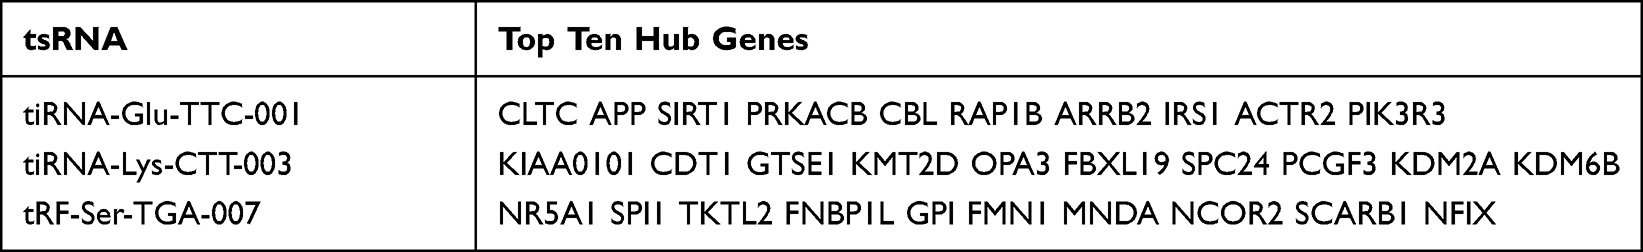 |
Table 6 The Top 10 Hub Genes of Differential tsRNAs by cytoHubba |
We used AUC analysis to evaluate their potential for diagnosing sarcoidosis using the expression data from the GSE19314 database. The hub genes associated with tiRNA-Glu-TTC-001 were all expressed in the serum. The AUCs of CLTC, APP, PRKACB, RAP1B, ARRB2, IRS1, ACTR2, and PIK3R3 were all greater than 0.5, of which APP, PRKACB, and ARRB2 were 0.707, 0.728, and 0.714, respectively (Figure 7A). Except for KIAA0101, the hub genes associated with tiRNA-Lys-CTT-003 were all expressed in the serum of patients with sarcoidosis. The AUCs of nine genes were all greater than 0.5 (Figure 7B). The hub gene associated with tRF-Ser-TGA-007 was expressed in the serum. The AUCs of NR5A1, SPI1, TKTL2, FMN1, MNDA, and NCOR2 were all greater than 0.5, of which NR5A1 and MNDA were 0.712 and 0.726, respectively (Figure 7C). The AUCs >0.5 were considered statistically significant. These genes have higher diagnostic potential since they were all greater than 0.70.
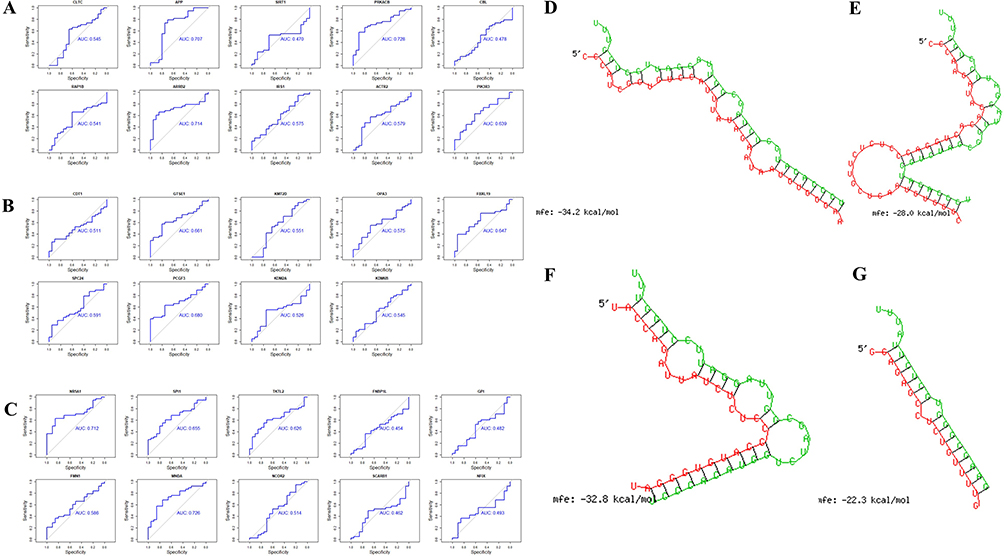 |
Figure 7 The diagnosis information of the hub genes. (A) The ROC curves were used to identify the diagnosis information of the hub genes associated with tiRNA-Glu-TTC-001 and, except SIRT1 and CBL, hub genes had a significantly diagnostic value (AUCs > 0.50). (B) The ROC curves were used to identify the diagnosis information of the hub genes associated with tiRNA-Lys-CTT-003 and, except KIAA0101, which was not expressed in the serum of patients with sarcoidosis, all hub genes had a significantly diagnostic value (AUCs > 0.50). (C) The ROC curves were used to identify the diagnosis information of the hub genes associated with tRF-Ser-TGA-007 and NR5A1, SPI1, TKTL2, FMN1, MNDA, and NCOR2 had a significantly diagnostic value (AUCs > 0.50). (D-G) The binding region of tsRNA and seed sequence were exhibited. (D-F) The base complementary pairing model between tiRNA-Glu-TTC-001 and APP, PRKACB, and ARRB2. (G) The base complementary pairing model between tRF-Ser-TGA-007 and NR5A1. Green: the binding region of tsRNA; Red: seed sequence of target gene; mfe: minimum free energy. Abbreviations: ROC curve, receiver operating characteristic curve; AUC, the area under the ROC curve. |
RNAhybrid software was used to construct a base complementary pairing model between tiRNA-Glu-TTC-001 and APP, PRKACB, and ARRB2 (Figure 7D-F), and between tRF-Ser-TGA-007 and NR5A1 and MNDA, respectively. There was no base complementary pairing model between tRF -Ser-TGA-007 and MNDA (Figure 7G).
Discussion
This is the first study to investigate the expression profiles of tsRNA as potential biomarkers and molecules regulating mRNA transcription activities in sarcoidosis. In the serum of sarcoidosis patients, three tsRNAs were significantly reversed compared with the control group. Bioinformatics analysis revealed that the three differentially expressed tsRNAs could play a role in regulating the chemokine, cAMP, cGMP-PKG, and FoxO signalling pathways. These findings provide new insights to better understand the pathogenesis and diagnosis of sarcoidosis.
Sarcoidosis can affect almost every system in the body, but it is more common in the respiratory system, lungs, and lymph nodes in the chest. The unknown aetiology and difficulty of diagnosis prolongs the period of time from symptom onset to diagnosis confirmation, thus statistics regarding incidence and prevalence of sarcoidosis are somewhat challenging. Although many efforts have been made to identify biomarkers of sarcoidosis, there are currently no definite biomarkers available at the clinical level.
The roles played by miRNAs have been investigated in sarcoidosis,37 while the involvement of tsRNA is novel. tsRNA has been found to be expressed in almost every branch of life, including bacteria and archaea, whose miRNA or siRNA pathway is missing. Due to the lack of conventional ribonucleases, tsRNA can still be found in these less-complex organisms, which indicates that an older regulatory system controls the expression of tsRNA. Numerous studies have suggested that tsRNAs have key regulatory roles and physiological and pathological functions.38 Through binding to mRNA, a mechanism similar to miRNAs, tsRNAs regulate the stability of RNA and participate in important physiological processes such as cell proliferation and DNA damage.39
In this study, we performed high-throughput sequencing to detect the expression profile of tsRNA in the serum of sarcoidosis and control groups. Furthermore, considering the reliability of sequencing data, we validated the six tsRNAs using qPCR. Three tsRNAs were not consistent with the sequencing results, and the remaining three tsRNAs (tiRNA-Glu-TTC-001, tiRNA-Lys-CTT-003, and tRF-Ser-TGA-007) were confirmed for further analysis. The sequencing analysis results may contain false positive results. Previous sequencing analysis studies have shown that only a part of the tsRNAs’ RT-qPCR verification results are consistent with the sequencing analysis results.31
Subsequently, we identified several sarcoidosis-associated tsRNAs that are potential biomarkers of sarcoidosis and performed qPCR to verify their association. We did ROC curve of the target tsRNA and analysed the specificity and sensitivity of each target gene in the diagnosis of sarcoidosis, and we found that the target tsRNA had excellent sensitivity and specificity as potential biomarkers. Moreover, it brings new ideas to the diagnosis and treatment of sarcoidosis and has important guiding significance for the future research of sarcoidosis.
Further analysis of the correlation between differentially expressed tsRNAs and clinical parameters of sarcoidosis showed that the relative expression levels of tiRNA-Glu-TTC-001 and tiRNA-Lys-CTT-003 were negatively correlated with age. The age of onset of sarcoidosis is concentrated between 30–40 years old, but it may also occur in children and the elderly. As several patients have no symptoms, it is difficult to determine the true incidence and prevalence of sarcoidosis worldwide.40 Therefore, the relationship between the expression levels of tiRNA-Glu-TTC-001 and tiRNA-Lys-CTT-003 and the age of sarcoidosis requires further experimental research. We observed a significant positive correlation between the relative expression of tRF-Ser-TGA-007 and blood calcium levels. It is known that the production of calcitriol, the activity of parathyroid hormone (PTH), and sensitivity to vitamin D are altered in patients with sarcoidosis.41 Under the stimulation of interferon-γ (IFN-γ), tumour necrosis factor-α (TNF-α), interleukin-1 (IL-1), and interleukin-2 (IL-2), macrophages can spontaneously release 1, 25-dihydroxyvitamin D, further promoting the absorption of calcium in the gastrointestinal tract and bone, leading to hypercalcemia and hypercalciuria.42
Furthermore, we used bioinformatics methods to show the biological functions of the three differentially expressed tsRNAs and further reveal their targeted genes which can serve as potential biomarkers in sarcoidosis. For an advanced understanding of the intrinsic mechanisms of tsRNA in sarcoidosis, we performed GO and KEGG pathway analyses. The results showed that the target genes of tiRNA-Glu-TTC-001 were abundant in chemokine, cAMP, cGMP-PKG, and FoxO signalling pathways. Bacterial toxins and chemicals that continue to increase cAMP exert immunosuppressive effects.43,44 At the same time, high concentrations of cAMP are often used to suppress immune responses. For exogenous pathogens, such as Bacillus pertussis and Bacillus anthracis, cAMP has been proven to inhibit the activation and proliferation of T cells by increasing the concentration of intracellular cAMP, leading to the strong and continuous activation of PKA. By increasing cellular cAMP, these toxins also cause the destruction of chemokine receptor signals, thereby reducing T cell chemotaxis.43,45,46 However, recent studies showed that cAMP also plays a positive role in the immune response, and cyclic adenosine monophosphate can promote the expression of CD86,47,48 thereby promoting T cell activation. Cyclic adenosine monophosphate can also enhance the isotype conversion of B cells to IgG and IgE. In dendritic cells, the increase in cAMP triggered by PGE 2 or pharmacology has been shown to promote the expression of IL-23, which facilitates the production of Th17 cells and IL-17, and contributes to cytotoxicity. cAMP further improves T lymphocyte and Th1 cell memory.49,50 Sarcoidosis primarily occurs in an abnormal immune system that mainly involves Th17/Treg imbalance related to Th cells. Therefore, cAMP may play a role in the occurrence and development of sarcoidosis. The FoxO signalling pathway shows that sarcoidosis may be related to autophagy and other pathways. Autophagy is an auto-degradation process that is an important adaptive mechanism in response to altered cell signals or cell stress (such as nutritional stress, infection, hypoxia, and toxicity). Current evidence shows that FoxO transcription factors play multiple roles in the regulation and dysregulation of autophagy. Ryan et al used CD4Cre mouse experiments to show that Foxo1 transcriptional activity can change the responsiveness and competitive adaptability of T cells.51 Further experimental studies have shown that the difference between Foxo1 activity in regulating CD4+ T cells and Treg cells may cause these changes.
We performed ROC curve analysis of the hub genes associated with tsRNA using other sarcoidosis-related serum in the GEO database, and found that expression levels of certain hub genes were significantly elevated in sarcoidosis and displayed a certain diagnostic value for sarcoidosis (AUC > 0.7). APP is a gene that encodes an amyloid precursor protein.52 The protein is cleaved by secretase to form a series of polypeptide fragments, two of which are antimicrobial peptides that have been shown to have bactericidal and antifungal properties. Some other active peptide fragments can be combined with the acetyltransferase complex APBB1/TIP60 to promote transcriptional activation, while some of the remaining peptide fragments form the protein basis of amyloid plaques found in the brains of patients with AD. The protein encoded by PRKACB is the catalytic subunit of cAMP-dependent protein kinase (PKA) (Homo sapiens protein kinase, cAMP-dependent, catalytic beta gene, PRKACB), which affects cell proliferation and differentiation through the cAMP signalling pathway.53 ARRB2, a member of the inhibitory protein family, participates in signalling pathways related to G-protein-coupled receptors (GPCRs) and desensitises the GPCRs, thus weakening cell responses to stimuli, such as hormones, neurotransmitters, or sensory signals. In recent years, studies have found that ARRB2 can promote the migration of Th2 cells to the lungs, thereby inducing the onset of allergic asthma. NR5A1 encodes steroidogenic factor 1 (SF1).54 SF1 is a nuclear receptor composed of 461 amino acids. SF1 has four functional domains: a DNA binding domain (DBD), an auxiliary hinge region, a ligand-binding domain (LBD), and two activation domains, AF1 and AF2. SF1 is expressed in the gonads and adrenal glands during embryonic development, and controls important processes therein. Defects in this gene are one of the reasons for XY reversal. Myeloid nuclear differentiation antigen (MNDA), a human bone marrow antigen, can only be detected in the nucleus of cells of the granulocyte-monocyte lineage, and is a member of the nuclear protein family IFI200 (interferon-inducible p200 family).55 This nucleoprotein family is characterised by interferon (IFN) induction with 200 repeating amino acids, because the N-terminal pyridine domain (PYD) and the C-terminal HIN domain are also annotated as PYHIN factors. Overexpression of the PYHIN factor can induce cell cycle arrest, apoptosis, senescence, inflammation, and decrease tumour cell invasiveness. Until recently, the relationship between the above-mentioned genes and sarcoidosis has not been reported, but ARRB2 and PKACB are obviously related to the cAMP signalling pathway and have functions similar to those of the target genes predicted by KEGG.
After constructing a base complementary pairing model using RNAhybrid software, we preliminarily determined that in patients with sarcoidosis, APP, PRKACB, ARRB2, and NR5A1 may participate in the occurrence and development of sarcoidosis through immune inflammation and other related pathways, and can be used as serum biomarkers of sarcoidosis.
This study had several limitations. First, our sample size was relatively small, and the current research may not be sufficient to detect significant differences between patients and healthy controls. Second, in the analysis of clinical characteristics of patients with sarcoidosis, the clinical patient information, such as lung function, serum ACE level, 24 h urine calcium content, and treatment information, is not comprehensive. Therefore, tsRNAs have not been fully analysed with clinical information. Finally, our follow-up correlation analyses regarding tsRNA, target mRNA, and hub genes are mainly based on bioinformatics, and no experimental verification has been performed. Therefore, we cannot determine whether there is a causal relationship between the differential expression of hub genes and disease progression. Therefore, it is necessary to conduct subsequent bioinformatics analysis and experimental verification with a larger sample size in the future to understand the molecular mechanisms of these new central genes in the pathogenesis of sarcoidosis. Although we have several limitations, tsRNA is still a very meaningful indicator from a current perspective. They may be as an important clue which can provide a theoretical basis for our future work and further exploration of the pathogenesis of sarcoidosis.
We used high-throughput sequencing technology to display the tsRNA expression profile in the serum of patients with sarcoidosis and healthy controls, and predicted the target genes that may be involved in the occurrence and development of sarcoidosis. Further, we identified hub genes as a biomarker using bioinformatics and related gene databases. Our study provides the basis for future investigations on the diagnosis, treatment, and prognosis of sarcoidosis.
Conclusions
In summary, serum tsRNA, especially tiRNA-Glu-TTC-001, tiRNA-Lys-CTT-003, and tRF-Ser-TGA-007, were found to have great potential as diagnostic markers for sarcoidosis, which may be related to clinical parameters. In addition, bioinformatics analysis showed that tsRNA may be involved in the regulation of cAMP, cGMP-PKG, and FoxO signalling pathways via APP, PRKACB, ARRB2, and NR5A1. These results provide the basis for the subsequent mechanism research. It is of great clinical translational research value to explore the regulatory mechanism of tsRNA in the occurrence and development of sarcoidosis.
Data Sharing Statement
The datasets generated/analyzed for this study can be found in the Gene Expression Omnibus (GSE198490, GSE19314). Majority of data generated or analyzed during this study are included in this published article. Non-included data may be obtained from the corresponding author upon reasonable request.
GSE198490: https://www.ncbi.nlm.nih.gov/geo/query/acc.cgi?acc=GSE198490
GSE19314: https://www.ncbi.nlm.nih.gov/geo/query/acc.cgi?acc=GSE19314.
Ethics Approval and Consent to Participate
Written informed consent was obtained from patients with approval by the Research Ethics Board of the Second Affiliated Hospital of Jilin University.
Funding
This study was supported by the Technology Research Funds of Jilin Province (20190303162SF), the Medical And Health Project Funds of Jilin Province (20200708083YY, 2020SCZT019, 20191102012YY), and Disciplinary Crossing and Integration and innovation cultivation project of Jilin University (JLUXKJC2020212).
Disclosure
The authors declare no conflicts of interest in this work.
References
1. Landi C, Bargagli E, Carleo A, et al. A functional proteomics approach to the comprehension of sarcoidosis. J Proteomics. 2015;128:375–387.
2. Ahmadzai H, Huang S, Steinfort C, et al. Sarcoidosis: a state of the art review from the Thoracic Society of Australia and New Zealand. Med J Aust. 2018;208(11):499–504.
3. Mocanu A, Bogos RA, Trandafir LM, et al. The Overlap of Kidney Failure in Extrapulmonary Sarcoidosis in Children-Case Report and Review of Literature. Int J Mol Sci. 2023;24(8):54.
4. Landi C, Carleo A, Cillis G, Rottoli P. Sarcoidosis: proteomics and new perspectives for improving personalized medicine. Expert Rev Proteomics. 2018;15(10):829–835.
5. Heitzer E, Ulz P, Geigl JB. Circulating tumor DNA as a liquid biopsy for cancer. Clin Chem. 2015;61(1):112–123.
6. Borrebaeck CA. Precision diagnostics: moving towards protein biomarker signatures of clinical utility in cancer. Nat Rev Cancer. 2017;17(3):199–204.
7. Ludwig JA, Weinstein JN. Biomarkers in cancer staging, prognosis and treatment selection. Nat Rev Cancer. 2005;5(11):845–856.
8. Schwarzenbach H, Hoon DS, Pantel K. Cell-free nucleic acids as biomarkers in cancer patients. Nat Rev Cancer. 2011;11(6):426–437.
9. Bennett D, Cameli P, Lanzarone N, et al. Chitotriosidase: a biomarker of activity and severity in patients with sarcoidosis. Respir Res. 2020;21(1):6.
10. Terrington DL, Kim JW, Ravenhill G, et al. Soluble interleukin-2 receptor in exhaled breath condensate in pulmonary sarcoidosis: a cross-sectional pilot study. J Breath Res. 2020;15(1):016016.
11. Kumar P, Kuscu C, Dutta A. Biogenesis and Function of Transfer RNA-Related Fragments (tRFs). Trends Biochem Sci. 2016;41(8):679–689.
12. Yang D, Xiao F, Yuan Y, et al. The Expression Pattern of tRNA-Derived Small RNAs in Adult Drosophila and the Function of tRF-Trp-CCA-014-H3C4 Network Analysis. Int J Mol Sci. 2023;24(7):43.
13. Luan N, Wang J, Sheng B, et al. tRF-20-M0NK5Y93-induced MALAT1 promotes colon cancer metastasis through alternative splicing of SMC1A. Am J Cancer Res. 2023;13(3):852–871.
14. Gong M, Deng Y, Xiang Y, Ye D. The role and mechanism of action of tRNA-derived fragments in the diagnosis and treatment of malignant tumors. Cell Commun Signaling. 2023;21(1):62.
15. Maute RL, Schneider C, Sumazin P, et al. tRNA-derived microRNA modulates proliferation and the DNA damage response and is down-regulated in B cell lymphoma. Proc Natl Acad Sci U S A. 2013;110(4):1404–1409.
16. Fu H, Feng J, Liu Q, et al. Stress induces tRNA cleavage by angiogenin in mammalian cells. FEBS Lett. 2009;583(2):437–442.
17. Beermann J, Piccoli MT, Viereck J, Thum T. Non-coding RNAs in Development and Disease: background, Mechanisms, and Therapeutic Approaches. Physiol Rev. 2016;96(4):1297–1325.
18. Dhahbi JM, Spindler SR, Atamna H, Boffelli D, Martin DI. Deep Sequencing of Serum Small RNAs Identifies Patterns of 5’ tRNA Half and YRNA Fragment Expression Associated with Breast Cancer. Biomark Cancer. 2014;6:37–47.
19. Keam SP. tRNA-Derived Fragments (tRFs): emerging New Roles for an Ancient RNA in the Regulation of Gene Expression. Life. 2015;5(4):1638–1651.
20. Zhou Y, Hong Q, Xu W, et al. Differential expression profiling of tRNA-Derived small RNAs and their potential roles in methamphetamine self-administered rats. Front Genet. 2023;14:1088498.
21. Qian T, Yu X, Xu A, Li H, Chen W, Zhong S. tRF-20-S998LO9D inhibits endometrial carcinoma by upregulating SESN2. Epigenomics. 2022;14(24):1563–1577.
22. Zhang Y, Cai F, Liu J, et al. Transfer RNA-derived fragments as potential exosome tRNA-derived fragment biomarkers for osteoporosis. Int J Rheum Dis. 2018;21(9):1659–1669.
23. Olvedy M, Scaravilli M, Hoogstrate Y, Visakorpi T, Jenster G, Martens-Uzunova E. A comprehensive repertoire of tRNA-derived fragments in prostate cancer. Oncotarget. 2016;7(17):24766–24777.
24. Livak KJ, Schmittgen TD. Analysis of relative gene expression data using real-time quantitative PCR and the 2(-Delta Delta C(T)) Method. Methods. 2001;25(4):402–408.
25. Heid CA, Stevens J, Livak KJ, Williams PM. Real time quantitative PCR. Genome Res. 1996;6(10):986–994.
26. Larionov A, Krause A, Miller W. A standard curve based method for relative real time PCR data processing. BMC Bioinform. 2005;6:62.
27. Kim HK, Fuchs G, Wang S, et al. A transfer-RNA-derived small RNA regulates ribosome biogenesis. Nature. 2017;552(7683):57–62.
28. Karaiskos S, Naqvi AS, Swanson KE, Grigoriev A. Age-driven modulation of tRNA-derived fragments in Drosophila and their potential targets. Biol Direct. 2015;10:51.
29. Kumar P, Anaya J, Mudunuri SB, Dutta A. Meta-analysis of tRNA derived RNA fragments reveals that they are evolutionarily conserved and associate with AGO proteins to recognize specific RNA targets. BMC Biol. 2014;12:78.
30. Kuscu C, Kumar P, Kiran M, Su Z, Malik A, Dutta A. tRNA fragments (tRFs) guide Ago to regulate gene expression post-transcriptionally in a Dicer-independent manner. RNA. 2018;24(8):1093–1105.
31. Li P, Tang T, Liu T, et al. Systematic Analysis of tRNA-Derived Small RNAs Reveals Novel Potential Therapeutic Targets of Traditional Chinese Medicine (Buyang-Huanwu-Decoction) on Intracerebral Hemorrhage. Int J Biol Sci. 2019;15(4):895–908.
32. Su R, Li MM, Bhakta NR, et al. Longitudinal analysis of sarcoidosis blood transcriptomic signatures and disease outcomes. Eur Respir J. 2014;44(4):985–993.
33. Li WS, Li YL, Cao R, et al. Differential Expression and Bioinformatics Analysis of tRF/tiRNA in Endometriosis Patients. Biomed Res Int. 2022;2022:9911472.
34. Wang J, Han B, Yi Y. Expression profiles and functional analysis of plasma tRNA-derived small RNAs in children with fulminant myocarditis. Epigenomics. 2021;13:1057–1075.
35. Fang Y, Liu Y, Yan Y. Differential Expression Profiles and Function Predictions for tRFs & tiRNAs in Skin Injury Induced by Ultraviolet Irradiation. Front Cell Dev Biol. 2021;9:707572.
36. Xu C, Fu Y. Expression Profiles of tRNA-Derived Fragments and Their Potential Roles in Multiple Myeloma. Onco Targets Ther. 2021;14:2805–2814.
37. Salamo O, Mortaz E, Mirsaeidi M. Noncoding RNAs: new Players in Pulmonary Medicine and Sarcoidosis. Am J Respir Cell Mol Biol. 2018;58(2):147–156.
38. Karaiskos S, Grigoriev A. Dynamics of tRNA fragments and their targets in aging mammalian brain. F1000Res. 2016;5:65.
39. Gebetsberger J, Polacek N. Slicing tRNAs to boost functional ncRNA diversity. RNA Biol. 2013;10(12):1798–1806.
40. Bargagli E, Prasse A. Sarcoidosis: a review for the internist. Intern Emerg Med. 2018;13(3):325–331.
41. Cameli P, Caffarelli C, Refini RM, et al. Hypercalciuria in Sarcoidosis: a Specific Biomarker With Clinical Utility. Front Med. 2020;7:568020.
42. Baughman RP, Teirstein AS, Judson MA, et al. Clinical characteristics of patients in a case control study of sarcoidosis. Am J Respir Crit Care Med. 2001;164(10 Pt 1):1885–1889.
43. Paccani SR, Dal Molin F, Benagiano M, et al. Suppression of T-lymphocyte activation and chemotaxis by the adenylate cyclase toxin of Bordetella pertussis. Infect Immun. 2008;76(7):2822–2832.
44. Vang T, Torgersen KM, Sundvold V, et al. Activation of the COOH-terminal Src kinase (Csk) by cAMP-dependent protein kinase inhibits signaling through the T cell receptor. J Exp Med. 2001;193(4):497–507.
45. Paccani SR, Tonello F, Ghittoni R, et al. Anthrax toxins suppress T lymphocyte activation by disrupting antigen receptor signaling. J Exp Med. 2005;201(3):325–331.
46. Rossi Paccani S, Tonello F, Patrussi L, et al. Anthrax toxins inhibit immune cell chemotaxis by perturbing chemokine receptor signalling. Cell Microbiol. 2007;9(4):924–929.
47. Kasprowicz DJ, Kohm AP, Berton MT, Chruscinski AJ, Sharpe A, Sanders VM. Stimulation of the B cell receptor, CD86 (B7-2), and the beta 2-adrenergic receptor intrinsically modulates the level of IgG1 and IgE produced per B cell. J Immunol. 2000;165(2):680–690.
48. Kohm AP, Mozaffarian A, Sanders VM. B cell receptor- and beta 2-adrenergic receptor-induced regulation of B7-2 (CD86) expression in B cells. J Immunol. 2002;168(12):6314–6322.
49. Schnurr M, Toy T, Shin A, Wagner M, Cebon J, Maraskovsky E. Extracellular nucleotide signaling by P2 receptors inhibits IL-12 and enhances IL-23 expression in human dendritic cells: a novel role for the cAMP pathway. Blood. 2005;105(4):1582–1589.
50. Shi Q, Yin Z, Zhao B, et al. PGE2 Elevates IL-23 Production in Human Dendritic Cells via a cAMP Dependent Pathway. Mediators Inflamm. 2015;2015:984690.
51. Cheng Z. The FoxO-Autophagy Axis in Health and Disease. Trends Endocrinol Metab. 2019;30(9):658–671.
52. Jakubauskiene E, Vilys L, Peciuliene I, Kanopka A. The role of hypoxia on Alzheimer’s disease-related APP and Tau mRNA formation. Gene. 2021;766:145146.
53. Moen LV, Sener Z, Volchenkov R, et al. Ablation of the Cbeta2 subunit of PKA in immune cells leads to increased susceptibility to systemic inflammation in mice. Eur J Immunol. 2017;47(11):1880–1889.
54. Na X, Mao Y, Tang Y, et al. Identification and functional analysis of fourteen NR5A1 variants in patients with the 46 XY disorders of sex development. Gene. 2020;760:145004.
55. Bottardi S, Guieze R, Bourgoin V, et al. MNDA controls the expression of MCL-1 and BCL-2 in chronic lymphocytic leukemia cells. Exp Hematol. 2020;88:68–82 e65.
 © 2023 The Author(s). This work is published and licensed by Dove Medical Press Limited. The
full terms of this license are available at https://www.dovepress.com/terms
and incorporate the Creative Commons Attribution
- Non Commercial (unported, 3.0) License.
By accessing the work you hereby accept the Terms. Non-commercial uses of the work are permitted
without any further permission from Dove Medical Press Limited, provided the work is properly
attributed. For permission for commercial use of this work, please see paragraphs 4.2 and 5 of our Terms.
© 2023 The Author(s). This work is published and licensed by Dove Medical Press Limited. The
full terms of this license are available at https://www.dovepress.com/terms
and incorporate the Creative Commons Attribution
- Non Commercial (unported, 3.0) License.
By accessing the work you hereby accept the Terms. Non-commercial uses of the work are permitted
without any further permission from Dove Medical Press Limited, provided the work is properly
attributed. For permission for commercial use of this work, please see paragraphs 4.2 and 5 of our Terms.