")
Back to Journals » International Journal of Nanomedicine » Volume 13
Synergistic photoactivated antimicrobial effects of carbon dots combined with dye photosensitizers
Authors Dong X, Bond AE, Pan N, Coleman M, Tang Y , Sun YP, Yang L
Received 9 August 2018
Accepted for publication 3 October 2018
Published 27 November 2018 Volume 2018:13 Pages 8025—8035
DOI https://doi.org/10.2147/IJN.S183086
Checked for plagiarism Yes
Review by Single anonymous peer review
Peer reviewer comments 2
Editor who approved publication: Dr Thomas Webster
Xiuli Dong,1 Ambrose E Bond,1 Nengyu Pan,2 Montrez Coleman,2 Yongan Tang,3 Ya-Ping Sun,2 Liju Yang1
1Biomanufacturing Research Institute and Technology Enterprise, Department of Pharmaceutical Sciences, North Carolina Central University, Durham, NC, USA; 2Department of Chemistry, Laboratory for Emerging Materials and Technology, Clemson University, Clemson, SC, USA; 3Department of Mathematics and Physics, North Carolina Central University, Durham, NC, USA
Background: Carbon quantum dots (CDots) have recently been reported as a new class of visible light activated antimicrobial nanomaterials. This study reports the synergistic photoactivated antimicrobial interactions of CDots with photosensitizers on bacterial cells.
Methods: The antimicrobial effects of the CDots with surface passivation molecules 2,2'-(ethylenedioxy)bis(ethylamine) in combination with photosensitizer methylene blue (MB) or toluidine blue (TB) at various concentrations were evaluated against Escherichia coli cells with and without 1-hour visible light illumination. The broth microdilution checkerboard method and isobologram analysis were used for determining if synergistic effect existed between CDots and MB or TB.
Results: The results showed that CDots alone at a concentration of 5 µg/mL did not display antimicrobial effects, 1 µg/mL MB alone only decreased 1.86 log of viable cell numbers, but the combination treatment with 5 µg/mL CDots combined with 1 µg/mL MB completely inhibited bacteria growth, resulted in 6.2 log viable cell number reduction, suggesting synergistic interaction between the two. The antimicrobial effects of CDots/TB combination exhibited similarly synergistic effects on E. coli cells. These synergistic effects between CDots and MB or TB were further confirmed using the checkerboard microdilution methods, where the fractional inhibitory concentration index value (0.5) and the isobologram analyses. The synergistic interactions were also correlated to the increased generation of intracellular reactive oxygen species in E. coli cells upon the combination treatments of CDots/MB or CDots/TB.
Conclusion: The study demonstrated the synergistic photoactivated antimicrobial effects of CDots in combination with other photosensitizers. Such synergistic effect may open new strategies for developing highly effective antimicrobial methods.
Keywords: carbon quantum dots, photosensitizer, methylene blue, toluidine blue, reactive oxygen species, synergistic antimicrobial effect
Introduction
Bacterial infections are among the leading causes of death in the world, posting challenges to our health care systems, from prevention needs to treatment methods in hospital settings and food and water supplies, and to the global public health in general.1,2 While antibiotics are the most common treatments for these infections, the prevention and control of the transmission/spread of bacterial pathogens before infections occur are equally important. Many physicochemical methods, such as using traditional disinfectants and antiseptic techniques, are widely used in hospital and other settings for inactivating infectious pathogens. However, despite existing remedies, the increasing number of infections has caused alarms in public health, which has motivated a global search/exploration on novel alternative antimicrobial agents/methods based on new emerging technologies. Among the new technologies, alternative therapeutic strategies with action mechanisms different from traditional antibiotics and with less chance of inducing bacterial drug resistance, such as nanotechnology, micromotor technology, and photodynamic therapy (PDT),3,4 have attracted a great interest.
The newly developed carbon-based nanomaterials commonly referred to as carbon dots (CDots) have demonstrated their great potential as a new class of photoactivated antimicrobial agents. Unlike traditional nanoscale semiconductors-based photosensitizers, which typically require ultraviolet light for activation, CDots can readily be activated by visible light, thus considerably expanding the antimicrobial application to a much broader range, virtually to wherever accessible by household light/natural ambient light. CDots are small carbon nanoparticles of an average diameter of <10 nm that are functionalized with organic molecules such as those containing amino groups for effective surface passivation.5 Due to their biocompatibility and low toxicity in vitro and in vivo, CDots have been widely pursued for a broad range of promising biological applications, including biosensors, gene transmission, drug delivery, and fluorescence labeling.6 It is known that the optical absorption of CDots is associated with π-plasmon transitions in the core carbon nanoparticles of the dots, while the fluorescence emissions over the visible to near-infrared spectral region are attributed to photogenerated electrons and holes trapped at diverse surface sites and their associated radiative recombinations.7,8 These optical properties of CDots afford them with strong photodynamic effects,9,10 which have been used to kill cancer cells11 and bacterial cells under visible light illumination.12 Obviously, the photoactivated antimicrobial activity of CDots is mechanistically related to the photoinduced redox processes in CDots.12 In principle, upon the photoexcitation of CDots to induce the expected efficient charge transfer and separation, the electron–hole pairs thus formed, and the emissive excited states from their radiative recombinations could be associated with both the strong photodynamic effects and the formation of reactive oxygen species (ROS) for the observed killing of cancer cells and bacterial cells.
As related in terms of photodynamic effects, PDT is a technique that combines a nontoxic dye, namely, a photosensitizer (PS), and low-intensity visible light to produce cytotoxic species in the presence of oxygen.13 Under light illumination, the PS is excited to produce radicals and/or ROS, which kill target cells. PDT has received a considerable attention over decades as a therapy for a large variety of localized infections.14 The increasing popularity of this treatment method is largely due to its selectivity: only tissues that are simultaneously exposed to the PS, light, and oxygen are the ones subjected to the cytotoxic reactions during PDT.15 Thus, under ideal conditions, only diseased tissues are eradicated, leaving the surrounding healthy cells undamaged.15 Methylene blue (MB) and toluidine blue (TB) are phenothiazine-derived PS molecules commonly used in PDT and are considered safe on humans.16 PDT provides significant advantages over many other existing antimicrobial therapies, showing effectiveness against antibiotic-resistant pathogenic bacteria,14 as it is equally effective to kill multi-antibiotic-resistant strains as naïve strains, and that bacteria cannot readily develop resistance to PDT.13 However, PDT does not always guarantee full success as it exerts lethal effects only in cells that have taken up a sufficient amount of PS and have been exposed to adequate light doses, but such conditions are not always achieved.3 In addition, while the use of high concentrations of PS can improve the antimicrobial effects, it may increase the risk to cause side effects and harm to human health or may pose environmental safety issues if they are improperly disposed into the environment.
To overcome these issues and to achieve the high antimicrobial effects without using too high concentrations of PS, a feasible strategy is to combine two different PS drugs or one PS drug with another antimicrobial agent, especially in the case of the two components having synergistic interactions. Our previous study found that when CDots were combined with H2O2, a synergistic antimicrobial effect on Escherichia coli cells was achieved,4 and as control, the combination of CDots with Na2CO3 or AcOH did not show any synergistic effects.4 The purpose of the present study was to investigate whether the combination of photoactivated CDots with the commonly used PS dyes MB and TB could achieve a synergistic effect on the inactivation of laboratory model bacteria – E. coli cells under visible light illumination. Various factors influencing the antimicrobial effects were considered and evaluated, and the results and their relevance to mechanistic exploration are highlighted and discussed.
Materials and methods
2,2′-(ethylenedioxy)bis(ethylamine) (EDA)-CDots synthesis
EDA-CDots were synthesized following the procedure described in the previous publication.17 Briefly, commercially acquired carbon nanopowders from US Research Nanomaterials, Inc., Houston, TX, USA (2 g) were refluxed in aqueous nitric acid (8M, 200 mL) for 48 hours, followed by centrifugation at 1,000 g to discard the supernatant. The pellet was suspended in deionized water (DI-H2O), dialyzed in a membrane tubing (molecular weight cutoff ~500) against freshwater for 48 hours, and then centrifuged at 1,000 g to keep the supernatant, from which carbon nanoparticles were recovered upon the removal of water. The recovered carbon nanoparticles were refluxed in neat thionyl chloride for 12 hours, followed by the removal of excess thionyl chloride. The treated sample was mixed with carefully dried EDA (Sigma-Aldrich Co., St Louis, MO, USA) in a flask, heated to 120°C, and vigorously stirred under nitrogen protection for 3 days. The reaction mixture was cooled to room temperature, dispersed in water, and then centrifuged at 20,000 g. The supernatant was collected and dialyzed in a membrane tubing against freshwater to remove unreacted EDA and other small molecular species to obtain the EDA-CDots as an aqueous solution. The dot sample was characterized by using nuclear magnetic resonance, atomic force microscopy, transmission electron microscopy (TEM), and optical spectroscopy methods.18 The EDA-CDots were spherical nanoparticles of sizes averaging 4–5 nm in diameter. The other sample characteristics were the same as those reported in a previously published paper.18 The fluorescence quantum yield of the EDA-CDots was determined using the established relative method, namely by using a known fluorescence standard such that the absorbance values of the sample and standard are matched at the excitation wavelength and their corresponding fluorescence intensity integrations are compared. The fluorescence quantum yield of the EDA-CDots used in this study was 12% (400 nm excitation, in reference to 9,10-bis(phenylethynyl)anthracene as a fluorescence standard).
Bacterial cell treatment with CDots alone and in combination with TB or MB
Overnight-grown E. coli cells were washed twice with PBS and then suspended in PBS buffer. The treatments were performed in 96-well plates. The cells at a concentration of ~1.0×10⁶/mL were treated with CDots, MB, or TB alone or with the combination of CDots/MB or CDots/TB at various desired concentrations in the wells with a total volume of 150 μL. The plate was placed on a shaker with constant shaking under a 36-W white light bulb (10 cm above the plate) or in the dark for 1 hour.
Cell viability assessment
After the treatments, the viable cell numbers in the treated samples and controls were determined using the traditional plating method. Briefly, the cell samples were one-tenth serially diluted in PBS, and 100 μL of appropriate dilutions was surface-plated on Lysogeny Broth (LB) agar plates. After 18-hour incubation at 37°C, the colonies were counted, and the viable cell numbers were calculated as colony-forming units per milliliter (CFU/mL). Viable cell number reductions in the treated samples were obtained by comparing with the viable cell number in the controls.
Bacteria growth and fractional inhibitory concentration (FIC) index determination by a broth checkerboard method
To investigate whether there were synergistic antimicrobial interactions between CDots and MB or TB, a broth microdilution checkerboard method was used to examine bacterial growth and calculate FIC indexes.19–21 By using the CDots/MB combination as an example, the experiment was carried out as follows. In a 96-well plate, aliquots of 100 μL of E. coli cells in PBS (~1×10⁵/mL) were added to all the wells. CDots and MB solutions were then added to achieve twofold serial dilutions along the ordinate and abscissa of the plate, respectively. The final volume in each well was adjusted to 150 μL with DI-H2O. The resulting checkerboard contained various combinations of CDots and MB. Duplicate plates were used in this study. The plates were exposed to light for 1 hour, followed by incubation at 37°C for 19 hours. OD595 values were measured before and after incubation by using SpectraMax M5 multidetection reader (Molecular Devices LLC, Sunnyvale, CA, USA). The increase in optical density at 595 nm (OD595 value) after incubation indicated bacterial growth. The same procedure was used for the experiments of CDots/TB treatments on E. coli cells.
The minimal inhibitory concentration (MIC) of each reagent was defined as the lowest concentration that completely inhibited the bacterial growth. The FIC index (ΣFIC) was calculated by using the following equation: ΣFIC = FIC of agent A + FIC of agent B, where FIC of agent A = (MIC of agent A in combination)/(MIC of agent A alone), and FIC of agent B = (MIC of agent B in combination)/(MIC of agent B alone). The interaction between the two combined agents was determined by the resulting ΣFIC values as follows: ΣFIC ≤0.5 indicates synergy, 0.5< ΣFIC ≤0.75 indicates partial synergy, 0.75< ΣFIC ≤1.0 indicates additive, 1.0< ΣFIC <4.0 indicates indifference, and ΣFIC ≥4.0 indicates antagonism.20,22,23
Isobologram analysis for synergistic effect
To graphically visualize the interactions of CDots and MB or TB on bacterial treatment, an isobologram was plotted by using the FIC values on the x–y coordinate, in which the concentrations of CDots and MB or TB were used in the x-axis and y-axis, respectively. The MIC value of each reagent alone was joined by a line on the graph. The MIC values in the CDots/MB or CDots/TB combinations were also plotted and joined by another line. The relative position of the two lines was used to determine the interaction between CDots and MB or TB. An interaction is considered synergistic if the line of the combined reagents’ MICs lies below the line of individual MICs, while the interaction is antagonistic if the line of the combined reagents’ MICs lies above the line of individual MICs. When the two lines are at the same position, the reagents are considered as with no interaction.23,24
Intracellular ROS measurement
The experimental design for the intracellular ROS tests was the same as the one for cell viability assessment, except that the ROS tests were performed in 0.85% NaCl solution instead of PBS. The cells were treated with 5 μg/mL CDots combined with various concentrations of MB or TB or with MB or TB alone under visible light for 1 hour. After the treatments, the cells were collected in 1.5-mL centrifuge tubes, followed by centrifugation at 8,800 rpm for 7 minutes to remove the reaction reagents. Aliquot of 320 μL of 10 μM dihydrorhodamine 123 (DHR 123) was then added to each tube. DHR 123 is a probe widely used to detect several reactive species. DHR is oxidized to rhodamine 123 which is highly fluorescent around 536 nm when excited at about 500 nm. After the addition of DHR 123, the tubes were vigorously vortexed and incubated at the room temperature for 40 minutes. After centrifugation, supernatant removal, and a rinse with 0.85% NaCl, the cells were resuspended in 320 μL 0.85% NaCl solution. The fluorescence (excitation/emission, 500/535 nm) of each sample was measured using the SpectraMax M5 microplate reader. The increased fluorescence at 535 nm in CDots-treated samples compared with the controls indicated the generation of ROS by CDots treatments.
TEM imaging
Untreated and treated cells were examined by TEM imaging. To prepare cell samples for TEM, overnight-grown E. coli cells were washed twice with PBS and then treated with 5 μg/mL CDots alone, 0.1 μg/mL TB or MB alone, or the combination of 5 μg/mL CDots with 0.1 μg/mL TB or MB, with the illumination of the light-emitting diode light for 1 hour. The cells were then collected by the removal of supernatant after centrifugation, followed by a fixation step using 2% glutaraldehyde and 3.7% formaldehyde at 4°C overnight. After removing the fixative solution, the samples were washed three times with DI-H2O and suspended in 200 μL DI-H2O. A drop of 5 μL of each sample was placed on a formvar/carbon TEM grid (Electron Microscopy Sciences, Hatfield, PA, USA) for 30 minutes. All the grids were gently wicked to remove the excess fluid using filter paper. TEM images were acquired using a FEI Tecnai™ G2 Twin TEM (Hillsboro, OR, USA) in the Shared Materials Instrumentation Facility at Duke University.
Statistical analyses
All microbial tests were performed three to five times. Statistical analyses were performed by using the general linear model procedure of the SAS System 9.2 (SAS Institute Inc., Cary, NC, USA). A significant difference was considered at P<0.05.
Results and discussion
Antibacterial effects of CDots in combination with MB or TB
Figure 1A shows the antimicrobial effects of EDA-CDots alone on E. coli cells, when the cells were treated with 2.5, 25, 100, and 300 μg/mL EDA-CDots for 1 hour under visible light illumination or in the dark. Obviously, when the concentration of CDots was low (2.5 μg/mL), no antimicrobial effect was observed either with light or in the dark. However, EDA-CDots exhibited considerably effective antibacterial activity under visible light illumination when the dot concentrations increased to 25, 100, and 300 μg/mL, achieving viable cell number reductions of 1.92, 2.67, and 3.53 log, respectively, while treatments in the dark with the same concentrations of EDA-CDots resulted in no substantial antibacterial effect (<0.5 log), reaffirming CDots’ visible light-activated antimicrobial activity as found in previous studies.12
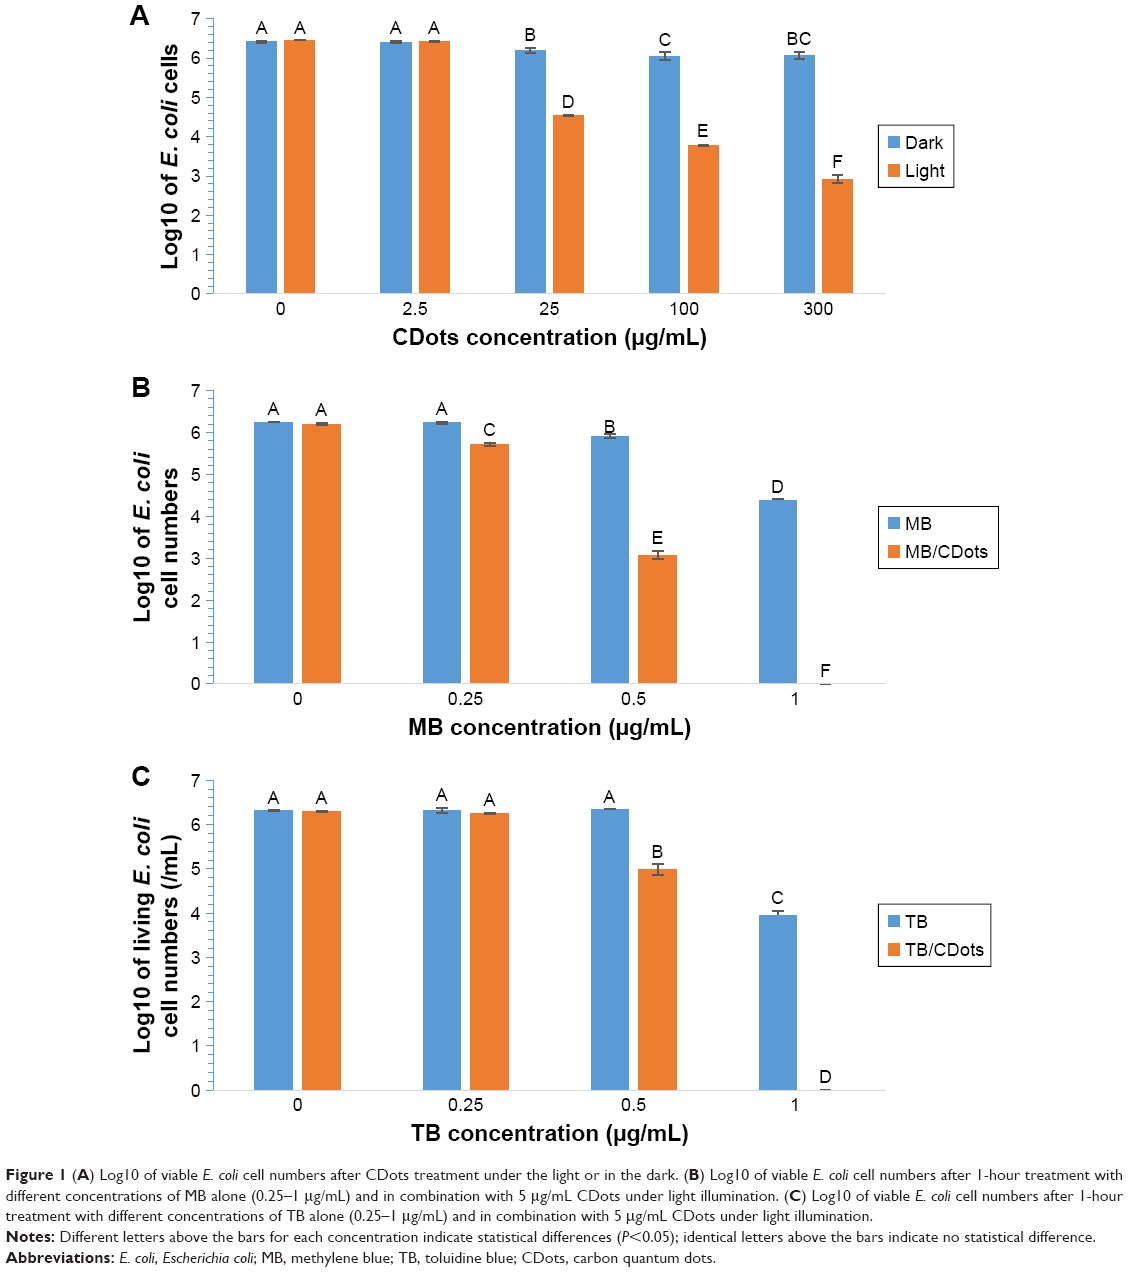 | Figure 1 (A) Log10 of viable E. coli cell numbers after CDots treatment under the light or in the dark. (B) Log10 of viable E. coli cell numbers after 1-hour treatment with different concentrations of MB alone (0.25–1 μg/mL) and in combination with 5 μg/mL CDots under light illumination. (C) Log10 of viable E. coli cell numbers after 1-hour treatment with different concentrations of TB alone (0.25–1 μg/mL) and in combination with 5 μg/mL CDots under light illumination. |
Figure 1B shows the antibacterial effects of MB alone and in combination with CDots under visible light illumination on E. coli cells. MB is an effective PS. In the action of its photoactivated antimicrobial activity, MB is accumulated in the cells. The subsequent exposure of MB-filled cells to visible light of the appropriate wavelength excites MB and contributes to the generation of singlet oxygen and other ROS, leading to oxidative damage and cell death.25 As shown in Figure 1B, while the treatment with 0.25 μg/mL MB alone did not perceivably kill E. coli cells, the treatments with MB at higher concentrations of 0.5 and 1 μg/mL significantly killed E. coli cells (P<0.05), achieving viable cell reductions by 0.33 and 1.86 log, respectively. However, the treatments with MB at these concentrations combined with 5 μg/mL CDots significantly enhanced the antibacterial efficiency, even though 5 μg/mL CDots alone at this treatment condition exhibited no antimicrobial effect. As shown in Figure 1B, the MB/CDots combination treatments resulted in the viable cell number reductions of ~0.5, 3.1, and 6.2 log. Especially, the MB/CDots combination treatments at the MB concentration of 0.5 and 1 μg/mL enhanced the antibacterial activity to 2.8 log and 4.4 log, respectively, compared with the corresponding treatments with MB alone. Noticeably, the combination treatment with 1 μg/mL MB/5 μg/mL CDots completely inactivated the cells in the samples.
TB is a cationic phenothiazine dye that has been well studied as an antibacterial PS and has been demonstrated to be safe to normal human tissues and cells.26 Its mechanism of antimicrobial function is similar to MB, producing free radicals and singlet oxygen, resulting in bacterial cell membrane and DNA damage. TB with PDT has been proven to be effective to kill both community-associated methicillin-resistant Staphylococcus aureus (MRSA) and health care-associated MRSA and has been considered as a potential method for the treatment of drug-resistant bacterial infections.27 Here, we examined the photoactivated antimicrobial effects of TB alone and CDots/TB on E. coli cells. Figure 1C showed the antibacterial effect of TB alone and the combination of TB with 5 μg/mL CDots. The results showed similar patterns as those of MB and MB/CDots combinations. With the treatment of TB alone, 1 μg/mL TB started to exhibit its antibacterial effect, with 1-hour treatment under visible light resulting in ~2.4 log reduction of viable E. coli cells, while TB at concentrations <1 μg/mL did not kill cells at the given condition. In the combination treatments, the presence of 5 μg/mL CDots significantly improved the overall antimicrobial effects (P<0.05), such as the combinations with 0.5 and 1 μg/mL TB under 1-hour light illumination resulting in ~1.3 and ~6.3 log viable cell reduction, respectively (Figure 1C). Especially, the combination of 1 μg/mL TB with 5 μg/mL CDots actually led to a complete inactivation of the cells in the samples (~6.3 log), which increased the viable cell reduction by 3.9 log compared with the TB treatment alone (~2.4 log). In a separated experiment with another CDots/TB combination, CDots at the concentration of 25 μg/mL combined with 0.25 μg/mL TB under the light also achieved a complete inactivation of the cells in the samples (~6.3 log). These observations suggested that TB and CDots also had significant synergistic antimicrobial effects.
Synergistic antimicrobial effects between CDots and MB or TB using the broth microdilution checkerboard method
To further confirm the synergistic antimicrobial interactions between CDots and MB or TB observed in plating tests, the broth microdilution checkerboard method was used to examine the inhibition of the growth of E. coli cells treated by CDots, MB, and TB individually and by their combinations, in terms of measuring OD value changes after overnight incubation (~19 hours). The MICs of CDots, MB, and TB obtained in the checkerboard method were used to calculate the FIC indexes. It is worth to note that the treatments in the checkerboard method were performed in LB broth, different from the abovementioned experiments performed in PBS for viable cell determination. Nevertheless, both tests served the same purpose of examining the synergistic effects between CDots and MB or TB. Using MB and CDots/MB treatments as an example, Table 1 shows the experimental setup and growth measurement in the checkerboard test for treatments with MB alone at concentrations of 0.5, 1, 2, 4, 8, 16, and 32 μg/mL, CDots alone at concentrations of 2.5, 5, 10, 20, 40, 80, and 160 μg/mL, and the CDots/MB combinations at different concentrations. Cell growth was indicated by the measured OD values, and no growth was indicated by “−” symbol. As shown in Table 1, the MICs of MB and CDots in the broth were 32 and 160 μg/mL, respectively. The MICs of the CDots/MB combinations, which completely inhibited the growth of E. coli cells, were 2.5/16, 40/8, and 80/4 (CDots/MB, μg/mL). These MICs were used to calculate the FIC index.
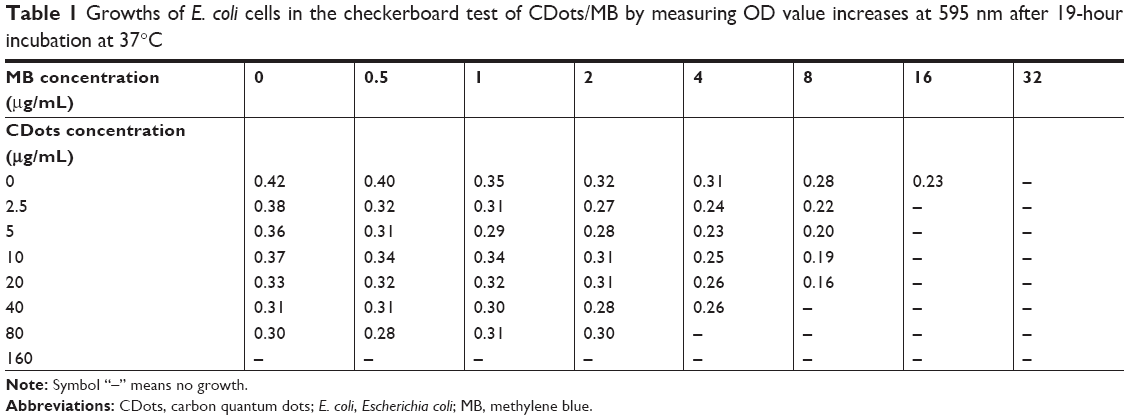 | Table 1 Growths of E. coli cells in the checkerboard test of CDots/MB by measuring OD value increases at 595 nm after 19-hour incubation at 37°C |
Table 2 shows the calculated FIC index, which further confirmed the synergistic or partial synergistic relation in the CDots/MB combination treatments. The combination of 8 μg/mL MB with 40 μg/mL CDots had the FIC index value of 0.5, which indicated the synergistic effect between the two components. The FIC index values of the other CDots/MB combinations were ranging from 0.51 to 0.63, indicating partial synergistic interactions between MB and CDots.
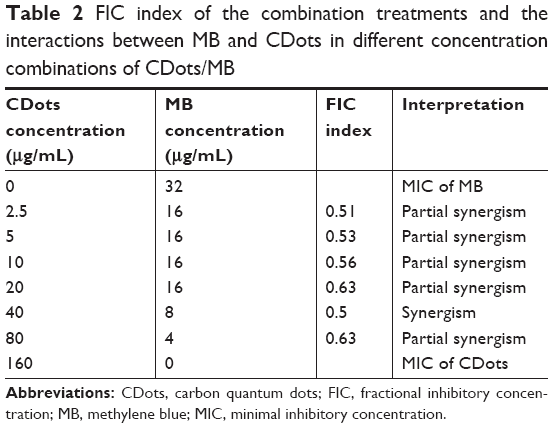 | Table 2 FIC index of the combination treatments and the interactions between MB and CDots in different concentration combinations of CDots/MB |
The synergistic effect of CDots/MB combination on E. coli cells was also proved by isobologram analysis (Figure 2), where the line of MICs in CDots/MB combination lies below the line of MICs from MB and CDots treatment alone, indicating the synergistic relations between MB and CDots. The interactions between TB and CDots at different concentration combinations were similar to those between MB and CDots based on the results from the broth microdilution checkerboard method, also indicating synergistic relations.
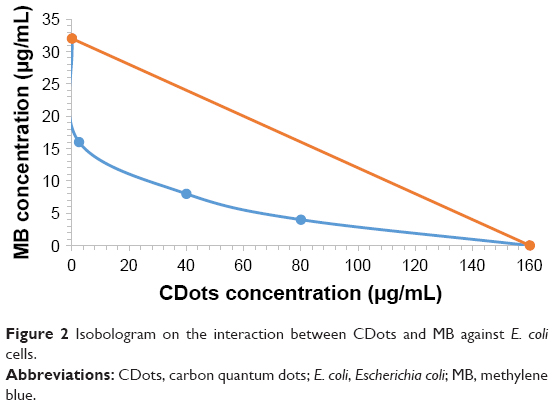 | Figure 2 Isobologram on the interaction between CDots and MB against E. coli cells. |
Both MB and TB have been reported to exhibit synergistic or additive interactions when combining with other PS drugs or nanoparticles in PDT treatments to various cells. For example, the combination treatment of MB and cadmium telluride (CdTe) quantum dots under light improved the cell killing efficiency on HepG2 and HeLa cancerous cells compared with the treatment by MB or CdTe quantum dots alone.28 Giroldo et al29 reported that MB treatment with laser (684 nm) on Candida albicans also increased the cells’ membrane permeabilization, which could be related to damages in the plasma membranes of the cells. Similarly, synergistic or additive interactions in the combinations with other PS drugs or nanoparticles in PDT treatments were often achieved. For example, Barra et al3 employed the combination of antibiotic gentamicin and 5-aminolevulinic acid, which is a prodrug and can be converted into the natural PS protoporphyrin IX, to treat biofilms by PDT. Their results showed that the combination treatment was effective to reduce 20% of the cell viabilities of the strong resistant S. aureus bacteria in biofilms, displaying higher antimicrobial efficacies than the treatment by gentamicin alone. Tian et al30 loaded a PS drug, Chlorin e6 (Ce6), onto polyethylene glycol (PEG)-functionalized graphene oxide (GO) via supramolecular π–π stacking. The obtained GO–PEG–Ce6 complex exhibited excellent water solubility and the capability to generate cytotoxic singlet oxygen under light excitation for PDT and remarkably improved photodynamic destruction effect on cancer cells compared with the use of free Ce6 only.30
In the case of CDots/MB combinations, the synergistic effect must be a result from mutual enhancement between the two components. At one side, it was possible that MB increased bacterial cell membrane permeabilization, leading to more CDots accumulation in the cells, as the enhanced permeability of cancer cells by PS drugs leading to the leaky tumor vasculature and poor lymphatic drainage or tumor tissues was reported.31,32 On the other side, the presence of CDots might also increase MB uptake into bacterial cells by increasing MB’s solubility, as there were studies suggesting that some nanomaterials could significantly enhance the solubility of PS drugs in water through hydrophilic properties or as a carrier, thus increasing their cellular uptake.31 It is known that ionic dyes tend to form aggregates in diluted solutions, resulting in dimer formation and further affecting their coloristic and photophysical properties.33 In the case of CDots/MB, the presence of CDots might reduce the tendency of MB aggregation and increase its solubility. In summary, among the possible mechanisms of synergistic antimicrobial interactions of MB and CDots are the following: 1) With the presence of MB, CDots could penetrate bacteria more easily and play antimicrobial roles in the cells that suffered damages of intracellular enzymes due to the oxidative stress induced by MB; 2) CDots might increase the solubility of MB and lead to more MB accumulation in cells for enhanced photodynamic effects; and 3) the combination of MB and CDots could increase the ROS production in cells, as observed in the ROS test below.
Intracellular ROS production upon CDots/MB or CDots/TB treatment
As it is widely accepted that photosensitizers act through the generation of ROS to kill cells, we further examined the intracellular ROS generation in the treatments with CDots, MB, or TB individually and the combination of CDots/MB or CDots/TB. Figure 3A shows the ROS generation by 5 μg/mL CDots alone and MB alone at concentrations of 0.5, 1, and 2.5 μg/mL, as well as the combinations of 5 μg/mL CDots with MB at each concentration. The cells treated with 5 μg/mL CDots alone showed no significant difference (P>0.05) in ROS production, compared with the untreated control samples. It is most likely that CDots had a low 1O2 quantum yield at the concentration used, which is not surprising as many semiconductor quantum dots have a low ROS generation efficiency.34 For example, graphene quantum dots passivated with PEG derivatives could generate 1O2 upon irradiation with blue light, but with a quantum yield.35 Other studies reported that cadmium selenide (CdSe) quantum dots with 65% emission quantum yield had only 5% 1O2 generation quantum yield, whereas silicon Pc (Pc4) PS had a 1O2 generation efficiency of 43%.15,36 In this study, the ROS productions in the cells by MB treatments were efficient and significantly increased (P<0.05) with increasing MB concentrations (Figure 3A). When the MB concentration was increased from 0.5 to 1 and to 2.5 μg/mL, the net fluorescence intensity signals for the detection of ROS (subtract the background, 35.3) were 55.7, 139.6, and 337.4, respectively. However, the ROS productions in the cells upon CDots/MB treatments were significantly higher than those by MB alone at the corresponding MB concentrations (P<0.05), with the corresponding net fluorescence intensity signal for the ROS detection of 137.7, 237.9, and 492.9, respectively. The results indicated that the presence of 5 μg/mL CDots in the CDots/MB combination treatments of cells significantly increased the intracellular ROS production (P<0.05), most likely associated with the synergistic interactions between CDots and MB discussed above.
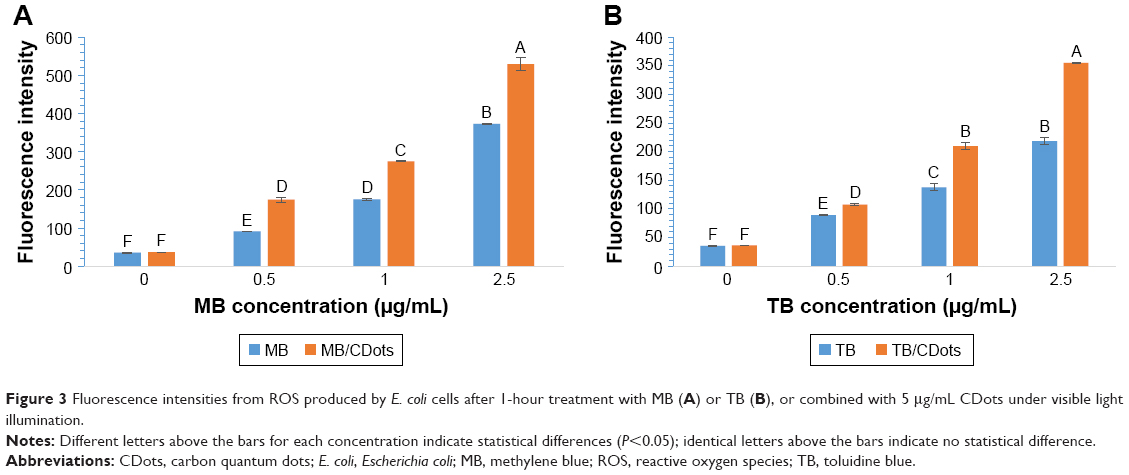 | Figure 3 Fluorescence intensities from ROS produced by E. coli cells after 1-hour treatment with MB (A) or TB (B), or combined with 5 μg/mL CDots under visible light illumination. |
The ROS tests were also performed on E. coli cells treated with TB alone and the CDots/TB combination (Figure 3B). The results showed a similar pattern to that in the comparison between the MB alone and the CDots/MB combination, with again the CDots/TB treatments being significantly more efficient for ROS production in the cells compared with the treatments of TB alone (P<0.05). For example, the fluorescence intensity for the detection of ROS in cell in the treatment with 2.5 μg/mL TB was 218.2, while the fluorescence signal increased to 355.2 in the treatment with CDots/TB. The increases in ROS generation by the combination treatments again indicated that CDots improved the activities of MB and TB during the light treatment.
Among the three possible mechanisms discussed above for the observed synergistic effects, the one based on significant increases in the intracellular ROS production is likely associated with excited state energy transfers between CDots and MB or TB, more specifically due to the overlap between the optical absorbance spectrum of the dye PS and the emission spectrum of the CDots. Similar effects in other PS–fluorescent nanomaterials combinations have been reported and discussed in the literature.15,37,38 For example, Samia et al15 studied the interaction between CdSe quantum dots and Pc4 PS. Their results indicated that Pc4 could be directly activated at the excitation wavelengths between 550 and 630 nm. In the conjugates of CdSe quantum dots with Pc4, the excitation of CdSe quantum dots at 488 nm to yield emissions centered at 682 nm to be absorbed by Pc4, namely, that CdSe quantum dots in the conjugates facilitated indirect excitation of Pc4 via energy transfers, in addition to the direct excitation, for enhanced ROS generation.15 Martynenko et al38 produced stable water-soluble complexes of zinc selenide/zinc sulfide quantum dots with Ce6 and found that the complexes had ~50% intracomplex fluorescence resonance energy transfer from the quantum dots to Ce6, leading to significantly enhanced PDT effects on cancer cells. Other studies demonstrated that scintillation nanoparticles such as LaF3:Tb3+ could be used to activate photosensitizers to generate 1O2 through energy transfers from the donor LaF3:Tb3+ to the acceptor PS.37 The CDots/MB and CDots/TB in this study are conceptually and likely mechanistically similar to the quantum dots/PS systems, such that the EDA-CDots as energy donor could effectively absorb blue–green light for broad fluorescence emissions across the visible spectrum, which could be coupled with the absorption of the acceptor MB or TB in the treatments of the cells. The net results were thus more effective photon-harvesting by MB and TB for higher ROS productions, combined with the other two possible synergistic effect mechanisms, for the killing of bacterial cells.
TEM imaging
Figure 4 shows the TEM images of untreated E. coli cells and the cells treated with CDots, TB, MB alone and those treated with the combination of CDots with MB or TB. The images indicated that the untreated cells were typically rod-shaped with intact cell walls, while all treated cells were thinner than and not as full as the untreated ones. While the cells treated with CDots alone only had slight changes in their morphologies, the cells after treated with TB or MB alone or combined with 5 μg/mL CDots changed their morphologies significantly, and cell sizes were smaller than that of the untreated cells. However, ultrastructural alterations in the treated cells were unable to be examined by these images, and high-resolution thin-slice section TEM imaging and other analytical assays for oxidative damage that impair the structure and function of the cell membrane would be necessary for further study of CDots and the combination treatment action mechanisms.
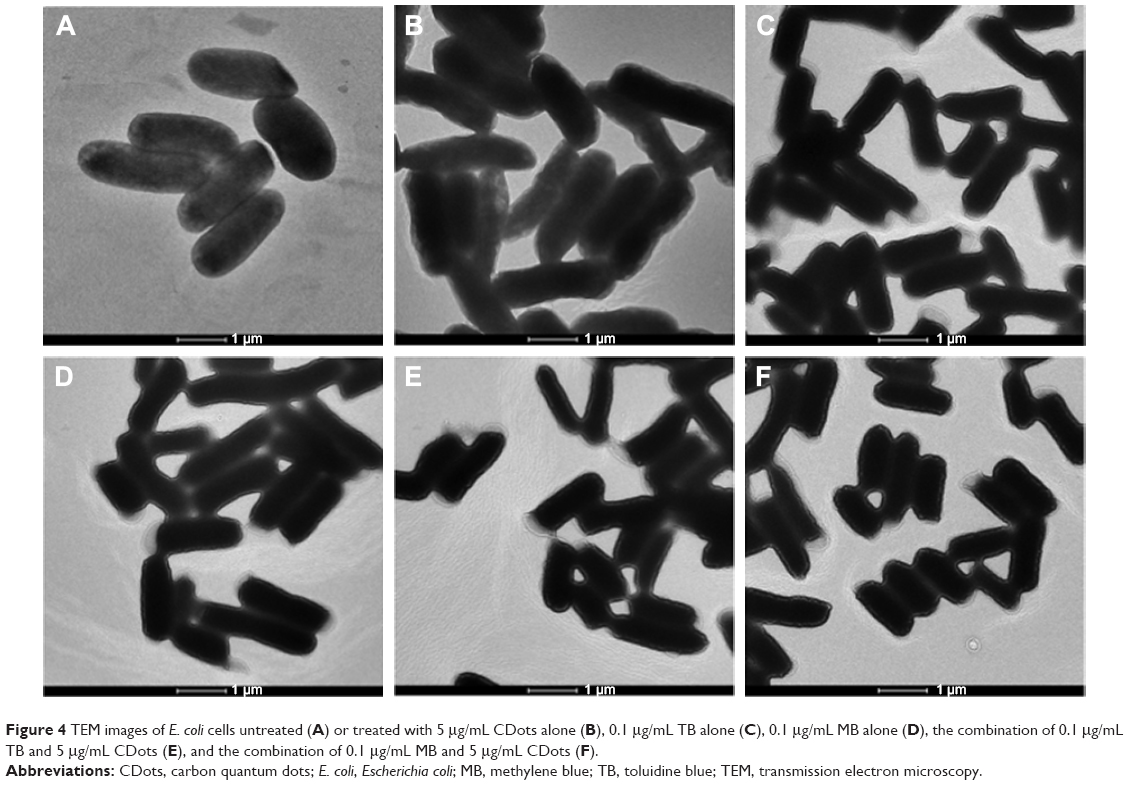 | Figure 4 TEM images of E. coli cells untreated (A) or treated with 5 μg/mL CDots alone (B), 0.1 μg/mL TB alone (C), 0.1 μg/mL MB alone (D), the combination of 0.1 μg/mL TB and 5 μg/mL CDots (E), and the combination of 0.1 μg/mL MB and 5 μg/mL CDots (F). |
Conclusion
The reported study demonstrated that the combination of CDots with MB or TB resulted in synergistic antimicrobial effects under visible light illumination, namely, that CDots at a given concentration did not exhibit antimicrobial effects on E. coli cells, nor did they generate detectable intracellular ROS, but their combination with the PS MB or TB exhibited potent antimicrobial activities against E. coli cells, which were not found either with MB or with TB alone at the corresponding concentrations. The obviously significant synergistic effects could be attributed to the mutual interactions between the two components that enhance the actions of each component. The observed synergistic effects could also be correlated with the significantly increased intracellular ROS productions in the E. coli cells in the CDots/MB or CDots/TB combination treatments. The combination treatments with the major synergistic effects may represent a feasible strategy for enhanced antibacterial activities in treating bacterial infections or environmental samples.
Acknowledgment
This research was supported by the National Science Foundation Grants DMR# 1701399 to Liju Yang and Yongan Tang; and DMR#1701424 to Ya-Ping Sun; and the National Institute of Health Grant R15GM114752 to Liju Yang, Yongan Tang and Ya-Ping Sun.
Disclosure
The authors report no conflicts of interest in this work.
References
Joller N, Weber SS, Müller AJ, et al. Antibodies protect against intracellular bacteria by Fc receptor-mediated lysosomal targeting. Proc Natl Acad Sci U S A. 2010;107(47):20441–20446. | ||
Mu H, Tang J, Liu Q, Sun C, Wang T, Duan J. Potent antibacterial nanoparticles against biofilm and intracellular bacteria. Sci Rep. 2016;6:18877. | ||
Barra F, Roscetto E, Soriano AA, et al. Photodynamic and antibiotic therapy in combination to fight biofilms and resistant surface bacterial infections. Int J Mol Sci. 2015;16(9):20417–20430. | ||
Dong X, Awak MA, Tomlinson N, Tang Y, Sun YP, Yang L. Antibacterial effects of carbon dots in combination with other antimicrobial reagents. PLoS One. 2017;12(9):e0185324. | ||
Huang G, Chen X, Wang C, et al. Photoluminescent carbon dots derived from sugarcane molasses: synthesis, properties, and applications. RSC Adv. 2017;7(75):47840–47847. | ||
Tuerhong M, Xu Y, Yin X-B. Review on Carbon Dots and Their Applications. Chinese Journal of Analytical Chemistry. 2017;45(1):139–150. | ||
Cao L, Meziani MJ, Sahu S, Sun YP. Photoluminescence properties of graphene versus other carbon nanomaterials. Acc Chem Res. 2013;46(1):171–180. | ||
Liu JH, Cao L, LeCroy GE, et al. Carbon “Quantum” dots for fluorescence labeling of cells. ACS Appl Mater Interfaces. 2015;7(34):19439–19445. | ||
Luo PG, Sahu S, Yang ST, et al. Carbon “quantum” dots for optical bioimaging. J Mater Chem B. 2013;1(16):2116–2127. | ||
Pjg L, Yang F, Yang ST, et al. Carbon-based quantum dots for fluorescence imaging of cells and tissues. Rsc Adv. 2014;4(21):10791–10807. | ||
Juzenas P, Kleinauskas A, George Luo P, Sun Y-P. Photoactivatable carbon nanodots for cancer therapy. Appl Phys Lett. 2013;103(6):063701. | ||
Meziani MJ, Dong X, Zhu L, et al. Visible-light-activated bactericidal functions of carbon “Quantum” dots. ACS Appl Mater Interfaces. 2016;8(17):10761–10766. | ||
Hamblin MR, Hasan T. Photodynamic therapy: a new antimicrobial approach to infectious disease? Photochem Photobiol Sci. 2004;3(5):436–450. | ||
Dai T, Tegos GP, Zhiyentayev T, Mylonakis E, Hamblin MR. Photodynamic therapy for methicillin-resistant Staphylococcus aureus infection in a mouse skin abrasion model. Lasers Surg Med. 2010;42(1):38–44. | ||
Samia AC, Chen X, Burda C. Semiconductor quantum dots for photodynamic therapy. J Am Chem Soc. 2003;125(51):15736–15737. | ||
Prochnow EP, Martins MR, Campagnolo CB, Santos RC, Villetti MA, Kantorski KZ. Antimicrobial photodynamic effect of phenothiazinic photosensitizers in formulations with ethanol on Pseudomonas aeruginosa biofilms. Photodiagnosis Photodyn Ther. 2016;13:291–296. | ||
Dong X, Moyer MM, Yang F, Sun YP, Yang L. Carbon dots’ antiviral functions against noroviruses. Sci Rep. 2017;7(1):519. | ||
LeCroy GE, Sonkar SK, Yang F, et al. Toward structurally defined carbon dots as ultracompact fluorescent probes. ACS Nano. 2014;8(5):4522–4529. | ||
Cleveland J, Montville TJ, Nes IF, Chikindas ML. Bacteriocins: safe, natural antimicrobials for food preservation. Int J Food Microbiol. 2001;71(1):1–20. | ||
Dong X, Awak MA, Tomlinson N, Tang Y, Sun YP, Yang L. Antibacterial effects of carbon dots in combination with other antimicrobial reagents. PLoS One. 2017;12(9):e0185324. | ||
Asok Kumar K, Mazumdar K, Dutta NK, Karak P, Dastidar SG, Ray R. Evaluation of synergism between the aminoglycoside antibiotic streptomycin and the cardiovascular agent amlodipine. Biol Pharm Bull. 2004;27(7):1116–1120. | ||
Cai Y, Wang R, Pei F, Liang BB. Antibacterial activity of allicin alone and in combination with beta-lactams against Staphylococcus spp. and Pseudomonas aeruginosa. J Antibiot (Tokyo). 2007;60(5):335–338. | ||
Roks G, Deckers CL, Meinardi H, Dirksen R, van Egmond J, van Rijn CM. Effects of polytherapy compared with monotherapy in antiepileptic drugs: an animal study. J Pharmacol Exp Ther. 1999;288(2):472–477. | ||
Badaoui Najjar M, Kashtanov D, Chikindas ML. Epsilon-poly-L-lysine and nisin A act synergistically against Gram-positive food-borne pathogens Bacillus cereus and Listeria monocytogenes. Lett Appl Microbiol. 2007;45(1):13–18. | ||
Harris F, Pierpoint L. Photodynamic therapy based on 5-aminolevulinic acid and its use as an antimicrobial agent. Med Res Rev. 2012;32(6):1292–1327. | ||
Nastri L, Donnarumma G, Porzio C, et al. Effects of toluidine blue-mediated photodynamic therapy on periopathogens and periodontal biofilm: in vitro evaluation. Int J Immunopathol Pharmacol. 2010;23(4):1125–1132. | ||
Tseng SP, Hung WC, Chen HJ, et al. Effects of toluidine blue O (TBO)-photodynamic inactivation on community-associated methicillin-resistant Staphylococcus aureus isolates. J Microbiol Immunol Infect. 2017;50(1):46–54. | ||
Rakovich A, Savateeva D, Rakovich T, et al. CdTe Quantum Dot/Dye hybrid system as photosensitizer for photodynamic therapy. Nanoscale Res Lett. 2010;5(4):753–760. | ||
Giroldo LM, Felipe MP, de Oliveira MA, Munin E, Alves LP, Costa MS. Photodynamic antimicrobial chemotherapy (PACT) with methylene blue increases membrane permeability in Candida albicans. Lasers Med Sci. 2009;24(1):109–112. | ||
Tian B, Wang C, Zhang S, Feng L, Liu Z. Photothermally enhanced photodynamic therapy delivered by nano-graphene oxide. ACS Nano. 2011;5(9):7000–7009. | ||
Hong EJ, Choi DG, Shim MS. Targeted and effective photodynamic therapy for cancer using functionalized nanomaterials. Acta Pharm Sin B. 2016;6(4):297–307. | ||
Maeda H, Wu J, Sawa T, Matsumura Y, Hori K. Tumor vascular permeability and the EPR effect in macromolecular therapeutics: a review. J Control Release. 2000;65(1–2):271–284. | ||
Antonov L, Gergov G, Petrov V, Kubista M, Nygren J. UV-Vis spectroscopic and chemometric study on the aggregation of ionic dyes in water. Talanta. 1999;49(1):99–106. | ||
Ge J, Lan M, Zhou B, et al. A graphene quantum dot photodynamic therapy agent with high singlet oxygen generation. Nat Commun. 2014;5:4596. | ||
Markovic ZM, Ristic BZ, Arsikin KM, et al. Graphene quantum dots as autophagy-inducing photodynamic agents. Biomaterials. 2012;33(29):7084–7092. | ||
He J, Larkin HE, Li YS, et al. The synthesis, photophysical and photobiological properties and in vitro structure-activity relationships of a set of silicon phthalocyanine PDT photosensitizers. Photochem Photobiol. 1997;65(3):581–586. | ||
Liu Y, Chen W, Wang S, Joly AG. Investigation of water-soluble x-ray luminescence nanoparticles for photodynamic activation. Appl Phys Lett. 2008;92(4):043901. | ||
Martynenko IV, Kuznetsova VA, Orlova AO, et al. Chlorin e6-ZnSe/ZnS quantum dots based system as reagent for photodynamic therapy. Nanotechnology. 2015;26(5):055102. |
 © 2018 The Author(s). This work is published and licensed by Dove Medical Press Limited. The full terms of this license are available at https://www.dovepress.com/terms.php and incorporate the Creative Commons Attribution - Non Commercial (unported, v3.0) License.
By accessing the work you hereby accept the Terms. Non-commercial uses of the work are permitted without any further permission from Dove Medical Press Limited, provided the work is properly attributed. For permission for commercial use of this work, please see paragraphs 4.2 and 5 of our Terms.
© 2018 The Author(s). This work is published and licensed by Dove Medical Press Limited. The full terms of this license are available at https://www.dovepress.com/terms.php and incorporate the Creative Commons Attribution - Non Commercial (unported, v3.0) License.
By accessing the work you hereby accept the Terms. Non-commercial uses of the work are permitted without any further permission from Dove Medical Press Limited, provided the work is properly attributed. For permission for commercial use of this work, please see paragraphs 4.2 and 5 of our Terms.