Back to Journals » Cancer Management and Research » Volume 12
Synergistic Anticancer Effects of Gemcitabine with Pitavastatin on Pancreatic Cancer Cell Line MIA PaCa-2 in vitro and in vivo
Authors Chen YH, Chen YC, Lin CC, Hsieh YP, Hsu CS, Hsieh MC
Received 31 January 2020
Accepted for publication 13 May 2020
Published 17 June 2020 Volume 2020:12 Pages 4645—4665
DOI https://doi.org/10.2147/CMAR.S247876
Checked for plagiarism Yes
Review by Single anonymous peer review
Peer reviewer comments 2
Editor who approved publication: Dr Eileen O'Reilly
Ya-Hui Chen,1,2 Yi-Chun Chen,1 Chi-Chen Lin,3– 5 Yao-Peng Hsieh,6– 8 Chien-Sheng Hsu,9 Ming-Chia Hsieh1,10
1Diabetes Research Laboratory, Department of Research, Changhua Christian Hospital, Changhua, Taiwan; 2Institute of Biochemistry and Biotechnology, Chung Shan Medical University, Taichung, Taiwan; 3Institute of Biomedical Science, National Chung-Hsing University, Taichung, Taiwan; 4Department of Health and Nutrition, Asia University, Taichung, Taiwan; 5Department of Medical Research, China Medical University Hospital, Taichung, Taiwan; 6Division of General Internal Medicine, Department of Internal Medicine, Changhua Christian Hospital, Changhua, Taiwan; 7School of Medicine, Kaohsiung Medical University, Kaohsiung, Taiwan; 8School of Medicine, Chung Shan Medical University, Taichung, Taiwan; 9Frontier Molecular Medical Research Center in Children, Changhua Christian Children Hospital, Changhua, Taiwan; 10Intelligent Diabetes Metabolism and Exercise Center, China Medical University Hospital, Taichung, Taiwan
Correspondence: Ming-Chia Hsieh Email [email protected]
Background: Pancreatic ductal adenocarcinoma (PDAC) is a highly aggressive malignancy with an overall 5-year survival rate of 9.3%, and this malignancy is expected to become the second leading cause of cancer-related death by 2030. Gemcitabine resistance develops within weeks of PDAC patient’s chemotherapeutic initiation. Statins, including pitavastatin, have been indicated to have anticancer effects in numerous human cancer cell lines. Thus, in this study, we hypothesized that a combination of gemcitabine and pitavastatin may have a greater anticancer effect than gemcitabine alone on the human pancreatic carcinoma cell line MIA PaCa-2.
Methods: The anticancer effects of gemcitabine with pitavastatin were evaluated using human MIA PaCa-2 cell line in vitro and in vivo Balb/c murine xenograft tumor model. Cell viability was assessed with CCK-8, and cell migration was stained by crystal violet. Cell cycle distribution, apoptosis and mitochondrial membrane potential were examined by flow cytometry. Activation of drug transporters (hENTs, hCNTs), intracellular drug activating (dCK) and inhibition of inactivating enzymes (RRMs) pathways were assessed by Western blotting analysis. Molecular mechanisms and signaling pathways of apoptosis, necrosis and autophagy also were assessed by Western blotting.
Results: We observed that gemcitabine and pitavastatin synergistically suppressed the proliferation of MIA PaCa-2 cells through causing sub-G1 and S phase cell cycle arrest. Activation of apoptosis/necrosis was confirmed by annexin V/propidium iodide double staining, which showed increasing levels of active caspase 3, cleaved poly(ADP-ribose) polymerase and the RIP1–RIP3–MLKL complex. Moreover, gemcitabine–pitavastatin-mediated S phase arrest downregulated cyclin A2/CDK2 and upregulated p21/p27 in MIA PaCa-2 cells. Furthermore, this combination improved drug cellular metabolism pathway, mitochondria function and activated autophagy as part of the cell death mechanism. In vivo, gemcitabine-pitavastatin effectively inhibited tumor growth in a nude mouse mode of Mia PaCa-2 xenografts without observed adverse effect.
Conclusion: Combined gemcitabine–pitavastatin may be an effective novel treatment option for pancreatic cancer.
Keywords: synergistic anticancer, gemcitabine, pitavastatin, pancreatic cancer, MIA PaCa-2
Introduction
Pancreatic ductal adenocarcinoma (PDAC) is a highly treatment-refractory cancer and is expected to become the second leading cause of cancer-related death in the United States by 2030.1 Based on Surveillance, Epidemiology, and End Results (SEER) Program data obtained from 2009 to 2015, all stages of pancreatic cancer have an overall 5-year survival rate of only 9.3%. Based on these data, it is estimated that 56,770 people will be diagnosed with pancreatic cancer and 45,750 people will die of this disease in 2019.2 Due to the lack of any effective screening method or biomarker for early diagnosis, usually, only 15%–20% of PDAC patients are able to undergo surgical resection, and approximately 90% of patients develop distant metastasis.3,4 However, thus far, numerous large randomized trials have indicated that PDAC patients with adjuvant- or neoadjuvant chemotherapy, immunotherapy to radiation therapy results showed that outcomes remain dismal.5–7 Therefore, new therapeutic agents or treatment strategies are required.
Gemcitabine (GEM), a deoxycytidine analog, exerts its cytotoxic effects mainly by inhibiting DNA synthesis (S phase) and inducing cell apoptosis. This drug has been widely used as an anticancer chemotherapeutic agent for various tumors both in vitro and in vivo, such as non–small-cell lung, bladder, breast, ovarian, and head and neck cancers.8–10 In 1997, Burris et al showed that GEM was superior to 5-fluorouracil (5-FU) in patients with advanced pancreatic cancer, with improvements to the overall survival rate and clinical benefit response. Subsequently, GEM became the first-line standard therapy for patients with pancreatic cancer.11 However, several studies have found that most patients develop GEM resistance within weeks of chemotherapy initiation, it was associated with drug transporters (hENTs, hCNTs), intracellular drug activating (dCK) and inactivating enzymes (CDA) and competitive DNA synthesis (RRMs) to active GEM cellular metabolism pathways.12–14 Thus, understanding the underlying reasons for GEM resistance is crucial for developing potential combination therapies or for replacing GEM as the gold standard for pancreatic cancer.
Inhibitors of 3-hydroxy-3-methylglutaryl coenzyme A (HMG-CoA) reductase, specifically statins, have been commonly used for treating hypercholesterolemia in clinical settings. Additionally, several researchers have revealed that statins can inhibit proliferation, invasion, and angiogenesis while inducing apoptosis and autophagy in various tumor cell types and animal models, including lung, breast, prostate, colorectal, and pancreatic cancers, as well as melanoma and lymphoma.15,16 Recent in vitro and in vivo studies have indicated that a novel function of pitavastatin (Pita) is its ability to inhibit cancer cell growth.17,18 In 2017, de wolf et al identified Pita as a potential treatment strategy for drug-resistant ovarian cancer, and its anticancer effect was mediated by inhibiting hydroxymethylglutarate coenzyme-A reductase (HMGCR),19 and they also indicated that combining Pita with zoledronic acid or dacarbazine resulted in synergistic cytotoxicity in ovarian or melanoma cells.20,21 In addition, Pita was demonstrated to have anticancer activity against pancreatic cancer cells, with the greatest reductions in cell viability, tumor spheroid growth, and colony formation.22 Therefore, additional comprehensive studies of Pita’s potential as anticancer therapy are warranted, but the exact molecular mechanisms remain mostly unknown. According to recent clinical trials results indicated that GEM combined cisplatin or capecitabine were significantly increased overall survival 6 month and 25.5 to 28 months (P=0.032) compared with GEM alone in the treatment of pancreatic cancer.23,24 Thus, in this study, we investigated whether GEM combined with Pita similar also has a greater anticancer effect than GEM alone, and we evaluated the underlying mechanisms of this combined treatment. We also investigated the proapoptotic effects of GEM and Pita combined treatment on pancreatic cancer cells and examined the possible mechanisms underlying their proapoptotic effects both synergistically and individually.
Materials and Methods
Cell Line and Culture
The human pancreatic adenocarcinoma (PA) cell line MIA PaCa-225 was obtained from BCRC (Bioresource Collection and Research Center, Taiwan; Derived from ATCC; ATCC number: CRL-1420) and was cultured in Dulbecco’s modified Eagle’s medium (DMEM, BioConcept, Amimed, Allschwil, Switzerland) supplemented with 10% fetal bovine serum (Hyclone, Logan, UT, USA) and 2.5% horse serum (Thermo Fisher Scientific, Waltham, MA, USA) at 37 °C in a humidified 5% CO2 chamber.
Cell Viability Assays and Chou–Talalay Analysis
Cell viability assays were performed using Cell Counting Kit-8 (CCK-8, Dojindo Molecular Technologies, Inc., Rockville, MD, USA) according to the manufacturer’s instructions. Briefly, cells were seeded in a 24-well plate (5 × 10⁴/well) in DMEM and were treated with Pita (Cayman Chemical, Ann Arbor, MI, USA) and GEM (Cayman Chemical) after 24 h. The cells were treated with Pita and GEM concentrations ranging from 100 to 500 nmol/L. After 48 h, 10 μL CCK-8 solution was added to each well, and the cells were incubated at 37 °C for 1 h. Absorbance at 450 nm was measured using a microplate reader (FLUOstar Galaxy, BMG LABTECH, Ortenberg, Germany). The interaction between GEM and Pita was calculated using CalcuSyn Software (Biosoft, Ferguson, MO, USA, and Cambridge, UK) through the Chou–Talalay method.26 CalcuSyn combination indices (CIs) can be interpreted as follows: CI < 1 indicates synergism, CI > 1 indicates antagonism, and average CI of 1 indicates additivity. In some experiments, the cells were pretreated with various inhibitors, such as Z-Val-Ala-Asp-fluoromethylketone (z-VAD-fmk, an inhibitor of pan-caspase, 5 µM, BioVision, Inc., Milpitas, CA, USA), necrostatin-1 (Nec-1, an inhibitor of RIP1, 20 µM, Enzo Life Science Inc., Farmingdale, NY, USA), and bafilomycin A1 (Baf-A1, an inhibitor of autophagy, 2 nM, Sigma-Aldrich, St. Louis, MO, USA) before GEM and Pita treatment.
Cell Cycle and Apoptosis Analysis
Cell cycle and apoptosis analyses were performed using an EZCell™ Cell Cycle Analysis Kit (BioVision, Inc.) and an FITC Annexin V Apoptosis Detection Kit (BD Biosciences, San Diego, CA, USA), respectively, according to the manufacturer’s instructions. MIA PaCa-2 cells were seeded in 6-well plates at 1×10⁶ cells/well and were treated with the indicated concentrations of GEM and Pita (0.25 μM GEM, 0.5 μM GEM, 0.5 μM Pita, 0.25 μM GEM+0.5 μM Pita, 0.5 μM GEM+ 0.5 μM Pita). After 48 h, the cells were collected and fixed with cold 70% ethanol and stored at −20 °C until analysis through flow cytometry. Before analysis, the cells were centrifuged and were washed with cold phosphate-buffered saline (PBS). Subsequently, the cells were stained with 20 μg/mL propidium iodide (PI, BioVision, Inc.) and were incubated in the dark for 30 min for analysis. For apoptosis and necrotic cell death analyses through double staining with FITC annexin V and PI, the cells were stained with 5 μL each of FITC annexin V and PI and were incubated for 15 min in the dark. Finally, the stained cells were analyzed using a Cytomics FC 500 flow cytometer (Beckman Coulter, Indianapolis, IN, USA).
Migration Assay
The assay was performed in transwell system (8.0 micron pore size PET; BD Biosciences). MIA Paca-2 cells (2×10⁴) in serum-free medium (300 μL DMEM medium without FBS) and seeded into the upper transwell chamber (24-well insert), and filled the lower transwell chambers with 700 μL DMEM medium containing 10% FBS. Cells were allowed to migrate for 48 h in the medium with indicated concentrations of GEM and/or Pita (0.25 μM GEM, 0.5 μM GEM, 0.5 μM Pita, 0.25 μM GEM+0.5 μM Pita, 0.5 μM GEM+ 0.5 μM Pita). At the end of treatment, the non-migrated cells were removed from the upper surface by scraping with a wet cotton swab. The filter was fixed with 3.7% formalin for 2 min, 100% methanol for 20min and stained with 0.1% crystal violet (Sigma-Aldrich, St. Louis, MO, USA) for 20 min at room temperature. The photograph was using Olympus BX61 microscope at100× magnification (Tokyo, Japan), and eight random fields were selected.
Mitochondrial Membrane Potential Measurement
The mitochondrial membrane potential (∆ѱm) was analyzed using a JC-1 Mitochondrial Membrane Potential Detection Kit (Biotium, Inc., Fremont, CA, USA). The cells were cultured in a 6-well plate (1×10⁶ cells/well) and were treated with the indicated concentrations of GEM and Pita (0.25 μM GEM, 0.5 μM GEM, 0.5 μM Pita, 0.25 μM GEM+0.5 μM Pita, 0.5 μM GEM+ 0.5 μM Pita). Briefly, the cells were stained with 500 μL 1X JC-1 reagent working solution at 37 °C for 15 min in 5% CO2. The cells were centrifuged for 5 min at 400×g and were resuspended in PBS. Subsequently, the cells were analyzed using an FC 500 flow cytometer (Beckman Coulter). The mitochondria-containing red JC-1 aggregates in healthy cells were detectable at 585/590 nm, and the green JC-1 monomers in apoptotic cells were detectable at 510/527 nm.
Immunoblot Analysis and Quantification
Tumor cells were seeded in a 10-cm dish plate at a density of 2 ×cells/dish, and the medium was replaced with fresh culture medium containing the indicated concentrations of GEM and Pita (0.25 μM GEM, 0.5 μM GEM, 0.5 μM Pita, 0.25 μM GEM+0.5 μM Pita, 0.5 μM GEM+ 0.5 μM Pita). The cells were lysed in RIPA buffer (20–188, Millipore), and protein concentrations were measured using a BCA protein assay kit (Thermo Fisher Scientific, Inc.). Samples (30 μg protein) were incubated at 95 °C for 10 min, separated on 10%–12% (w/v) SDS-PAGE, and transferred to 0.2 µM PVDF membranes (Bio-Rad, CA, USA). The membranes were probed with antibodies against polyclonal anti-ENT1 (NBP1-50508; 1:1000; Novus Biologicals, CO, USA), polyclonal anti-CNT (NBP2-29615; 1:1000; Novus Biologicals), polyclonal anti-PCNA (GTX100539; 1:1000; GeneTex), polyclonal anti-DCK (NBP2-16108; 1:1000; Novus Biologicals), polyclonal anti-RRM2 (NBP1-31661; 1:1000; Novus Biologicals), monoclonal anti-Bcl-2 (#15071; 1:1000; Cell Signaling, MA, USA), monoclonal anti-Nix (#12396; 1:1000; Cell Signaling), monoclonal anti-Bax (#5023; 1:1000; Cell Signaling), monoclonal anti-cytochrome c (#11940; 1:1000; Cell Signaling), monoclonal anti-caspase-9 (#9508; 1:1000; Cell Signaling), monoclonal anti-cleaved caspase-3 (#9664; 1:1000; Cell Signaling), monoclonal anti-PARP (#9532; 1:1000; Cell Signaling), monoclonal anti-cyclin A2 (#4656; 1:1000; Cell Signaling), monoclonal anti-CDK2 (#2546; 1:1000; Cell Signaling), monoclonal anti-P27 Kip1 (#3686; 1:1000; Cell Signaling), monoclonal anti-P-62 (#88588; 1:1000; Cell Signaling), polyclonal anti-LC3A/B (#4108; 1:1000; Cell Signaling), monoclonal anti-P21Cip1 (GTX629543; 1:1000; GeneTex, Inc., CA, USA), polyclonal anti-RIP3 (GTX107574; 1:1000; GeneTex), polyclonal anti-RIP1 (GTX111074; 1:1000; GeneTex), monoclonal anti-MLKL (ab187091; 1:1000; Abcam, Cambridge, UK), MitoProfile Total OXPHOS rodent antibody cocktail (ab110413; 1:800; Abcam) and mouse anti-GAPDH (ab9484; 1:1000; Abcam) at 4 °C overnight. Specific bands were obtained using an enhanced chemiluminescence reagent (ECL, Millipore, Billerica, MA, USA), and densitometry was performed using Fusion-Capt Advanced FX7 software, version 16.08a (Labtech International, Inc., Vilber Lourmat, France).
Xenograft Tumor Model
The animal protocols and facilities were reviewed and approved by the Institutional Animal Care and Ethical Review Committee of National Chung Hsing University, Taiwan (IACUC Approval No: 107–009, approval data Feb.12, 2018). The animals were housed in the animal research facilities of the school and were maintained under the care of the facility staff, according to the guidelines of the Animal Ethics committee. Mice procedures were designed and done according with highest humane, scientific, and ethical principles. All surgery was performed under CO2 chamber euthanasia, and all efforts were made to minimize suffering. Six-week-old Balb/c female nude mice were purchased from the National Laboratory Animal Center (Taipei, Taiwan). MIA PaCa-2 cells were mixed with Matrigel (BD Biosciences) at a 1:1 ratio. Cells (5×10⁶) were subcutaneously injected into the right flanks of each mouse. After the tumor size was approximately 10 mm3 (day 10), mice were randomly divided into four groups: vehicle control group [10% DMSO + 90% glyceryl trioctanoate (Sigma-Aldrich)]; Pita group (5 mg/kg, dissolved in DMSO and glyceryl trioctanoate (10:90 v/v), once every 3 days, intraperitoneally); GEM group (100 mg/kg, dissolved in DMSO and glyceryl trioctanoate (10:90 v/v), once every 3 days, intraperitoneally); and the combination group (first day treatment of 5 mg/kg Pita, followed by second day treatment of 100 mg/kg GEM, administered once every 3 days, intraperitoneally). Mice were treated each time with an i.p. injection using 100 μL total volumes. The mice physical conditions were also carefully observed daily. Tumor volume and mouse body weight were measured using an electronic vernier caliper. Tumor volume was calculated using the following formula: Volume = length × width × width/2, and was averaged (mean ± standard error of mean). After 40 days, mice were sacrificed with a CO2 chamber, and their tumors were extracted for tissue analysis and weighed.
Immunohistochemistry
Fresh tumors tissue were fixed in 4% formaldehyde for 24 h, paraffin-embedded, and sectioned (at ~6 μM). Sections were treated with boiling ddH2O for antigen retrieving, 10 min. Endogenous peroxidase activity was inhibited with 3% H2O2 for 10 min at room temperature, and sections were then stained with antibodies against monoclonal anti-Ki67 (#12202; 1:400; Cell Signaling) and monoclonal anti-cleaved caspase-3 (#9664; 1:100; Cell Signaling), at 37°C for 3 h, followed by OneStep Polymer HRP-conjugated anti-mouse/rat/rabbit IgG secondary antibody (GTX83398; GeneTex) for 30 min at room temperature and then visualized using a colorimetric method (DAB kit; GTX30939; GeneTex). Nuclei were counterstained with hematoxylin and photographed using an Olympus BX61 microscope (Tokyo, Japan).
Statistical Analysis
Each experiment and assay was performed at least three times, and data are presented as mean ± standard deviation (SD). Statistical analyses were performed using the Student’s t-test and P < 0.05 was considered significant.
Results
GEM Combined with Pita Synergistically Inhibit Cell Viability, Migration, Proliferation and Improve GEM Uptake and GEM Resistance
To explore potential interactions between statins and traditional chemotherapies for the treatment of PDAC, the combination of GEM and Pita was assessed for its anticancer effects in the human MIA PaCa-2 cell line in vitro. MIA PaCa-2 cells were treated with various concentrations of GEM and Pita for 48 h. GEM and Pita significantly inhibited MIA PaCa-2 cell viabilities in a dose-dependent manner. Compared with the vehicle control, the cell viability were determined to be approximately 53.1%, 50.3% and 33.6% after GEM (0.1, 0.25 and 0.5 µM) treatment; moreover, 88.4%, 84.6% and 56.7% after Pita (0.1, 0.25 and 0.5 µM) treatment. The combination of GEM with Pita also significantly inhibited cell viabilities at the indicated concentrations, particularly 0.5 µM Pita combined with 0.25 or 0.5 µM GEM (18.1% vs 16.7%, respectively), and the combined treatment was more effective in inhibiting cell viability than GEM or Pita monotherapy, respectively (approximately 82%–84% inhibition efficiency, Figure 1A). Similarly, CI analysis also indicated that the interaction between GEM and Pita was synergistic for promoting cell death, and that 0.5 µM Pita with 0.25 or 0.5 µM GEM had stronger synergistic effects on MIA PaCa-2 cells. The CI ranged between 0.1 and 0.3, indicating strong synergism (Figure 1B). We also used migration assay to examine the effects of GEM and Pita on cancer cells metastasis processes and found that 0.25 or 0.5 µM GEM and 0.5 µM Pita were able to reduce MIA PaCa-2 cells migration capability; 0.25 or 0.5 µM GEM combined with 0.5 µM Pita were more significantly effective in inhibiting MIA PaCa-2 cells migration compared to the GEM or Pita monotherapy (Figure 1C). To further investigate the combinatorial effects of GEM and Pita on cell proliferation, GEM uptake and GEM chemoresistance, we measured the expression of PCNA (cell proliferation marker), GEM uptake-mediated nucleoside transporter hENT1 and hCNT3, GEM resistance-related proteins deoxycytidine kinase (dCK) and ribonucleotide reductase M2 subunit (RRM2) in MIA PaCa-2 cells by using Western blotting. The GEM combined with Pita could significant downregulate the PCNA protein expression, and the combined treatment with GEM and Pita not only significantly increased hENT1 and hCNT3 expressions but also showed markedly reduced dCK expression and increased RRM2 expression to improve GEM uptake and GEM resistance for pancreatic cancer treatment (Figure 1D and E, P ˂ 0.05). Based on these findings, we focused on exploring interactions between GEM and Pita.
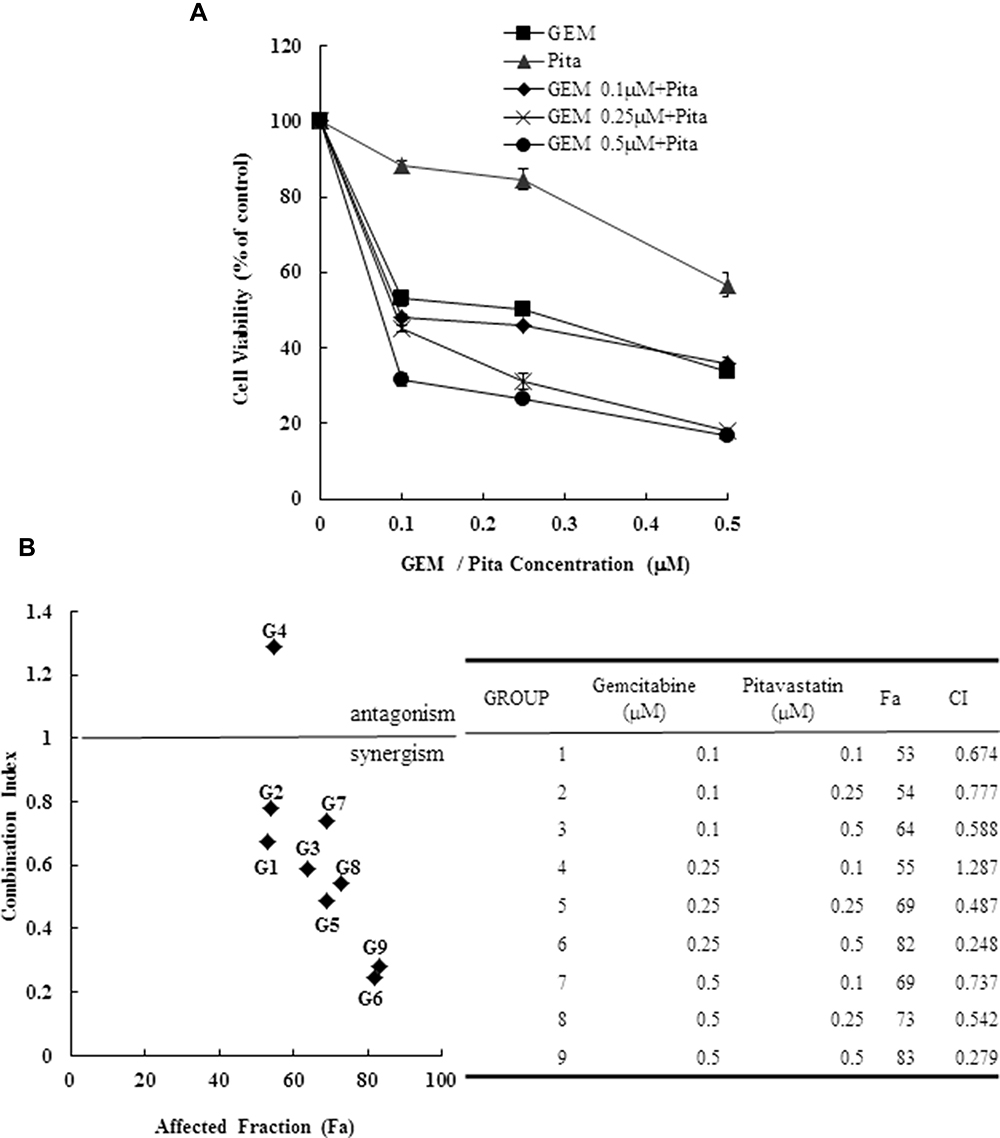 |
Figure 1 Continued. |
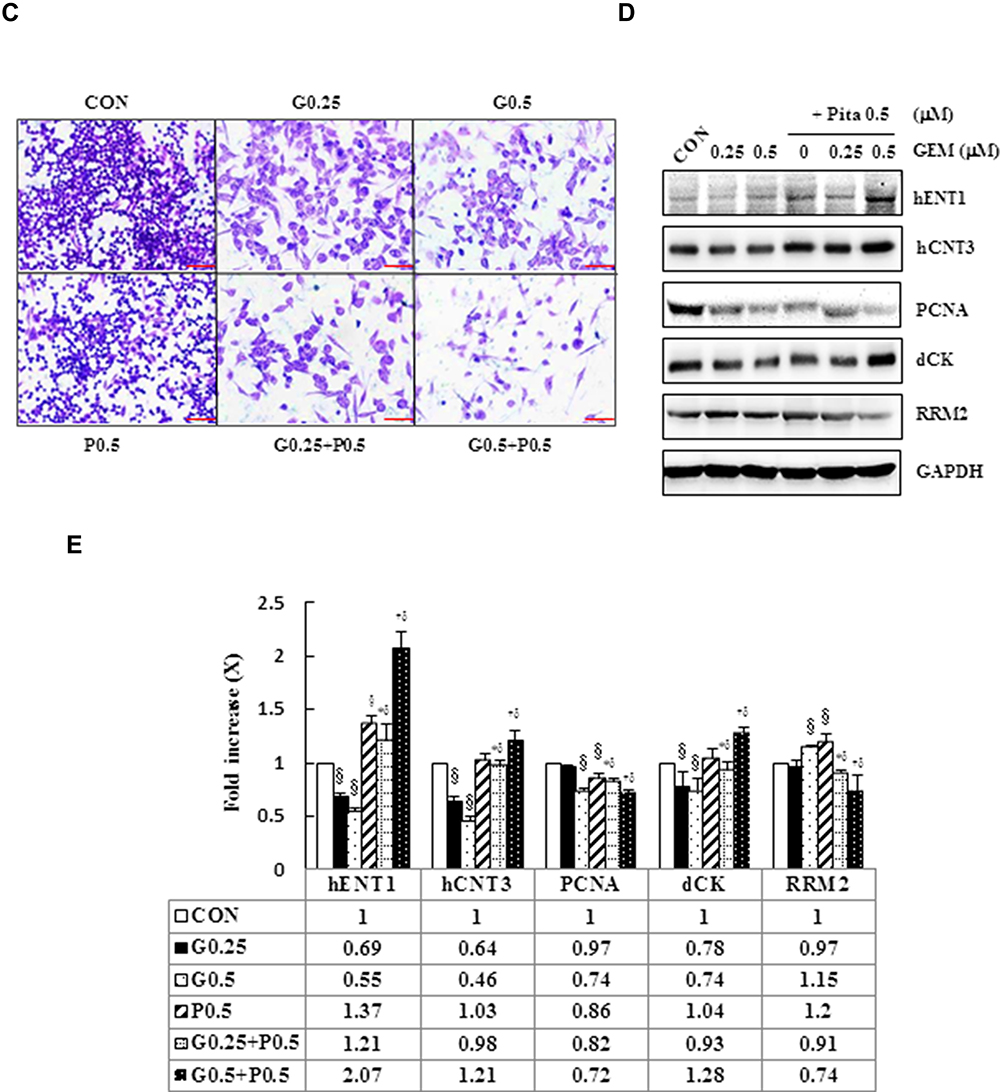 |
Figure 1 Cytotoxicity of combination GEM and Pita chemotherapy. (A) MIA PaCa-2 cells were cultured with increasing doses of GEM and Pita (0.1–0.5 μM) alone or in combination for 48 h. Then, the percentage of surviving cells in relation to the control was determined using CCK-8. Significant dose-dependent cell death was induced by GEM and Pita monotreatment. The combination of GEM + Pita showed enhanced additive cytotoxic effects for MIA PaCa-2 cells. (B) The CIs of GEM in combination with Pita were calculated using Chou–Talalay analyses; CI of < 1 indicates synergy, CI of >1 indicates antagonism, and an average CI of 1 is additive. Treatment with 0.25 μM GEM and 0.1 μM Pita resulted in antagonistic effects, whereas other combinations of varying drug concentrations had synergistic effects; 0.5 μM Pita combined with 0.25 μM or 0.5 μM GEM therapy had strong synergistic effects and at higher affected fractions of MIA PaCa-2 cells. (C) Cell migration analysis showing reduced MIA PaCa-2 cell migration capability treated with 0.25 μM or 0.5 μM GEM, 0.5 μM Pita, or their combination for 48 h compared with the untreated control group. Magnification 100×, bar = 100 μm. (D) Representative Western blot for hENT1, hCNT3, PCNA, dCK and RRM2 showing the expression of GEM uptake, cell proliferation and GEM resistance-related proteins in the MIA PaCa-2 cells treated with different doses of GEM and Pita for 48 h. GAPDH served as a loading control. (E) Significantly increased hENT1, hCNT3, dCK protein expressions and decreased PCNA, RRM2 protein expressions were detected in the GEM–Pita combination treatment compared with other groups. The density for the control group was set at 1; Values are means ± SD from three replicates. §, *, † and δ represent significant difference p-values, P ˂ 0.05, compared to the only CON, G0.25- or G0.5- or P0.5-treated group. Abbreviations: GEM, gemcitabine; Pita, pitavastatin; CCK-8, cell counting kit-8; CIs, combination indices; hENT1, human equilibrative nucleoside transporter 1; hCNT3, human concentrative nucleoside transporter 3; PCNA, proliferating cell nuclear antigen; dCK, deoxycytidine kinase; RRM2, ribonucleotide reductase subunit M2. |
GEM and Pita Induce Sub-G1 Phase and S Phase Cell Cycle Arrest
We next investigated whether GEM- or Pita-mediated decreases in the viability of human MIA PaCa-2 cells were due to cell cycle arrest. We first determined the cell cycle status of MIA PaCa-2 cells after treatment with 0.25 or 0.5 µM GEM and Pita for 48 h. Cell cycle distribution analysis results showed that GEM and Pita inhibited cell cycle progression by arresting the cells in the sub-G1 and S phases, increasing the percentage of the cells in the sub-G1 phase from 3.1% ± 0.7% (untreated cells) to 13.2% ± 1.5% (0.25 µM GEM) to 14.7% ± 0.8% (0.5 µM GEM) and to 11.0% ± 1.4% (0.5 µM Pita), and fewer cells were arrested in the G0/G1 phase. Simultaneously, the percentage of the cells in the S phase increased from 5.1% ± 0.3% (untreated cells) to 16.2% ± 1.2% (0.25 µM GEM) to 18.5% ± 1.4% (0.5 µM GEM) and to 13.4% ± 1.0% (0.5 µM Pita), and fewer cells were arrested in the G2/M phase. The percentage of the cells with combined GEM and Pita treatment that were arrested in the sub-G1 and S phases was significantly higher (19.8% ± 0.8% vs 19.5% ± 1.0% in 0.25 µM GEM + 0.5 µM Pita group; 19.8% ± 2.6% vs 19.6% ± 1.7% in 0.5 µM GEM+0.5 µM Pita group) than the percentage of the cells treated with GEM or Pita alone (P < 0.05, Figure 2). Taken together, these data strongly suggest that treatment with GEM or Pita alone not only induced sub-G1 phase arrest to stimulate cell death but also caused the cells to be arrested in the S phase, thereby suppressing the proliferation of MIA PaCa-2 cells, and that treatment with both GEM and Pita further enhanced cell death and inhibited cell proliferation.
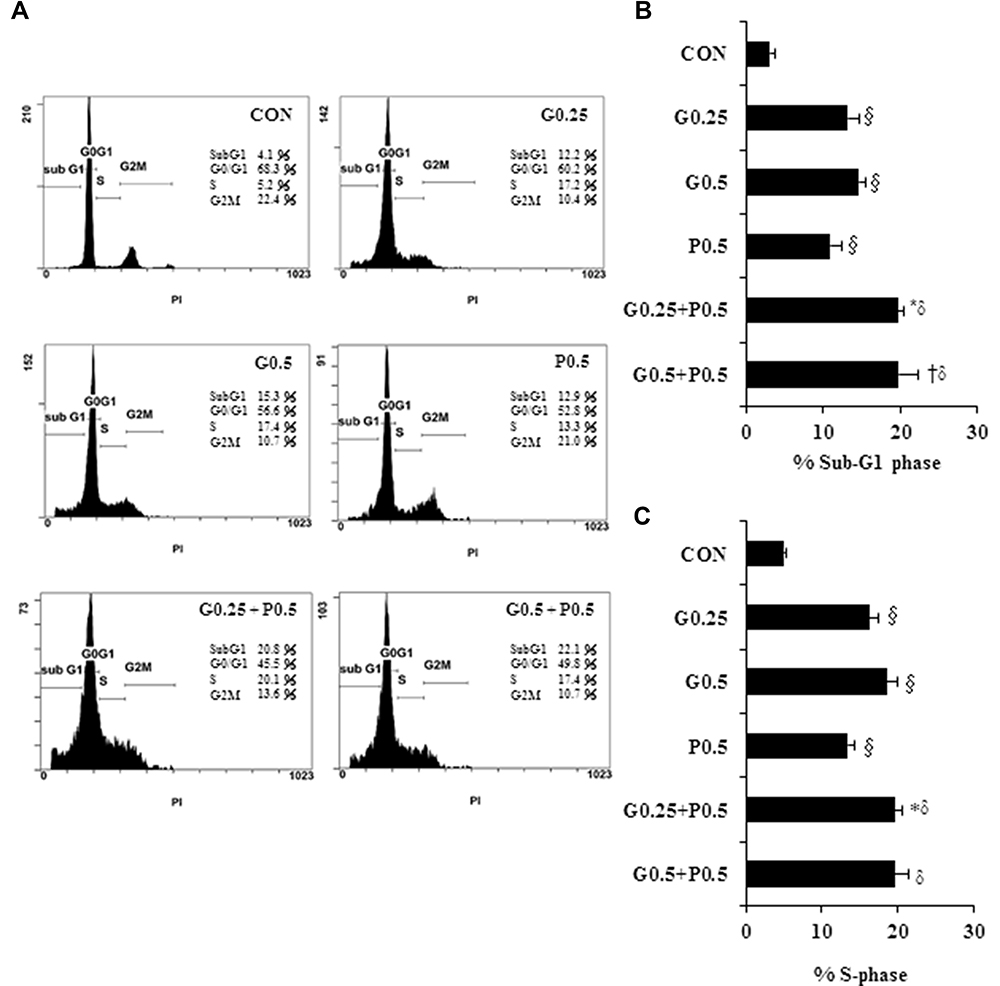 |
Figure 2 Antiproliferative effects of GEM combined with Pita in MIA PaCa-2 cells are mediated through cell cycle arrest. MIA PaCa-2 cells were treated with the indicated concentrations of GEM, Pita, or their combination for 48 h. Cell cycle progression was analyzed using flow cytometry and PI staining. (A) Histograms show sub-G1 and S phase cell percentages after various treatments. (B–C) Quantitative data of the sub-G1and S phase cell percentages are presented as mean ± SD from three replicates. GEM and Pita treatment led to the arrest of cells in the sub-G1 phase, with a consecutive increase in the percentage of MIA PaCa-2 cells in the S phase. Considerably higher amounts of sub-G1and S phase cells were observed in the combination treatment group. §, *, † and δ represent significant difference p-values, P ˂ 0.05, compared to the only CON or G0.25- or G0.5- or P0.5-treated group. Abbreviations: GEM, gemcitabine; Pita, pitavastatin; PI, propidium iodide. |
GEM- and Pita-Mediated Cell Death Occurs Through Apoptosis/Necrosis
Next, we measured cell death progression through a PI/annexin V assay. Percentages of cells in the late apoptotic/necrotic phase (PI+/annexin V+) significantly increased in proportion to GEM and Pita concentrations (20.9% ± 1.4% and 23.0% ±1.1% for 0.25 and 0.5 µM GEM; 22.0% ±1.8% for 0. 5 µM Pita, respectively), compared with the vehicle control group (15.9% ± 1.1%). In addition, during the experimental period, a greater increase was identified in the late apoptotic/necrotic phase in the GEM + Pita-treated groups than in the Pita and GEM monotherapy groups (29.2% ± 2.7% and 37.1% ± 2.2%, P < 0.05, Figure 3A and B). Total dead cells were calculated as the sum of the numbers of late apoptotic/necrotic cells and early apoptotic (PI−/annexin V+) cells. The percentages of dead cells were significantly higher in the GEM + Pita-treated group than in the Pita and GEM monotherapy groups, increasing 1.3–1.6-fold (Figure 3C, P < 0.05). The results indicate that GEM and Pita treatment reduced the viability of MIA PaCa-2 cells primarily by triggering apoptosis/necrosis to induce cell death; that GEM + Pita-treated cells showed markedly enhanced apoptotic/necrotic activities; and that the combination therapy caused more MIA PaCa-2 cell death overall.
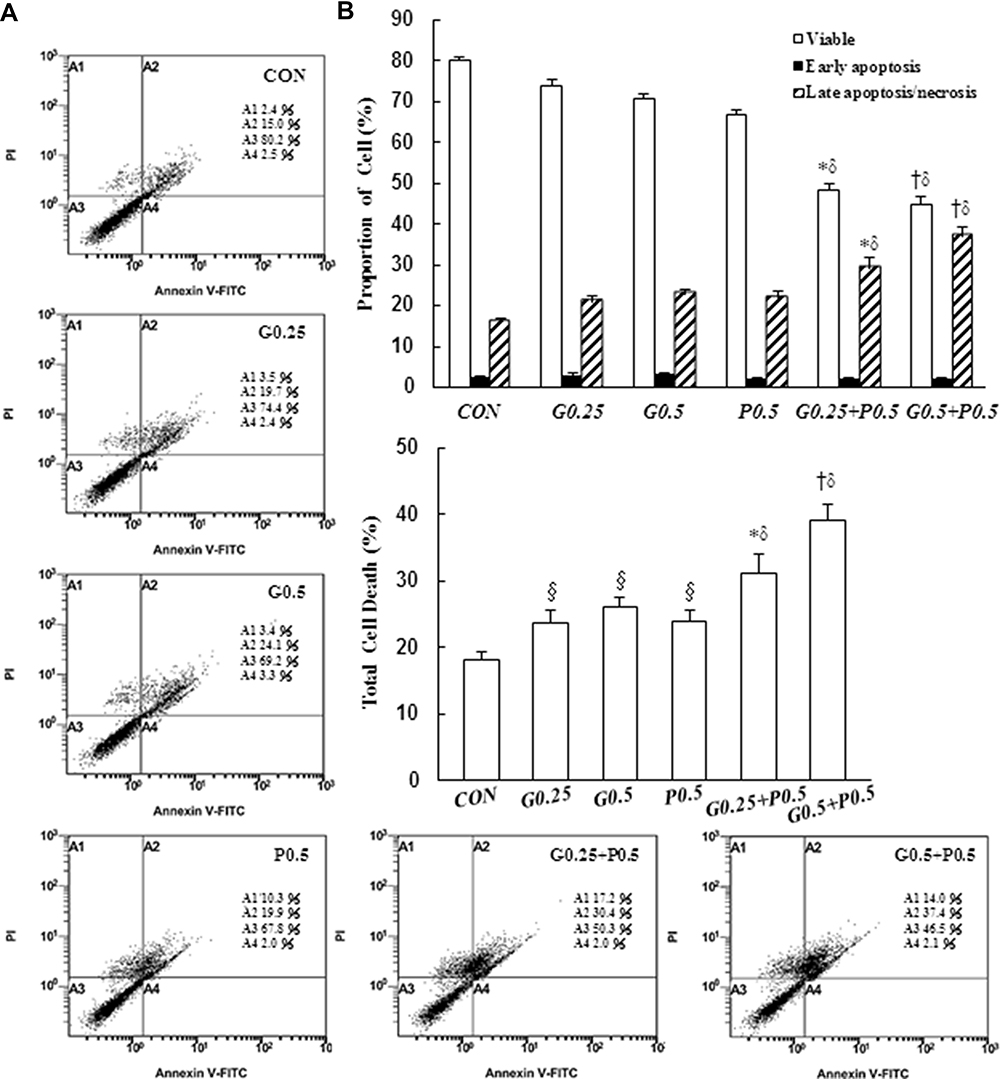 |
Figure 3 Induction of apoptosis by GEM and Pita but Pita only induces necrosis. Apoptosis and necrosis of MIA PaCa-2 cells in response to GEM, Pita, or their combination for 48 h was determined through annexin V/PI staining. (A) GEM and Pita treatment caused the significant upregulation of late apoptotic/necrotic proportions in MIA PaCa-2 cells (annexin V+/PI+ cells). The combination of GEM and Pita was more effective in inducing late apoptosis/necrosis than was monotherapy. (B) The percentage of cells in different phases was determined from at least three independent experiments. (C) The total cell death rate was defined by the sum of late apoptotic/necrotic and early apoptotic (annexin V+/PI− cells) cell numbers. Similarly, the total cell death percentage was also significantly increased after GEM and Pita combination treatment; mean ± SD from three replicates; §, *, † and δ represent significant difference p-values, P ˂ 0.05, compared to the only CON, G0.25- or G0.5- or P0.5-treated group. Abbreviations: GEM, gemcitabine; Pita, pitavastatin; PI, propidium iodide. |
Mitochondrial Membrane Potential and Oxidative Phosphorylation Expression in MIA PaCa-2 Cells
Mitochondria are critical mediators of apoptosis. Mitochondrial function is usually altered in cancer cells, causing the cells to acquire resistance to apoptosis and exhibit decreased mitochondrial oxidative phosphorylation (OXPHOS). To further examine whether GEM or Pita treatment prevents mitochondrial dysfunction, ∆ѱm and OXPHOS expression levels were measured using the JC-1 dye and Western analysis. As expected, the change in the ∆ѱm of MIA PaCa-2 cells induced by GEM or Pita showed that ∆ѱm expression levels were significantly 0.9-, 0.7-, and 0.5-fold lower in the GEM and Pita monotherapy groups than in the vehicle control group. Notably, the GEM + Pita-treated group had approximately 3.1- and 5.8-fold lower levels of ∆ѱm than did the GEM and Pita monotherapy groups (P ˂ 0.05, Figure 4A and B). The expression levels of ATP synthase α-subunit (complex V, +0.16- and +0.6-fold), MTCO1 (complex IV, −0.06- and +0.47-fold), core 2 protein (complex III, −0.03- and +0.44-fold), SDHB (complex II, +0.02- and +0.25-fold), NDUFB8 (complex I, +0.05- and +0.53-fold), and complex I–V proteins (+0.03- and +0.46-fold) were significantly enhanced dose dependently in the GEM monotherapy group compared with the control group. Compared with the control group, the Pita monotherapy group exhibited 0.42-, 0.86-, 0.53-, 0.41-, 0.43-, and 0.53-fold increases in the levels of ATP synthase-α subunit, MTCO1, core 2 protein, SDHB, NDUFB8, and complex I–V proteins, respectively. Compared with GEM or Pita monotherapy, the GEM and Pita combination treatment also resulted in a significantly higher expression of electron transport chain (ETC) complex I–V proteins (+0.66- and +1.2-fold, P < 0.05, Figure 4C and D), suggesting that GEM and Pita treatment preserves mitochondrial respiratory function in human pancreas adenocarcinoma MIA PaCa-2 cells. Our results indicate that GEM and Pita induce apoptosis/necrosis in association with decreasing mitochondrial ∆ѱm and increasing mitochondrial OXPHOS expression levels.
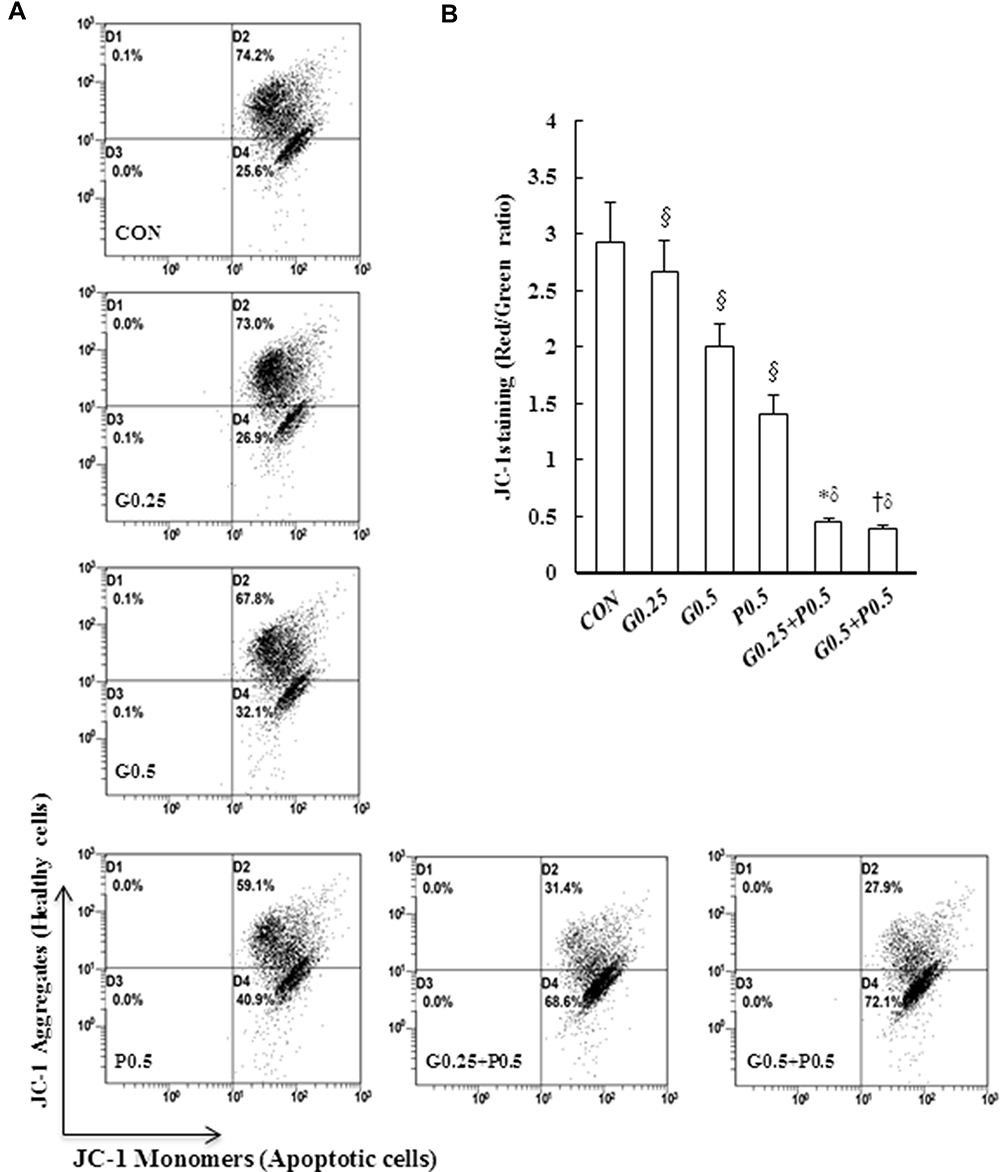 |
Figure 4 Continued. |
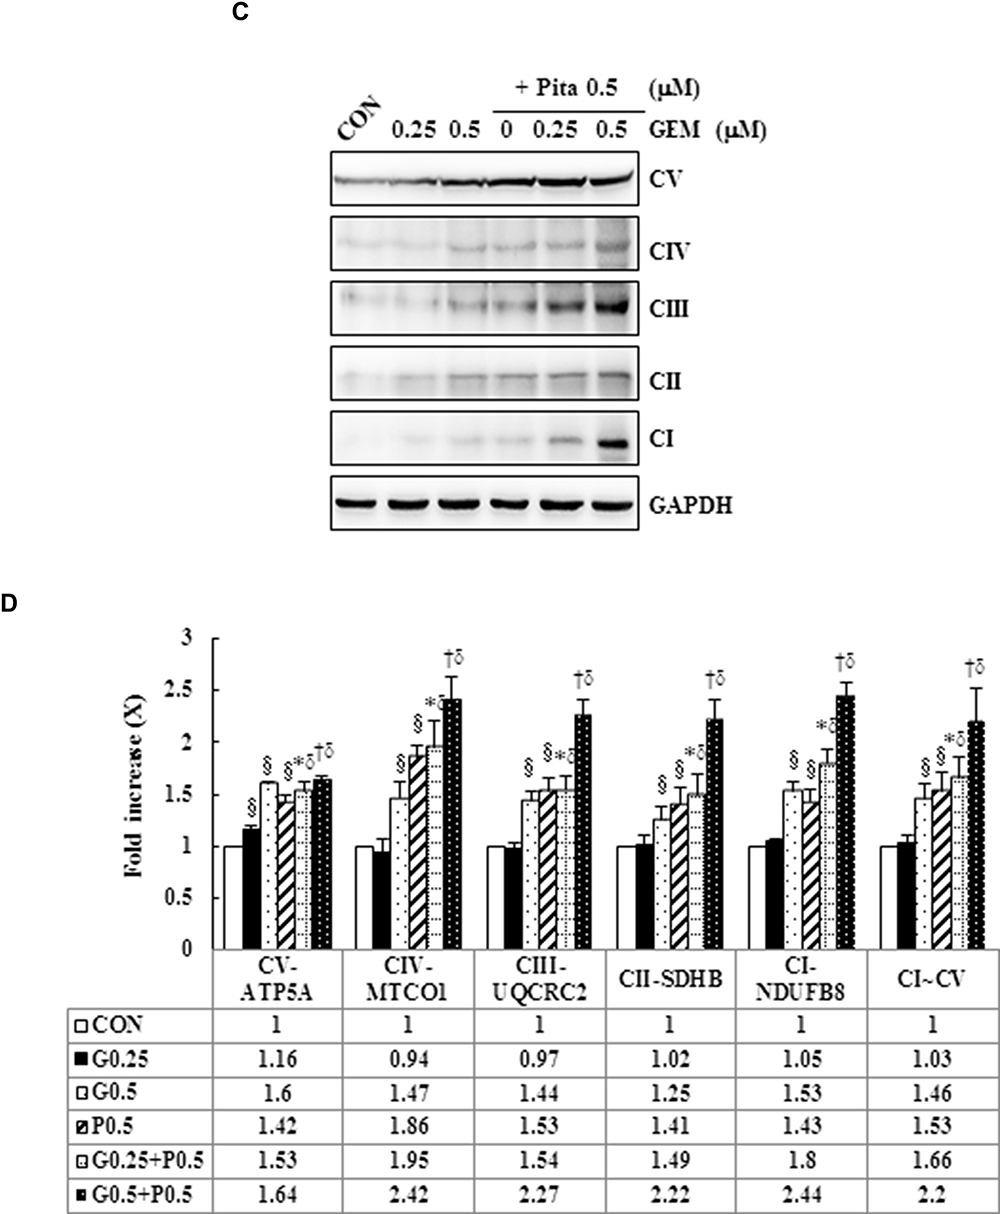 |
Figure 4 GEM and Pita induce low ∆ѱm and high OXPHOS expression. (A) MIA PaCa-2 cells were treated with the indicated concentrations of GEM and Pita for 48 h and were stained with JC-1. The mean JC-1 fluorescence intensity was detected using fluorescence- activated cell sorting analysis. (B) Graph showing significant reduction of mitochondrial membrane integrity in cells treated with GEM, Pita, or GEM + Pita. (C) Percentage of the OXPHOS complex (I–V) band intensities is presented in the graph. OXPHOS complex subunits were detected through Western blotting with appropriate antibodies. Significantly increased expression levels of electron chain complex I–V proteins were observed in the GEM with Pita combination group than in the GEM and Pita monotreatment groups. (D) Columns represent average values of at least three independent experiments. The density for the control group was set at 1; GAPDH was used as a loading control. Values are means ± SD from three replicates. §, *, † and δ represent significant difference p-values, P ˂ 0.05, compared to the only CON, G0.25- or G0.5- or P0.5-treated group. Abbreviations: GEM, gemcitabine; Pita, pitavastatin; ∆ѱm, mitochondrial transmembrane potential; OXPHOS, oxidative phosphorylation. |
Induction of Mitochondrial- and Caspase-Mediated Apoptosis
To cross-validate our data obtained through annexin staining, we determined the expression levels of apoptosis-related proteins, such as Bcl-2, Nix, Bax, cytochrome C, caspase-3, caspase-9, and PARP-1, by using Western blotting for examining whether GEM and Pita dose dependently affect the expression levels of these proteins. We found that compared with the control, GEM and Pita monotherapy significantly downregulated the expression of the antiapoptotic protein Bcl-2, upregulated the proapoptotic proteins Nix and Bax, and increased cytochrome C. In addition, cleaved caspase-3, caspase-9, and PARP-1 substantially increased in GEM or Pita monotherapy-treated MIA PaCa-2 cells in a dose-dependent manner. Therefore, the GEM and Pita combination treatment significantly decreased Bcl-2 and increased Nix, Bax, Cyto C, cleaved caspase-3 and −9, and cleaved PARP-1 protein expression levels compared with GEM or Pita monotherapy (P < 0.05, Figure 5). Collectively, these data showed that the GEM- and Pita-induced apoptosis of MIA PaCa-2 cells occurred through a mitochondria-mediated pathway, and that caspase-3, caspase-9, and PARP-1 in this apoptotic effect.
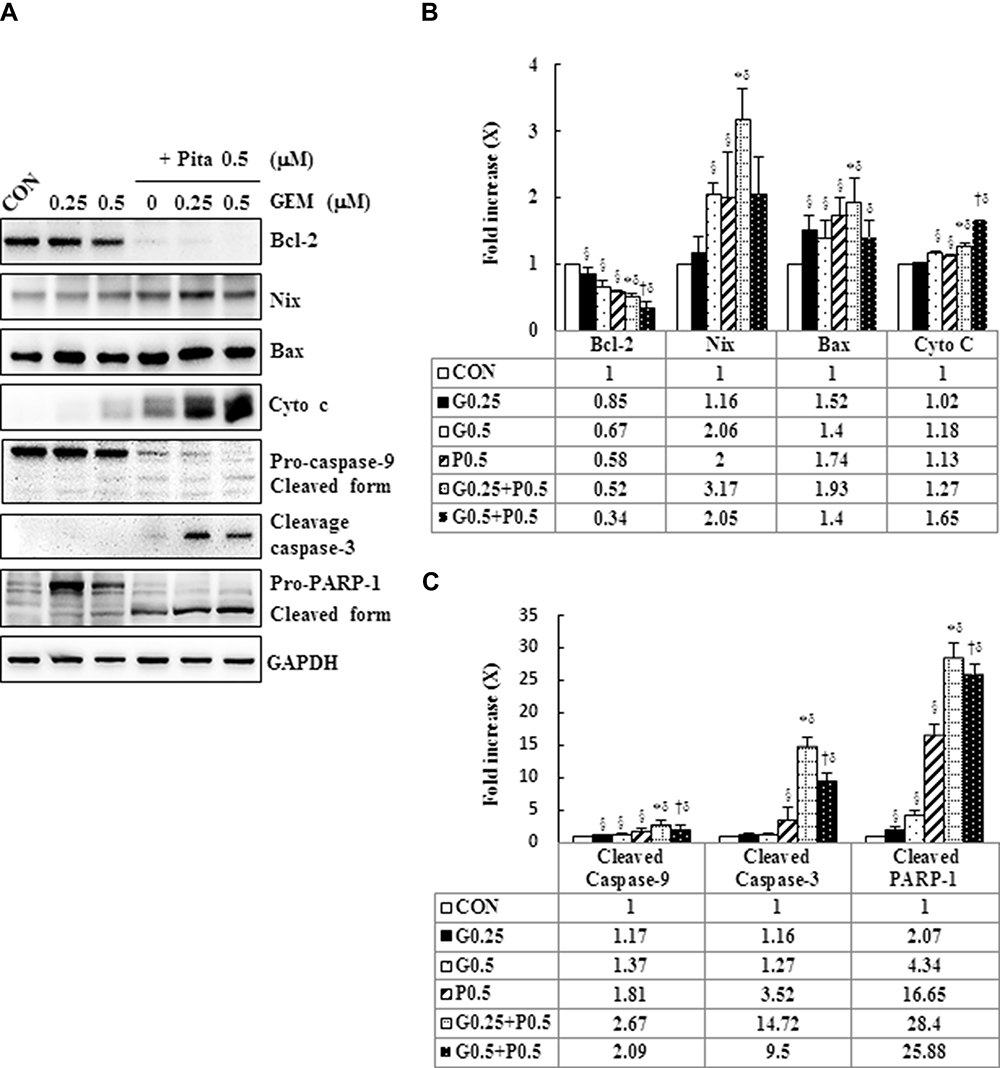 |
Figure 5 GEM and Pita induce apoptosis through the mitochondrial- and caspase- mediated pathways. (A) Representative Western blot data showing the expression of apoptosis-related proteins in the MIA PaCa-2 cells treated with different doses of GEM and Pita for 48 h. GAPDH served as a loading control. (B) Densitometric analysis of the Western blot obtained in three independent experiments. Significantly decreased antiapoptotic Bcl-2 protein expression and increased proapoptotic Bax, Nix, cytochrome (C) cleaved caspase-3 and −9, and cleaved RARP-1 protein expression were detected in the GEM–Pita combination treatment compared with other groups. The density for the control group was set at 1; Values are means ± SD from three replicates. §, *, † and δ represent significant difference p-values, P ˂ 0.05, compared to the only CON, G0.25- or G0.5- or P0.5-treated group. Abbreviations: GEM, gemcitabine; Pita, pitavastatin; Bcl-2, B-cell lymphoma 2; Bax, BCL2 associated X; RARP-1, poly (ADP-ribose) polymerase 1. |
GEM and Pita Cause S Phase Arrest by Modulating Cyclin A2/CDK2 and P21/P27 in MIA PaCa-2 Cells
To understand the mechanism responsible for the S phase arrest of GEM- and Pita-treated MIA PaCa-2 cells, we evaluated the expression levels of molecular markers associated with the S phase by using Western blotting analysis. Our results showed that GEM or Pita monotherapy could significantly decrease the expression of cyclin A2 and CDK 2 proteins in a concentration-dependent manner, whereas GEM or Pita monotherapy increased the expression of the cyclin-dependent kinase inhibitors p21WAF1 and p27KIP1 compared with the control, although no significant differences were observed in post hoc tests. Similarly, in the GEM and Pita combination treatment not only more significantly reduced the protein levels of cyclin A2 and CDK 2 but also significantly augmented p21WAF1 and p27KIP1 protein expression compared with GEM or Pita monotherapy (P < 0.05, Figure 6A and B). Thus, GEM with Pita inhibited the proliferation of MIA PaCa-2 cells and induced their S phase arrest correlated with downregulating cyclin A2 and CDK 2 expression and correlated with upregulating p21WAF1 and p27KIP1 expression.
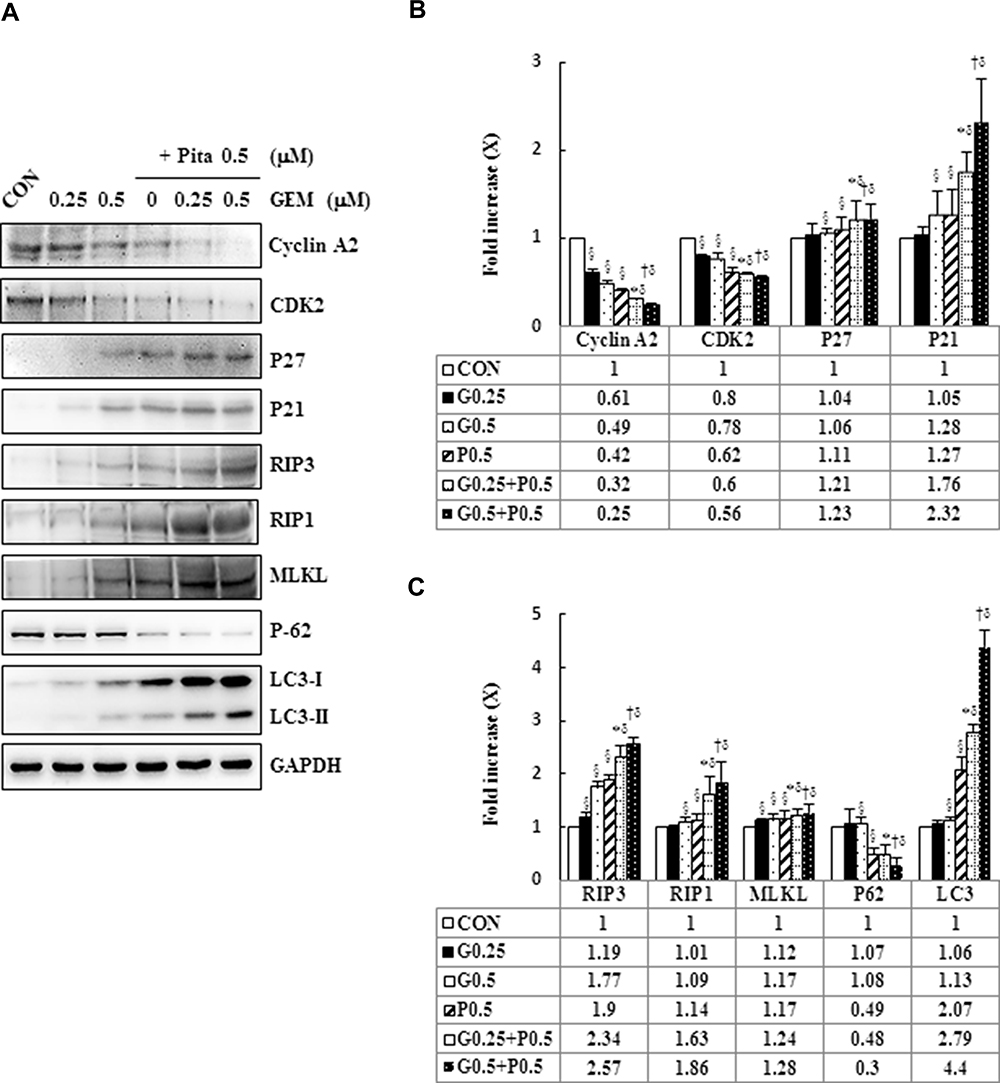 |
Figure 6 GEM and Pita modulate S phase cell cycle-regulated proteins and RIP1-RIP3- MLKL-dependent pathway in MIA PaCa-2 cells. (A) MIA PaCa-2 cells were treated with different doses of GEM and Pita for 48 h. The expression of S phase cell cycle-regulated proteins and necrosis-regulated proteins was measured using Western blot analysis. GAPDH served as loading control. (B–C) The bands were quantitatively analyzed using Fusion-Capt Advanced FX7 software, and all data are presented as mean ± SD from three replicates. The strongest reduction and addition were observed in cyclin A2/CDK2 and KIP1-p27/WAF-p21 in MIA PaCa-2 cells after treatment with GEM combined with Pita, although no significant differences were observed in p27/p21 expression in post hoc tests after GEM and Pit monotreatment compared with the vehicle control. Similarly, the expression of the necrosis-related protein RIP1-RIP3- MLKL also increased considerably after GEM–Pita treatment compared with other treatments. Surprisingly, the expression of autophagy-related proteins P62 and LC3II in the Pita monotherapy and GEM–Pita combination groups was significantly diminished and elevated, respectively, whereas no significant differences were found in the GEM monotherapy groups compared with the vehicle control. The density for the control group was set at 1; §, *, † and δ represent significant difference p-values, P ˂ 0.05, compared to the only CON, G0.25- or G0.5- or P0.5-treated group. Abbreviations: GEM, gemcitabine; Pita, pitavastatin; RIP1, receptor-interacting serine-threonine kinase 1; RIP3, receptor-interacting serine-threonine kinase 3; MLKL, mixed lineage kinase domain-like; CDK2, cyclin-dependent kinase 2; P62, sequestosome 1; LC3, light chain 3. |
Pita Causes Necrosis Through a RIP1–RIP3–MLKL-Dependent Pathway and Also Induces Autophagy
To confirm whether Pita treatment induces cell death by causing necrosis, the expression of necrosis-related proteins, including RIP1, RIP3, and MLKL, were analyzed using Western blotting. The assay results revealed that RIP1–RIP3–MLKL complex protein expression was higher in the Pita monotherapy group than in the control group. Moreover, the GEM and Pita combination therapy significantly increased RIP1–RIP3–MLKL complex protein formation. Surprisingly, the expression of the autophagy-related proteins P62 and LC3II was evidently reduced or augmented after Pita monotherapy, respectively, compared with the vehicle control; however, no significant differences were found in the GEM monotherapy group. In addition, the GEM and Pita combination therapy further enhanced the expression of LC3II (P < 0.05, Figure 6A and C). Taken together, our data suggested that Pita induced necrotic cell death through the RIP1–RIP3–MLKL- dependent pathway, and that Pita may immediately induce autophagy activity, promoting cell death in MIA PaCa-2 cells under pharmaceutical stress.
z-VAD-fmk, Nec-1, and BafA1 Prevent Apoptosis, Necrosis, and Autophagy in GEM with Pita-Treated MIA PaCa-2 Cells
We further confirmed whether GEM and Pita mediate cell death through apoptosis, necrosis, or autophagy. Thus, MIA PaCa-2 cells were pretreated with z-VAD-fmk, Nec-1, and BafA1 for 2 h and were subsequently treated with GEM and Pita for 48 h. The results showed that the apoptosis inhibitor z-VAD-fmk increased the previously reduced levels of Bcl-2, and it also separately eliminated the cleaved form of caspase-3 and PARP-1compared with the GEM and Pita combination treatment group (P < 0.05, respectively). Expression levels of RIP1–RIP3–MLKL were increased by the GEM and Pita combination treatment and were recovered by cotreatment with the necrosis inhibitor Nec-1, and LC3 II expression levels were significantly reduced by cotreatment with the autophagy inhibitor BafA1 (P < 0.05, respectively, Figure 7A–C). In addition, z-VAD-fmk, Nec-1, and BafA1 treatment increased the numbers of viable MIA PaCa-2 cells compared with the GEM and Pita combination treatment (27.2% vs 30.7% vs 28.1% vs 25.7%, P < 0.05, respectively, Figure 7D). A significant difference was observed in post hoc tests. The results clearly indicate that GEM and Pita combination treatment can significantly diminish MIA PaCa-2 cell viability primarily by triggering apoptosis, necrosis, and autophagy.
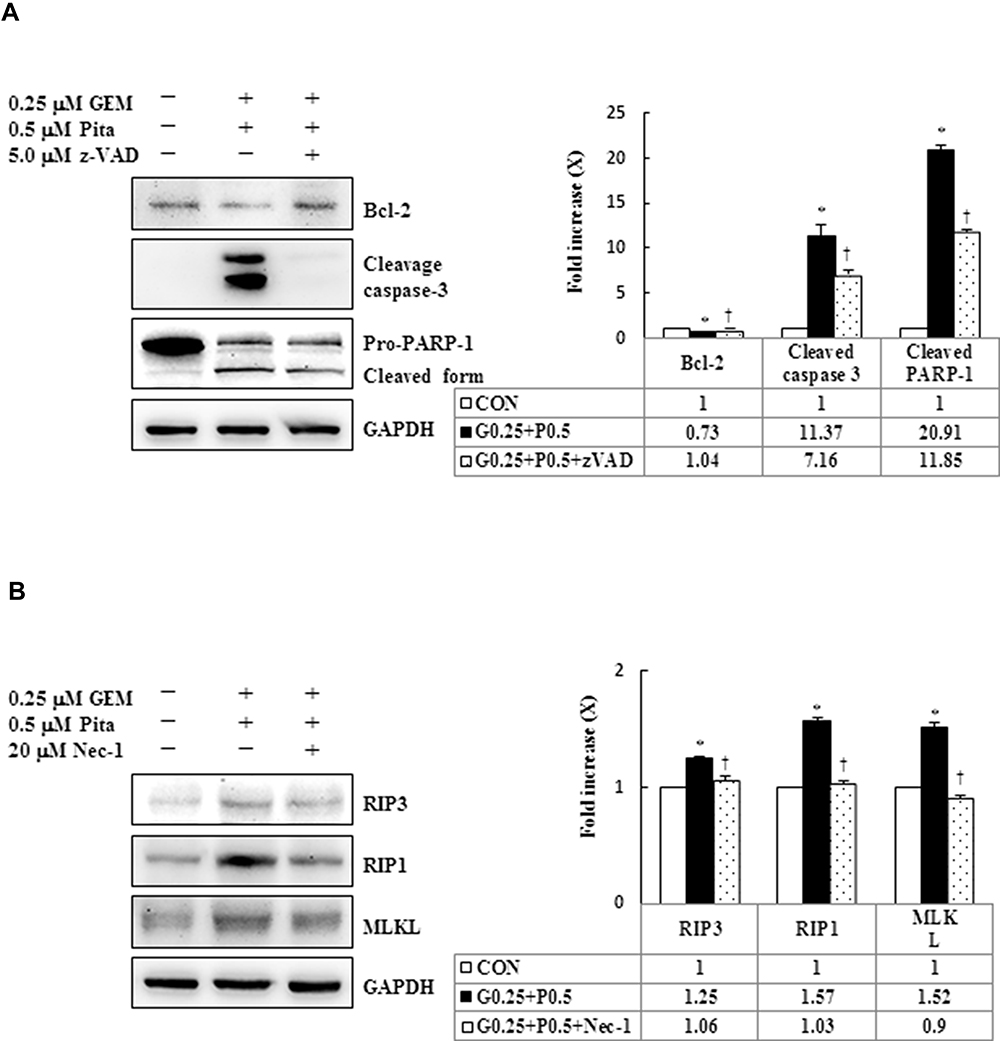 |
Figure 7 Continued. |
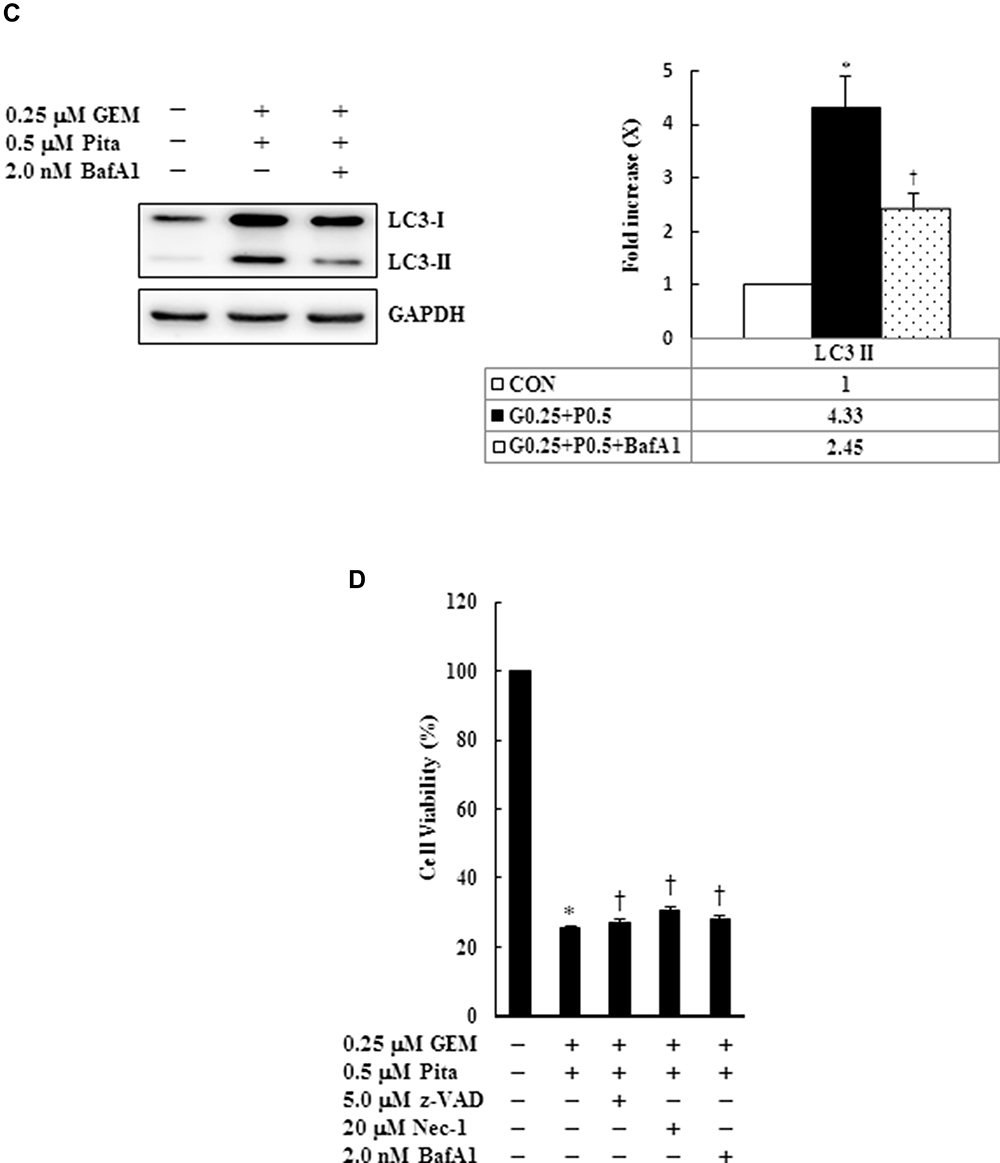 |
Figure 7 Influence of z-VAD-fmk, Nec-1, and BafA1 on apoptotic, necrotic, and autophagy signaling proteins, respectively. MIA PaCa-2 cells were pretreated with 5 μM z-VAD-fmk, 20 μM Nec-1, or 2 nM BafA1 for 2 h and were then treated with 0.25 μM GEM + 0.5 μM Pita for 48 h. (A–C) Cell lysates were analyzed using Western blot with the indicated antibodies. Quantitative data are presented as mean ± SD from three replicates. (A) Expression levels of the antiapoptotic marker Bcl-2 were reduced by GEM combined with Pita but were elevated by z-VAD-fmk. Meanwhile, the apoptotic markers of cleaved caspase-3 and cleaved PARP-1 were also suppressed by z-VAD-fmk. (B) Expression levels of the necrotic markers RIP3, RIP1, and MLKL were elevated by GEM combined with Pita but were suppressed by Nec-1. (C) Expression level of the autophagy marker LC3-II was elevated by GEM combined with Pita but was suppressed by BafA1. (D) MIA PaCa-2 cell viability was determined using CCK-8. Cells with GEM combined with Pita treatment exhibited significantly decreased cell viability. When pretreated with z-VAD-fmk, Nec-1, or BafA1, the cells exhibited increased cell viability. The density for the control group was set at 1; * and † represent significant difference p-values, P ˂ 0.05, compared to the untreated or G0.25+P0.5-treated group; mean ± SD from three replicates. Abbreviations: z-VAD-fmk, Z-Val-Ala-Asp-fluoromethylketone; Nec-1, necrostatin-1; Baf-A1, bafilomycin A1; GEM, gemcitabine; Pita, pitavastatin; Bcl-2, B-cell lymphoma 2; RARP-1, poly (ADP-ribose) polymerase 1; RIP1, receptor-interacting serine-threonine kinase 1; RIP3, receptor-interacting serine-threonine kinase 3; MLKL, mixed lineage kinase domain-like; LC3, light chain 3. CCK-8, cell counting kit-8. |
GEM and Pita Combination Therapy of Murine Xenograft Tumors
To study the effect of GEM and Pita on tumor growth in vivo, a xenograft tumor model of MIA PaCa-2 pancreatic cancer was used. Our data showed that GEM combined with Pita or used as a single agent inhibited tumor growth; however, the degree of inhibition differed among the treatment groups. As shown in Figure 8A and B, the tumor volume in the combination treatment group was significantly reduced compared with that in the GEM and Pita monotherapy groups. In addition, 40 days after administration of the indicated treatments, the mice were killed. The results showed that tumor weights were lower in the GEM and Pita monotherapy groups and the combination treatment group than in the control group, with inhibition rates of 37.3%, 38.7%, and 74.6%, respectively (P < 0.05). The xenograft tumor weight was significantly lower in the GEM + Pita group than in the GEM and Pita monotherapy groups (P < 0.05, respectively). These results demonstrate that Pita and GEM can act synergistically against pancreatic tumors in vivo. In addition, the body weight of mice in the GEM and Pita monotherapy groups and GEM + Pita combination treatment group showed no obvious decline compared with that in the control group, suggesting limited side effects (Figure 8C). To further confirm in vitro results showing effects on proliferation and apoptosis after GEM and Pita treatment, the cell proliferation (Ki-67) and apoptosis (cleaved caspase-3) markers were measured using immunohistochemistry. As shown in Figure 8D, the Ki-67 expression was significantly decreased in the tumor treated by GEM or Pita or GEM + Pita in murine xenograft model. In contrast, the c-caspase-3 expression in the GEM + Pita combination treatment group was higher than those in the control group. These results suggested that both proliferation and apoptosis effects might be correlated with GEM and Pita antitumor effects in vivo.
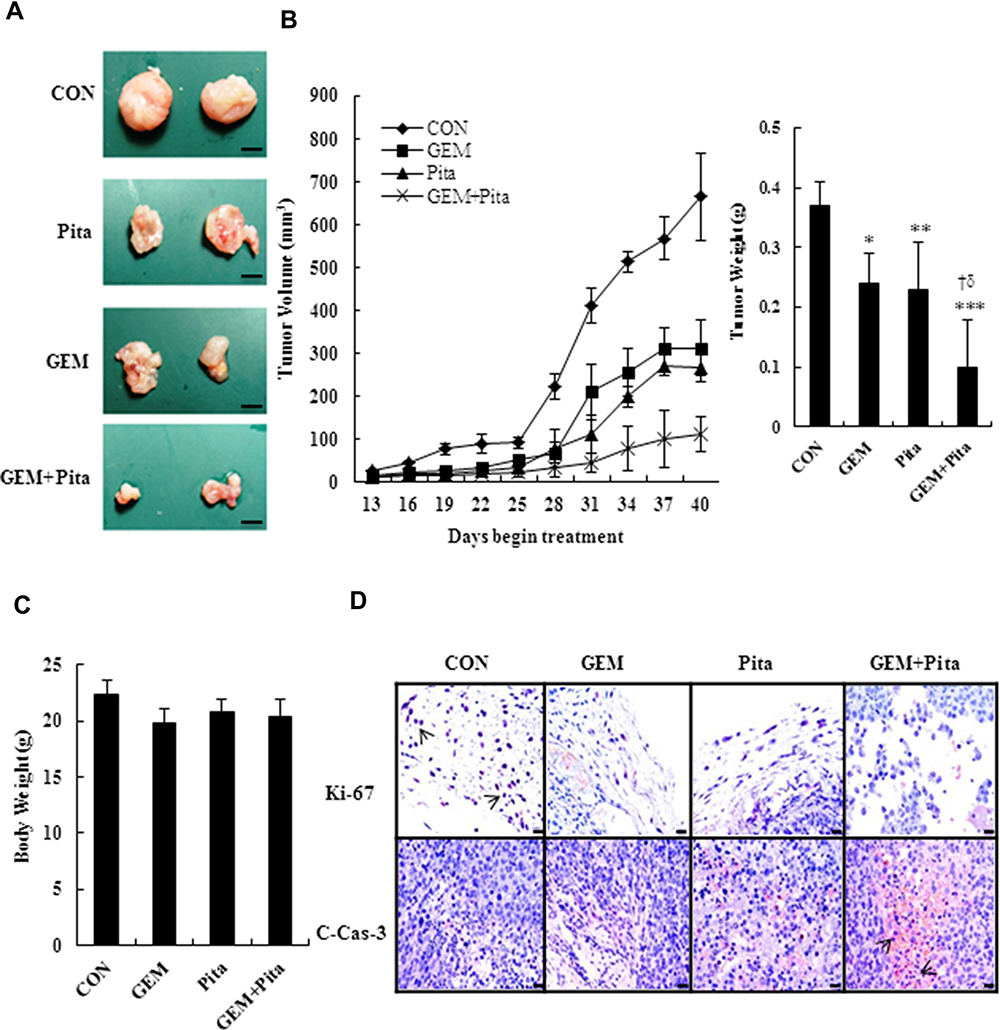 |
Figure 8 GEM and Pita act synergistically against a xenograft tumor model of pancreatic cancer in vivo. Nude mice were used to construct a xenograft tumor model with MIA PaCa-2 cells. (A) Xenograft tumors of four groups, bar = 0.5 mm. (B) Tumor volume and weight. (C) Mouse body weight at the end of treatment. n = 5 mice for each group. (D) Immunohistochemistry stained with cell proliferation marker Ki-67 (nucleus, arrows) and the apoptosis marker cleaved caspase-3 (c-cas-3, cytoplasm, arrows), magnification 400x, bar = 20 μm.*P=0.003, **P= 0.028, ***P=0.001 compared with the untreated group. † and δ represent to compare with the GEM or Pita group, P ˂ 0.05, respectively. Abbreviations: GEM, gemcitabine; Pita, pitavastatin. |
Discussion
The anticancer effects of the GEM and Pita combination therapy and the detailed mechanism remain unclear. In this study, we used the human pancreatic duct adenocarcinoma cell line MIA PaCa-2, which accounts for approximately 90% of all cases of pancreatic cancer, and a mouse xenograft tumor model. To examine whether GEM combined with Pita mediates the medical treatment of MIA PaCa-2 cells, we used chemical inhibitors to inhibit the expression of the target gene in MIA PaCa-2 cells. Our study results showed that GEM combined with Pita therapy, particularly 0.5 μM Pita combined with 0.25 or 0.5 μM GEM, markedly reduced cell viability, cell proliferation, cell migration compared with monotherapy and produced synergistic anticancer effects. This finding showed that the combination of GEM with other anticancer agents (ie, nab-paclitaxel, erlotinib, S-1, and capecitabine) could significantly enhance its therapeutic potential for pancreatic cancer, consistent with the results of previous studies.27–29 Furthermore, this study revealed that GEM combined with Pita also could markedly up-regulated nucleoside transports hENT1, hCNT3 enhanced GEM uptake, and up- and down-regulated dCK, RRM2 reduced GEM resistance were consistent results of Amrutkar et al.14 In 1991, Huang et al30 indicated that the main mechanism of action of GEM is to inhibit DNA synthesis (S phase) in human T-lymphoblastoid CCRF-CEM cells, preventing chain elongation. In addition, several studies have shown that the induction of apoptosis through caspase signaling is another important mechanism of action for GEM in NCI-H460 and BxPC-3 cancer cell lines.31,32 Pita has also been demonstrated to inhibit CCR2 and CCR5 monocytic tumor cell proliferation by inducing S phase cell cycle arrest.33 de wolf et al, Abdullah et al and Jiang et al19,20,34 indicated that Pita-induced apoptosis was increased by suppressing mevalonate pathway metabolites blocking geranylgeranyl protein and mevalonate products resulted in accumulation of cleaved PARP in ovarian, breast cancer cells and glioblastoma. Similarly, the statin-mediated K-Ras protein translocation in the MiaPaCa-2 cells was completely eliminated by mevalonate, farnesyl pyrophosphate (FPP) and geranylgeranyl pyrophosphate (GGPP) to inhibit mevalonate pathway, such as simvastatin, fluvastatin, atorvastatin, pitavastatin.35,36 At higher concentrations, statins mostly induce cell death through necrosis, whereas at lower concentrations, they induce cell death through apoptosis.22 The present study results confirmed previous findings that GEM and Pita induced cell death were associated with S phase cell cycle arrest and the PARP-1-caspase3/9 signaling pathway. In addition to the induction of apoptosis, we found that Pita-induced cell death could trigger the necrosis pathway by activating RIP1–RIP3–MLKL, whereas GEM could not.
Furthermore, the results of the present study demonstrated that MIA PaCa-2 cells treated with combined GEM– Pita showed high expression levels of L3II, suggesting that combined GEM–Pita induced cell death through autophagy. Previous studies have suggested that Pita combined with anticancer agents may induce cell death specifically through autophagy,21,37 supporting our results. In our study, in vivo data further confirmed the anticancer effects of combined GEM– Pita treatment on pancreatic cancer, which were mediated by inhibiting tumor growth, with limited side effects in nude mice. Herein, we used the most widely animal model-xenograf5,18,38,39 although limited in that it is not truly primary tumor and do not represented appropriate sites for human tumor. Nevertheless, our model provided useful information on the effects of combined GEM–Pita on pancreatic tumors through preventing tumor growth, and the single or dual therapy used in this study showed low toxicity without animal deaths or significant changes in body weight. To better represent predict therapeutic response in cancer, orthotopic xenograft mouse models will be used in the future studies as valuable tools for improving our understanding of studying anti-cancer drugs response. However, other studies have shown that statins (eg, simvastatin, fluvastatin, and lovastatin) are associated with an increased incidence of thyroid cancer, follicular cell adenomas, squamous papillomas, hepatocellular tumors, pulmonary adenomas, and lymphomas in rodents.40–42 The differences observed in the anticancer effects of various statins may be caused by tumor cell-type specificity and individual statin bioavailability.
The major function of mitochondria is ATP production, and they function as the powerhouse of the cell and synthesize ATP through OXPHOS. In 1930, Otto Warburg revealed that defects in OXPHOS or respiration resulting in mitochondrial dysfunction further contribute to tumor progression.43 In addition, previous studies have suggested that an increase in mitochondrial ∆ѱm enhances reactive oxygen species production, therefore increasing tumorigenicity.44,45 Furthermore, although pharmacological treatments decease ∆ѱm, these treatments may also mediate apoptosis to induce cancer cell death in certain cancer cell lines (eg, SW620, SW480, MCF7, and HepG2 cancer cells),46,47 which is consistent with our study finding that GEM combined with Pita therapy had indirect effects on mitochondrial function correlated with disrupting ∆ѱm and promoting OXPHOS in MIA PaCa-2 cells. There are conflicting reports on the influence of functional ∆ѱm and OXPHOS on cancer. A lack of OXPHOS and low ∆ѱm are associated with an antiapoptotic effect in some cancer types.48 Vander Heiden et al characterized an increase in ∆ѱm after a death stimulus, with ∆ѱm decreasing later in the death process.49 Thus, different cancer cell types may undergo different mechanistic changes, resulting in differences in mitochondria function for regulating cell death and cell fate in tumor progression. A previous study found that Pita could decrease multidrug resistance-associated protein expression and increase sensitivity to chemotherapy in cancer stem cells.50 In this combined drug study, we found that Pita could enhance GEM treatment efficiency against pancreatic cancer, which may be are associated with the inhibition of cyclin A2/CDK2 and an increase in p21/p27 protein expression levels, resulting in cell cycle arrest. However, additional experiments are needed to provide a definite answer.
Our study has some limitations. First, our study focused on the combined effects of GEM and Pita on cell death-related pathways in human pancreatic cancer cells, and mechanism studies are still inadequate. Further study should be conducted to elucidate the underlying molecular mechanisms of the combined effects in more detail. Second, we only used one human pancreatic cancer cell line in this study because MIA PaCa-2 cells are more sensitive to GEM and Pita treatment than ASPC-1 and PANC-1cells, another human pancreatic cancer cell lines, according to our evidence that the ASPC-1 and PANC-1 cell lines results are at much higher concentrations of both GEM and Pita (data not show). Therefore, the results should be confirmed in other human pancreatic cancer cell lines.
Conclusion
This study for the first time convincingly showed that the GEM–Pita combined treatment provides a strong synergistic anticancer effect may be through apoptosis, necrosis, and autophagy in pancreatic cancer cells. Furthermore, the in vivo study also showed that the GEM–Pita combined therapy could indirectly inhibit tumor growth in nude mice. Thus, combined GEM–Pita shows potential as a novel treatment option for pancreatic cancer.
Acknowledgments
This work was supported by the Changhua Christian Hospital under grant numbers 104-CCH-IRP-017, 105-CCH-IRP-133 and 106-CCH-IRP-090. The authors thank Wallace Academic Editing for editing this manuscript. The funders had no role in study design, data collection and analysis, decision to publish, or preparation of the manuscript.
Disclosure
The authors report no conflicts of interest in this work.
References
1. Rahib L, Smith BD, Aizenberg R, et al. Projecting cancer incidence and deaths to 2030: the unexpected burden of thyroid, liver, and pancreas cancers in the united states. Cancer Res. 2014;74:2913–2921. doi:10.1158/0008-5472.CAN-14-0155
2. SEER Cancer Stat Facts: Pancreatic Cancer. Bethesda: National Cancer Institute; April 2019. Available from: https://seer.cancer.gov/statfacts/html/pancreas.html.
3. Kamisawa T, Isawa T, Koike M, et al. Hematogenous metastases of pancreatic ductal carcinoma. Pancreas. 1995;11:345–349. doi:10.1097/00006676-199511000-00005
4. Labori KJ, Katz MH, Tzeng CW, et al. Impact of early disease progression and surgical complications on adjuvant chemotherapy completion rates and survival in patients undergoing the surgery first approach for resectable pancreatic ductal adenocarcinoma—a population-based cohort study. Acta Oncol. 2016;55:265–277. doi:10.3109/0284186X.2015.1068445
5. Neoptolemos JP, Palmer DH, Ghaneh P, et al. European Study Group for Pancreatic Cancer. Comparison of adjuvant gemcitabine and capecitabine with gemcitabine monotherapy in patients with resected pancreatic cancer (ESPAC-4): a multicentre, open-label, randomised, Phase 3 trial. Lancet. 2017;389:1011–1024.
6. Golcher H, Brunner TB, Witzigmann H, et al. Neoadjuvant chemoradiation therapy with gemcitabine/cisplatin and surgery versus immediate surgery in resectable pancreatic cancer: results of the first prospective randomized Phase II trial. Strahlenther Onkol. 2015;191:7–16. doi:10.1007/s00066-014-0737-7
7. Regine WF, Winter KA, Abrams RA, et al. Fluorouracil vs gemcitabine chemotherapy before and after fluorouracil-based chemoradiation following resection of pancreatic adenocarcinoma: a randomized controlled trial. JAMA. 2008;299:1019–1026. doi:10.1001/jama.299.9.1019
8. Sandler AB, Nemunaitis J, Denham C, et al. Phase III trial of gemcitabine plus cisplatin vs. cisplatin alone in patients with locally advanced or metastatic non-small cell lung cancer. J Clin Oncol. 2000;18:122–130.
9. von der Maase H, Hansen SW, Roberts JT, et al. Gemcitabine and cisplatin versus methotrexate, vinblastine, doxorubicin, and cisplatin in advanced or metastatic bladder cancer: results of a large, randomized, multinational, multicenter, phase III study. J Clin Oncol. 2000;18:3068–3070. doi:10.1200/JCO.2000.18.17.3068
10. Albain KS, Nag SM, Calderillo-Ruiz G, et al. Global phase III study of gemcitabine plus paclitaxel (GT) vs. paclitaxel (T) as frontline therapy for metastatic breast cancer (MBC): first report of overall survival. J Clin Oncol. 2004;22(suppl 14):510. doi:10.1200/jco.2004.22.14_suppl.510
11. Burris HA, Moore MJ, Andersen J, et al. Improvements in survival and clinical benefit with gemcitabine as first-line therapy for patients with advanced pancreas cancer: a randomized trial. J Clin Oncol. 1997;15:2403–2413. doi:10.1200/JCO.1997.15.6.2403
12. Kim MP, Gallick GE. Gemcitabine resistance in pancreatic cancer: picking the key players. Clin Cancer Res. 2008;14:1284–1285. doi:10.1158/1078-0432.CCR-07-2247
13. de Sousa Cavalcante L, Monteiro G. Gemcitabine: metabolism and molecular mechanisms of action, sensitivity and chemoresistance in pancreatic cancer. Eur J Pharmacol. 2014;741:8–16. doi:10.1016/j.ejphar.2014.07.041
14. Amrutkar M, Gladhaug IP. Pancreatic cancer chemoresistance to gemcitabine. Cancers. 2017;9:E157. doi:10.3390/cancers9110157
15. Jakobisiak M, Golab J. Potential antitumor effects of statins (Review). Int J Oncol. 2003;23:1055–1069.
16. Altwairgi AK. Statins are potential anticancerous agents (Review). Oncol Rep. 2015;33:1019–1039. doi:10.3892/or.2015.3741
17. Kubatka P, Bojková B, Kassayová M, et al. Combination of pitavastatin and melatonin shows partial antineoplastic effects in a rat breast carcinoma model. Acta Histochem. 2014;116:1454–1461. doi:10.1016/j.acthis.2014.09.010
18. You HY, Zhang WJ, Xie XM, et al. Pitavastatin suppressed liver cancer cells in vitro and in vivo. Onco Targets Ther. 2016;9:5383–5388. doi:10.2147/OTT.S106906
19. de Wolf E, Abdullah MI, Jones SM, et al. Dietary geranylgeraniol can limit the activity of pitavastatin as a potential treatment for drug-resistant ovarian cancer. Sci Rep. 2017;7:5410. doi:10.1038/s41598-017-05595-4
20. Abdullah MI, Abed MN, Richardson A. Inhibition of the mevalonate pathway augments the activity of pitavastatin against ovarian cancer cells. Sci Rep. 2017;7(1):8090.
21. Al-Qatati A, Aliwaini S. Combined pitavastatin and dacarbazine treatment activates apoptosis and autophagy resulting in synergistic cytotoxicity in melanoma cells. Oncol Lett. 2017;14:7993–7999. doi:10.3892/ol.2017.7189
22. Paškevičiūtė M, Petrikaitė V. Differences of statin activity in 2D and 3D pancreatic cancer cell cultures. Drug Des Devel Ther. 2017;11:3273–3280. doi:10.2147/DDDT.S149411
23. Ouyang G, Liu Z, Huang S, et al. Gemcitabine plus cisplatin versus gemcitabine alone in the treatment of pancreatic cancer: a meta-analysis. World J Surg Oncol. 2016;14:59. doi:10.1186/s12957-016-0813-9
24. Neoptolemos JP, Palmer DH, Ghaneh P, et al. Comparison of adjuvant gemcitabine and capecitabine with gemcitabine monotherapy in patients with resected pancreatic cancer (ESPAC-4): a multicentre, open-label, randomised, phase 3 trial. Lancet. 2017;389(10073):1011–1024.
25. Yunis AA, Arimura GK, Russin DJ. Human pancreatic carcinoma (MIA PaCa-2) in continuous culture: sensitivity to asparaginase. Int J Cancer. 1977;19:128–135. doi:10.1002/ijc.2910190118
26. Chou T-C, Talalay P. Quantitative analysis of dose-effect relationships: the combined effects of multiple drugs or enzyme inhibitors. Adv Enz Regul. 1984;22:27–55. doi:10.1016/0065-2571(84)90007-4
27. Le N, Vinci A, Schober M, et al. Real-world clinical practice of intensified chemotherapies for metastatic pancreatic cancer: results from a pan-european questionnaire study. Digestion. 2016;94:222–229. doi:10.1159/000453257
28. Zhong S, Qie S, Yang L, et al. S-1 monotherapy versus S-1 combination therapy in gemcitabine-refractory advanced pancreatic cancer: a meta-analysis (PRISMA) of randomized control trials. Medicine (Baltimore). 2017;96:e7611. doi:10.1097/MD.0000000000007611
29. Neoptolemos JP, Palmer DH, Ghaneh P, et al. European Study Group for Pancreatic Cancer. Comparison of adjuvant gemcitabine and capecitabine with gemcitabine monotherapy in patients with resected pancreatic cancer (ESPAC-4): a multicentre, open-label, randomised, phase 3 trial. Lancet. 2017;389(10073):1011–1024.
30. Huang P, Chubb S, Hertel LW, et al. Action of 2ʹ,2ʹ- difluorodeoxycytidine on DNA synthesis. Cancer Res. 1991;51:6110–6117.
31. Ferreira CG, Span SW, Peters GJ, et al. Chemotherapy triggers apoptosis in a caspase-8-dependent and mitochondria-controlled manner in the non-small cell lung cancer cell line NCI-H460. Cancer Res. 2000;60:7133–7141.
32. Chandler NM, Canete JJ, Callery MP. Caspase-3 drives apoptosis in pancreatic cancer cells after treatment with gemcitabine. J Gastrointest Surg. 2004;8:1072–1078. doi:10.1016/j.gassur.2004.09.054
33. Fujino M, Miura S, Matsuo Y, et al. Pitavastatin-induced downregulation of CCR2 and CCR5 in monocytes is associated with the arrest of cell-cycle in S phase. Atherosclerosis. 2006;187:301–308. doi:10.1016/j.atherosclerosis.2005.10.008
34. Jiang P, Mukthavaram R, Chao Y, et al. In vitro and in vivo anticancer effects of mevalonate pathway modulation on human cancer cells. Br J Cancer. 2014;111:1562–1571. doi:10.1038/bjc.2014.431
35. Gbelcová H, Rimpelová S, Knejzlík Z, et al. Isoprenoids responsible for protein prenylation modulate the biological effects of statins on pancreatic cancer cells. Lipids Health Dis. 2017;16:250. doi:10.1186/s12944-017-0641-0
36. Bocci G, Fioravanti A, Orlandi P, et al. Fluvastatin synergistically enhances the antiproliferative effect of gemcitabine in human pancreatic cancer MIAPaCa-2 cells. Br J Cancer. 2005;93:319–330. doi:10.1038/sj.bjc.6602720
37. Tsuboi Y, Kurimoto M, Nagai S, et al. Induction of autophagic cell death and radiosensitization by the pharmacological inhibition of nuclear factor-kappa B activation in human glioma cell lines. J Neurosurg. 2009;110:594–604. doi:10.3171/2008.8.JNS17648
38. Blanquicett C, Saif MW, Buchsbaum DJ, et al. Antitumor efficacy of capecitabine and celecoxib in irradiated and lead-shielded, contralateral human BxPC-3 pancreatic cancer xenografts: clinical implications of abscopal effects. Clin Cancer Res. 2005;11:8773–8781. doi:10.1158/1078-0432.CCR-05-0627
39. Byeon HJ, Choi SH, Choi JS, et al. Apoptotic activity and antitumor efficacy of PEGylated TNF-related apoptosis-inducing ligand (TRAIL) in a Mia Paca-2 cell-xenografted mouse model. Biomed Pharmacother. 2014;68:65–69. doi:10.1016/j.biopha.2013.10.010
40. Smith PF, Grossman SJ, Gerson RJ, et al. Studies on the mechanism of simvastatin- induced thyroid hypertrophy and follicular cell adenoma in the rat. Toxicol Pathol. 1991;19:197–205. doi:10.1177/019262339101900301
41. Robison RL, Suter W, Cox RH. Carcinogenicity and mutagenicity studies with fluvastatin, a new, entirely synthetic HMG CoA reductase inhibitor. Fundam Appl Toxicol. 1994;23:9–20. doi:10.1006/faat.1994.1073
42. Lamprecht J, Wojcik C, Jakobisiak M, et al. Lovastatin induces mitotic abnormalities in various cell lines. Cell Biol Int. 1999;23(1):51–60. doi:10.1006/cbir.1998.0322
43. Warburg O. On respiratory impairment in cancer cells. Science. 1956;124(3215):269–270.
44. Sastre-Serra J, Valle A, Company MM, et al. Estrogen down- regulates uncoupling proteins and increases oxidative stress in breast cancer. Free Radic Biol Med. 2010;48:506–512. doi:10.1016/j.freeradbiomed.2009.11.025
45. Solaini G, Sgarbi G, Baracca A. Oxidative phosphorylation in cancer cells. Biochim Biophys Acta. 2011;1807:534–542. doi:10.1016/j.bbabio.2010.09.003
46. Houston MA, Augenlicht LH, Heerdt BG. Intrinsic mitochondrial membrane potential and associated tumor phenotype are independent of MUC1 over-expression. PLoS One. 2011;6:e25207. doi:10.1371/journal.pone.0025207
47. Zhu YY, Huang HY, Wu YL. Anticancer and apoptotic activities of oleanolic acid are mediated through cell cycle arrest and disruption of mitochondrial membrane potential in HepG2 human hepatocellular carcinoma cells. Mol Med Rep. 2015;12:5012–5018. doi:10.3892/mmr.2015.4033
48. Dey R, Moraes CT. Lack of oxidative phosphorylation and low mitochondrial membrane potential decrease susceptibility to apoptosis and do not modulate the protective effect of Bcl-x(L) in osteosarcoma cells. J Biol Chem. 2000;275:7087–7094. doi:10.1074/jbc.275.10.7087
49. Vander Heiden MG, Chandel NS, Williamson EK, et al. Bcl-xL regulates the membrane potential and volume homeostasis of mitochondria. Cell. 1997;91:627–637. doi:10.1016/S0092-8674(00)80450-X
50. Yue W, Lee JK, Abe K, et al. Decreased hepatic breast cancer resistance protein expression and function in multidrug resistance-associated protein 2-deficient TR− rats. Drug Metab Dispos. 2011;39:441–447. doi:10.1124/dmd.110.035188
 © 2020 The Author(s). This work is published and licensed by Dove Medical Press Limited. The
full terms of this license are available at https://www.dovepress.com/terms
and incorporate the Creative Commons Attribution
- Non Commercial (unported, 3.0) License.
By accessing the work you hereby accept the Terms. Non-commercial uses of the work are permitted
without any further permission from Dove Medical Press Limited, provided the work is properly
attributed. For permission for commercial use of this work, please see paragraphs 4.2 and 5 of our Terms.
© 2020 The Author(s). This work is published and licensed by Dove Medical Press Limited. The
full terms of this license are available at https://www.dovepress.com/terms
and incorporate the Creative Commons Attribution
- Non Commercial (unported, 3.0) License.
By accessing the work you hereby accept the Terms. Non-commercial uses of the work are permitted
without any further permission from Dove Medical Press Limited, provided the work is properly
attributed. For permission for commercial use of this work, please see paragraphs 4.2 and 5 of our Terms.