Back to Journals » Neuropsychiatric Disease and Treatment » Volume 14
Synchronization within, and interactions between, the default mode and dorsal attention networks in relapsing-remitting multiple sclerosis
Authors Huang M, Zhou F ![]() , Wu L, Wang B, Wan H, Li F, Zeng X
, Wu L, Wang B, Wan H, Li F, Zeng X ![]() , Gong H
, Gong H
Received 29 October 2017
Accepted for publication 23 February 2018
Published 14 May 2018 Volume 2018:14 Pages 1241—1252
DOI https://doi.org/10.2147/NDT.S155478
Checked for plagiarism Yes
Review by Single anonymous peer review
Peer reviewer comments 3
Editor who approved publication: Professor Wai Kwong Tang
Muhua Huang,1,2 Fuqing Zhou,1,2 Lin Wu,1,2 Bo Wang,1,2 Hui Wan,3 Fangjun Li,3 Xianjun Zeng,1,2 Honghan Gong1,2
1Department of Radiology, The First Affiliated Hospital, Nanchang University, Nanchang, People’s Republic of China; 2Neuroradiology Laboratory, Jiangxi Province Medical Imaging Research Institute, Nanchang, People’s Republic of China; 3Department of Neurology, The First Affiliated Hospital, Nanchang University, Nanchang, People’s Republic of China
Background and purpose: The effects of the interactions between the default mode network (DMN) and the dorsal attention network (DAN), which present anticorrelated behaviors, in relapsing-remitting multiple sclerosis (RRMS) are poorly understood. This study used resting-state functional connectivity (FC) and the Granger causality test (GCT) to examine changes in the undirected and effective functional network connectivity (FNC) between the two networks during the remitting phase in RRMS patients.
Patients and methods: Thirty-three patients experiencing a clinically diagnosed remitting phase of RRMS and 33 well-matched healthy control subjects participated in this study. First, an independent component (IC) analysis was performed to preprocess the functional magnetic resonance imaging data and select resting-state networks. Then, an FNC analysis and the GCT were combined to examine the temporal correlations between the ICs of the DMN and DAN and to identify correlations with clinical markers.
Results: Compared with the healthy subjects, the RRMS patients in the remitting phase showed the following: 1) significantly decreased FC within the DAN in the postcentral gyrus and decreased FC within the DMN in several regions except the parahippocampal gyrus, where increased FC was observed; 2) a relatively stable interaction between the two anticorrelated networks as well as a driving connectivity from the DAN to DMN (IC15); and 3) significantly positive correlations between the connectivity coefficient of the right superior temporal gyrus and the Modified Fatigue Impact Scale score (ρ = 0.379, p = 0.036).
Conclusion: Adaptive mechanisms that maintain stable interactions might occur between the DMN and DAN during the remitting phase in RRMS patients.
Keywords: default mode network, dorsal attention network, multiple sclerosis, resting-state functional MRI, Granger causality test, anticorrelation
Introduction
Multiple sclerosis (MS) is a chronic disease that can cause inflammatory demyelination and neurodegeneration in white matter (WM) and gray matter. Although many studies have investigated the neuropathological basis of MS, less attention has been paid to understanding brain changes that occur during the remitting phase. As a functionally preserved phase, clinical functions may be maintained during the remitting phase via intrinsic functional network interactions to compensate for (or limit) neurological dysfunction.1 In particular, two of the resting-state brain networks, the default mode network (DMN) and the dorsal attention network (DAN), play crucial roles in this phase. However, because of interactions between the networks or variations regarding the use of in vivo large-scale imaging, these networks have not been fully characterized, and the exact mechanism underlying their interactions remains unclear.
Resting-state functional magnetic resonance imaging (rs-fMRI) has emerged as a powerful, noninvasive tool for revealing the functional network architecture of the human brain. The spontaneous fluctuations in blood oxygenation level-dependent signal measured during the “resting” state confirm that intrinsic networks persist across time2 and reflect the potential synaptic structure of neuronal brain activity. Thus far, several resting networks have been found in the human brain, such as the DMN, the DAN, the sensorimotor network, the salience network, the visual network, and the frontal parietal control network (FPCN).3,4 The DMN is formed by spontaneous neuronal activity in the resting state and includes several important components: the posterior cingulate cortex (PCC), medial prefrontal cortex, bilateral angular gyrus (AG), and bilateral hippocampus formation. These components are highly correlated with each other and form a relatively independent functional system. Functionally, the DMN is involved in internal psychological processing and external environmental monitoring, is associated with internally directed cognition,5,6 and exhibits decreased activation during many cognitive tasks that demand external perceptual attention.7 As two anticorrelated networks, the DMN is known as a “task-negative” network, and the DAN is known as a “task-positive” network. The DAN is involved in goal-oriented and attention-oriented control,8 is more associated with externally directed cognition,9 and exhibits increased activity during cognitive tasks that focus on external visuospatial attention.10 Anatomically, the DAN is an interconnected set of brain regions that includes the inferior parietal sulcus, frontal eye field, superior parietal lobule, anterior cingulate cortex, middle temporal motion complex, and dorsolateral prefrontal cortex.
Several studies have shown that MS can affect the DMN,11 even during the early stages of the disease.12,13 In our previous study, we observed decreased structural connectivity and compensatory increased functional connectivity (FC) in the connections of paired DMN subregions in relapsing-remitting MS (RRMS) patients.14 Attention is a complicated function involved in different cognitive domains, such as memory, language, action, and perception, and the need for selection and the limitations of resources arise at different levels of processing. Attention deficits occur during the early stages of MS prior to language and visuospatial dysfunction,15 and they are difficult to perceive compared with other dysfunctions, such as memory and executive ability. Therefore, the study of attention deficit is important for discovering the early signs of MS. Anticorrelation between the DMN and DAN is thought to be an intrinsic aspect of functional brain organization that reflects competing functions and potentially indicates a toggle between internally oriented and externally oriented cognitive processing. Kelly et al16 found that the strength of the correlation between the two networks varies across individuals, with a stronger negative correlation corresponding to a less variable behavioral performance. This relationship is observed in both “task” and “rest” states. However, studies have also demonstrated coactivation and positive FC between the DMN and the FPCN, which is a component of the “task-positive” network, during certain task conditions, including mind wandering,17 spontaneous thought,18 and working memory.19 This finding indicates that in certain cases, the cooperative dynamics between the FPCN and DMN are correlated with better task performance.20 However, the effect of the FC and functional network connectivity (FNC) analysis between the DMN and DAN in RRMS has not been previously established.
In this study, we hypothesized that alterations within and interactions between the DMN and DAN can also be detected during the remitting phase of RRMS. According to this hypothesis, we first attempted to compare the synchronization within the DMN and DAN of the remitting-phase RRMS patients and healthy controls (HCs) using an independent component analysis (ICA). Second, the FNC and the Granger causality test (GCT) were used to investigate the interactions between the DMN and DAN in patients experiencing the remitting phase of RRMS and HCs. Subsequently, a simple linear regression analysis was performed to assess the correlation between the clinical measures and altered connectivity coefficients in MS. This study might provide novel insights into the relationship between or the intrinsic interactions of the DMN and DAN in RRMS to enhance our understanding of the functional plasticity or reorganization of these patients.
Patients and methods
Subjects
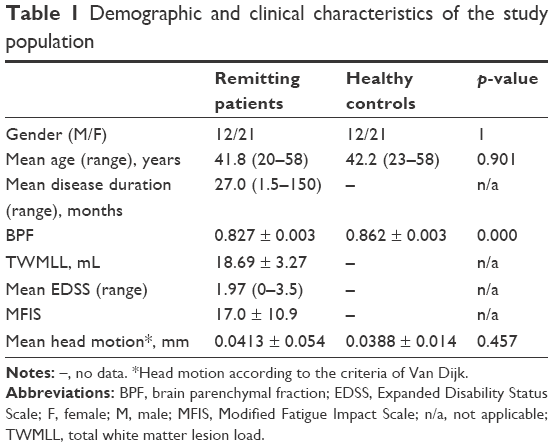
This case–control study was approved by the Medical Research Ethics Committee and the Institutional Review Board of the First Affiliated Hospital of Nanchang University, and all the subjects were informed and signed written consent forms. From May 2012 to December 2015, a total of 38 patients with clinically diagnosed RRMS and well-matched (age, gender, and education) HC subjects were recruited at the First Affiliated Hospital of Nanchang University according to revised McDonald’s criteria.21 The inclusion criteria for the patients were as follows: an RRMS course22 and a history of treatment with immunomodulatory medication (32 patients with β-interferons and six with glatiramer acetate). In this study, all the patients underwent MRI scans during the remitting phase and were not treated with disease-modifying medications (eg, corticosteroids or immune suppressants) within 2 weeks before the MRI examination. Well-matched HCs (sex, age, and education level) were recruited from the local community (Table 1). The control subjects had no history of hypertensive disease, traumatic brain injuries, neurological diseases, or brain abnormalities based on conventional MRI.
 | Table 1 Demographic and clinical characteristics of the study population |
Demographic, clinical, and neuropsychological assessments
Demographic, clinical, and neuropsychological characteristics, including age, sex, disease duration, Expanded Disability Status Scale (EDSS), 21-item Modified Fatigue Impact Scale (MFIS), and the Paced Auditory Serial Addition Test (PASAT), were recorded by an experienced neurologist (FL or HW, who have >10 years of experience in neurology).
Image acquisition
All MRI examinations were performed using a 3.0 T MRI scanner (Trio Tim; Siemens Medical Systems, Erlangen, Germany). Axial echo planar imaging sequences with the following characteristics were obtained for each patient: repetition time (TR)/echo time (TE) = 2,000/30 ms, flip angle = 90°, field of view (FOV) = 200 × 200 mm, matrix = 64 × 64, 30 interleaved axial slices, thickness = 4 mm, interslice gap = 1.2 mm, and functional volumes = 240. During rs-fMRI scanning, the patients were instructed to keep their eyes closed, not to think systematically, and not to fall asleep. A foam pad was used to minimize head motion. Three-dimensional high-resolution T1-weighted imaging (T1WI) sequences with the following characteristics were obtained: TR/TE = 1,900/2.26 ms, matrix = 240 × 256, FOV = 215 × 230 mm, number of excitations = 1, 176 sagittal slices, and slice = 1.0 mm. In addition, axial T2-weighted turbo spin-echo and fluid-attenuated inversion recovery sequences were performed for WM lesion detection.
Measurement of lesion loads and brain atrophy
Individual visible WM lesion masks were manually delineated based on their T2WI by an experienced neuroradiologist (FZ or XZ, who have >10 years of experience in neuroradiology). The total WM lesion loads (TWMLLs) were calculated as the volumes within the masks using MRIcron software. After co-registration with the T1WI, the T2WI was normalized into Montreal Neurological Institute (MNI) space, and this information was used to warp the lesion mask into the standard MNI dimensions. The lesion load calculated from the spatially normalized lesion mask (as the normalized TWMLL) reflected the lesion loads relative to the standard MNI brain volume to determine the controlled effects of differences in brain volume.23 To test the reproducibility, the manually delineated TWMLLs were measured on two separate occasions (at least 3 months apart) in the patients, and the inter-rater reliability was 92.8%.
The high-resolution T1WI data were segmented into GM, WM, and cerebrospinal fluid using the new segmentation algorithm provided in Statistical Parametric Mapping (SPM12). The GM and WM probability images were then registered and warped into MNI space using the aforementioned DARTEL process. The brain parenchymal fraction (BPF) was then calculated as the ratio of the brain parenchymal volume (GM and WM) to the intracranial volume (ICV).
Preprocessing of fMRI data
The fMRI data were preprocessed using a GNU/GPL toolbox for Data Processing & Analysis of Brain Imaging, which was run on the MATLAB 2012a platform (MathWorks, Inc., Natick, MA, USA). The standard preprocessing procedures have been described in our previous studies14,24 and those by others,23,25 and the present work is independent. In short, the main steps of preprocessing included discarding the first 10 volumes, slice correction, head realignment, spatial normalization to MNI space with high-resolution T1WI registration, resampling to 3 mm isotropic voxels, and smoothing (6 mm full width at half maximum Gaussian kernel). In addition, the subjects with head movement in the cardinal directions (x, y, z) of >2 mm and a maximum rotation (x, y, z) of >2° were excluded. We also evaluated the group differences in head motion among the remitting-phase RRMS patients and the HCs according to the criteria of Van Dijk et al26 (report in Table 1).
Group ICA
A group ICA of the preprocessed data was performed using Group ICA from the fMRI Toolbox (GIFT v4.0a). In the group ICA, we used the minimum description length criteria to estimate the number of components of all the subjects (number of subjects: M), which resulted in 39 components. The main steps included a single principle component analysis (PCA), group PCA, ICA, and back reconstruction. We performed the group ICA on the data from the HCs and the remitting-phase RRMS patients to ensure that all subjects had the same components. After standard preprocessing of the group ICA results, GIFT automatically labeled the components corresponding to the DAN and DMN via a template-matching algorithm. Each component was spatially correlated with the offering templates. The best template was obtained for the two selected resting-state networks (RSNs), that is, the DAN and DMN, based on the maximum correlation value. The average power spectrum of the independent component (IC) illustrated the features used to calculate the dynamic range and low frequency (LF, below 0.10 Hz) to high frequency (HF, between 0.15 and 0.25 Hz) power ratio. The RSNs were dominated by LF fluctuations with high PowerLF/PowerHF (scores of three or greater and no votes equal to zero). The votes from the four raters were tallied and used to separate the components into three broad classes: artifact (score equal to zero), mixed (score between zero and three), and RSN.
FC analysis
We performed Fisher’s r-to-z transformation on the DAN and DMN components to improve the normality of the components. Then, two-sample t-tests were applied to compare the components (subnetworks) of the two groups, with age and gender as covariates. Two-tailed Gaussian random field (GRF) corrections at the voxel level (p < 0.01) and cluster level (p < 0.05) were used to perform multiple testing corrections.
FNC analysis
The FNC was analyzed using the FNC toolbox (v2.3) to determine the temporal correlation between the components (subnetworks) obtained by the ICA. The direct possibility was calculated using the constrained maximal lagged correlation coefficient (δXY) between each pair of subnetworks. Assume that  occurs at the initial reference point i0
  and that
  circularly shifted Δi units from reference point of i0
  ; using this approach,27 individual correlations and lag values of components (subnetworks) were calculated as follows:
|
|
where and represent the corresponding time courses of two subnetworks, i0 represents the starting reference point of the two original time courses, T represents the number of time points in the time course, and Δi represents the noninteger change in time (lag time, maximal t = 2TR). The maximal correlation value and corresponding lag, δXY, were saved for time courses and . The lag values represent the amount of delay between two correlated component time courses averaged across the patients and controls.
We calculated all 5 × (5 – 1)/2 = 10 pair-wise combinations and then conducted one-sample t-tests to determine the significance of the combination (p < 0.05, false discovery rate corrected). Two-sample t-tests were subsequently applied to detect the abnormal connections within the subnetworks and between the subnetworks, with age, gender, and TWMLL as covariates.
GCT in the spectral domain
The GCT in the spectral domain was used to describe and investigate the causal relationships between brain network components (subnetworks).28 We also used the FNC to analyze the time series corresponding to ICs. The optimal order of the autoregressive (AR) model was selected based on a given interval and an order selection criterion. The model can be described as follows:
| (2) |

| (3) |
where ak, bk, ck, and dk are the best fit regressors; m is the order of the AR model; and εt and ηt are two zero-mean uncorrelated white-noise series. Granger presented a definition of causality feedback utilizing the noise terms (εt and ηt) in Equations 2 and 3 and stated that Y(X) causes X(Y), Y ⇒ X (X ⇒ Y).
Relationship with clinical measures
We investigated the relationship between abnormal FC values, abnormal FNC coefficients, and clinical and neuropsychological characteristics during the remitting phase of RRMS while controlling for age, gender, and ICV. This correlation analysis was conducted via a partial correlation analysis using SPSS software (release 13.0; SPSS Inc, Chicago, IL, USA), and the relationship was significant if the p-value was <0.05.
Results
Demographic and clinical data
Thirty-three remitting-phase RRMS patients and well-matched HCs were included in this study. The demographic and clinical characteristics of the remitting-phase RRMS patients and the HCs are summarized in Table 1. Significant differences in the BPF were observed between the remitting-phase RRMS patients and the HC subjects.
Spatial distribution of the DAN and DMN
The functional data were divided into 39 ICs by the group ICA. After spatial correlation with the network template and identification by experts, four ICs–IC12, IC15, IC23, and IC38 (correlation coefficients: 0.548, 0.314, 0.362, and 0.552, respectively) – were identified as the DMN. We also found IC09 (correlation coefficient: 0.441), which was identified as the DAN. These ICs had high PowerLF/PowerHF as shown in Figure 1; this figure also illustrates, by visual inspection, certain differences in the spatial distribution of FC in the DAN and DMN between the two groups.
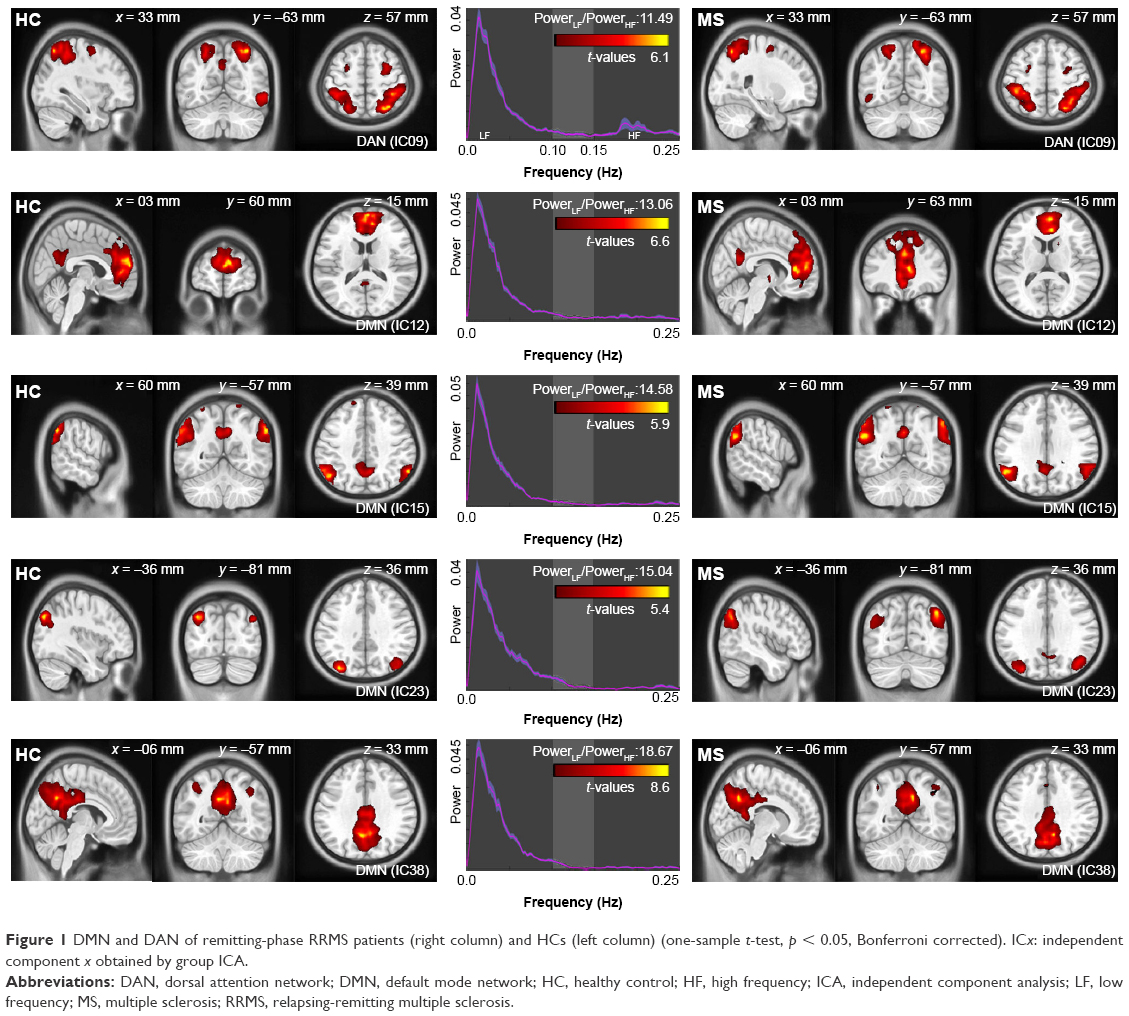 | Figure 1 DMN and DAN of remitting-phase RRMS patients (right column) and HCs (left column) (one-sample t-test, p < 0.05, Bonferroni corrected). ICx: independent component x obtained by group ICA. |
FC analysis
Two-sample t-tests were performed to compare the ICs (subnetworks) of the DAN and DMN between the two groups. We found that the FCs in the left postcentral gyrus (POCG) of IC09, right superior frontal gyrus (SFG) and right AG of IC12, and right superior temporal gyrus (STG) of IC23 were significantly decreased, whereas the FC in the right parahippocampal gyrus (pHipp) of IC23 was significantly increased during the remitting phase in RRMS patients between the two groups (two-tailed voxel-level p < 0.01 and cluster-level p < 0.05, with GRF correction; Table 2 and Figure 2).
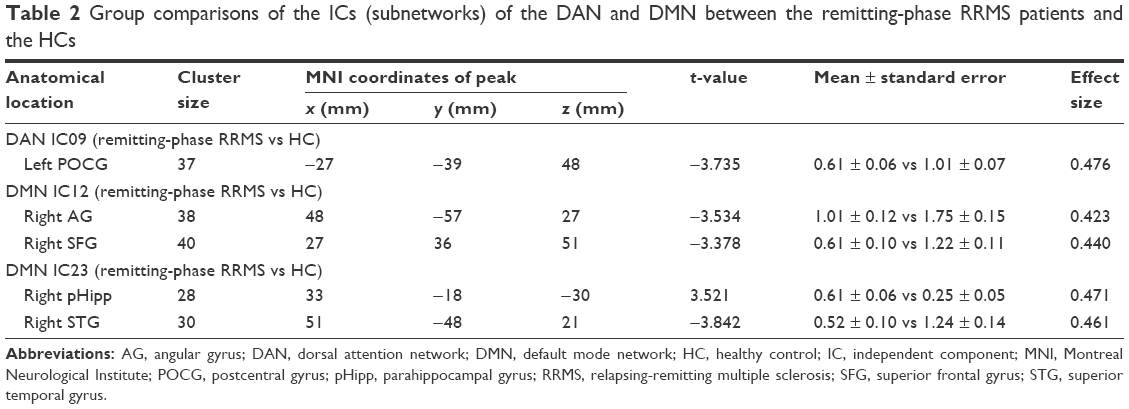 | Table 2 Group comparisons of the ICs (subnetworks) of the DAN and DMN between the remitting-phase RRMS patients and the HCs |
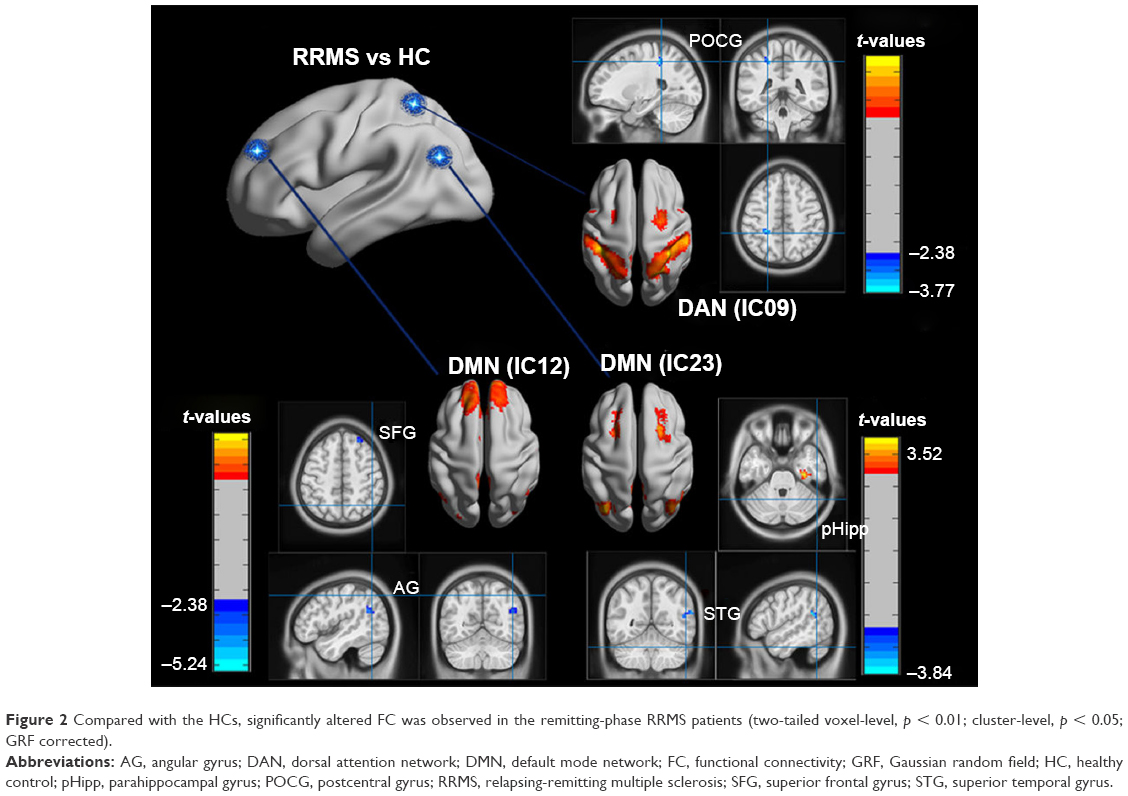 | Figure 2 Compared with the HCs, significantly altered FC was observed in the remitting-phase RRMS patients (two-tailed voxel-level, p < 0.01; cluster-level, p < 0.05; GRF corrected). |
FNC analysis
We calculated the maximal lagged correlation coefficients of the ICs (subnetworks) in the DAN and DMN between the two groups. The coefficients between the components of two groups are shown in Figure 3. The remitting phase of RRMS showed a significantly positive correlation between IC23 and IC22, IC23 and IC15, IC23 and IC38, IC12 and IC15, IC12 and IC38, IC09 and IC15, IC09 and IC38, and IC15 and IC38. All the correlation coefficients between two components were significantly positive in the HCs except for the coefficient between IC12 and IC09. However, in the comparisons of coefficients between the two groups, we did not find significantly different coefficients.
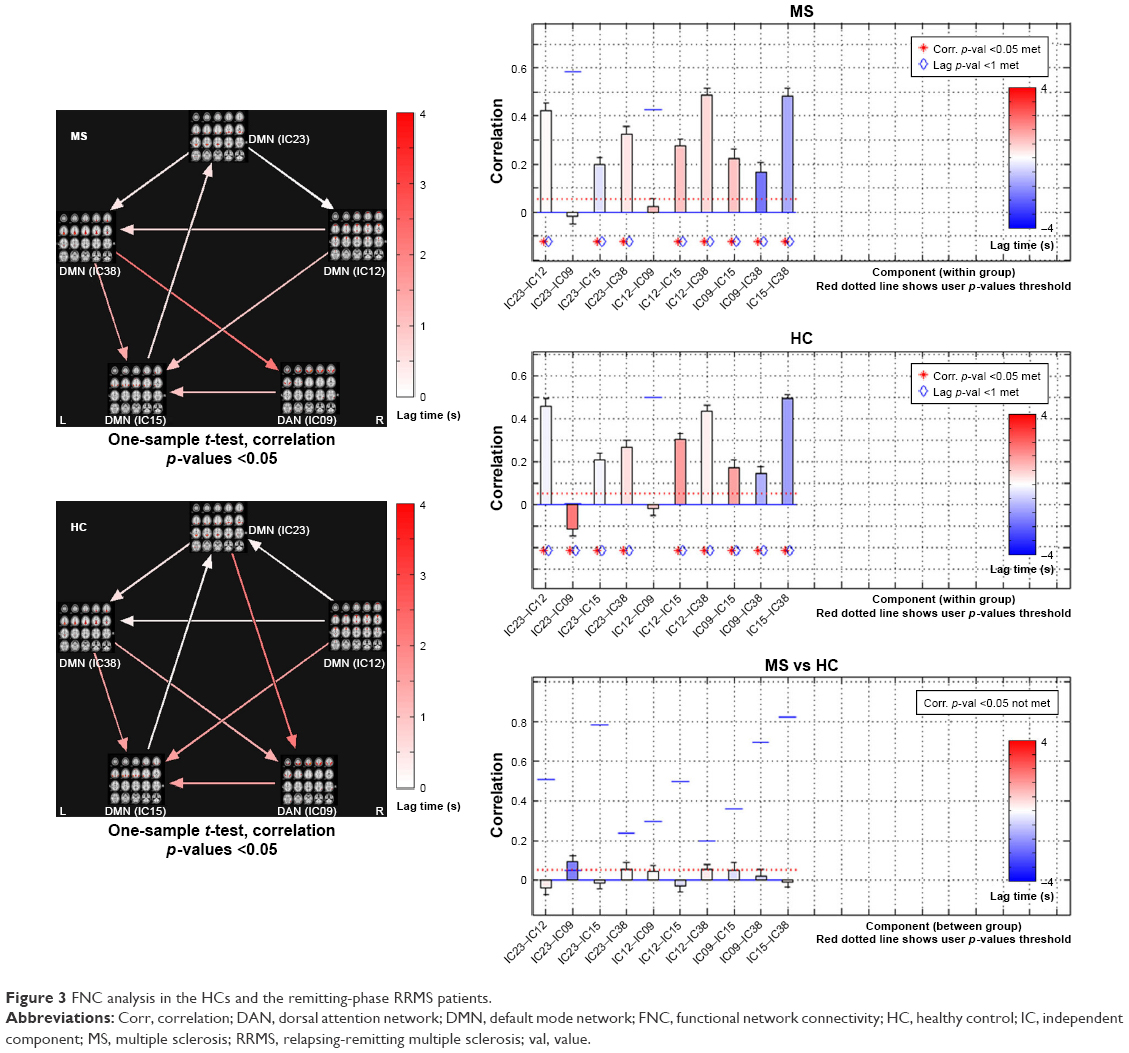 | Figure 3 FNC analysis in the HCs and the remitting-phase RRMS patients. |
GCT in the spectral domain of the functional network
We also used the GCT to investigate the causal relationships between ICs (subnetworks) in the DAN and DMN. In the comparisons of the causality effects between the two groups, the remitting-phase RRMS patients had a significantly increased driving connectivity from the DAN to DMN (IC15; Figure 4).
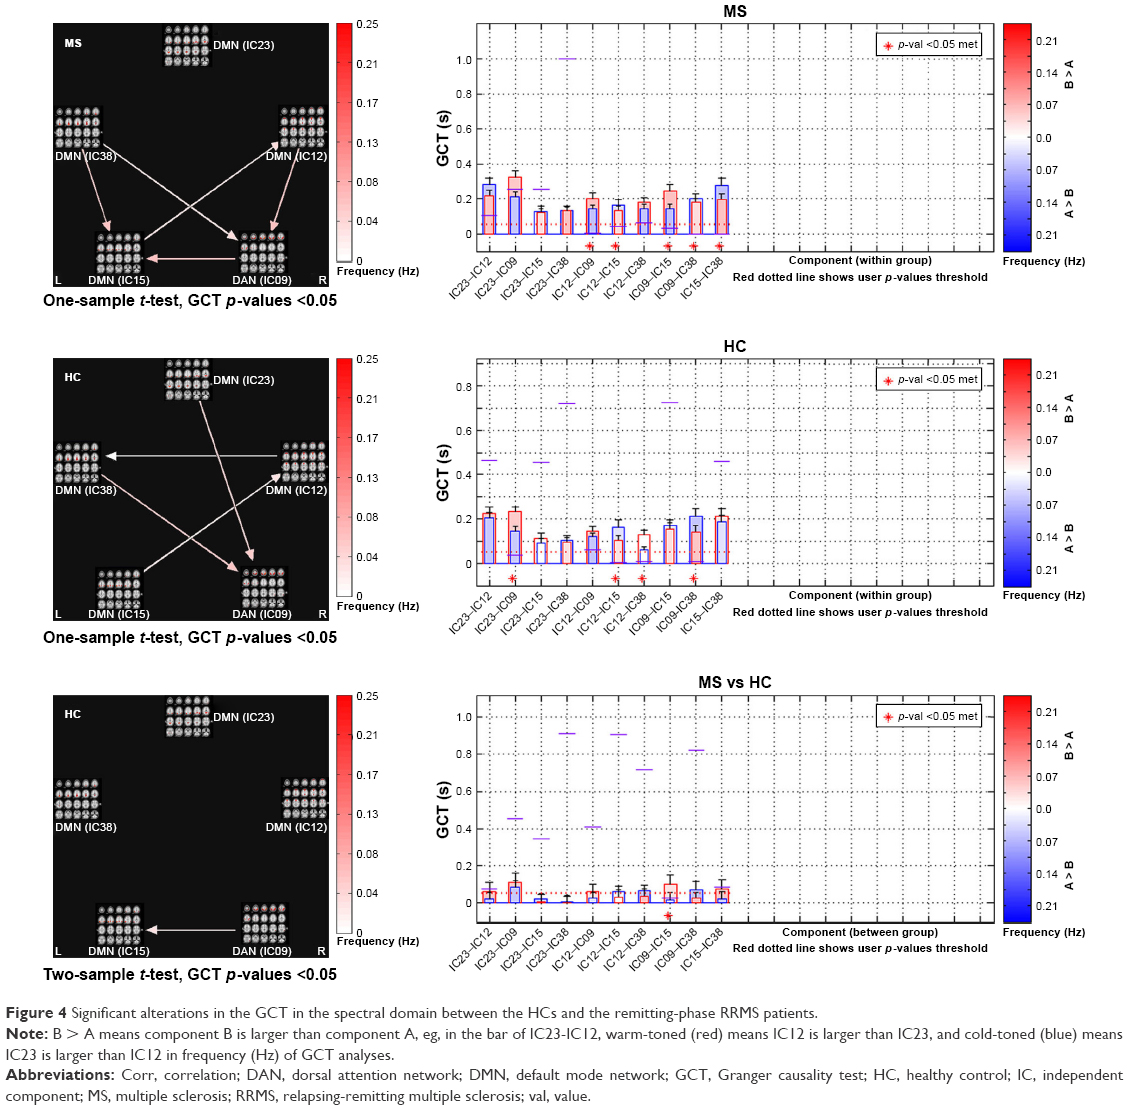 | Figure 4 Significant alterations in the GCT in the spectral domain between the HCs and the remitting-phase RRMS patients. |
Relationship with clinical measures in the remitting-phase RRMS patients
Figure 5 shows the relationship between clinical measures and altered connectivity between ICs (subnetworks) in the DAN and DMN in the remitting-phase patients. Only the ICA coefficient of the right STG was significantly positively correlated with the MFIS score (ρ = 0.379, p = 0.036). The other abnormal FNC coefficients did not show significant correlations with the clinical parameters (including TWMLL, BPF, EDSS, PASAT, and disease duration).
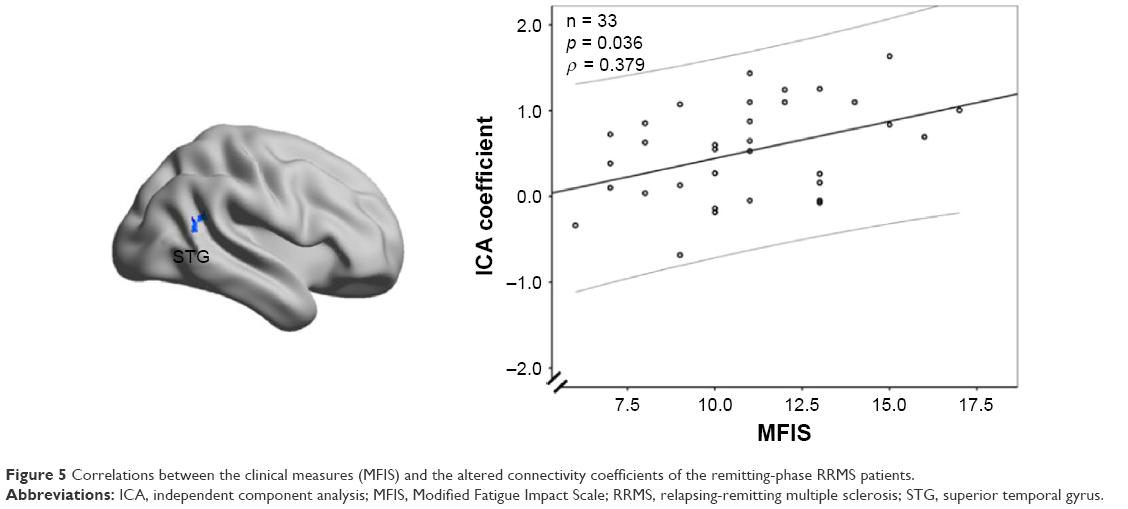 | Figure 5 Correlations between the clinical measures (MFIS) and the altered connectivity coefficients of the remitting-phase RRMS patients. |
Discussion
The main findings of this study were as follows: 1) fatigue scores related to hypoactivity occurred within the DAN and DMN in the remitting-phase RRMS patients, although increased FC was observed in the right pHipp; and 2) a relatively stable interaction occurred between the two anticorrelated networks, although increased driving connectivity was observed from DAN to DMN (IC15). Although prior work has suggested that the DMN–DAN anticorrelation is an intrinsic aspect of functional brain organization,29 our preliminary findings suggest that adaptive mechanisms underlie the maintenance of the stable interaction between the DMN and DAN in the remitting-phase RRMS patients.
Altered FC within the DAN and DMN in the remitting-phase RRMS patients
In our study, a similar spatial distribution was detected in the activity patterns of both the DAN and DMN in the remitting-phase RRMS patients and HCs (Figure 1). However, in the DMN, the remitting-phase RRMS patients showed decreased FCs in the right AG, right SFG, and right STG (Figure 2 and Table 2). First, the AG is a crucial parietal posterior node within the DMN that supports semantic and language processing as well as spatial attention and memory functions.30 In a previous study, a memory loss-associated reduction in activity of the AG was demonstrated in patients with mild cognitive impairment.31,32 In MS, the changed FC (driven by the AG) with the rest of the brain correlated with worse cognitive performance, which indicated that cognitive impairment in MS features disturbed network communication.33 Next, the SFG may contribute to higher cognitive functions,34 such as spatially oriented processing and working memory, and it is also associated with long-lasting deficits in complex motor functions.35 In previous RRMS studies,11,36 lower connectivity was detected in the right SFG within the DMN, and a negative correlation was observed between connectivity and the course of the disease. A decreased FC in the right SFG may be interpreted as a decrease in the effective connectivity (via direct anatomical connections) in the synchronization of spontaneous activity37 and/or the destruction of WM integrity.36 In addition, the STG contributes to working memory and global cognitive performance. In MS patients, structural damage to the STG has been specifically related to attention and information-processing speed abnormalities.38 Additionally, the correlation analysis showed that only the ICA coefficient of the right STG was significantly positively correlated with the MFIS score (ρ = 0.379, p = 0.036) in the RRMS group after controlling for age, gender, and ICV. Our findings are analogous to previous related fMRI studies, which found that, compared with patients with early MS and clinically isolated syndrome or the HCs, altered recruitment of the STG is accompanied by worse task performance in RRMS patients.39 Combined with the decreased FC observed in the right STG, these findings may demonstrate the decreased synchronization between neurons of homologous STG with increasing fatigue.40 This hypothesis is consistent with reports indicating that the dysfunction of critical cortical areas contributes to the occurrence of central fatigue.41
Compared with the HCs, we also observed a decrease in the left POCG in the DAN in the remitting-phase RRMS patients. POCG is the center of the sensorimotor region, and the decreased FC observed in MS may indicate a reduction in the corresponding performance of the MS patients. Furthermore, our analysis showed an increase in the FC of the right pHipp in the DMN in remitting-phase RRMS patients. The pHipp is an important structure for memory encoding and retrieval and an essential component for cognition; it would be expected to exhibit deactivation during external cognitive demands.5 In a further study, the functional interactions between the DMN and hippocampal and pHipp areas as well as the primary visual cortex correlate with the speed of accurate responses.42 Therefore, we postulated that the increased right pHipp connectivity within the DMN represents a functional compensation, which suggests that MS patients tend to recruit more attention and executive control resources to support memory processes.
Relatively stable interactions between the DAN and DMN in the remitting-phase RRMS patients
In both the RRMS patients and the HCs, the DAN and DMN subnetworks showed similarly positive correlations except for the coefficient of IC12 (of DMN)–IC09 (of DAN). The DMN and DAN feature typical patterns of anticorrelated activity.43 Functional anticorrelations between the two networks are observed in the implementation of cognitively related tasks as well as in spontaneous fluctuations in brain activity during resting states. These findings indicate a context-dependent FC pattern that induces variations in the FNC, which functions as a dynamic system that flexibly adapts to changes in internal and external states; thus, the FC patterns appear to be adaptive and correlated with task performance.44,45 Mild structural disorders can trigger functional reorganization or compensation in MS12 to maintain the integrity of the functional network as much as possible. In this study, significant differences were not observed in the subnetworks between the RRMS patients and HCs; potentially, the DAN–DMN FC may present a degree of stability in the remitting-phase RRMS patients. In other words, intrinsic changes or dynamic activity between DMN and DAN may be a normal part of maintaining function.
In our study, the GCT analysis showed that the remitting-phase RRMS patients presented a significantly increased driving connectivity from DAN to (IC15 of) DMN, which may indicate the existence of network configurations during the resting state and may represent an adaptive mechanism underlying the maintenance of stable interactions between the DMN and DAN via increases in the information transmission capacity. Undeniable, systematic differences across brain regions in hemodynamic lag may overestimate this “causality”46 to a certain extent. It is not a “direct interaction” between two regions if the third region provides common input to the two regions, even if the two regions are not directly influencing each other, but this result represents the general direction of the information flow between the DMN and DAN. These findings also indicate that the anticorrelation behavior between the DAN and DMN is real but dynamic and may be related to other factors, such as cognitive impairment, disease duration, or individual variations.47 Evidence suggests that the overall activation levels may represent orthogonal to functional coupling patterns.48 For example, a previous study found that the PCC (a hub of DMN) exhibited diminished activation levels during a demanding semantic task, although it simultaneously exhibited increased functional coupling within “task-positive” regions.49 Thus, ongoing DAN–DMN inter-regional interactions may support information processing that is, to some extent, independent of task-related FC alterations.
Limitations
Our study presented certain limitations. First, the acquired images presented limited spatial and time resolution because of the 4 mm slice thickness and 2-second TR. Thus, higher-resolution fMRI studies should be conducted in the future, especially with shorter TR scanning for lag-based neural research on causality using fMRI data. Reliability of the estimation of the directionality of the connection from fMRI time series should be addressed in future studies. Second, the number of paired subjects was relatively low; therefore, a larger sample should be used in future studies. Third, one precondition of this study was that the remitting phase of the RRMS patients was at the same level, relatively stable with the integration of the cognitive state, and individual differences in the network were neglected; therefore, a detailed cognitive assessment should be involved in future studies. In addition, it should be noted that the correlation obtained was relatively weak and ignores the fact that a number of other correlations were also performed in this study. The relationship of the DMN–DAN FC changes based on the disease duration and individual differences and cognitive levels should be studied further. Finally, although unlikely, we cannot exclude the presence of fatigue in the HCs because these subjects did not undergo an MFIS assessment.
Conclusion
In summary, we found that a relatively stable relationship occurs between the DMN and DAN when decreased FC occurs, although an increased FC of the right pHipp was observed in the remitting-phase RRMS patients. These findings, together with the increased driving connectivity from the DAN to (IC15 of) the DMN, highlight the complexity of the interactions between large-scale networks that might act as adaptive reserves to respond to MS damage during the remitting phase in RRMS patients.
Acknowledgments
This study was supported by the National Science Foundation of China (grant no 81101041 and 81560284), the Natural Science Foundation of Jiangxi, People’s Republic of China (grant no 20161BAB205245 and 2017BAB215048), and the Distinguished Young Scholars of Jiangxi Province (grant no 2017BCB23089). The authors thank their patients and volunteers for participating in this study. The funders had no role in the study design, data collection and analysis, decision to publish, or preparation of the manuscript.
Author contributions
All authors contributed toward data analysis, drafting and revising the paper and agree to be accountable for all aspects of the work.
Disclosure
The authors report no conflicts of interest in this work.
References
Tomassini V, Johansen-Berg H, Jbabdi S, et al. Relating brain damage to brain plasticity in patients with multiple sclerosis. Neurorehabil Neural Repair. 2012;26(6):581–593. | ||
Damoiseaux JS, Rombouts SARB, Barkhof F, et al. Consistent resting-state networks across healthy subjects. Proc Natl Acad Sci U S A. 2006;103(37):13848–13853. | ||
van den Heuvel MP, Hulshoff Pol HE. Exploring the brain network: a review on resting-state fMRI functional connectivity. Eur Neuropsychopharmacol. 2010;20(8):519–534. | ||
Liang X, Zou Q, He Y, Yang Y. Topologically reorganized connectivity architecture of default-mode, executive-control, and salience networks across working memory task loads. Cereb Cortex. 2016;26(4):1501–1511. | ||
Andrews-Hanna JR, Reidler JS, Sepulcre J, Poulin R, Buckner RL. Functional-anatomic fractionation of the brain’s default network. Neuron. 2010;65(4):550–562. | ||
Buckner RL, Andrews-Hanna JR, Schacter DL. The brain’s default network: anatomy, function, and relevance to disease. Ann N Y Acad Sci. 2008;1124:1–38. | ||
Greicius MD, Krasnow B, Reiss AL, Menon V. Functional connectivity in the resting brain: a network analysis of the default mode hypothesis. Proc Natl Acad Sci U S A. 2003;100(1):253–258. | ||
Scalf PE, Ahn J, Beck DM, Lleras A. Trial history effects in the ventral attentional network. J Cogn Neurosci. 2014;26(12):2789–2797. | ||
Corbetta M, Shulman GL. Control of goal-directed and stimulus-driven attention in the brain. Nat Rev Neurosci. 2002;3(3):201–215. | ||
Miller EK, Buschman TJ. Cortical circuits for the control of attention. Curr Opin Neurobiol. 2013;23(2):216–222. | ||
Bonavita S, Gallo A, Sacco R, et al. Distributed changes in default-mode resting-state connectivity in multiple sclerosis. Mult Scler. 2011;17(4):411–422. | ||
Roosendaal SD, Schoonheim MM, Hulst HE, et al. Resting state networks change in clinically isolated syndrome. Brain. 2010;133(Pt 6):1612–1621. | ||
Hardmeier M, Schoonheim MM, Geurts JJ, et al. Cognitive dysfunction in early multiple sclerosis: altered centrality derived from resting-state functional connectivity using magneto-encephalography. PLoS One. 2012;7(7):e42087. | ||
Zhou F, Zhuang Y, Gong H, et al. Altered inter-subregion connectivity of the default mode network in relapsing remitting multiple sclerosis: a functional and structural connectivity study. PLoS One. 2014;9(7):e101198. | ||
Yeo BT, Krienen FM, Sepulcre J, et al. The organization of the human cerebral cortex estimated by intrinsic functional connectivity. J Neurophysiol. 2011;106(3):1125–1165. | ||
Kelly AM, Uddin LQ, Biswal BB, Castellanos FX, Milham MP. Competition between functional brain networks mediates behavioral variability. Neuroimage. 2008;39(1):527–537. | ||
Christoff K. Undirected thought: neural determinants and correlates. Brain Res. 2012;1428:51–59. | ||
Ellamil M, Fox KC, Dixon ML, et al. Dynamics of neural recruitment surrounding the spontaneous arising of thoughts in experienced mindfulness practitioners. Neuroimage. 2016;136:186–196. | ||
Meyer ML, Spunt RP, Berkman ET, Taylor SE, Lieberman MD. Evidence for social working memory from a parametric functional MRI study. Proc Natl Acad Sci U S A. 2012;109(6):1883–1888. | ||
Fornito A, Harrison BJ, Zalesky A, Simons JS. Competitive and cooperative dynamics of large-scale brain functional networks supporting recollection. Proc Natl Acad Sci U S A. 2012;109(31):12788–12793. | ||
Polman CH, Reingold SC, Banwell B, et al. Diagnostic criteria for multiple sclerosis: 2010 revisions to the McDonald criteria. Ann Neurol. 2011;69(2):292–302. | ||
Hurwitz B. The diagnosis of multiple sclerosis and the clinical subtypes. Ann Indian Acad Neur. 2009;12(4):226–230. | ||
Liu Y, Wang H, Duan Y, et al. Functional brain network alterations in clinically isolated syndrome and multiple sclerosis: a graph-based connectome study. Radiology. 2017;282(2):534–541. | ||
Zhou F, Gong H, Chen Q, et al. Intrinsic functional plasticity of the thalamocortical system in minimally disabled patients with relapsing-remitting multiple sclerosis. Front Hum Neurosci. 2016;10:2. | ||
Yan CG, Wang XD, Zuo XN, Zang YF. DPABI: data processing & analysis for (resting-state) brain imaging. Neuroinformatics. 2016;14(3):339–351. | ||
Van Dijk KR, Sabuncu MR, Buckner RL. The influence of head motion on intrinsic functional connectivity MRI. Neuroimage. 2012;59(1):431–438. | ||
Jafri MJ, Pearlson GD, Stevens M, Calhoun VD. A method for functional network connectivity among spatially independent resting-state components in schizophrenia. Neuroimage. 2008;39(4):1666–1681. | ||
Demirci O, Stevens MC, Andreasen NC, et al. Investigation of relationships between fMRI brain networks in the spectral domain using ICA and Granger causality reveals distinct differences between schizophrenia patients and healthy controls. Neuroimage. 2009;46(2):419–431. | ||
Dixon ML, Andrews-Hanna JR, Spreng RN, et al. Interactions between the default network and dorsal attention network vary across default subsystems, time, and cognitive states. Neuroimage. 2017;147:632–649. | ||
Trelle A. Decoding the role of the angular gyrus in the subjective experience of recollection. J Neurosci. 2014;34(43):14167–14169. | ||
Liang P, Wang Z, Yang Y, Li K. Three subsystems of the inferior parietal cortex are differently affected in mild cognitive impairment. J Alzheimers Dis. 2012;30(3):475–487. | ||
Wendelken C. Meta-analysis: how does posterior parietal cortex contribute to reasoning? Front Hum Neurosci. 2014;8:1042. | ||
Meijer K, Eijlers A, Douw L, et al. Increased connectivity of hub networks and cognitive impairment in multiple sclerosis. Neurology. 2017;88(22):2107–2114. | ||
du Boisgueheneuc F, Levy R, Volle E, et al. Functions of the left superior frontal gyrus in humans: a lesion study. Brain. 2006;129(Pt 12):3315–3328. | ||
Martino J, Gabarros A, Deus J, et al. Intrasurgical mapping of complex motor function in the superior frontal gyrus. Neuroscience. 2011;179:131–142. | ||
Reuter F, Del Cul A, Malikova I, et al. White matter damage impairs access to consciousness in multiple sclerosis. Neuroimage. 2009;44(2):590–599. | ||
Matsui T, Tamura K, Koyano KW, et al. Direct comparison of spontaneous functional connectivity and effective connectivity measured by intracortical microstimulation: an fMRI study in macaque monkeys. Cereb Cortex. 2011;21(10):2348–2356. | ||
Achiron A, Chapman J, Tal S, et al. Superior temporal gyrus thickness correlates with cognitive performance in multiple sclerosis. Brain Struct Funct. 2013;218(4):943–950. | ||
Vacchi L, Rocca M, Meani A, et al. Working memory network dysfunction in relapse-onset multiple sclerosis phenotypes: a clinical-imaging evaluation. Mult Scler. 2017;23(4):577–587. | ||
Cogliati Dezza I, Zito G, Tomasevic L, et al. Functional and structural balances of homologous sensorimotor regions in multiple sclerosis fatigue. J Neurol. 2015;262(3):614–622. | ||
Rocca MA, Meani A, Riccitelli GC, et al. Abnormal adaptation over time of motor network recruitment in multiple sclerosis patients with fatigue. Mult Scler. 2016;22(9):1144–1153. | ||
Vatansever D, Menon DK, Stamatakis EA. Default mode contributions to automated information processing. Proc Natl Acad Sci U S A. 2017;114(48):12821–12826. | ||
Alnaes D, Kaufmann T, Richard G, et al. Attentional load modulates large-scale functional brain connectivity beyond the core attention networks. Neuroimage. 2015;109:260–272. | ||
Anderson JS, Ferguson MA, Lopez-Larson M, Yurgelun-Todd D. Connectivity gradients between the default mode and attention control networks. Brain Connect. 2011;1(2):147–157. | ||
Hermundstad AM, Brown KS, Bassett DS, et al. Structurally-constrained relationships between cognitive states in the human brain. PLoS Comput Biol. 2014;10(5):e1003591. | ||
Smith SM, Miller KL, Salimi-Khorshidi G, et al. Network modelling methods for FMRI. Neuroimage. 2011;54(2):875–891. | ||
Esposito R, Cieri F, Chiacchiaretta P, et al. Modifications in resting state functional anticorrelation between default mode network and dorsal attention network: comparison among young adults, healthy elders and mild cognitive impairment patients. Brain Imaging Behav. 2018;12(1):127–141. | ||
Murphy AC, Gu S, Khambhati AN, et al. Explicitly linking regional activation and function connectivity: community structure of weighted networks with continuous annotation. Neuroimage. 2016. arXiv:1611.07962. | ||
Krieger-Redwood K, Jefferies E, Karapanagiotidis T, et al. Down but not out in posterior cingulate cortex: deactivation yet functional coupling with prefrontal cortex during demanding semantic cognition. Neuroimage. 2016;141:366–377. |
 © 2018 The Author(s). This work is published and licensed by Dove Medical Press Limited. The
full terms of this license are available at https://www.dovepress.com/terms
and incorporate the Creative Commons Attribution
- Non Commercial (unported, 3.0) License.
By accessing the work you hereby accept the Terms. Non-commercial uses of the work are permitted
without any further permission from Dove Medical Press Limited, provided the work is properly
attributed. For permission for commercial use of this work, please see paragraphs 4.2 and 5 of our Terms.
© 2018 The Author(s). This work is published and licensed by Dove Medical Press Limited. The
full terms of this license are available at https://www.dovepress.com/terms
and incorporate the Creative Commons Attribution
- Non Commercial (unported, 3.0) License.
By accessing the work you hereby accept the Terms. Non-commercial uses of the work are permitted
without any further permission from Dove Medical Press Limited, provided the work is properly
attributed. For permission for commercial use of this work, please see paragraphs 4.2 and 5 of our Terms.