Back to Journals » International Journal of General Medicine » Volume 19
Symptom Network Evolution and Longitudinal Interrelationships in Early-Stage Lung Cancer Patients Postoperatively
Authors Liu Y, Kang J, Bai M, Liu J, Xu J, Yi H
Received 2 February 2026
Accepted for publication 8 April 2026
Published 25 April 2026 Volume 2026:19 593518
DOI https://doi.org/10.2147/IJGM.S593518
Checked for plagiarism Yes
Review by Single anonymous peer review
Peer reviewer comments 2
Editor who approved publication: Dr Ching-Hsien Chen
Yali Liu,1,* Jianle Kang,1,* Meirong Bai,1,* Jiayu Liu,2 Jinxin Xu,1 Huochun Yi3
1Department of Thoracic Surgery, Zhongshan Hospital Xiamen University, School of Medicine, Xiamen University, Xiamen, Fujian, People’s Republic of China; 2Fujian University of Traditional Chinese Medicine, Fuzhou, Fujian, People’s Republic of China; 3Center of Clinical Laboratory, Zhongshan Hospital Xiamen University, School of Medicine, Xiamen University, Xiamen, Fujian, People’s Republic of China
*These authors contributed equally to this work
Correspondence: Jinxin Xu, Department of Thoracic Surgery, Zhongshan Hospital Xiamen University, School of Medicine, Xiamen University, Xiamen, Fujian, People’s Republic of China, Email [email protected] Huochun Yi, Center of Clinical Laboratory, Zhongshan Hospital Xiamen University, School of Medicine, Xiamen University, Xiamen, Fujian, People’s Republic of China, Email [email protected]
Objective: To analyze and construct symptom networks at four postoperative time-points in early-stage lung cancer patients using cross-lagged panel networks (CLPN), so as to examine their dynamic evolution and longitudinal predictive relationships.
Methods: This prospective study captured the incidence and severity of symptoms in patients by employing the Postoperative Symptom Scale for Lung Cancer on postoperative day 1 (T1), day 3 (T2), day 30 (T3) and day 90 (T4). Partial-correlation networks and CLPN were built in R Language, key nodes were identified using longitudinal data to explore the predictive/reciprocal effects among symptoms.
Results: Partial-correlation networks showed that fatigue (D4) and dizziness (D5) had the highest strength centrality at T1, pain (D2) and fatigue (D4) were most central at T2, insomnia (D8) and cough (D1) dominated at T3, and insomnia (D8) alone was most central at T4. Furthermore, CLPN revealed that fatigue (D4) exerted the greatest out-expected influence during T1→T2, with the strongest predictive path from T1-fatigue to T2-insomnia. While pain (D2) became the most influential sender during T2→T3, with the strongest predictive path from T2-pain to T3-shortness of breath. There is a time-dynamic postoperative symptom network in early-stage lung cancer patients, with core symptoms shifting across the recovery trajectory.
Conclusion: Findings in our study highlight the adoption of time-specific symptom management, targeting the dominant symptoms at each phase to achieve precision care and optimize patients’ postoperative recovery course.
Keywords: lung cancer patients, postoperative symptoms, partial correlation analysis, cross-lagged network analysis
Introduction
Lung cancer is on the global top list of the most common malignancy, with persistent high morbidity and serving as the leading cause of cancer-related death, constituting a major public-health challenge.1,2 Surgical resection remains the cornerstone of curative-intent treatment for patients with early-stage or selected locally advanced disease.3,4 The widespread adoption of low-dose spiral computed tomography for lung cancer screening has markedly increased the detection of early-stage lesions, enabling the implementation of surgery for more patients and thereby improving their 5-year postoperative survival.5,6 However, curative-intent lung cancer operations such as lobectomy or segmentectomy inflict considerable trauma. In most cases, patients may experience a cluster of physiological and psychological symptoms whose burden differs markedly across recovery phases.7 In particular, patients have been reported to carry a high symptom burden throughout the peri-operative period, with pain, cough, dyspnoea and fatigue being the most prevalent complaints.8 Rather than occurring in isolation, these symptoms interact dynamically and form complex symptom systems that can exert sustained detrimental effects on functional recovery and quality of life.9 Recently, network approaches have conceptualized symptoms as interacting nodes. These methods can quantify the strength of inter-symptom connections, thereby identifying centrally positioned symptoms that may drive the evolution of the entire symptom clusters.10,11 Prioritized intervention targeting these core symptoms is expected to contribute to a more efficient reduction of the overall symptom burden.12,13 To date, however, most lung cancer studies have used cross-sectional designs, with the absence of elucidating the evolutionary path of these symptom networks over time.14 Accordingly, by constructing multi-time-point, dynamic symptom networks after early-stage lung cancer surgery, the present study was designed to delineate their developmental trajectories and longitudinal predictive relations. It is anticipated to provide an evidence base for staged, precision postoperative symptom management.
Methods
Study Participants
Between January and July 2024 in a tertiary-grade A comprehensive hospital in Xiamen, this study enrolled early-stage lung cancer patients who underwent surgical treatment using convenience sampling. Eligible patients should meet the following inclusion criteria: ① age ≥ 18 years; ② pathological diagnosis of primary bronchogenic carcinoma stage I or II; ③ first-onset disease scheduled for surgery; and ④ clear mind with possessing certain abilities to read and understand questionnaires. Patients were excluded when they had: ① palliative operation or biopsy only; ② preoperative or postoperative (during follow-up) radiotherapy or chemotherapy; ③ severe cardio-cerebrovascular diseases, hepatic or renal insufficiency, or other serious comorbidities; and ④ incomplete data. Through estimation by the Kendall’s method,15 the final sample size of this study were 422 patients. Complied with the Declaration of Helsinki, the study was approved by Zhongshan Hospital Xiamen University ethics committee (Ethical approval number: XMZSYYKY-2024-050), and all patients gave informed consent.
Survey Instruments: Postoperative Symptom Scale for Lung Cancer Patients
The Postoperative Symptom Scale for Lung Cancer, developed by Wang Ming-ming et al in 2017, was employed to assess symptoms in patients after early-stage lung cancer surgery.16 It contains four sections: ① the most bothersome symptom, including ten items of cough, pain, shortness of breath, fatigue, dizziness, nausea/vomiting, subcutaneous emphysema, insomnia, constipation, and others; ② patient-reported severity rated as none, mild, moderate, or severe; ③ an 11-point numeric rating (0 = no symptom, 1–3 = mild, 4–6 = moderate, 7–10 = severe) for each symptom, with higher scores indicating greater severity; and ④ additional questions related to the most bothersome symptom. The total score of this scale ranges between 0–100 points, with higher scores indicating worse symptom burden. Additionally, the Cronbach’s α of this scale was 0.888.
Data Collection
In this study, to ensure consistent assessment criteria, a research team formed by the investigators received standardized training prior to data collection. Patients signed the informed-consent form on the day of admission. Then, the questionnaire was distributed to all patients by the trained researchers on postoperative day 1 (T1), day 3 (T2), day 30 (T3) and day 90 (T4). In the survey, each evaluation was inquired and recorded by the researchers item by item based on the scale. A total of 422 patients were enrolled, and the valid response rate was 100%.
Statistical Analyses
Data Processing
The SPSS 26.0 software was applied for descriptive statistics, correlation analyses, and analysis of variance. The graph package in R 4.3.3 was used to estimate symptom partial-correlation networks and node centrality at T1–T4, while the glmnet package was utilized to construct the cross-lagged panel networks (CLPN) to examine longitudinal predictive effects (T1→T2, T2→T3, and T3→T4). In addition, the boot net package was applied for evaluating the network accuracy and stability.
Partial Correlation Networks at the Four Time Points
A Gaussian Graphical Model-based partial-correlation network was employed for network estimation, followed by model regularization with the Least Absolute Shrinkage and Selection Operator (LASSO) to obtain a sparser, more stable structure. Centrality indices computed involved the strength, betweenness and closeness. The strength centrality, given its superior stability, was selected as the primary interpretive metric.17 Larger strength centrality values would indicate a stronger connection of a node to others, allowing it to be identified as a key symptom within the network. Furthermore, the network structure invariance, global strength, and edge-level differences between networks were examined via Network Comparison Test package in R. The structure-invariance test was applied to evaluate whether the pattern of node connections differed across networks, with a meaningful change in network architecture determined based on a significant result. The global-strength test was used to assess differences in overall connectivity, with tighter inter-node relationships identified in the case of higher values. Additionally, the edge-level test compared individual edges across networks to verify specific pairwise differences.18
CLPN Analysis for T1→T2, T2→T3 and T3→T4
The predictive direction among variables in longitudinal panel data was inferred by the CLPN analysis.19 The model was regularized with LASSO, coupled with the identification of edges/structure via 10-fold cross-validation. Two centrality indices, in-expected influence and out-expected influence, were computed to quantify the role of each symptom node. Specifically, the in-expected influence quantified the extent to which a node was predicted by all other nodes in the network, whereas the out-expected influence embodied the capacity of a node to predict other nodes. Higher centrality coefficients would indicate that a symptom was more susceptible to being influenced by other symptoms (in-expected influence) or would trigger additional symptoms more obviously (out-expected influence). Similarity between two CLPN was assessed by computing the Pearson correlation of their edge weights, the proportion of edges that retained the same sign (positive or negative), and the Jaccard index. A greater structural similarity between the networks would be denoted by a higher Jaccard index.
Accuracy and Stability Assessment of the Networks
Bootstrapping with 1000 resamples was used to estimate 95% confidence intervals (CI) for each edge weight, with more precise estimates identified in the case of narrower CIs. The stability of centrality indices was assessed with the centrality stability (CS) coefficient, with good or acceptable stability determined when the CS was > 0.50 or > 0.25, respectively.20
Results
Incidence and Severity of Postoperative Symptoms in Early-Stage Lung Cancer Patients
On postoperative day 1 (T1), pain attained the highest median score (median = 3, IQR 2–5). Dizziness (median = 0, IQR 0–3), insomnia (median = 0, IQR 0–3) and fatigue (median = 0, IQR 0–2) also exhibited relatively high incidence and severity. Pain scores, although declined continuously thereafter, remained the highest among all symptoms at both T2 and T3. The scores of all symptoms decreased across the recovery period. By postoperative day 90 (T4), the median score for every symptom had fallen to 0. There were statistically significant differences in the distributions of scores for cough, pain, shortness of breath, fatigue, dizziness, nausea/vomiting, insomnia, constipation and weakness across the four time points (P < 0.001, Table 1).
 |
Table 1 Score Profiles and Differential Analysis at Different Time Points in Early-Stage Lung Cancer Patients |
According to further normality distribution test, there was markedly non-normal distributions of scores for every symptom at each assessment. All items exhibited positive skewness and extremely high kurtosis, deviating substantially from normality. Consequently, network-analytic procedures appropriate for non-normal data were adopted throughout our subsequent analyses (Table 2).
 |
Table 2 Descriptive Symptom Statistical Results at Different Time Points in Early-Stage Lung Cancer Patients |
Partial-Correlation Networks at Different Postoperative Time Points
At T1, T2, T3 and T4, corresponding mean network densities were 0.289, 0.889, 0.381 and 0.286, respectively, indicating marked differences in symptom inter-connections across the four assessments (Figure 1).
 |
Figure 1 Symptom networks of early-stage lung cancer patients at four postoperative time points. D1: Cough; D2: Pain; D3: Pant; D4: Fatigue; D5: Dizziness; D6: Vomiting; D7: Pneumoderm; D8: Insomnia; D9: Constipation; D10: Fatigue. |
Strength Centrality Estimates of the Partial-Correlation Networks at Different Postoperative Time Points
The strength centrality of the postoperative symptom network is shown in Figure 2. As shown in this network, at T1 and T2, fatigue (D4) exhibited the highest strength centrality, whereas at T3 and T4, insomnia (D8) emerged as the node with the highest strength centrality.
 |
Figure 2 Strength centrality of each node in the postoperative symptom network of early-stage lung cancer patients. |
Based on the Bootstrap analyses of edge weights, the four networks were estimated with satisfactory precision. Stability tests yielded CS coefficients of > 0.75 for strength centrality across all time points, confirming robust stability.
Network Comparison
Network comparison tests were performed to examine differences in network structure and global strength (GS) across time points. No significant structural difference was observed between T1 and T2 (M = 0.208, p > 0.05), whereas the network structure at T2 significantly differed from that at T3 (M = 0.377, p = 0.019). The structural difference between T3 and T4 was not significant (M = 0.187, p > 0.05). Regarding global strength, no significant difference was found between T1 (GS = 1.801) and T2 (GS = 0.927, p > 0.05). Global strength at T2 (GS = 2.850) was significantly higher than that at T3 (GS = 0.368, p = 0.032), while no significant difference was detected between T3 (GS = 0.458) and T4 (GS = 0.519, p > 0.05, Table 3).
 |
Table 3 Differences in Network Structure and Global Strength (GS) Across Time Points |
CLPN Comparisons
Figure 3 presents the CLPN for T1→T2, T2→T3 and T3→T4. Arrows indicate predictive paths from an earlier to a later time point; while arrow weights reveal the magnitude of the prospective effect.
 |
Figure 3 Comparison of CLPN of symptoms in early-stage lung cancer patients between T1→T2, T2→T3, and T3→T4 postoperatively. |
The autoregressive effect, a concept defining the influence of each symptom on itself across consecutive intervals is summarized (Table 4). To be specific, positive autoregressive coefficients were observed for cough (D1), pain (D2), shortness of breath (D3), fatigue (D4) and nausea/vomiting (D6) in all or most transitions. In contrast, negative values were noticed for dizziness (D5), subcutaneous emphysema (D7), insomnia (D8), constipation (D9) and weakness (D10) at specific transitions. Moreover, the largest autoregressive effects were found for nausea/vomiting (D6; T3→T4: 0.28), subcutaneous emphysema (D7; T3→T4: 0.28) and constipation (D9; T1→T2: 0.26; T2→T3: 0.28).
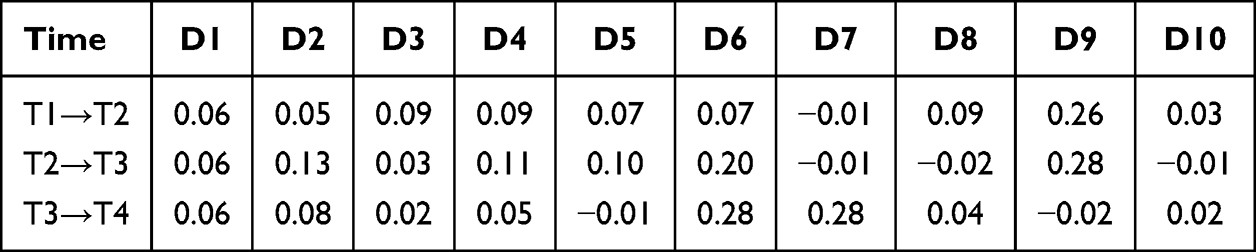 |
Table 4 Autoregressive Effects of Each Symptom at Different Time Points Postoperatively |
Centrality Estimates of the Cross-Lagged Symptom Networks
Centrality indices for the CLPN are shown in Figure 4. Regarding in-expected influence, subcutaneous emphysema (D7) displayed relatively high values across all three transitions (T1→T2, T2→T3, and T3→T4). Nausea/vomiting (D6) exhibited high in-expected influence only during T2→T3, with low values at the other intervals. Notable predictive edges included T1 pain (D2) → T2 subcutaneous emphysema (D7) and T1 shortness of breath (D3) → T2 subcutaneous emphysema (D7). Simultaneously, constipation (D9) showed moderately high in-expected influence across all three transitions. Among these, the strongest cross-lagged edges were T1 pain (D2) → T2 constipation (D9) and T3 cough (D1) → T4 constipation (D9).
 |
Figure 4 Expected output and input effects of CLPN in early-stage lung cancer patients between T1→T2, T2→T3, and T2→T3 postoperatively. |
With respect to out-expected influence, fatigue (D4) was the highest during T1→T2, followed by constipation (D9) and pain (D2). The strongest prospective paths were T1 fatigue → T2 insomnia (D8) and T1 fatigue → T2 dizziness (D5), whereas T1 constipation (D9) chiefly predicted T2 weakness (D10). During T2→T3, pain (D2) became the most influential sender, with the strongest effect from T2 pain → T3 shortness of breath (D3), followed by T2 pain → T3 cough (D1). During T3→T4, nausea/vomiting (D6) and subcutaneous emphysema (D7) exhibited the highest out-expected influence. Constipation (D9) also maintained a consistently moderate output effect across all three transitions. In addition, the principal cross-lagged edges were T2 constipation (D9) → T3 pain (D2), T2 constipation (D9) → T3 cough (D1), and T3 cough (D1) → T4 constipation (D9).
Assessment of Network Accuracy and Stability
Left panel displays the expected influence (EI) values with 95% confidence intervals for each symptom. The x-axis represents the 10 postoperative complications (D1 to D10), and the y-axis indicates the EI value. Out-EI and in-EI are represented by blue and red bars, respectively. Error bars indicate 95% confidence intervals estimated via bootstrap resampling.
Right panel illustrates the stability of EI centrality indices as a function of the proportion of cases dropped during bootstrap resampling (ranging from 0% to 70%). For example, a value of 0.3 indicates that 30% of the patient data were randomly excluded, with the network recalculated using the remaining 70% of the sample. The y-axis represents the Spearman correlation coefficient between the centrality orderings obtained from the resampled networks and that from the original network. A value of 1.0 indicates perfect agreement (maximum stability), whereas a value of 0 indicates no consistency. The gray dashed line denotes the stability threshold, above which centrality orderings are considered reliable (correlation coefficient > 0.7). The blue solid line (Out-EI) and red dashed line (In-EI) depict the stability trajectories for the two centrality indices. The correlation stability (CS) coefficient is defined as the proportion of cases dropped when the correlation first falls below 0.7. As shown, the CS coefficient was 0.30 for Out-EI and 0.70 for In-EI, indicating acceptable stability for both indices (Figure 5).
 |
Figure 5 Assessment of Network Accuracy and Stability. |
Network Similarity Test
We further examined the differences in cross-lagged symptom networks among postoperative early-stage lung cancer patients across timepoints. The results revealed the following correlations between networks:
T1-T2 versus T2-T3 networks:
- Edge weights: r = −0.131, p = 0.194
- Incoming expected influence: r = 0.144, p = 0.692
- Outgoing expected influence: r = 0.213, p = 0.555
T2-T3 versus T3-T4 networks:
- Edge weights: r = −0.018, p = 0.861
- Incoming expected influence: r = 0.294, p = 0.410
- Outgoing expected influence: r = 0.679, p = 0.031
T1-T2 versus T3-T4 networks:
- Edge weights: r = −0.117, p = 0.246
- Incoming expected influence: r = −0.432, p = 0.212
- Outgoing expected influence: r = 0.770, p = 0.009
The Jaccard indices for the three pairwise comparisons were 0.273, 0.286, and 0.000, respectively, indicating that the majority of edges differed in direction across the three networks. The number of edges retaining the same direction (ie, positive or negative) was 3, 2, and 0, respectively, corresponding to 50.0%, 50.0%, and 0.0% of edges in each network comparison. These findings suggest substantial dissimilarity among the three networks.
Discussion
Time-dependent evolution for both the symptom-network structure and the core symptoms of postoperative early-stage lung cancer patients
Through the construction of symptom networks at four postoperative time-points, this study dynamically evaluated symptom burden from the acute phase (T1) through the recovery phase (T4), with the delineation of the incidence, severity and trajectories simultaneously, thereby providing an evidence base for symptom management. Rather than static, the postoperative symptom exhibited remarkable changes structurally with the progression of the recovery. Specifically, on postoperative day 1 (T1), pain showed the highest incidence and severity, followed by dizziness, insomnia and fatigue. Further longitudinal network analyses revealed that the core nodes of the postoperative symptom network shifted as the recovery proceeded. Specifically, fatigue (D4) exhibited high strength centrality at T1 and T2, whereas insomnia (D8) became the most central symptom at T3 and T4. Aligning with a prior longitudinal network analysis, Wang et al, observed that the core symptom among postoperative lung cancer patients evolved over time from fatigue to shortness of breath and cough.21 In terms of the shift of the central symptom from “fatigue” to “insomnia”, there may be a relocation of the focal point of postoperative symptom burden in the studied patients. Concerning the possible reason, the network is driven by acute physiological stressors such as surgical trauma, anaesthesia and the inflammatory response during the immediate postoperative period, with fatigue as the hub.22 In the context of the subsidence of these acute stimuli, chronic adaptation, behavioural changes and psychological adjustment make sleep disturbances the predominant health concern.23 Accordingly, instead of the use of a traditional static assessment model, a dynamic, phased symptom management strategy should be adopted during clinical care. In the early postoperative period, intervention resources should be prioritized for fatigue and pain, while continuous assessment and non-pharmacological interventions for insomnia, such as promoting sleep hygiene education and cognitive behavioral therapy, should be emphasized in the middle and late stages of recovery.24
Predictive Value of Fatigue for Subsequent Insomnia
CLPN analysis showed that fatigue (D4) had the highest out-expected influence during T1→T2, with the strongest prospective path to insomnia at T2. It highlights early postoperative fatigue as a key driver of later sleep disturbance, which was consistent with a significant association between cancer-related fatigue and sleep disorders in lung cancer patients reported previously.25 Mechanistically, postoperative fatigue is linked to multiple physiological disturbances25 that can disrupt the sleep–wake rhythm; while fatigue and dyspnoea often form a mutually reinforcing cycle21 that further impairs nocturnal respiration and sleep quality. Moreover, fatigue-related reduction in daytime activity and increased psychological burden may indirectly precipitate insomnia through behavioural and emotional pathways. It therefore underscores the significance of early targeted management of fatigue.
Insomnia as the Core Symptom of the Late Postoperative Network
Insomnia (D8) ranked the highest on strength centrality at both T3 and T4. Consequently, sleep disturbance becomes the pivotal barrier to long-term recovery and quality of life, once acute surgical sequelae (eg, severe pain and profound fatigue) subside. CLPN analyses demonstrated that early fatigue prospectively drove insomnia. As as a “secondary” symptom triggered by acute sequelae, it can evolve into an independent disorder maintained by cognitive-behavioural factors (eg, excessive worry about sleep), physiological changes (eg, disrupted melatonin rhythms) and environmental cues. For instance, in a recent longitudinal study of lung cancer patients, pain, fatigue and sleep disturbance usually co-varied as a symptom cluster presenting with a distinct trajectory.26 Therefore, continuing-care programme should incorporate systematic sleep assessment and cognitive-behavioural interventions, with emphasis on extending postoperative symptom management beyond hospital discharge.27 Eventually, early, standardized implementation of such measures can optimize patients’ overall recovery trajectory.
Pain as a Key Predictor of Impaired Respiratory Function
In our study, it was also observed that pain supplanted fatigue, during T2→T3, as the symptom with the highest out-expected influence, and the strongest prospective path was from pain at T2 to shortness of breath at T3. Therefore, pain exerts both persistent and spreading effects. It can be explained that thoracotomy-related incision pain compromise patients’ deep inspiration and effective coughing, reducing pulmonary ventilation and promoting sputum retention, thereby precipitating or exacerbating dyspnoea.28 Pain-related anxiety and fear-avoidance behaviors will amplify the problem, further curtailing physical activity and respiratory exercises. As evidenced in prior research, inadequate postoperative pain control would increase the risk of pulmonary infections and other complications.29 It underscores the need for integrating respiratory rehabilitation closely into routine care, in addition to optimizing analgesic regimens in the clinical setting. In this regard, patients should be instructed and encouraged to perform effective coughing and pursed-lip breathing exercises early in the recovery period, and, when conditions permit, to ambulate as soon as possible to improve pulmonary function.
Susceptibility of Subcutaneous Emphysema to Other Symptoms, While Constipation Acting as a Network Hub
Our CLPN analyses also revealed in-expected influence of subcutaneous emphysema (D7) across T1→T2, T2→T3 and T3→T4, indicating that it is readily influenced by other symptoms in the network. Forceful postoperative coughing, which produces sharp rises in intrapleural pressure, has been confirmed to be a key factor in precipitating or worsening subcutaneous emphysema.30,31 Therefore, such inter-symptom effects should be closely monitored clinically, combined with the control of vigorous coughing and pain early, thereby blocking the presence of subcutaneous emphysema.
Nausea/vomiting (D6) showed elevated in-expected influence only during T2→T3, suggesting that it may be the most strongly driven by other symptoms (eg., fatigue and pain) within this interval. Similarly, in recent symptom-network study, gastrointestinal complaints often clustered with fatigue and pain.32 Nausea/vomiting in relation to antecedent cough, pain or fatigue should be monitored by nursing staff, coupled with prompt intervention once these precursor symptoms appear. Moreover, constipation (D9) displayed consistently moderate-to-high in- and out-expected influence across all three cross-lagged intervals, acting as a stable “hub” within the symptom network. Given this dual role, constipation is both influenced by earlier symptoms and predictive of subsequent ones. Clinicians should therefore begin early peri-operative assessment of constipation risk and employ nursing interventions,33 including prophylactic laxatives and non-pharmacologic measures such as dietary modification (increased fiber and fluid intake), early ambulation as tolerated, and abdominal massage.
Autoregressive Effects as Indicatives of Symptom Persistence and Management Priority
During specific intervals, nausea/vomiting (D6), subcutaneous emphysema (D7) and constipation (D9) showed high autoregressive effects (>0.25), implying that these symptoms tend to persist and do not resolve spontaneously in the case of their presence. More importantly, CLPN analyses revealed that nausea/vomiting and subcutaneous emphysema had the greatest out-expected influence at T3→T4. Thus, in addition to persist because of their underlying pathophysiology in the late recovery phase, nausea/vomiting and subcutaneous emphysemaalso become central drivers that impede overall patient recovery. Potentially, this persistence is attributable to: (1) therapeutic procedure-induced tissue injury, with gradual gas absorption and symptom resolution requiring a prolonged period;34 and (2) adjuvant chemotherapy, with cytotoxic agents serving as a major cause of refractory nausea and vomiting, peaking 24–72 h after administration and thereby further prolonging these symptoms throughout the overall recovery35. The persistence of constipation may be related to continued postoperative opioid use, inhibited intestinal motility and limited physical activity.36 Tang et al also demonstrated that a subgroup of lung cancer patients followed a “high-severity” symptom trajectory characterized by heavier symptom burden and slower recovery.37 In contrast, symptoms with low or negative autoregressive effects, such as dizziness and weakness, are more likely to resolve spontaneously as the body recuperates. It inspire us that for the clinical nursing of specific patients, differentiated, proactive prevention strategies should be adopted that can tailor to the persistence profile of each symptom. For example, constipation should be risk-assessed early and managed with prophylactic laxatives. Postoperative nausea and vomiting warrant a graded assessment system with stepwise prevention and intervention; while subcutaneous emphysema requires close monitoring and supportive care. Finally, it may be possible to reduce or break symptom persistence and improve comfort for patients recovering from lung cancer surgery when nurses intervene early and proactively in accordance with the evolving symptom network and longitudinal inter-symptom relationships.
Potential Biological Mechanisms and Future Directions
The dynamic evolution of postoperative symptom networks observed in this study may arise from the interplay of multiple biological mechanisms, including inflammatory responses, neuroimmune pathways, and the tumor microenvironment. Prior studies have implicated inflammatory cytokines such as IL-6 and TNF-α in symptoms like pain and fatigue. The post-surgical fluctuations of these cytokines may explain the observed network transition—from a densely interconnected configuration in the acute phase to a decoupled structure during recovery. Additionally, tumor molecular features, such as EGFR mutation status and immune microenvironment profiles, may indirectly shape symptom experiences through neuroimmune crosstalk.
Future efforts should focus on integrating dynamic symptom networks with multi-omics biomarkers to construct predictive models that capture both clinical and biological dimensions. Such a framework could enable early identification of patients at elevated risk for persistent postoperative symptoms, inform predictions of treatment response, and provide a mechanistic foundation for personalized rehabilitation strategies in early-stage lung cancer.
Conclusion
This longitudinal network analysis of early-stage lung cancer patients after surgery reveals the dynamic pattern of symptom evolution over time, demonstrating a temporal shift in network centrality. Fatigue dominates the early phase, pain emerges as the key driver mid-course, and insomnia becomes the core symptom during later recovery. This study also identifies clear predictive pathways through CLPN analyses, such as fatigue significantly foreshadowing later insomnia and pain forecasting dyspnoea. It confirms the existence of a dynamic network relationship of mutual influence between symptoms, suggesting that clinical nursing should shift from static assessment to phased and precise intervention. Given a single-center-sourced samples, future multi-centre studies should be scheduled to validate and extend the current results, propelling symptom management toward personalized care, and thereby improving patients’ recovery and quality of life. Our findings highlight a paradigm shift in postoperative symptom management—from conventional clinical observation toward an integrated clinical-biological framework—thereby providing a broader theoretical foundation for personalized intervention.
While the present study focused on intra-individual network evolution over time, future research should extend these findings to inter-individual comparisons across clinically relevant subgroups. Large-scale, multicenter studies are warranted to compare symptom network structures and central symptoms between different surgical methods, age groups, and sexes. These subgroup analyses would advance personalized postoperative symptom management by identifying population-specific intervention targets.
Abbreviations
CLPN, cross-lagged panel networks; LASSO, Least Absolute Shrinkage and Selection Operator; CI, confidence intervals; CS, centrality stability.
Ethics Statement
The study was approved by the Ethics Committee of this hospital (approval No. XMZSYYKY-2024-050), and all patients gave informed consent.
Author Contributions
All authors made a significant contribution to the work reported, whether that is in the conception, study design, execution, acquisition of data, analysis and interpretation, or in all these areas; took part in drafting, revising or critically reviewing the article; gave final approval of the version to be published; have agreed on the journal to which the article has been submitted; and agree to be accountable for all aspects of the work.
Funding
This work was supported by Health and Medical Guidance Project of Xiamen Municipal Science and Technology Bureau (No. 3502Z20244ZD1079).
Disclosure
The authors declare no conflicts of interest in this work.
References
1. Sung H, Ferlay J, Siegel RL, et al. Global cancer statistics 2020: GLOBOCAN estimates of incidence and mortality worldwide for 36 cancers in 185 countries. CA Cancer J Clin. 2021;71(3):209–13. doi:10.3322/caac.21660
2. Bray F, Laversanne M, Sung H, et al. Global cancer statistics 2022: GLOBOCAN estimates of incidence and mortality worldwide for 36 cancers in 185 countries. CA Cancer J Clin. 2024;74(3):229–263. doi:10.3322/caac.21834
3. Ettinger DS, Wood DE, Aisner DL, et al. NCCN guidelines insights: non-small cell lung cancer, version 2.2021. J Natl Compr Canc Netw. 2021;19(3):254–266. doi:10.6004/jnccn.2021.0013
4. Zhang Y, Qian B, Song Q, et al. Phase III study of mediastinal lymph node dissection for ground glass opacity–dominant lung adenocarcinoma. J Clin Oncol. 2025;43(28):3081–3089. doi:10.1200/JCO-25-00610
5. Oudkerk M, Liu S, Heuvelmans MA, et al. Lung cancer LDCT screening and mortality reduction—evidence, pitfalls and future perspectives. Nat Rev Clin Oncol. 2021;18(3):135–151. doi:10.1038/s41571-020-00432-6
6. Zhao H, Fan Y, Ma S, et al. INFORM investigators. Final overall survival results from a Phase III, randomized, placebo-controlled, parallel-group study of gefitinib versus placebo as maintenance therapy in patients with locally advanced or metastatic non-small-cell lung cancer (INFORM; C-TONG 0804). J Thorac Oncol. 2015;10(4):655–664. doi:10.1097/JTO.0000000000000445
7. Wang YF, Deng HY, Huang W, Zhou Q. Is video-assisted thoracoscopic surgery comparable with thoracotomy in perioperative and long-term survival outcomes for non-small-cell lung cancer after neoadjuvant treatment? Interact Cardiovasc Thorac Surg. 2022;35(6):ivac271. doi:10.1093/icvts/ivac271
8. Merlo A, Carlson R, Espey J 3rd, et al. Postoperative symptom burden in patients undergoing lung cancer surgery. J Pain Symptom Manage. 2022;64(3):254–267. doi:10.1016/j.jpainsymman.2022.05.016
9. Yao L, Zheng E, Mei Y, et al. Symptom investigation of patients after thoracoscopic lung cancer resection based on patient-reported outcomes. Chin J Clin Thoracic Cardiovasc Surg. 2023;30(1):84–88.
10. Rha SY, Lee J. Stable symptom clusters and evolving symptom networks in relation to chemotherapy cycles. J Pain Symptom Manage. 2021;61(3):544–554. doi:10.1016/j.jpainsymman.2020.08.008
11. Jing F, Zhu Z, Qiu JJ, et al. Contemporaneous symptom networks and correlates during endocrine therapy among breast cancer patients: a network analysis. Front Oncol. 2023;13:1081786. doi:10.3389/fonc.2023.1081786
12. Shang B, Bian Z, Luo C, et al. Exploring the dynamics of perioperative symptom networks in colorectal cancer patients: a cross-lagged panel network analysis. Support Care Cancer. 2023;32(1):62. doi:10.1007/s00520-023-08288-z
13. Fried EI, van Borkulo CD, Cramer AOJ, Boschloo L, Scholten W, Borsboom D. Commentary: “Consistent superiority of selective serotonin reuptake inhibitors over placebo in reducing depressed mood in patients with major depression”. Front Psychiatry. 2015;6:117. doi:10.3389/fpsyt.2015.00117
14. Zhang Z, Lao J, Liu M, Zheng S, Zhao M, Zhang M. Symptom cluster among cancer survivors from a nationally representative survey: a network analysis. SupportCare Cancer. 2024;32(6):333. doi:10.1007/s00520-024-08531-1
15. Noordzij M, Tripepi G, Dekker FW, Zoccali C, Tanck MW, Jager KJ. Sample size calculations: basic principles and common pitfalls. Nephrol Dial Transplant. 2010;25(5):1388–1393. doi:10.1093/ndt/gfp732
16. Mingming W, Xia L, Guowei C, et al. The validity and clinical application of postoperative symptom assessment scales for lung cancer patients. Chin J Clin Thoracic Cardiovasc Surg. 2017;24(6):417–422.
17. Yiming L, Hao Z, Zhengkui L. Symptom network evolution of post-traumatic stress disorder in children after earthquake. Acta Psychologica Sinica. 2020;52(11):1301–1312. doi:10.3724/SP.J.1041.2020.01301
18. van Borkulo CD, van Bork R, Boschloo L, et al. Comparing network structures on three aspects: a permutation test. Psychol Methods. 2023;28(6):1273–1285. doi:10.1037/met0000476
19. Funkhouser CJ, Chacko AA, Correa KA, Kaiser AJE, Shankman SA. Unique longitudinal relationships between symptoms of psychopathology in youth: a cross-lagged panel network analysis in the ABCD study. J Child Psychol Psychiatr. 2021;62(2):184–194. doi:10.1111/jcpp.13256
20. Epskamp S, Borsboom D, Fried EI. Estimating psychological networks and their accuracy: a tutorial paper. Behav Res Meth. 2018;50(1):195–212. doi:10.3758/s13428-017-0862-1
21. Wang X, Gu D, Wei J, et al. Network evolution of core symptoms after lung cancer thoracoscopic surgery:A dynamic network analysis. Eur J Oncol Nurs. 2024;70:102546. doi:10.1016/j.ejon.2024.102546
22. Huang P, He Y, Shang J, et al. Construction and validation of a prediction model for postoperative fatigue syndrome in chinese patients with lung cancer. West J Nurs Res. 2025;47(6):480–491. doi:10.1177/01939459251325490
23. Hussain T, Son EH, Wallen GR, Yang L, Lee LJ. Symptom profiles in lung cancer survivors: a latent class approach. PLoS One. 2025;20(10):e0309272. doi:10.1371/journal.pone.0309272
24. Zhang L, Luo Y, Mao D, et al. Nonpharmacological interventions for the fatigue-pain-sleep disturbance symptom cluster in lung cancer patients: best evidence summary. Semin Oncol Nurs. 2024;40(6):151727. doi:10.1016/j.soncn.2024.151727
25. Zhang MN, Zhou YC, Zeng Z, et al. Actors influencing cancer-related fatigue and the construction of a risk prediction model in lung cancer patients. Front Oncol. 2025;14:1485317. doi:10.3389/fonc.2024.1485317
26. Mao D, Luo Y, Zhang L, et al. Trajectories of fatigue-pain-sleep disturbance symptom cluster in patients with lung cancer undergoing chemotherapy and its predictive factors: latent class growth model. Support Care Cancer. 2025;33(12):1155. doi:10.1007/s00520-025-10137-0
27. Nissen ER, Neumann H, Knutzen SM, et al. Interventions for insomnia in cancer patients and survivors-a comprehensive systematic review and meta-analysis. JNCI Cancer Spectr. 2024;8(3):pkae041. doi:10.1093/jncics/pkae041
28. Fan Qisen, Lan Lan, Jingxiang W, et al. Expert consensus on anesthesia management for thoracic surgery with preservation of spontaneous breathing. J Pract Med. 2025;41(13):1945–1951.
29. Yuhao S, Wenxin T, Donghang L, et al. Early identification and intervention strategies for Perioperative cardiopulmonary complications in elderly patients with lung cancer. Chin J Thoracic Cardiovasc Surg. 2025;2025:1–8.
30. Liu T, Feng J, Liu X. Risk factors for extensive subcutaneous emphysema after pulmonary resection by video-assisted thoracoscopic surgery: a case-control study. Wideochir Inne Tech Maloinwazyjne. 2023;18(3):516–523. doi:10.5114/wiitm.2023.127786
31. Wang L, Dong Y, Ji Y, et al. Clinical outcome and risk factors for subcutaneous emphysema in patients with lung cancer after video-assisted thorascopic surgery. Front Surg. 2022;9:956431. doi:10.3389/fsurg.2022.956431
32. Ping L, Jingshuang M. Research status and progress of nursing intervention in symptom clusters of lung cancer patients undergoing chemotherapy. J Nurs. 2020;32(14):25–30.
33. Xu Suyue. Discussion on the effect of comprehensive nursing intervention on the incidence of constipation and quality of life in lung cancer patients undergoing chemotherapy. Chin J Cancer Prevention Treatment. 2020;27(S1):
34. Lung Cancer Case Management Professional Committee of Guangdong Nursing Association, Lung Oncology Branch of Guangdong Medical Association. Expert consensus on standardized nursing management for patients with subcutaneous emphysema after lung cancer surgery. Chin J Clin Phys. 2015;19(3):180–187.
35. Hunter JJ, Maunder RG, Sui D, et al. A randomized trial of nurse-administered behavioral interventions to manage anticipatory nausea and vomiting in chemotherapy. Cancer Med. 2020;9(5):1733–1740. doi:10.1002/cam4.2863
36. Okuda Y, Kuriyama T, Tsukiyama Y, Shimokawa T, Wan K, Kawamata T. Efficacy of prophylactic laxatives against opioid-induced constipation: retrospective propensity score matching analysis. Support Care Cancer. 2025;33(2):115. doi:10.1007/s00520-025-09154-w
37. Tang L, Yu H, Dai W, et al. Symptom trajectories informing patient care after lung cancer surgery: a longitudinal patient-reported outcome study. Ann Surg Oncol. 2023;30(5):2607–2617. doi:10.1245/s10434-022-13065-z
 © 2026 The Author(s). This work is published and licensed by Dove Medical Press Limited. The
full terms of this license are available at https://www.dovepress.com/terms
and incorporate the Creative Commons Attribution
- Non Commercial (unported, 4.0) License.
By accessing the work you hereby accept the Terms. Non-commercial uses of the work are permitted
without any further permission from Dove Medical Press Limited, provided the work is properly
attributed. For permission for commercial use of this work, please see paragraphs 4.2 and 5 of our Terms.
© 2026 The Author(s). This work is published and licensed by Dove Medical Press Limited. The
full terms of this license are available at https://www.dovepress.com/terms
and incorporate the Creative Commons Attribution
- Non Commercial (unported, 4.0) License.
By accessing the work you hereby accept the Terms. Non-commercial uses of the work are permitted
without any further permission from Dove Medical Press Limited, provided the work is properly
attributed. For permission for commercial use of this work, please see paragraphs 4.2 and 5 of our Terms.