Back to Journals » Clinical Ophthalmology » Volume 15
Switch to Autophagy the Key Mechanism for Trabecular Meshwork Death in Severe Glaucoma
Authors Rao A ![]() , Sahay P, Chakraborty M, Prusty BK, Srinivasan S, Jhingan GD, Mishra Snr P, Modak R, Suar M
, Sahay P, Chakraborty M, Prusty BK, Srinivasan S, Jhingan GD, Mishra Snr P, Modak R, Suar M
Received 15 January 2021
Accepted for publication 27 May 2021
Published 14 July 2021 Volume 2021:15 Pages 3027—3039
DOI https://doi.org/10.2147/OPTH.S292218
Checked for plagiarism Yes
Review by Single anonymous peer review
Peer reviewer comments 2
Editor who approved publication: Dr Scott Fraser
Aparna Rao,1,2 Prity Sahay,1,2 Munmun Chakraborty,1,2 Birendra Kumar Prusty,3 Sandhya Srinivasan,4 Gagan deep Jhingan,4 Pragyan Mishra Snr,2 Rahul Modak,2 Mrutyunjay Suar2
1Glaucoma Service, MTC campus, L.V. Prasad Eye Institute, Bhubaneswar, Odisha, 751024, India; 2KIIT School of Biotechnology, Bhubaneswar, Odisha, India; 3Institute of Life Sciences, Bhubaneswar, Odisha, India; 4Vproteomics, Green Park, New Delhi, India
Correspondence: Aparna Rao Email [email protected]
Purpose: The key differences in cell death mechanisms in the trabecular meshwork (TM) in adult moderate and severe primary glaucoma remain still unanswered. This study explored key differences in cell death mechanisms in the trabecular meshwork (TM) in adult moderate and severe primary glaucoma.
Design: In-vitro laboratory study on surgical specimens and primary cell lines.
Methods: Select cell death-related proteins differentially expressed on mass spectrometric analysis in ex-vivo dissected TM specimens patients with severe adult primary open-angle (POAG) or angle-closure glaucoma (PACG) compared to controls (cadaver donor cornea) were validated for temporal changes in cell death-related gene expression on in-vitro primary human TM cell culture after 48 hours (moderate) or 72 hours (severe) oxidative stress with H2O2 (400– 1000 uM concentration). These were compared with histone modifications after oxidative stress in human TM (HTM) culture and peripheral blood of patients with moderate and severe glaucoma.
Results: Autophagy-related proteins seemed to be the predominant cell-death mechanism over apoptosis in ex-vivo dissected TM specimens in severe glaucoma. Analyzing HTM cell gene expression at 48 hours and 72 hours of oxidative stress, autophagy genes were up-regulated at 48– 72 hours of exposure in contrast to apoptosis-related genes, showing down-regulation at 72 hours. There was associated increased expression of H3K14ac in HTM after 72 hours of oxidative stress and in peripheral blood of severe POAG and PACG.
Conclusion: A preference of autophagy over apoptosis may underlie stage transition from moderate to severe glaucoma in the trabecular meshwork or peripheral blood, which may be tightly regulated by epigenetic modulators.
Keywords: trabecular meshwork, cell death, autophagy, apoptosis, glaucoma
Introduction
Primary open angle (POAG) and primary angle closure glaucoma (PACG) are the two most important forms of adult primary glaucoma seen worldwide.1,2 The primary site of injury is the trabecular meshwork, TM, which contains collagen beams and endothelial cells with extracellular matrix (ECM) interspersed between the cells and represents the site of maximum resistance to aqueous outflow.3–5 Thus, this tissue plays an important role in the pathogenesis of glaucoma and understanding the mechanism of its dysfunction is key for preventing or reversing functional TM damage.3,5–7 In glaucoma, the TM cells are presumed to die by apoptosis though several other mechanisms of cell death are possible.6–12 The human TM cell lines, and ex-vivo dissected TM tissue obtained from normal donors express several modulators of apoptosis along with an abundance of heat shock proteins (HSPs).10–12 Apoptotic modulators have been expressed in ex-vivo TM specimens or TM cells in culture and have also been shown to be upregulated upon stress on in-vitro TM cell lines. Oxidative stress markers have also been found to be very highly expressed in aqueous humour and anterior segment tissue in glaucoma eyes.12 Several studies have reported increased expression of pro-apoptotic molecules in the anterior segment or ocular tissues including TM in glaucoma, human TM (HTM) cell lines, and ex-vivo dissected TM tissue obtained from normal donors, and express several modulators of apoptosis (Fas, Bcl-2, Bcl-Xl, Bax, and caspases).10,12–14 Literature on the autophagic process in glaucoma is limited and focus on expression of autophagy genes in tissue of the anterior segment or in-vitro experiments.15–22 Further, autophagy participates in myocilin degradation which is known to be involved in POAG pathogenesis in humans.21 Studies have shown that the autophagy process is inducted early by biaxial stretch and in perfused eyes subjected to raised IOP.19,20,22
Glaucoma is a progressive disorder that causes gradual damage and cell death involving alteration in multiple cell death signaling events including impaired crosstalk between apoptosis and other cell death mechanism like autophagy. Our earlier study on HTM cell lines showed definite morphological differences apart from differential MMP expressions with varying periods of exposure to oxidative stress reflecting that cell death mechanisms may be different with a different severity of the insult.23 Yet, the exact molecular mechanisms ex-vivo regulating cell death/functioning in the TM tissue at different stages of glaucoma, is not yet elucidated. This study explores the differential role of cell death process in the TM in different stages of glaucoma.
Methods
Clinical Characterisation of Glaucoma Cases and Controls and Sample Collection
The inclusion criteria included POAG or PACG (defined as pre-treatment IOP ≥21 mmHg, open or closed angles on gonioscopy with glaucomatous disc features like rim loss or notch, vertical cup disc ratio >0.6 asymmetry of more than 0.2, retinal nerve fibre layer loss or disc hemorrhage) with at least three reliable baseline preoperative visual fields, no retinal or neurologic disease that may have affected the visual field. Only patients with established glaucoma scheduled for surgery for glaucoma for uncontrolled IOP were included for the study which adhered to the tenets of the Declaration of Helsinki and was approved by the institutional review board of LV Prasad Eye Institute, MTC campus, Bhubaneswar, India. All patients included for the study underwent detailed examination after a written informed consent. Patients were diagnosed as POAG in the presence of open angle on gonioscopy, IOP > 22 mmHg and visual field/disc changes consistent with glaucoma. PACG was diagnosed in the presence of closed or occludable angles on gonioscopy with IOP > 22 mmHg and glaucomatous visual field/disc changes.
Glaucomatous visual field defects were diagnosed according to Hodapp-Parrish criteria, and only reliable fields were taken for final analysis. We classified these patients into moderate and severe glaucoma based on visual field indices namely the mean deviation or MD. Patients with MD < -12 dB were classified as severe, and those with MD > -12 dB and < -6 dB were classified as moderate glaucoma. Only those that fulfilled the above criteria in both eyes were selected, with the worse eye taken for analysis.
The TM specimens were obtained according to standard surgical procedures of limbus or fornix based trabeculectomy with a vannas scissor. They were obtained from patients undergoing surgery for uncontrolled IOP (only glaucoma surgery) and/or associated cataract. For all analysis, the TM was snap-frozen in liquid nitrogen and stored at −80 °C until further assays. Since severe glaucoma patients undergo surgery with medical treatment being preferred in moderate cases, proteomic analysis was done for surgical samples procured only from those with severe glaucoma.
Control tissues were obtained from donor eyes harvested from the eye bank or cadaver eyes with no history of glaucoma in patient and family. A 5X5 mm corneo-scleral block was dissected from these donor eyes in the same manner as above. The trabecular meshwork may contain scleral contamination, but most of the tissue would have trabecular meshwork tissue.
Proteomic Analysis of ex-vivo Surgically Dissected TM Specimens
To test for cell death markers, we analyzed ex-vivo dissected TM specimens obtained from patients with severe POAG or PACG (n = 3 each), uncontrolled IOP and stable visual fields undergoing surgery and 25 controls (donor corneal buttons without any ocular pathology obtained from the institutional eye bank) for protein expression profile in the trabecular meshwork with regards to specific cell death pathways which may be more predominant in severe glaucoma stages.
Excised tissues were dissolved in 150 ul of chilled 6M Gn-HCL in 0.1M Tris (pH 8.5) plus 1x protease inhibitors (Roche). Tissues were dissolved using tissue homogenizer and then sonicated at 60 amplitude, 10 seconds on and off for 5 minutes for mass spectrometric analysis. Homogenized samples were boiled at 90 °C for 5 minutes and then centrifuged at 15,000 rpm for 20 minutes at room temperature. The supernatant was stored and marked properly. Protein concentration of all the lysates were performed using the BCA method (Thermo), and 25 μg of the protein lysates were first reduced with 5 mM TCEP Tris(2-carboxyethyl)phosphine hydrochloride, followed by alkylation with 50 mM iodoacetamide. For tryptic digestion, the samples were diluted to 0.6 M final Gn-HCL concentration using 25 mM ammonium bicarbonate buffer, and trypsin protease (Promega gold) added into the reaction (1:50, trypsin:lysate ratio) for 16 hours at 37 °C. The peptide digests were purified using C18 silica cartridge (The Nest Group, Southborough, MA) as per manufacturer’s protocol, and finally dried using speed vac at 50 °C. The dried purified peptide pellet was stored at −20 °C and before nano-ESI LC-MS/MS run, re-suspended in Buffer-A (5% acetonitrile/0.1% formic acid).
For label-free quantification analysis the peptide samples were resolved using the EASY-nLC 1000 system (Thermo Fisher Scientific) which was connected to QExactive orbitrap mass spectrometer (Thermo Fisher Scientific) equipped with nanoelectrospray ion source. 1 μg of the peptide mixture of each sample was loaded on a C18 precolumn and resolved using 50 cm Easy-spray LC column (Thermo Fisher Scientific). The peptides were loaded with Buffer A and eluted with a 0–40% gradient of Buffer-B (95% acetonitrile/0.1% formic acid) using a run time of 90 minutes at a flow rate of 300 nl/min. The run program of QExactive was performed with Top 10 HCD data-dependent positive polarity acquisition mode with a full scan and MS/MS scan resolution of 70,000 and 17,500 at m/z 400 respectively. For internal recalibration during the 90-minute run, lock mass option was enabled for polydimethylcyclosiloxane (PCM) ions (m/z = 445.120025).
The RAW files generated from all the LC-MS/MS runs were analyzed with Proteome Discoverer (v2.2) against the HUMAN SwissProt proteome database (20,366 entries). For the Sequest search engine, the mass tolerances for MS and MS2 were set at 10 ppm and 0.5 Da, respectively. Fully tryptic enzyme setting with a maximum of two missed cleavage and fixed modification (Cysteine, Carbamidomethyl) and variable modification (methionine, oxidation), were used in extra settings. For 1% FDR (false discovery rate), percolator node was used for both peptide spectrum matches, and protein FDR. Label-free quantification was performed using the precursor ion quantifier node (Minora Feature Detector), that included a minimum trace length of 5, Max. ΔRT of Isotope Pattern 0.2 minutes.
The software used for data analysis included the Thermo Proteome Discoverer (v2.2), Perseus (v1.6.O) and STRING (online software). Since temporal changes of cell death pathways cannot be demonstrated in ex-vivo dissected specimens, which also have less/very variable number of viable cells, and extensive fibrous tissue at the time of surgery, select candidate proteins of the discovery stage belonging to autophagy and apoptosis were now taken up for validation studies on human trabecular meshwork primary cell cultures for temporal changes in expression of cell death markers. Detailed methods for data analysis are given separately, Supplemental Methods and Appendix.
Cell Death Mechanisms in-vitro on HTM Cell Culture After H2O2 Induced Stress
Validation of cell death markers was done in commercially available primary human trabecular meshwork cells (three different strains HTM, Cell applications, Inc, CA obtained as gift from CSIR, New Delhi and validated with dexamethasone induced myocilin expression). These cells (not immortalized lines) were cultured with Dulbecco’s Modified Eagle Medium, DMEM, medium containing low glucose, sodium pyruvate and sodium carbonate. Media was supplemented with 10% fetal bovine serum (FBS), 4 mM of L-glutamine and 1% of antibiotics penicillin/streptomycin, antimycotic solution. For experiments 3rd-5th passage cells were taken for analysis.
Cell Death-Related Gene Expression After H2O2 Induced Stress on HTM Culture
For cell viability assay human trabecular meshwork (HTM) cells were grown in a 96-well plate (Tarsons) for 24 hours in 100 µL of DMEM media with a seeding density of 6000 cells/well. The cells were treated with 100 μM, 200 μM, 400 μM, 600 μM, 800 μM and 1000 μM of H2O2 for 12 hours, 24 hours, 48 hours and 72 hours respectively under serum-starved conditions. Viability of cells was analyzed by a MTT (3-(4,5-dimethylthiazol-2-yl)-2,5-diphenyltetrazolium bromide) assay. The media was removed, and 100 μL MTT solution (0.5 mg/mL) was added to each well for 3 hours at 37 °C. The formazan crystals that formed were dissolved by the addition of 4 mM dissolving solution after removal of supernatant. Absorption was measured with a spectrophotometer at 570 nm.
A total of 1 million HTM cells were cultured in a T-25 flask with DMEM medium supplemented with 10% fetal bovine serum (FBS). The cells were treated with 600–1000 µM, of H2O2 for 12, 24, 48 and 72 hours. After treatment, the cells were harvested and washed twice with 1 mL of 1X binding buffer followed by centrifugation at 300 x g for 10 minutes. The supernatant was aspirated and the pellet was re-suspended in 100 µL of 1X binding buffer. 10 µL of Annexin V-FITC was added and incubated for 15 minutes in the dark at room temperature. The cells were washed twice with 1 mL of 1X binding buffer followed by centrifugation at 300 x g for 10 minutes. The supernatant was aspirated, and the pellet was re-suspended in 100 ul of 1X binding buffer followed by addition of 5 µL PI (propidium iodide 10 mg/mL) before flow cytometry analysis.
Total RNA was extracted from HTM cells using QIAzol® Lysis reagent (QIAGEN). The homogenized mixture of QIAzol and cells were kept at room temperature for 5 minutes to permit complete dissociation of nucleoprotein complexes followed by chloroform mixed vigorously for 15 seconds at room temperature for 2–3 minutes. The resulting mixture was centrifuged at 12,000 x g for 15 minutes at 4 °C and the aqueous phase was transferred into a fresh tube for precipitation with 0.5 mL of isopropanol and 5 µL of RNase free glycogen (5 µg). This was followed by centrifugation at 12,000 x g for 15 minutes at 4 °C after which the RNA pellet was washed with 75% ethanol and final centrifugation at 7500 x g for 5 min at 4 °C before finally dissolved in 20 µL DEPC water. The purity and amount of RNA were determined by measurement of the OD260/280 ratio. Pure RNA was ensured after eliminating with genomic DNA which was then reverse transcribed using the First Strand Synthesis Kit (Qiagen) and subsequently loaded on to apoptosis, autophagy and necrosis RT2 profiler array according to manufacturer’s instructions (comparative and fold change was calculated by determining the ratio of mRNA levels to control values using the ΔCt method). The online Qiagen analysis tool was used for computing comparative fold changes calculated by determining the ratio of mRNA levels to control values using the ΔCt method (2−ΔΔCt). All data were normalized to an average of five housekeeping genes ACTB, GAPDH, HPRT1, RPLP20 and HGDC. PCR conditions used for analysis were 10 min at 95 °C, followed by 40 cycles of 15 seconds at 95 °C and 60 seconds at 60 °C. The p values were calculated based on ANOVA post hoc t test with Tukey correction of the replicate (2−ΔΔCt) values for each gene in the control group and treatment groups and p < 0.05 was considered significant.
Western Blot Analysis
To identify the differential expressions for apoptosis and autophagy markers in HTM cells after oxidative stress induction by 600 uM of H2O2, Western blot analysis was performed using their specific antibodies. A total of 20 ug of proteins from HTM lysates were separated by 12% SDS-PAGE electrophoresis under denaturing and reducing conditions. Protein bands were transferred to a polyvinylidene difluoride (PVDF) membrane, which was then blocked with 5% fat-free milk in tris buffered saline (TBS), pH 7.5, followed by incubation with anti-Apaf-1 (1:1000, 8969, cell signalling technology) and ATG-5 (1:1000, DF6010; Affinity biosciences) overnight at 4 °C with continuous shaking. Blots were washed with 1% TBST and then incubated with the respective secondary antibody (1:3000, Abcam) for 2 hours at room temperature. GAPDH was used as the protein loading control. Immunoreactive proteins were detected with Clarity Western luminol/enhancer and peroxidase solution (Bio-rad, United States). The protein levels were determined by densitometry with Image J (National Institutes of Health, Bethesda, MD).
Epigenetic Control of Cell Death Mechanisms
Since the switch of cell death pathways is governed by tight epigenetic control in tissue and peripheral blood, we evaluated the expression of specific epigenetic regulators. Histone modifications were studied using the EpiQuik Histone H3 Modification Multiplex Assay Kit (Colorimetric) according to manufacturer’s protocol and selected modifications significantly upregulated in cell lines after stress inductions were validated using immunoblotting.
Total proteins were extracted from HTM cells using 1X laemmli buffer (2% SDS, 10% glycerol, 50 mM Tris (6.8), bromophenol blue (0.05%), β-mercaptoethanol). Protein samples were strongly vortexed and boiled at 95 °C for 5 minutes and then sonicated at 40% amplitude 10 seconds on and off for 1 minute. Extracted samples were centrifuged at 12,000 rpm for 2 minutes. Protein samples were resolved in 10% SDS-PAGE (Bio-Rad Laboratories) and transferred to nitrocellulose membrane (Immobilon-N; Merck Millipore) using a mini trans-blot electrophoretic transfer system (Bio-Rad Laboratories) and probed with the following primary antibodies: anti-H3 (1:10,000), anti-H3K14ac (1:5000), anti-H3AK5ac (1:3000), anti-H3K18ac (1:3000) was used and bands were visualized by using enhanced Chemiluminescence (ECL) from Bio-Rad Laboratories. The blots were analyzed using the gel-Doc system (Bio-Rad laboratories) analysis. All experiments were carried out in triplicates.
Change in Gene Expression in Peripheral Blood
Since the TM tissue is bathed with aqueous humor, comparing changes in the peripheral blood versus the tissue changes would give an insight if the local tissue changes may represent an effect of peripheral stimuli or a local response restricted to the TM tissue only. We therefore compared the gene expression in the peripheral blood of these patients whose ex-vivo dissected TM specimens were analyzed. Whole blood was collected from patients whose TM specimens were collected (POAG, PACG and control (cataract)) into EDTA tubes. In addition, those with moderate stable glaucoma (not undergoing surgery) were also analyzed for gene expression in peripheral blood to compare with those with severe glaucoma. Whole blood was diluted with 1X phosphate- buffered saline (pH 7.2) in the ratio of 1:1. Aseptically 2.5 mL of Hisep LSM (Himedia) was overlaid with 7.5 mL of diluted blood in the proportion of 1:3 followed by centrifugation at 400 x g at room temperature for 30 minutes to separate the lymphocyte layer which was carefully aspirated. Equal volume of 1X PBS was added and mixed by gently aspiration and centrifuged at room temperature at 300 x g for 10 minutes. Cell death analysis by FACS and gene expression for cell death-related genes (described above) was carried out in PBMC. Immunoblotting was used to study histone modifications in PBMC as detailed earlier.
Quantification and Statistical Analysis
Image J was used to assess protein band intensities on Western blot. For all average intensities per pixel values were recorded, rectangular areas along the bands were selected with a width of 5 pixels. Background intensities were also subtracted. Data from each experiment were analyzed using Graph-Pad Prism with column and grouped comparison. Results were presented as means ± standard error of mean (SEM) of triplicate experiments. Data were analyzed by ANOVA post hoc t test with Tukey correction with P value of <0.05 considered significant.
Results
Autophagy and Apoptosis Proteins in ex-vivo Dissected TM Tissue in Severe Glaucoma While Autophagy Predominant Over Apoptosis in HTM Cells After Severe Oxidative Stress
Table 1 gives the demographic and clinical characteristics of patients included in the study. Of 1813 proteins identified, we found 797 unique elements in POAG and PACG compared to controls, with a total of 12 identifiable and quantifiable proteins in POAG and 7 in PACG proteins found differentially expressed compared to controls, Figure 1. We also found myocilin and AQP1 apart from other proteins which were specific markers for TM tissue, Table 2. Categorising proteins according to functional relevance, we could see the overall distribution of the 797 proteins in diverse cellular functional categories with most proteins in POAG and PACG were involved in response to stimulus and defence response, cell death and cell movement organisation. Most of them were extracellular or membrane proteins (as opposed to membrane proteins in controls) involved in protein binding and catalytic activity or structural molecular activity, Figure S1.
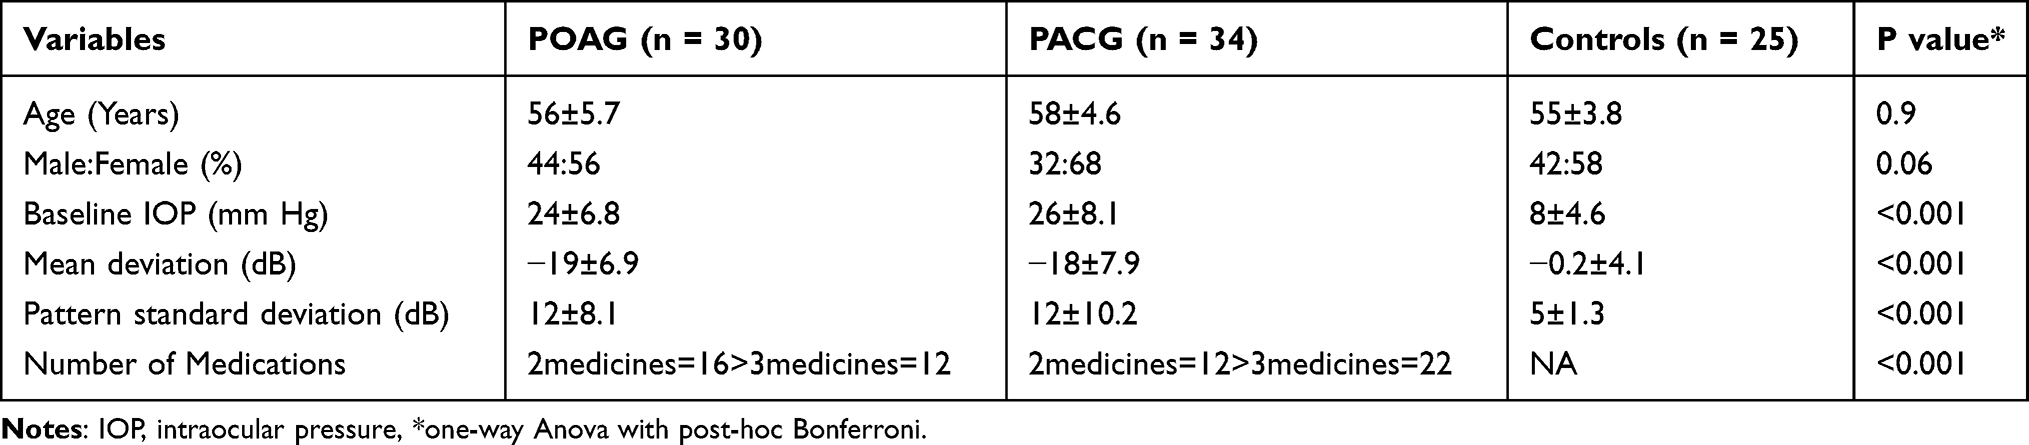 |
Table 1 Demographic and Clinical Profile of Patients with Adult Primary Glaucoma |
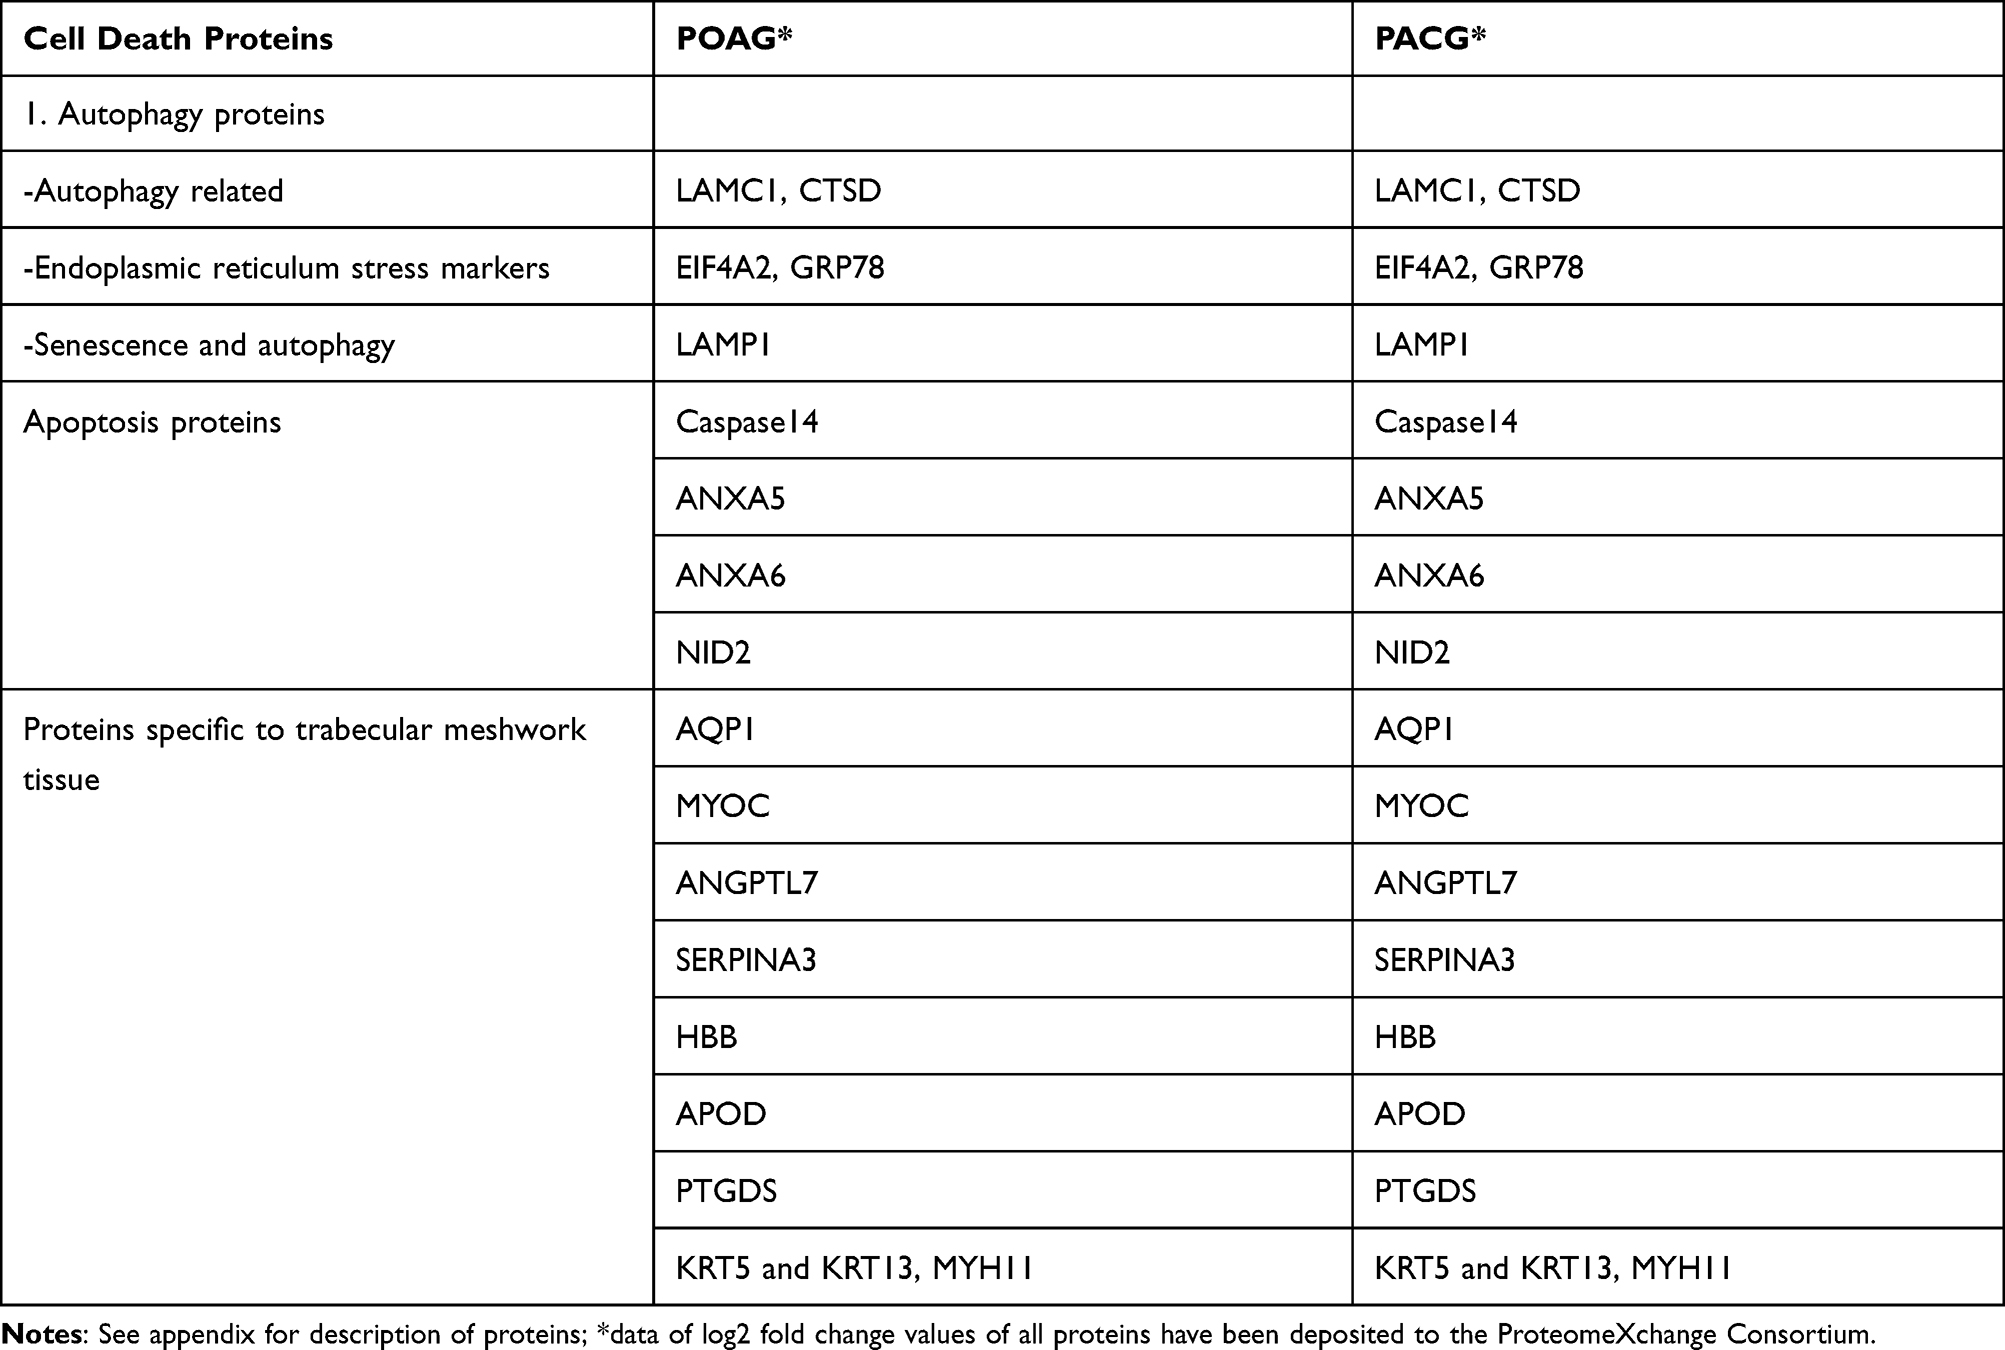 |
Table 2 List of Proteins Related to Apoptosis, Autophagy and TGF Beta Signaling Pathways in the Trabecular Meshwork of Patients with Severe Adult Primary Glaucoma |
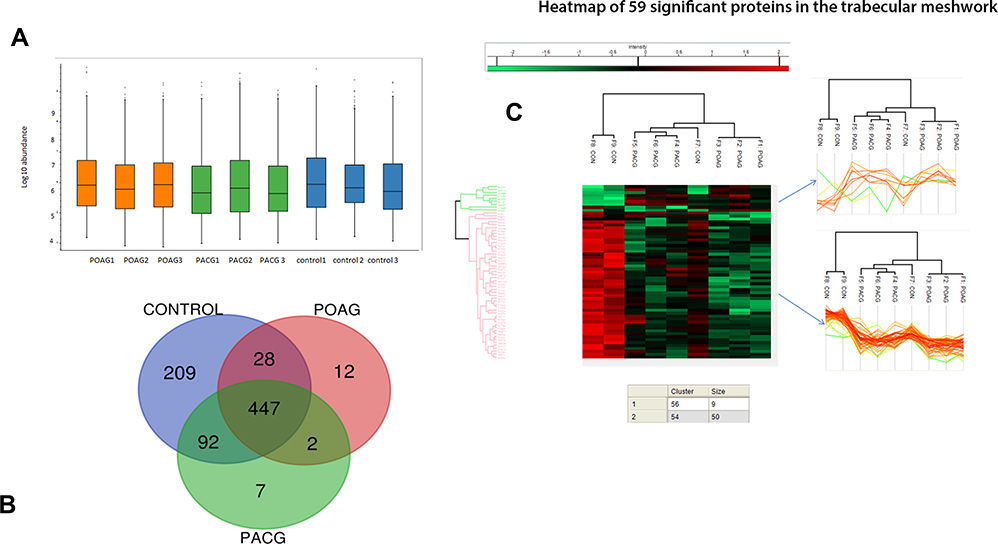 |
Figure 1 (A) shows the box plot of the protein expressions in triplicate samples of each of primary open angle glaucoma, primary angle closure glaucoma and controls showing very little variability among the triplicate experiments. (B) shows the venn diagram of differential expression of proteins among glaucoma and controls while (C) shows the heat map of the significantly differentially expressed proteins primarily belonging to two clusters as shown. |
Both POAG and PACG TM tissues had several proteins which were significantly different from that of controls of which most were either ECM-related or cell death proteins, Figure S1 and S2. Both apoptosis and autophagy proteins were overexpressed in severe POAG > PACG samples compared to controls. Notably, apoptotic protein, caspase 14, was under-expressed in severe POAG and PACG specimens while autophagy-related LAMC1 protein was overexpressed in severe POAG > severe PACG, Figure S1. We also found endoplasmic reticulum stress markers namely, translation initiation factor2α (eIF2) and ER chaperone GRP78 (glucose-regulated protein) to be overexpressed in POAG and PACG compared to controls, Table 2.
Stress induction on in-vitro HTM cell lines with reduced cell survival was seen to start at 400–1000 uM concentration at 48–72 hours and this response correlated with maximum cell death at 72 hours, Figure 2A. Flow cytometry results also showed parallel changes with maximum early and late apoptotic cells at 72 hours with some necrotic cells, Figure 2B and C in HTM gating cell population (Figure S5).
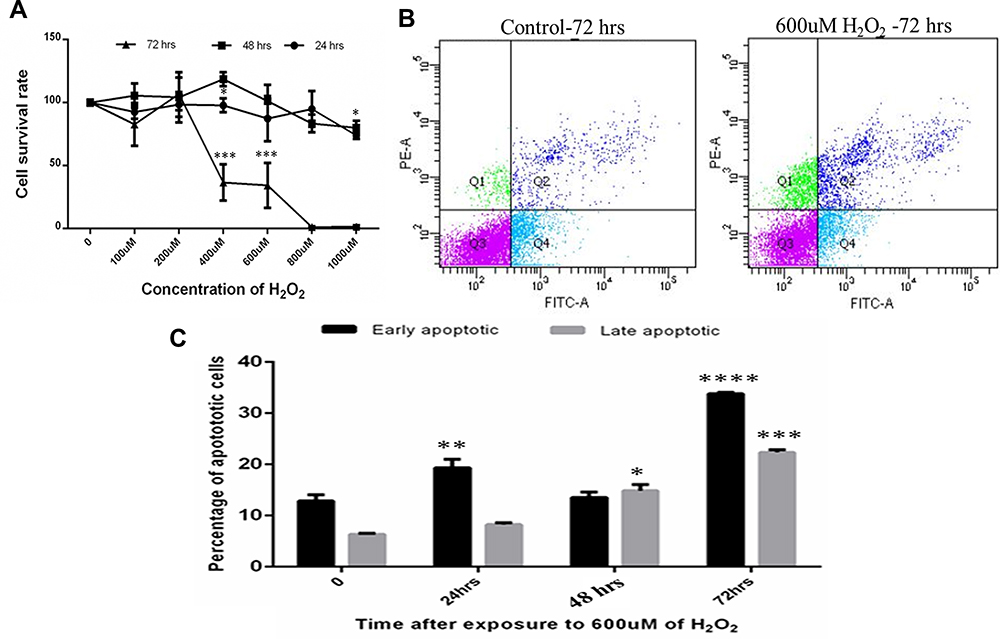 |
Figure 2 (A) MTT assay of Human trabecular meshwork cells after oxidative stress with H2O2. (B) shows the representation of FACS analysis of cells at 72 hours compared with control (Q1: necrotic cells, Q2: early apoptotic cells Q3: healthy cell, Q4: late apoptotic cells). (C) showing percentage of early and late apoptotic cells maximum at 72 hours in 600 uM of H2O2 concentration. Means ± SEM shown, *p<0.05, **p<0.01, ***p<0.001, ****p<0.0001 one way ANOVA post hoc t test with Tukey correction. |
Analyzing HTM cell gene expression at 48 hours (similar to moderate glaucoma) and 72 hours (maximum cell death similar to severe glaucoma stage) of oxidative stress, autophagy genes were parallelly up-regulated at 48–72 hours, which was in contrast to apoptosis-related genes showing downregulation at 72 hours, Figure 3A and B. Apoptosis genes were upregulated at 48 hours of H2O2 exposure while several genes like BCL, FASL and CASP7 were downregulated after 72 hours of exposure, simulating changes in HTM tissue specimens in severe glaucoma, Figure 3A. Necrosis genes were also seen to be maximally upregulated at 48 hours compared to 72 hours where most genes were downregulated or minimally functional, Figure 3C. The protein levels of apoptosis (Apaf-1) and autophagy markers (ATG-5) were also compared in different time intervals after 600 uM of H2O2 treatment in HTM cells. It was observed that there was a gradual increase in the expression of apaf-1 at 42 hours, but the expression got decreased at 72 hours, whereas the expression of ATG-5 is subsequently increased at 72 hours, Figure 3D and E. Histone modifications of H2 and H3 were also observed to visualize the epigenetics modifications on HTM cells upon H2O2 treatment. It was observed that the level of H3K18ac was decreased in 48 hours and then increased in 72 hours. Whereas the level of H2AK5ac was decreased in 46 and 72 hours respectively, and the level of H3K14ac did not show any significant changes for 24 and 72 hours but there is a decrease in 48 hours, Figure 3F and G.
 |
Figure 3 Relative gene expression of apoptosis (A), autophagy (B), and necrosis (C) related genes in in-vitro primary human trabecular meshwork cells after 48 hours and 72 hours of oxidative stress with H2O2 relatively compared with control and normalized with the average CT of ACTB, GAPDH, HPRT1, RPLP20 and HGDC. (D and E) protein expression of apoptosis and autophagy markers and densitometry analysis in HTM cells after 600uM H202 treatment in HTM cells at 24, 48 and 72 hours by western. (F and G) epigenetic modifications of histones ie, H2 and H3 and densitometry analysis after 600 uM of H2O2 treatment in HTM cells at 24, 48 and 72 hours. Means ± SEM shown, *p<0.05, **p<0.01, ***p<0.001 one way ANOVA post hoc t test with Tukey correction. |
Switch to Autophagy in Peripheral Blood of Severe Glaucoma and Epigenetic Control of Cell Death
Flow cytometry on PBMC showed significantly higher (>2 times higher) pro-apoptotic and apoptotic PBMC cells in glaucoma cases and POAG > PACG eyes, Figure S3. Interestingly, autophagy genes showed an abrupt upregulation of genes like AKT1 and ATG16 seen in severe glaucoma as opposed to downregulation in moderate POAG and PACG, Figure S4A–D. In contrast, the PBMC cells in severe glaucoma showed apoptotic genes to be downregulated in severe glaucoma in both POAG and PACG, Figure S4E–G with necrosis genes showing minimal changes between glaucoma stages, Figure S4H and I.
These findings suggest that in PBMC, autophagy may be the predominant mechanism of cell death in severe glaucoma, wherein, the autophagy-related process may be the driving force chosen for cell death over apoptosis. This mirrored the proteome results in TM dissected tissues and HTM experiments, where autophagy-related proteins were over-expressed in severe glaucoma. To evaluate if epigenetic regulatory mechanisms may explain this switch in preference of the cell death process with different glaucoma stages, we evaluated the histone modifications in PBMC and on in-vitro cell cultures after stress.
Concurring with several histone proteins over-expressed in TM tissues (Supplemental Methods), immunoblotting showed increased expression of H3K14ac in severe POAG and PACG, Figure S4J and K, while other methylation changes were seen over-expressed only in severe POAG and minimal in other stages of POAG or PACG.
Discussion
This study found several proteins and genes related to autophagy to be predominantly expressed over apoptosis in TM tissue or HTM cell lines in-vitro after severe oxidative stress like clinically severe glaucoma. In-vitro study showed that autophagy was preferentially favored over apoptosis as cell death/repair mechanism beyond 48 hours (or severe glaucoma phenotype). Similar results were seen in PBMC where autophagy genes were abruptly upregulated in severe POAG and PACG compared to moderate glaucoma. This was also associated with a complete lack of any necrosis-related proteins in severe TM tissues and downregulation of necrosis genes in HTM cells after 72 hours of stress. Tight regulation of the crosstalk between autophagy and apoptosis in the TM seems to favor autophagy as predominant cell death/repair mechanism in severe glaucoma.
Autophagy-related proteins were overexpressed in POAG and PACG TM tissues in this study along with ER markers, suggesting a clear role of autophagy in cell death in severe stages of glaucoma. Since a temporal preference of one mechanism over another in patients or on surgical specimens is not feasible, we confirmed that autophagy seems to be preferred over other cell death mechanisms in PBMC and on in-vitro HTM cell lines after oxidative stress. The exact mechanism by which the cell population is reduced, and cell function is altered in different disease stages in glaucomatous human TM tissues is unknown, although several potential mechanisms have been suggested, including vacuole mediated phagocytosis and apoptotic death.3–7 What mediates the cell death or repair in TM tissue and specific events by which the repair mechanisms get overwhelmed by cell death process in different disease stages, is unexplored. Oxidative stress mediated cell death is well known in TM which has been reported in earlier studies confirming the presence of stress markers in aqueous and TM specimens or donor corneas.10–14 Several apoptosis-related molecules have been known to be involved in TM specimens obtained from donor corneas and also in in-vitro HTM cell culture models after stress.12,14 Human trabecular meshwork cell lines can be induced towards programmed cell death via the Fas-FAsL pathway suggesting the role of apoptosis in TM cell death.13 Raised IOP is supposed to create mechanical stress on the TM cells which is tightly regulated via cochlins and other genes to regulate the tone or response to stretch in TM cells.10 How this destructive cycle is self-perpetuating in moderate or severe stages, and what pathways are involved in the TM mediating continued cell death in adjacent normal areas, has evaded a clear explanation.
Induction of autophagy has also been shown upon stress on in-vitro HTM cell lines after oxidative stress or to dexamethasone exposure.17–22,24,25 It is therefore possible that mechanisms related to those observed in oxidatively stressed TM cells lead to defective autophagic repair in glaucoma disease. One study showed increased autophagy events during TM aging as evidenced by the increase in the LC3 II/I ratio.25 Cathepsins are known to be directly involved in the autophagosome function, and their association with aging indicates that dysregulated autophagy may drive cell death in glaucoma. While several such isolated studies suggest the role of apoptosis and autophagy in the trabecular meshwork in glaucoma, relative contribution of each in different stages of glaucoma regulating cell death is unknown. Our study points towards relative favoring of autophagy over apoptosis or necrosis in severe stages of glaucoma both in tissues and in-vitro cell culture, which contrasts to conventional thought of cell death being mediated by apoptosis in advanced disease stages. Such biphasic changes in autophagy may presumably be considered to contribute to disease progression in TM tissues in glaucoma.
Disturbances in autophagy are associated with various diseases, including neurodegenerative disorders, such as Alzheimer’s, Parkinson’s, and Huntington’s diseases. Porter et al concluded that the stress induced decreased autophagic activity or repair mechanism in the TM may be responsible for glaucoma pathogenesis.18 Previous studies have shown that both autophagy and apoptosis regulate key cell functions while coexisting in the same cell through active regulatory feedback loops between the two processes.14,17,19,20,25–27 Autophagy may be initially activated by stress to exert cytoprotective effects until a specific threshold of stress, where apoptosis is activated. Reports suggest a dual role of autophagy which can either inhibit or stimulate apoptosis.15–17,20,21,25–30 It is therefore clear that the activation of autophagy may promote cell survival via the inhibition of apoptosis; and the over-activation of autophagy can either promote apoptosis or drive cells to undergo autophagic cell death. Our results suggest that switch to autophagy preferentially over apoptosis in peripheral blood may be the first precursor to the changes at the trabecular meshwork. This needs further validation on cell based in-vitro or experimental glaucoma model system-based modification of these pathways or molecules. It may be argued that apoptosis seen in TM specimens may be the result of several anti-glaucoma drugs, which is known to be caused by preservatives. Yet, addition of glaucoma drugs has not been shown to induce apoptotic cascades in cell lines, suggesting that studies reporting apoptosis in drug treated eyes may result from disease per se rather than drug-related changes. Besides, we took only patients with severe uncontrolled glaucoma for surgery which entailed that all these eyes were on the same class of maximal medical treatment albeit for different durations of time before surgery. So, the effect of drugs on the expression of apoptotic proteins may be minimal owing to the selection of patients/eyes on all classes of drugs at the time of surgical tissue harvesting.
In TM tissue with severe glaucoma, we found several proteins belonging to apoptosis extrinsic pathway to be under-expressed in both POAG and PACG tissues. In cell lines, while FASL, FAS-R among other molecules seemed to be downregulated at 72 hours of oxidative stress exposure in contrast to Apaf1 which remained upregulated. Molecules like Caspases, the effector molecules, mediating the execution phase seem to get downregulated in severe stress at 72 hours after initial upregulation at 48 hours (and 24 hours, data not shown). These findings suggest that continued exposure to stress in severe glaucoma seems to overwhelm the apoptotic extrinsic pathway in the TM tissue. This correlates with maximum cell death seen after 72 hours of stress exposure, suggesting that cell death in these severe stress conditions occurs by alternate mechanisms like autophagy. Regulation of cell death is one of the prime functions that determine the final fate of the cell.8–10 Autophagy is activated in response to several stressors like starvation, ER stress and oxidative stress and plays an important role in development and disease.8,10,18–20 While several links between apoptosis and autophagy have been found, exact regulation of this crosstalk in different diseases is not yet explored. In glaucoma, autophagy seems to be preferred over apoptosis in advanced stages. Whether this is a protective or destructive function in-vivo in peripheral blood or in the TM tissue remains unclear.
We also could not find other ATG proteins or necrosis-related proteins in the TM tissue,15 though we found end products of the cell death pathways including caspase-14 which were under-expressed in TM tissues and ER stress markers like GRP78 to be over-expressed in POAG and PACG. In HTM cell cultures, autophagy genes were significantly upregulated after continued exposure to oxidative stress. We are not sure if these proteins are altered during surgical dissection or are not in quantifiable amounts in the TM tissue. Also, it is plausible to expect that earlier proteins like BCN and ATG proteins may not be found in ex-vivo dissected tissues in the advanced stage at the time of surgery, where the end products of such a cascade of events or molecules involved in these end stage process like lysosomal fusion may be seen. The tissue changes therefore reflect the snapshot of activities that could have taken place earlier.
Histone modifications such as trimethylation of H3 lysine 4 (H3K4me3) and hyperacetylation of histone H3 and H4 are known to cause gene activation and active transcription while methylation of H3K9 and H3K27 are known to cause gene repression or silencing.31–34 Recent evidence shows that HDAC 2 and 3 transcripts are significantly increased with decreased histone H4 acetylation in retinal ganglion cells after acute optic nerve injury.34 Furthermore, significant differences in genomic DNA methylation have been found in peripheral mononuclear cells from patients with open angle glaucoma compared with healthy controls. Reports also suggest that abnormal histone acetylation/deacetylation may be related to retinal ganglion cell damage in glaucoma.8,10,32–34 We only found H3Kme3 to be overexpressed in severe glaucoma cases suggesting a possible regulatory role in causing the autophagy switch and cascade in advanced disease stages. Changes in the peripheral blood may be expected to regulate tissue gene expression which is of interest with respect to the TM. Traditionally, H3 and H4 are known in glaucoma though the role of H2 and H1 was hitherto unknown in glaucoma pathogenesis. It may be possible that such epigenetic changes may underlie the basis of progression which may be IOP dependent or independent. To the best of our knowledge, there is no report to show the role of histone acetylation in the progression of glaucoma or stage transition which requires further research.
In summary, this study shows autophagy proteins and genes predominating over apoptosis or necrosis in severe glaucoma, while in moderate glaucoma, each may be acting independently. The switch to autophagy in peripheral blood or TM tissue seems to be a tightly regulated mechanism of cell death control in different glaucoma stages, reflecting that this could be used as a surrogate for the progression of disease severity in adult primary glaucoma.
Abbreviations
POAG, primary open angle glaucoma; PACG, primary angle closure glaucoma; TM, trabecular meshwork; HTM, human trabecular meshwork, refers to primary cell lines, refer to text for details; IOP, intraocular pressure; PBMC, peripheral blood mononuclear cells. Gene abbreviations listed separately in Supplemental Methods and Appendix of abbreviations.
Data Sharing Statement
All data generated or analysed during this study are included in this published article (and its supplementary information files). Protein database is uploaded at proteome exchange with the dataset identifier PXD010752. The mass spectrometry proteomics data have been deposited to the ProteomeXchange Consortium via the PRIDE partner repository with the dataset identifier PXD010752-Submission Reference: 1-20180810-113504.
Ethics Approval and Consent to Participate
This study was approved by the institutional review board of LV Prasad Eye Institute, MTC campus, Bhubaneswar, India.
Acknowledgments
We would like to thank all patients who participated in the study, Dr Ravindran and Birender Prusty for helping with cytokine analysis at ILS, Bhubaneswar. We would also like to thank Mr Bikash Sahoo for helping us with the FACS analysis on PBMC and HTM cells in KSBT, KIIT.
Author Contributions
APR – conception, design of the work; the acquisition, analysis, interpretation of data; funding, supervision, administrative, the creation of new software used in the work; drafted the work and substantively revised it.
PS – design of the work; the acquisition, analysis, interpretation of data; substantively revised it.
MC – design of the work; the acquisition, analysis, interpretation of data; substantively revised it.
BP – design of the work; the acquisition, analysis, the creation of new software used in the work, interpretation of data; substantively revised it.
SS – design of the work; the acquisition, analysis, interpretation of data; substantively revised it.
GDJ – design of the work; the acquisition, analysis, interpretation of data; substantively revised it.
PM – the acquisition, interpretation of data; substantively revised it.
RM – design of the work; the acquisition, analysis, interpretation of data; substantively revised it.
MS – design of the work; the acquisition, analysis, interpretation of data; substantively revised it.
All authors have read and approved the manuscript.
All authors made substantial contributions to conception and design, acquisition of data, or analysis and interpretation of data; took part in drafting the article or revising it critically for important intellectual content; agreed to submit to the current journal; gave final approval of the version to be published; and agree to be accountable for all aspects of the work.
Funding
This study was partly funded by the DBT Wellcome Trust grant: ref no IA/CPHI/15/1/502031, Role of funder - for HTM in-vitro based experiments.
Disclosure
The authors declare that they have no competing interests in this work.
Referencesa
1. Tham YC, Li X, Wong TY, Quigley HA, Aung T, Cheng CY. Global prevalence of glaucoma and projections of glaucoma burden through 2040: a systematic review and meta-analysis. Ophthalmology. 2014;121:2081–2090. doi:10.1016/j.ophtha.2014.05.013
2. George R, Ve RS, Vijaya L. Glaucoma in India: estimated burden of disease. J Glaucoma. 2010;19:391–397. doi:10.1097/IJG.0b013e3181c4ac5b
3. Stamer WD, Acott TS. Current understanding of conventional outflow dysfunction in glaucoma. CurrOpinOphthalmol. 2012;23:135–143.
4. Liton PB, Challa P, Stinnett S, Luna C, Epstein DL, Gonzalez P. Cellular senescence in the glaucomatous outflow pathway. ExpGerontol. 2005;40:745–748.
5. Bill A, Phillips CI. Uveoscleral drainage of aqueous humor in human eyes. Exp Eye Res. 1971;12:275–281. doi:10.1016/0014-4835(71)90149-7
6. Alvarado J, Murphy C, Polansky J, Juster R. Age-related changes in trabecular meshwork cellularity. Invest Ophthalmol Vis Sci. 1981;21:714–727.
7. Grierson I, Howes RC. Age-related depletion of the cell population in the human trabecular meshwork. Eye. 1987;1:204–210. doi:10.1038/eye.1987.38
8. Lambert W. Programmed cell death: concept, mechanism and control. Biol Rev Camb Philos Soc. 1992;67:287–319. doi:10.1111/j.1469-185X.1992.tb00727.x
9. Baleriola J, García-Feijoo J, Martínez-de-la-casa JM, et al. Apoptosis in the trabecular meshwork of glaucomatous patients. Mol Vis. 2008;14:1513–1516.
10. Saccà SC, Izzotti A. Focus On molecular events in the anterior chamber leading to glaucoma. Cell Mol Life Sci. 2014;12:2197–2218.
11. Agarwal R, Talati M, Lambert W, et al. Fas-activated apoptosis and apoptosis mediators in human trabecular meshwork cells. Exp Eye Res. 1999;68:583–590. doi:10.1006/exer.1998.0636
12. Welge-Lüssen U, Birke K. Oxidative stress in the trabecular meshwork of POAG. Klin Monbl Augenheilkd. 2010;227:99–107. doi:10.1055/s-0029-1245171
13. Razeghinejad MR, Kamali-Sarvestani E. Aqueous humor levels of soluble Fas and Fas-ligand in patients with primary open angle and pseudoexfoliation glaucoma. Iran J Immunol. 2007;4:215–219.
14. Aktas Z, Karaca EE, Gonul II, Hasanreisoglu M, Onol M. Apoptosis in the iris and trabecular meshwork of medically treated and untreated primary open angle glaucoma patients. Int J Ophthalmol. 2013;6:827–830. doi:10.3980/j.issn.2222-3959.2013.06.15
15. Mizushima N. Autophagy: process and function. Genes Dev. 2007;21:2861–2873. doi:10.1101/gad.1599207
16. Liton PB, Lin Y, Gonzalez P, Epstein DL. Potential role of lysosomal dysfunction in the pathogenesis of primary open angle glaucoma. Autophagy. 2009;5:122–124. doi:10.4161/auto.5.1.7304
17. Liton PB, Lin Y, Luna C, Li G, Gonzalez P, Epstein DL. Cultured porcine trabecular meshwork cells display altered lysosomal function when subjected to chronic oxidative stress. Invest Ophthalmol Vis Sci. 2008;49:3961–3969. doi:10.1167/iovs.08-1915
18. Porter K, Hirt J, Stamer WD, Liton PB. Autophagic dysregulation in glaucomatous trabecular meshwork cells. Biochim Biophys Acta. 2015;1852:379–385. doi:10.1016/j.bbadis.2014.11.021
19. Stothert AR, Fontaine SN, Sabbagh JJ, Dickey CA. Targeting the ER-autophagy system in the trabecular meshwork to treat glaucoma. Exp Eye Res. 2016;144:38–45. doi:10.1016/j.exer.2015.08.017
20. Hirt J, Liton PB. Autophagy and mechanotransduction in outflow pathway cells. Exp Eye Res. 2017;158:146–153. doi:10.1016/j.exer.2016.06.021
21. Suntharalingam A, Abisambra JF, O’Leary JC. Glucose-regulated protein 94 triage of mutant myocilin through endoplasmic reticulum-associated degradation subverts a more efficient autophagic clearance mechanism. J Biol Chem. 2012;287(48):40661–40669. doi:10.1074/jbc.M112.384800
22. Porter KM, Jeyabalan N, Liton PB. MTOR-independent induction of autophagy in trabecular meshwork cells subjected to biaxial stretch. Biochim Biophys Acta. 1843;2014:1054–1062.
23. Sahay P, Rao A, Padhy D, et al. Functional Activity of Matrix Metalloproteinases 2 and 9 in Tears of Patients with Glaucoma. Invest Ophthalmol Vis Sci. 2017;58(6):BIO106–BIO113. doi:10.1167/iovs.17-21723
24. Porter K, Nallathambi J, Lin Y, Liton PB. Lysosomal basification and decreased autophagic flux in oxidatively stressed trabecular meshwork cells: implications for glaucoma pathogenesis. Autophagy. 2013;9(4):581–594. doi:10.4161/auto.23568
25. Pulliero A, Seydel A, Camoirano A, et al. Oxidative damage and autophagy in the human trabecular meshwork as related with ageing. PLoS One. 2014;19:e98106. doi:10.1371/journal.pone.0098106
26. Saccà SC, Pulliero A, Izzotti A. The dysfunction of the trabecular meshwork during glaucoma course. J Cell Physiol. 2015;230:510–525.
27. Stamer WD, Clark AF. The many faces of the trabecular meshwork cell. Exp Eye Res. 2017;158:112–123. doi:10.1016/j.exer.2016.07.009
28. Stamer WD, Acott TS. Current understanding of conventional outflow dysfunction in glaucoma. CurrOpinOphthalmol. 2012;23:135–143.
29. Tezel G. Oxidative stress in glaucomatous neurodegeneration: mechanisms and consequences. Prog Retin Eye Res. 2006;25:490–513.
30. Yu L, Lenardo MJ, Baehrecke EH. Autophagy and caspases: a new cell death program. Cell Cycle. 2004;3:1124–1126. doi:10.4161/cc.3.9.1097
31. Mazzio EA, Soliman KF. Basic concepts of epigenetics: impact of environmental signals on gene expression. Epigenetics. 2012;7:119–130. doi:10.4161/epi.7.2.18764
32. Gibney ER, Nolan CM. Epigenetics and gene expression. Heredity. 2010;105:4–13. doi:10.1038/hdy.2010.54
33. Portela A, Esteller M. Epigenetic modifications and human disease. Nat Biotechnol. 2010;28:1057–1068. doi:10.1038/nbt.1685
34. Qureshi IA, Mehler ME. Advances in epigenetics and epigenomics for neurodegenerative diseases. Curr Neurol Neurosci Rep. 2011;11:464–473. doi:10.1007/s11910-011-0210-2
 © 2021 The Author(s). This work is published and licensed by Dove Medical Press Limited. The
full terms of this license are available at https://www.dovepress.com/terms
and incorporate the Creative Commons Attribution
- Non Commercial (unported, 3.0) License.
By accessing the work you hereby accept the Terms. Non-commercial uses of the work are permitted
without any further permission from Dove Medical Press Limited, provided the work is properly
attributed. For permission for commercial use of this work, please see paragraphs 4.2 and 5 of our Terms.
© 2021 The Author(s). This work is published and licensed by Dove Medical Press Limited. The
full terms of this license are available at https://www.dovepress.com/terms
and incorporate the Creative Commons Attribution
- Non Commercial (unported, 3.0) License.
By accessing the work you hereby accept the Terms. Non-commercial uses of the work are permitted
without any further permission from Dove Medical Press Limited, provided the work is properly
attributed. For permission for commercial use of this work, please see paragraphs 4.2 and 5 of our Terms.