Back to Journals » Clinical, Cosmetic and Investigational Dentistry » Volume 17
Surface Roughness and Color Stability of Conventional and Bulk-Fill Resin Composite with S-PRG Fillers After Coffee Exposure: An in-vitro Study
Authors Janisch FADS, Falcon Aguilar M ![]() , Aguiar FHB
, Aguiar FHB ![]() , França FMG, Basting RT, Vieira-Junior WF
, França FMG, Basting RT, Vieira-Junior WF ![]()
Received 18 September 2024
Accepted for publication 25 December 2024
Published 8 January 2025 Volume 2025:17 Pages 21—29
DOI https://doi.org/10.2147/CCIDE.S496750
Checked for plagiarism Yes
Review by Single anonymous peer review
Peer reviewer comments 4
Editor who approved publication: Professor Christopher E. Okunseri
Fabiano Augusto Dos Santos Janisch,1 Milagros Falcon Aguilar,2 Flávio Henrique Baggio Aguiar,2 Fabiana Mantovani Gomes França,1 Roberta Tarkany Basting,1 Waldemir Francisco Vieira-Junior2
1Department of Restorative Dentistry, Faculdade São Leopoldo Mandic, Campinas, SP, Brazil; 2Department of Restorative Dentistry, Faculdade de Odontologia de Piracicaba, Universidade Estadual de Campinas, Piracicaba, SP, Brazil
Correspondence: Waldemir Francisco Vieira-Junior, Faculdade de Odontologia de Piracicaba, Universidade, Estadual de Campinas, Av. Limeira, 901 – Areião, Piracicaba, SP, Brazil, Tel +55 (19) 21065220, Email [email protected]
Objective: This study aimed to evaluate the in vitro effects of coffee exposure on the color and roughness of conventional and bulk-fill resin composites, with and without surface pre-reacted glass-ionomer (S-PRG) filler.
Methodology: Forty-eight cylindrical samples (Ø 6 mm × 2 mm) were prepared and categorized as follows (n = 12 per group): conventional nano-hybrid (Tetric N-Ceram, Ivoclar); nano-hybrid with S-PRG filler (Beautifil II, Shofu); bulk-fill (Tetric N-Ceram Bulk Fill, Ivoclar); and bulk-fill with S-PRG filler (Beautifil Bulk Restorative, Shofu). The samples were assessed for surface roughness (Ra, μm), color coordinates (CIE Lab), and overall color change (ΔEab, ΔE00). Measurements were taken at baseline and after 7 days of coffee immersion (pH = 4.95). Data were analyzed using generalized linear models, Kruskal–Wallis, Dunn, and paired Wilcoxon tests (α = 0.05).
Results: After the coffee exposure, all resin composites exhibited a significant decrease in L* (towards black), an increase in a* (towards red), an increase in b* (towards yellow), and a higher Vita color score (p < 0.05). Tetric N-Ceram demonstrated the lowest roughness values post-exposure; however, a significant increase in roughness over time was observed only for Tetric N-Ceram Bulk Fill (p < 0.05). For ΔEab, Beautifil Bulk Restorative and Tetric N-Ceram showed higher values compared to Beautifil II. For ΔE00, a significant difference was noted between Beautifil Bulk Restorative and Beautifil II (p < 0.05).
Conclusion: Resin composites with S-PRG fillers exhibited similar pigmentation dynamics to conventional composite but showed greater surface roughness after exposure to coffee. Considering the S-PRG materials, the bulk-fill version is more susceptible to staining.
Keywords: composite resins, coffee, color, surface properties
Introduction
Resin composites consist of an organic matrix, filler particles, reaction initiators, and bonding agents,1 a composition that enables their versatile application in dentistry.2 These materials are used in both direct and indirect dental restorations, with formulations suitable for application in both anterior and posterior teeth.2,3 Often employed in aesthetic dental restorations, resin composites can be classified based on particle size or monomer properties,2,4 which influence the material’s viscosity, handling,3 physical properties,5,6 and the clinical performance of the restoration.7–9
However, resin composites are generally susceptible to aging and degradation in the oral environment, a process that can lead to irreversible changes in their original properties.10 These alterations may involve changes in physical properties or aesthetic appearance, thereby impacting clinical performance.11 Consequently, modifications to the surface profile can increase susceptibility to staining through the deposition and incorporation of pigments, which promotes biofilm accumulation and, in turn, the development of gingival inflammation and secondary caries lesions.12,13
Staining and pigmentation of resin composites occur through different mechanisms: intrinsic pigmentation, resulting from the material’s aging; extrinsic pigmentation, caused by biofilm accumulation and color changes from dietary intake or habits; and surface degradation, prompted by pigmenting agents, which can lead to the absorption and adsorption of pigments by the material.14,15 Consequently, the pigmentation is influenced by the material’s inherent properties, the characteristics of the oral environment, the nature of the pigmenting agent, patient habits, and professional practices during restorative and polishing procedures.16 The type of resin matrix, the percentage of inorganic particles, and the size of the particles also play a role in the pigmentation of resin composites.14,15
Resin composites are continuously evolving, with recent examples including high-viscosity and low-viscosity bulk-fill resin composites that have launched in the past decade.4 Bulk-fill resin composites, which can be placed in increments of 4 to 5 mm, are primarily indicated for posterior restorations and have gained widespread use due to their ability to simplify the process of material placement in cavities.17 Their clinical efficacy is comparable to that of conventional resin composites, regardless of the type of restoration (Class I and II).18
The impact of pigmenting agents on the color stability of bulk-fill resin composites remains controversial. Some studies suggest that bulk-fill resin composites have lower color stability when exposed to staining,19,20, while others report higher color stability compared to conventional resin composites.21 The full evaluation of these materials, particularly in terms of pigmentation dynamics and the incorporation of bioactive particles, remains incomplete. It is important to note that although the significance of color in posterior restorations has been debated, discoloration at the margins and within the body of restorations remains a relevant reason for their replacement.22
Among the materials mentioned, resin composites containing S-PRG (Surface Pre-Reacted Glass Ionomer) fillers have been developed, primarily characterized by its bioactivity.23 The S-PRG particles included in its composition, when in contact with biological fluids, facilitate the release of ions such as phosphate, fluoride, and calcium, which influence the material’s ability to form new apatites.23 Additionally, it possesses antibacterial and anti-inflammatory properties.24 These materials have a wide range of clinical indications, including cervical and occlusal restorations, direct veneers, treatment of hypersensitivity in areas of exposed dentin, cementation and bonding of orthodontic brackets,23 and in areas more prone to secondary caries lesions.25
Bioactive resin composites containing S-PRG fillers have been introduced to the market for use in a wide range of clinical applications, including conventional and bulk-fill resin composites versions. However, the limited research on these materials highlights the need for a deeper understanding of their properties, particularly their color stability, susceptibility to staining, pigmentation dynamics, and changes in surface roughness. Therefore, this study aimed to evaluate in vitro the effect of coffee exposure on the color and roughness properties of conventional and bulk-fill resin composites, with and without S-PRG fillers. The null hypotheses stated that the S-PRG resin composites tested do not differ from conventional resin composites exposed to coffee, nor do they differ between each other,in terms of 1) color properties and 2) surface roughness.
Materials and Methods
Study Design
Forty-eight cylindrical resin composite samples were obtained, with n = 12 for each group. Four types of resin composites were evaluated: conventional nano-hybrid resin composite (Tetric N-Ceram, Ivoclar Vivadent), nano-hybrid resin composite with S-PRG fillers (Beautifil II, Shofu), bulk-fill resin composite (Tetric N-Ceram Bulk Fill, Ivoclar Vivadent), and bulk-fill resin composite with S-PRG fillers (Beautifil Bulk Restorative, Shofu). The samples were assessed for color (CIE Lab, ΔEab, ΔE00, Vita Scale) and roughness (Ra) at baseline and after immersion in coffee.
Sample size calculation: The analysis was performed using G*Power software. A sample size of 12 specimens per resin composite, totaling 48 specimens, ensures a test power of at least 80% (β = 0.20) for the main effects of resin composite and time, as well as for the interaction between them (resin composite × time), in a repeated measures design over time. The significance level was set at 5% (α = 0.05), and the calculation was based on large effect sizes (f = 0.43).
Preparation of the Samples
Resin composites discs were prepared by placing the materials into a Teflon matrix with a diameter of 6 mm and a thickness of 2 mm. Each resin composite was inserted in a single 2 mm increment using an insertion spatula (Goldstein XTS Flex, HuFriedy, USA). The material was then covered with a polyester strip and a glass plate, and a 500 g weight was applied for 10 seconds to ensure proper compaction and the elimination of air bubbles in the uncured resin composite. Light curing was carried out using a corded LED device (Valo, Ultradent Products Inc., South Jordan, UT, USA) in standard mode with an irradiance of 1000 mW/cm², for 20 seconds.20 The irradiance was ensured by the manufacturer through regular maintenance. The samples were marked on the base to distinguish the analyzed top surface and were randomly distributed to the groups using a simple randomization. The technical specifications and details of the resin composites used in this study are presented in Table 1.
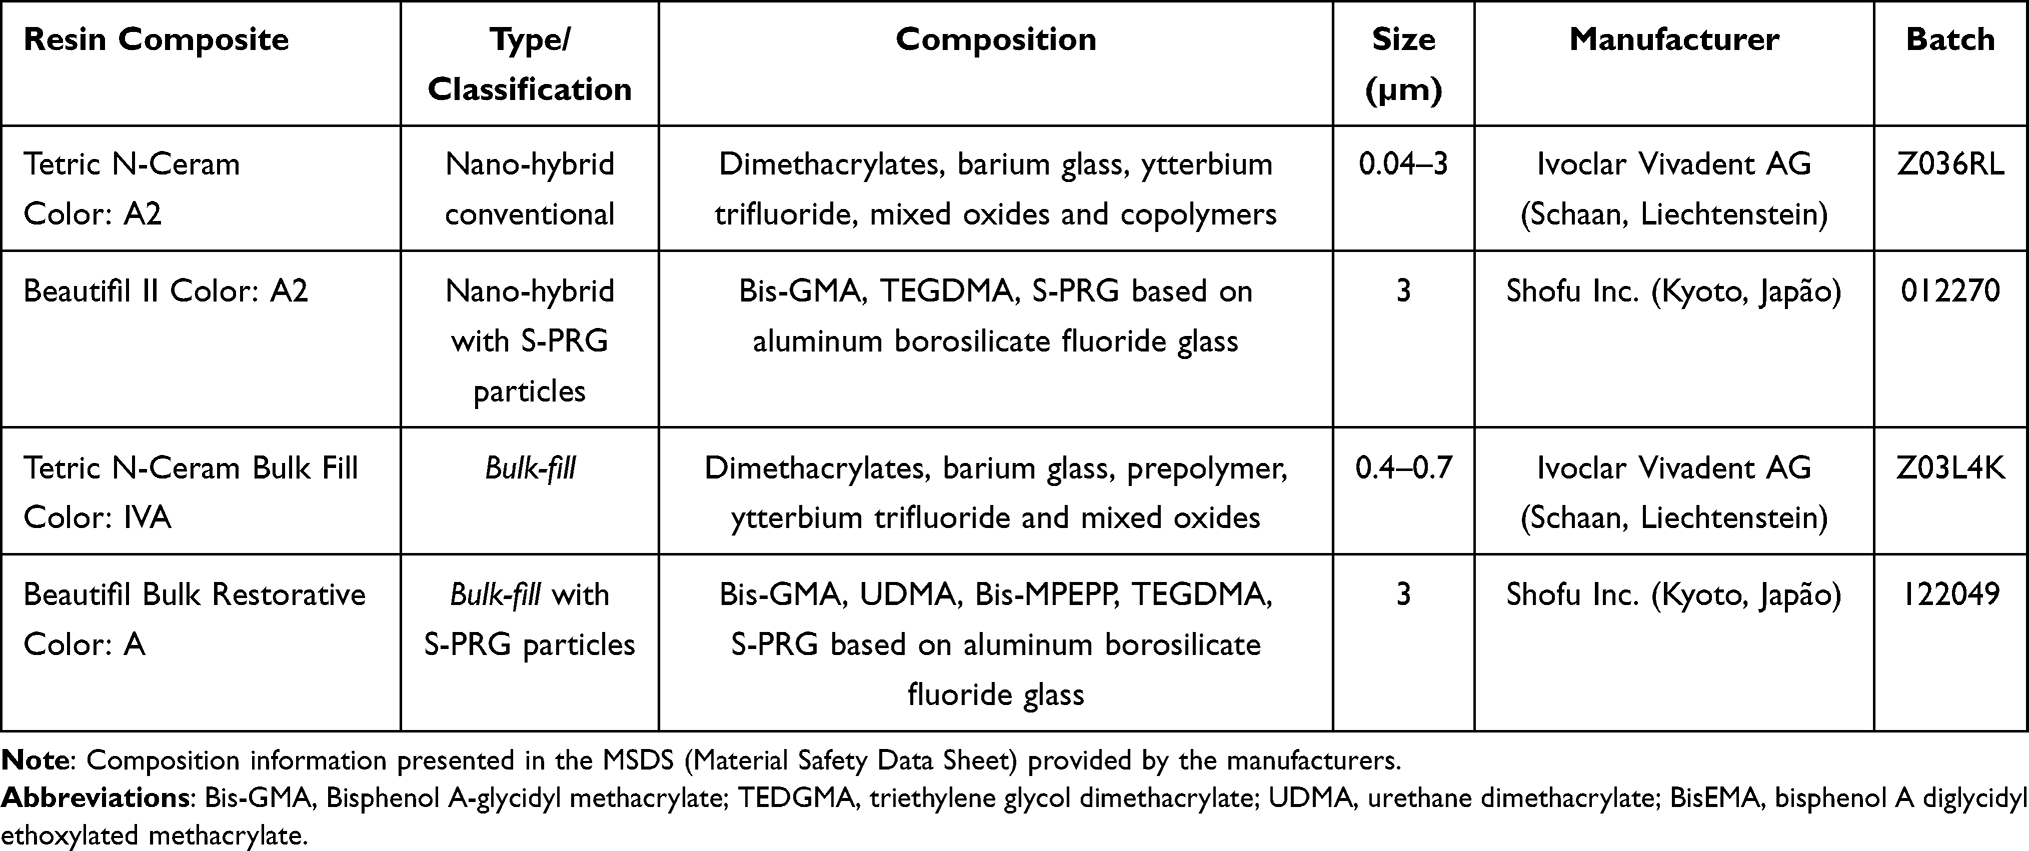 |
Table 1 Name, Classification, Composition, Manufacturer and Batch of Resin Composites |
Color Analysis
The color of each sample was recorded using a digital spectrophotometer (VITA Easyshade, VITA Zahnfabrik), with measurements taken against a white background for standardization.20 Color readings were recorded initially (baseline) and after 7 days of immersion in coffee (final).15
The device was calibrated according to the manufacturer’s instructions prior to use. The color data were quantified using the CIE Lab system, where the L* coordinate represents luminosity (black to white axis; 0 to 100), the a* coordinate indicates saturation on the red (+) and green (-) axis, and the b* coordinate denotes saturation on the yellow (+) and blue (-) axis. The overall color difference was calculated using the ΔEab and CIEDE2000 (ΔE00) formulas, which express the color variation between measurement times using the following formulas:26,27
ΔEab= √(∆L*)2 + (∆a*)2 + (∆b*)2
∆E00 = √(∆L´/kLSL)2 + (∆C´/kCSC)2 + (∆H´/kHSH)2 + RT(∆C´/kCSC) (∆H´/(kHSH)
In the ΔEab formula, L*, a*and b* represent the coordinates of the CIE Lab* color system.26 In the ΔE00 formula, ΔL* denotes the variation in the L* coordinate, which indicates luminosity (black-white axis); ΔC represents differences in chroma (saturation); ΔH reflects differences in hue; and RT is a function that accounts for the interaction between differences in chroma and hue in the blue region of the spectrum.27 The ΔE00 values were calculated sequentially as described by Sharma et al (2005).28 The Shade Guide Unit (SGU), based on the Vita scale, was determined using the same spectrophotometer. Scores ranging from 1 to 16 were assigned according to decreasing luminosity, from B1 to C4. The Vita Classical scale was determined by converting the color of the tooth into numbers, according to previously established numerical values, organized from number 1 (B1) to 16 (C4) in order of luminosity: B1, A1, B2, D2, A2, C1, C2, D4, A3, D3, B3, A3.5, B4, C3, A4 and C4.29,30
Surface Roughness Analysis
Surface roughness was assessed using a roughness meter (Surftest SJ-210, Mitutoyo Corporation, Kanagawa, Japan). Measurements were taken at two time points: initially (baseline) and after 7 days of immersion in coffee (final). The average roughness (Ra, μm) was recorded, representing the arithmetic mean of the peak-to-valley measurements across the surface, with measurement length = 1.25 mm and cut-off = 0.25.20 Three readings were taken for each surface, with the stylus passing through the center of the sample and taking measurements in three different positions after a 120° rotation of the sample base. The average roughness for each sample was calculated from these three readings.20
Coffee Exposure Protocol
Following the initial analyses, the samples were immersed in a coffee solution and incubated under standardized conditions at 37 °C for seven days.15 The container was sealed with a lid to prevent liquid evaporation. The coffee solution (pH = 4.95) was prepared by dissolving 2.4 grams of coffee powder (Nescafé Classic, São Paulo, Brazil) in 200 mL of heated distilled water. After 10 minutes, the solution was filtered through filter paper. The solution was replaced daily at a consistent time to ensure uniform exposure.
Statistical Analysis
Data were analyzed using the R software, with a significance level set at 5%. Initially, descriptive and exploratory analyses were performed on all data. Previous analyses indicated that the data did not meet the assumptions for analysis of variance (ANOVA). Thus, the L* and b* coordinates, as well as the roughness data, were evaluated using generalized linear mixed models for repeated measures. Generalized linear models were employed to evaluate ΔEab and ΔE00, incorporating the group effect into the model. The a* coordinate and SGU scores were analyzed using non-parametric tests, including the Kruskal–Wallis test and Dunn’s test for comparisons between resin composites, and the paired Wilcoxon test for comparisons between time points.
Results
Color Analysis
The L* and b* results are detailed in Table 2. All resin composites exhibited a significant reduction in L* values following immersion in coffee (p < 0.0001). At the final measurement, Beautifil Bulk Restorative displayed a significantly lower L* values compared to both Beautifil II and Tetric N-Ceram Bulk Fill materials (p < 0.05). Additionally, there was a significant increase in b* values for all resin composites after coffee immersion (p < 0.0001). At the initial measurement, Beautifil II resin had a significantly higher b* values than Beautifil Bulk Restorative and Tetric N-Ceram Bulk Fill (p < 0.05). At the final time point, Beautifil II and Tetric N-Ceram showed significantly higher b* values compared to Tetric N-Ceram Bulk Fill (p < 0.05).
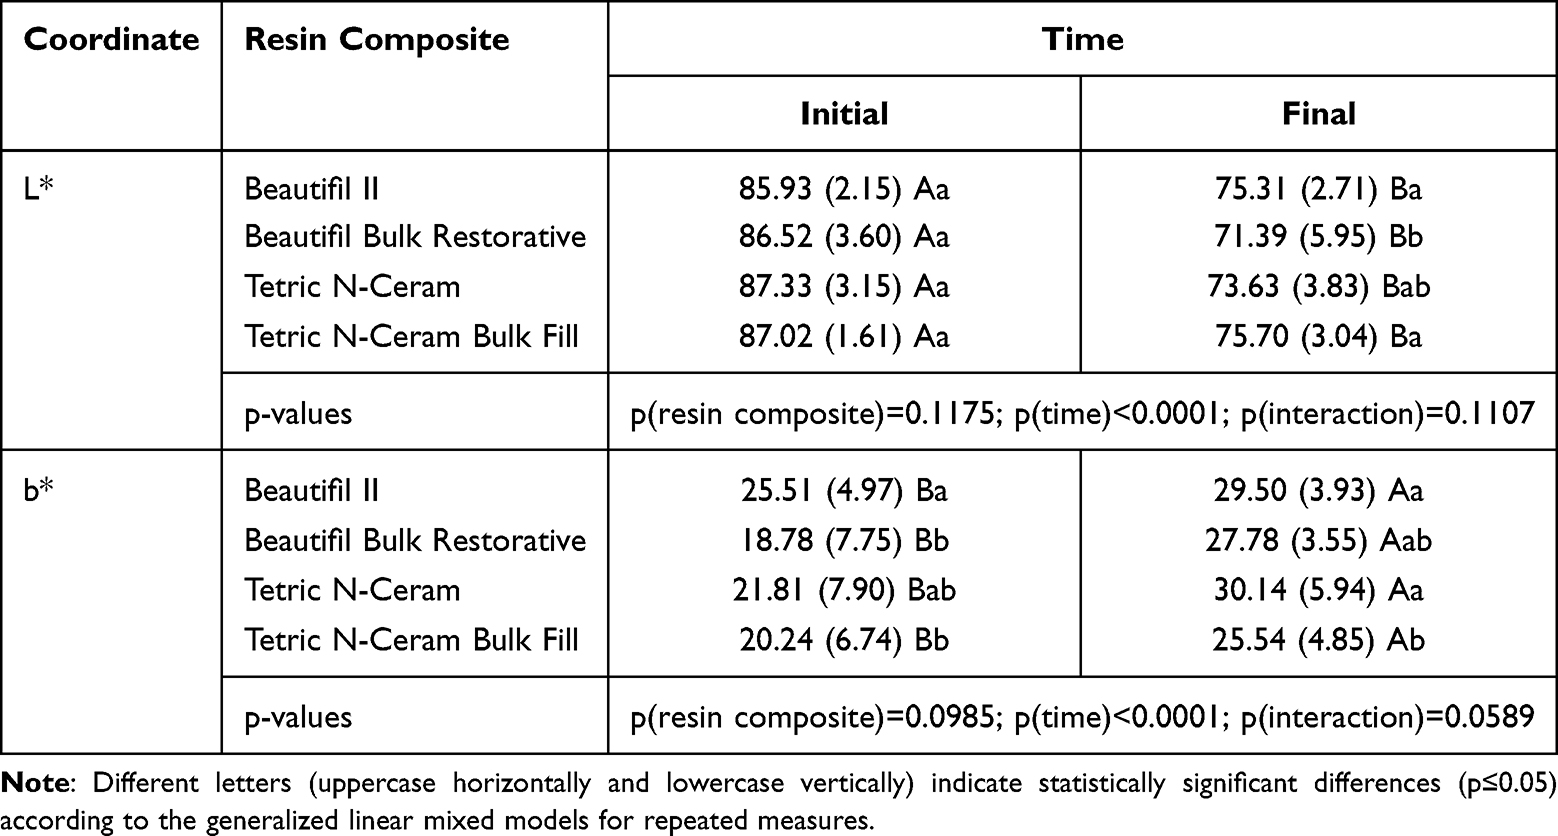 |
Table 2 Mean (Standard Deviation) of L* and b* Coordinates as a Function of Resin Composite and Time |
The a* coordinate values and Vita scale color scores (SGU, shade guide unit) are presented in Table 3. Significant increases were observed for the a* values and SGU results for all materials following immersion in coffee (p = 0.0022). However, no significant differences were found among the resin composites for these variables (p > 0.05).
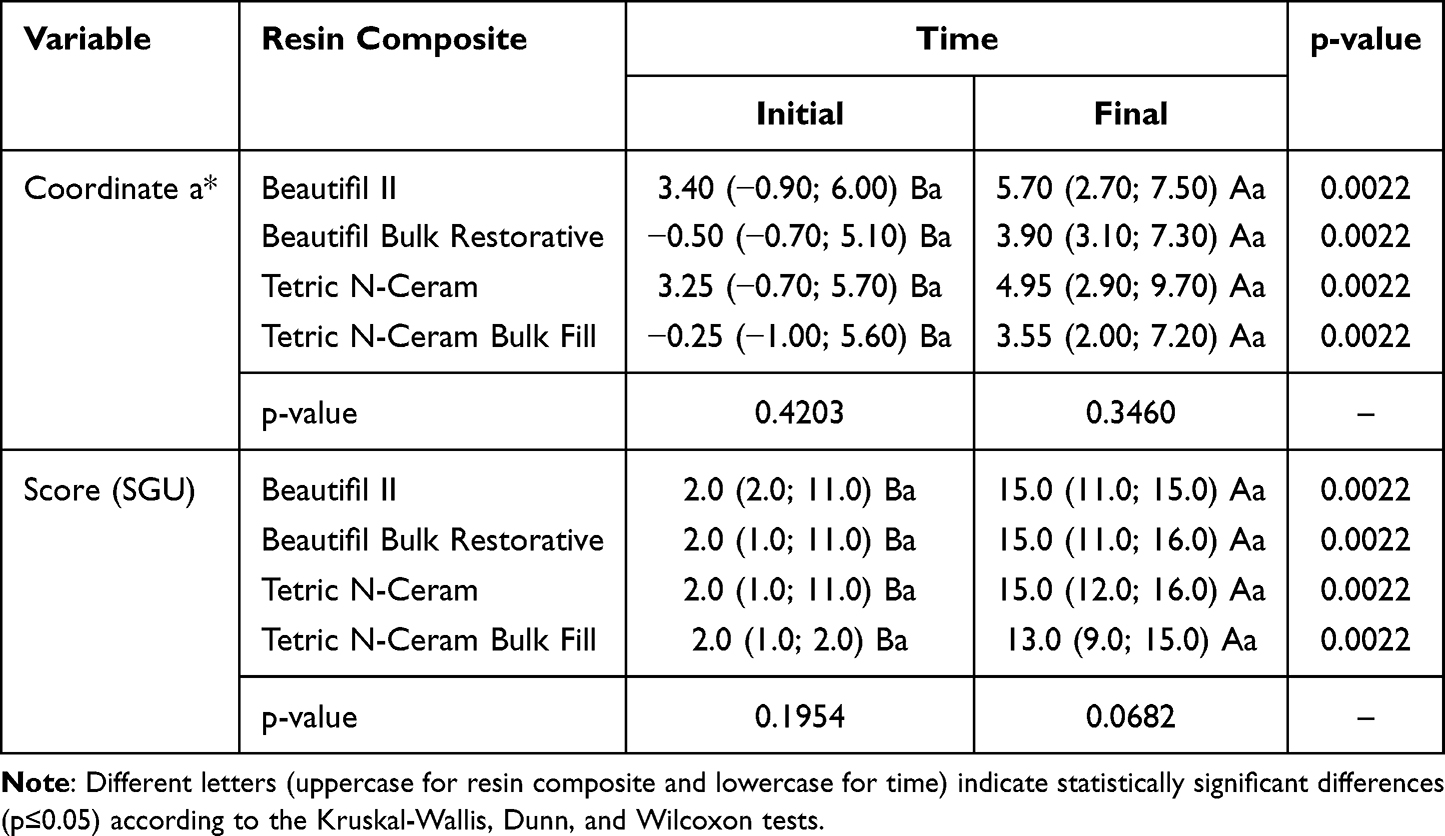 |
Table 3 Median (Minimum and Maximum Value) of the a* Coordinate and Vita Scale Score (SGU), as a Function of Resin Composite and Time |
Figure 1 presents a significant difference in color variation among the resin composites as measured by ΔEab (p = 0.0219). The ΔEab values were higher for Beautifil Bulk Restorative and Tetric N-Ceram compared to Beautifil II (p < 0.05). For ΔE00, Beautifil Bulk Restorative exhibited significantly higher values than Beautifil II (p = 0.0315).
 |
Figure 1 Box plot of the ΔEab values as a function of the resin composite. Different letters denote statistically significant differences (p ≤ 0.05) according to the generalized linear models. |
Surface Roughness Analysis
The Ra results are presented in Table 4. Tetric N-Ceram Bulk Fill resin composite exhibited a significant increase in roughness following immersion in coffee (p < 0.05). Initially, Tetric N-Ceram Bulk Fill had lower roughness compared to Beautifil II and Beautifil Bulk Restorative (p = 0.0321). At the final measurement, Tetric N-Ceram demonstrated lower roughness compared to the other resin composites (p = 0.0321). Considering the main effect, S-PRG resin composites presented higher Ra values than conventional resin composites.
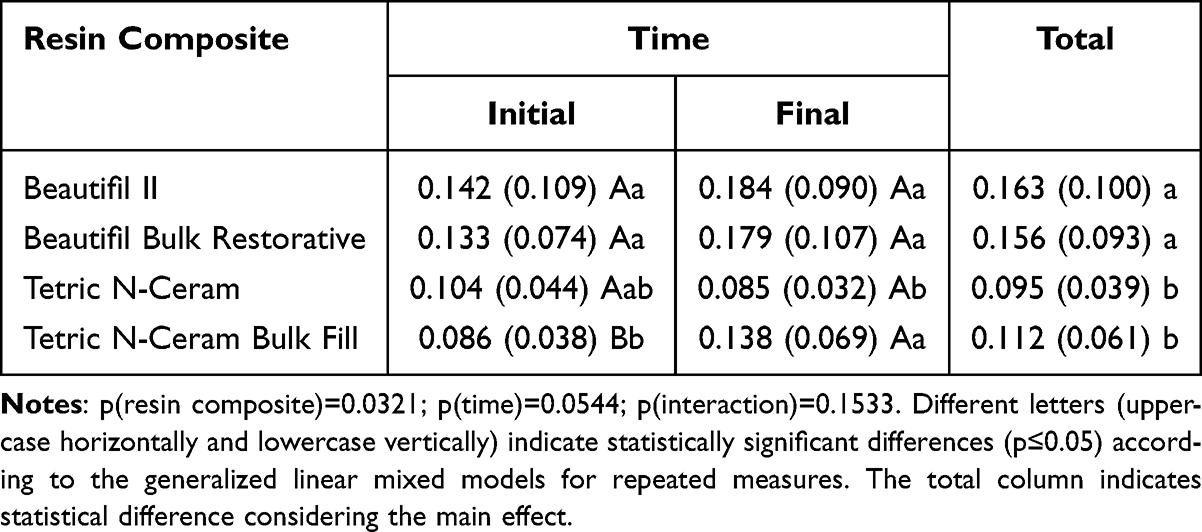 |
Table 4 Mean (Standard Deviation) of Roughness (Ra, µm) as a Function of Resin Composite and Time |
Discussion
Resin composites are widely recognized among direct restorative materials for their favorable aesthetic and functional properties,1,31 which contribute to their reliable clinical performance.7 Recent advancements have incorporated bioactive fillers into these materials to enhance their protective properties against carious lesions, improve mechanical strength, and maintain aesthetic appeal.23 Resin composites with S-PRG fillers represent a notable development in bioactive materials. The resin matrix of these materials is composed of fluoroaluminosilicate glass particles that react with polyacrylic acid,32 enabling the release of beneficial ions.23,33 Clinically, S-PRG resin composites demonstrated performance comparable to that of resin-modified glass ionomers.34 However, they tend to exhibit greater susceptibility to staining and increased surface roughness compared to conventional resin composites.34 In accordance with the present results, both null hypotheses were rejected, whereas differences were observed in the color properties and surface roughness of S-PRG resin composites, particularly in the bulk-fill version.
Although the color stability of conventional resin composites is well documented, studies on the pigmentation dynamics of resin composites with S-PRG fillers are limited. In the present study, no significant differences were observed in ΔE00 values between the conventional resin composite (Tetric N-Ceram) and the S-PRG-containing resin composite (Beautifil II) after coffee staining. Some studies35–37 have observed increased pigmentation in resin composites containing S-PRG fillers, with Pimentel et al37 (2023) specifically reporting greater color changes after acid exposure. However, the findings of this study are consistent with those of Tan et al15 (2015), who observed no significant differences in coffee staining between resin composites with S-PRG fillers and conventional composites. Therefore, it is possible that coffee, with a pH of 4.95, does not induce sufficient acid degradation or particle detachment to significantly affect color change in these materials.37 Thus, in the context of coffee-induced pigmentation, both conventional and S-PRG resin composites exhibited similar dynamics.
Regarding the color coordinates, all resin composites demonstrated a significant decrease in L* values after immersion in coffee, indicating a color alteration towards darker shades. Additionally, there was a notable increase in b* values, reflecting a change towards yellow, and an increase in a* values, indicating a change towards red. Coffee was chosen as the pigmenting agent due to its widespread consumption and well-documented staining potential.38,39 The staining effect of coffee is attributed to the polarity of its active compounds, which have an affinity for the polymeric network of resin composites.40 Furthermore, the sorption of coffee by resin composites may enhance the staining effect.36
For the ΔEab and ΔE00 values (Figures 1 and 2), all resin composites exceeded both the acceptable color change thresholds (ΔEab > 1.2, ΔE00 > 0.8) and the perceptible color change thresholds (ΔEab > 2.8, ΔE00 > 1.8) as suggested by Paravina et al (2015).41 Although both formulas are interchangeable and naturally correlated,42 the ΔE00 formula is more suitable for investigating differences that are perceptible to the human eye.27 In general, all resin composites experienced noticeable color changes after exposure to coffee. Nonetheless, no statistically significant differences were observed among the resin composites based on the Vita scale scores (SGU), which only indicated that all resin composites became darker after exposure to coffee. Although clinically accepted, SGU scores lack the specificity and accuracy needed in laboratory models. Therefore, a comprehensive analysis of all color variables is necessary. Corroboratingly, all resin composites exhibited a decrease in luminosity (L* values) and an increase in SGU scores, reflecting a color alteration towards darker shades. Notably, significant differences were observed between the Beautifil Bulk Restorative resin composite and its conventional counterpart (Beautifil II). The increased pigmentation observed in bulk-fill resin composites may be attributed to changes in monomer composition, increased translucency, and the incorporation of prepolymerized particles into the resin matrix.19,20
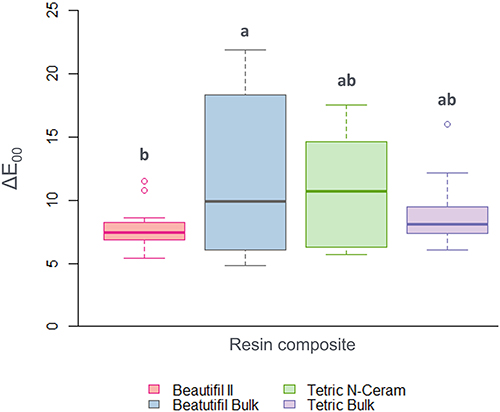 |
Figure 2 Box plot of the ΔE00 values as a function of the resin composite. Different letters denote statistically significant differences (p ≤ 0.05) according to the generalized linear models. |
Surface roughness is a critical clinical property that affects a material capacity to retain biofilm and pigments.43 Considering Table 4, resin composites containing S-PRG fillers exhibited higher roughness values compared to the conventional resin composites. As suggested by Kooi et al (2012)44 and Pimentel et al (2023),37 this difference may be attributed to the larger particle size in S-PRG materials (Table 1). Another possible explanation, as highlighted by Abdel-Karim et al (2014),25 is the particle content in S-PRG materials, which may have an inadequate bonding between the fillers and the resin matrix due to the resin’s property of releasing and recharging ions. Similarly, the higher roughness values observed in bulk-fill resin composites could be linked to monomeric changes.20 Considering the Ra values obtained, no group exceeded clinically relevant limits, such as the 0.2 μm for biofilm retention or the 0.3 μm for tongue perception.45,46
It is important to note that this study was conducted under conditions of intense pigment exposure, although the protocol used is a commonly used method.15 Future research should aim to address the limitations of the present study, including the absence of polishing procedures, the exploration of the effects of different pigmenting agents or staining protocols, and the use of alternative methodologies that could provide a deeper understanding of pigmentation dynamics in resin composites containing S-PRG fillers.
Conclusion
Based on the characteristics of this in-vitro study, the following conclusions can be suggested:
- Resin composites with S-PRG fillers exhibit similar pigmentation dynamics to conventional resin composites when exposed to coffee.
- Among resin composites containing S-PRG fillers, the bulk-fill version is more susceptible to staining.
- Resin composites with S-PRG fillers demonstrate greater surface roughness compared to conventional resin composite.
Disclosure
The author reports no conflicts of interest with respect to the authorship and/or publication of this article.
References
1. Schricker SR. Composite resin polymerization and relevant parameters. In: Eliades T, Brantley W, editors. Orthodontic Applications of Biomaterials.
2. Ferracane JL. Resin composite--state of the art. Dent Mater. 2011;27(1):29–38. doi:10.1016/j.dental.2010.10.020
3. Kaleem M, Satterthwaite JD, Watts DC. Effect of filler particle size and morphology on force/work parameters for stickiness of unset resin-composites. Dent Mater. 2009;25(12):1585–1592. doi:10.1016/j.dental.2009.08.002
4. Chesterman J, Jowett A, Gallacher A, Nixon P. Bulk-f ill resin-based composite restorative materials: a review. Br Dent J. 2017;222(5):337–344. doi:10.1038/sj.bdj.2017.214
5. Goncalves F, Kawano Y, Braga RR. Contraction stress related to composite inorganic content. Dent Mater. 2010;26(7):704–709. doi:10.1016/j.dental.2010.03.015
6. Karabela MM, Sideridou ID. Synthesis and study of properties of dental resin composites with different nanosilica particles size. Dent Mater. 2011;27(8):825–835. doi:10.1016/j.dental.2011.04.008
7. Opdam NJ, van de Sande FH, Bronkhorst E, et al. Longevity of posterior composite restorations: a systematic review and meta-analysis. J Dent Res. 2014;93(10):943–949. doi:10.1177/0022034514544217
8. Alzraikat H, Burrow MF, Maghaireh GA, Taha NA. Nanofilled resin composite properties and clinical performance: a review. Oper Dent. 2018;43(4):173–190. doi:10.2341/17-208-T
9. Veloso SRM, Lemos CAA, de Moraes SLD, Do Egito Vasconcelos BC, Pellizzer EP, de Melo Monteiro GQ. Clinical performance of bulk-fill and conventional resin composite restorations in posterior teeth: a systematic review and meta-analysis. Clin Oral Investig. 2019;23(1):221–233. doi:10.1007/s00784-018-2429-7
10. Lima VP, Machado JB, Zhang Y, Loomans BAC, Moraes RR. Laboratory methods to simulate the mechanical degradation of resin composite restorations. Dent Mater. 2022;38(1):214–229. doi:10.1016/j.dental.2021.12.006
11. Szczesio-Wlodarczyk A, Sokolowski J, Kleczewska J, Bociong K. Ageing of dental composites based on methacrylate resins-a critical review of the causes and method of assessment. Polymers (Basel). 2020;12(4):882. doi:10.3390/polym12040882
12. Choi MS, Lee YK, Lim BS, Rhee SH, Yang HC. Changes in surface characteristics of dental resin composites after polishing. J Mater Sci Mater Med. 2005;16(4):347–353. doi:10.1007/s10856-005-0634-9
13. Motevasselian F, Zibafar E, Yassini E, Mirzaei M, Pourmirhoseni N. Adherence of streptococcus mutans to microhybrid and nanohybrid resin composites and dental amalgam: an in vitro study. J Dent. 2017;14(6):337–343.
14. Dietschi D, Campanile G, Holz J, Meyer JM. Comparison of the color stability of ten new-generation composites: an in vitro study. Dent Mater. 1994;10(6):353–362. doi:10.1016/0109-5641(94)90059-0
15. Tan BL, Yap AU, Ma HN, Chew J, Tan WJ. Effect of beverages on color and translucency of new tooth-colored restoratives. Oper Dent. 2015;40(2):56–65. doi:10.2341/149027-L
16. Amaya-Pajares SP, Koi K, Watanabe H, da Costa JB, Ferracane JL. Development and maintenance of surface gloss of dental composites after polishing and brushing: review of the literature. J Esthet Restor Dent. 2022;34(1):15–41. doi:10.1111/jerd.12875
17. Van Ende A, De Munck J, Lise DP, Van Meerbeek B. Bulk-fill composites: a review of the current literature. J Adhes Dent. 2017;19(2):95–109. doi:10.3290/j.jad.a38141
18. Arbildo-Vega HI, Lapinska B, Panda S, Lamas-Lara C, Khan AS, Lukomska-Szymanska M. Clinical effectiveness of bulk-fill and conventional resin composite restorations: systematic review and meta-analysis. Polymers. 2020;12(8):1786. doi:10.3390/polym12081786
19. Theobaldo JD, Vieira-Junior WF, Cortellazzi KL, Marchi GM, Lima DA, Aguiar FH. Effects of cigarette smoke on color, roughness and gloss of high-viscosity bulk-fill resin composites. Am J Dent. 2020;33(2):83–88.
20. Derigi LP, Barros LS, Sugii MM, et al. Effect of commercial mouth rinses on physical properties of conventional and bulk-fill resin composites. Oper Dent. 2023;26:720–731.
21. Backes CN, França FMG, Turssi CP, Amaral FLBD, Basting RT. Color stability of a bulk-fill composite resin light-cured at different distances. Braz Oral Res. 2020;30:
22. Eltahlah D, Lynch CD, Chadwick BL, Blum IR, Wilson NHF. An update on the reasons for placement and replacement of direct restorations. J Dent. 2018;72:1–7. doi:10.1016/j.jdent.2018.03.001
23. Rusnac ME, Gasparik C, Irimie AI, Grecu AG, Mesaroş AŞ, Dudea D. Giomers in dentistry - at the boundary between dental composites and glass-ionomers. Med Pharm Rep. 2019;92(2):123–128. doi:10.15386/mpr-1169
24. Miyaji H, Mayumi K, Miyata S, et al. Comparative biological assessments of endodontic root canal sealer containing surface pre-reacted glass-ionomer (S-PRG) filler or silica filler. Dent Mater J. 2020;39(2):287–294. doi:10.4012/dmj.2019-029
25. Abdel-Karim UM, El-Ekary M, Etman WM. Three-yea r clinical evaluation of two nano-hybrid giomer restorative composites. Tanta Dent J. 2014;11(3):213–222. doi:10.1016/j.tdj.2014.10.004
26. Joiner A, Luo W. Tooth colour and whiteness: a review. J Dent. 2017;67S:S3–S10. doi:10.1016/j.jdent.2017.09.006
27. Pérez MM, Pecho OE, Ghinea R, Pulgar R, Della Bona A. Recent advances in color and whiteness evaluations in dentistry. Curr Dentistry. 2019;1(1):23–29. doi:10.2174/2542579X01666180719125137
28. Sharma G, Wu W, Dalal EN. The CIEDE2000 color-difference formula: implementation notes, supplementary test data, and mathematical observations. Color Res. Appl. 2005;30(1):21–30. doi:10.1002/col.20070
29. Guedes RA, Carlos NR, Turssi CP, et al. Hybrid light applied with 37% carbamide peroxide bleaching agent with or without titanium dioxide potentializes color change effectiveness. Photodiagnosis Photodyn Ther. 2023;44:103762. doi:10.1016/j.pdpdt.2023.103762
30. Polydorou O, Hellwig E, Hahn P. The efficacy of three different in-office bleaching systems and their effect on enamel microhardness. Oper Dent. 2008;33(5):579–586. doi:10.2341/07-148
31. Rajan G, Shouha P, Ellakwa A, Bhowmik K, Xi J, Prusty G. Evaluation of the physical properties of dental resin composites using optical fiber sensing technology. Dent Mater. 2016;32(9):1113–1123. doi:10.1016/j.dental.2016.06.015
32. Vijayan M, Rajendran R, Sreevatsan R. Comparative evaluation of microhardness between giomer, compomer, composite and resin-modified GIC. Int Dent J Stud Res. 2018;6(3):61–65.
33. Alsayed EZ, Hariri I, Sadr A, et al. Optical coherence tomography for evaluation of enamel and protective coatings. Dent Mater J. 2015;34(1):98–107. doi:10.4012/dmj.2014-215
34. Neto CCL, Das Neves AM, Arantes DC, et al. Evaluation of the clinical performance of GIOMERs and comparison with other conventional restorative materials in permanent teeth: a systematic review and meta-analysis. Evid Based Dent. 2022. doi:10.1038/s41432-022-0281-8
35. Costa MP, Jacomine JC, Mosquim V, et al. Analysis of color stability and degree of conversion of different types of resin composites. Braz Oral Res. 2024;38:e003. doi:10.1590/1807-3107bor-2024.vol38.0003
36. Gonulol N, Ozer S, Sen Tunc E. Water sorption, solubility, and color stability of giomer restoratives. J Esthet Restor Dent. 2015;27(5):300–306. doi:10.1111/jerd.12119
37. Pimentel ES, França FMG, Turssi CP, et al. Effects of in vitro erosion on surface texture, microhardness, and color stability of resin composite with S-PRG fillers. Clin Oral Invest. 2023;27(7):3545–3556. doi:10.1007/s00784-023-04968-6
38. Mundim FM, da FR GL, Pires-de-Souza F de CP. Effect of staining solutions and repolishing on color stability of direct composites. J Appl Oral Sci. 2010;18(3):249–254. doi:10.1590/S1678-77572010000300009
39. Domingos PAS, Garcia PPNS, Oliveira ALBM, Palma RGD. Composite resin color stability: influence of light sources and immersion media. J Appl Oral Sci. 2011;19(3):204–211. doi:10.1590/S1678-77572011000300005
40. Arruda BM, Bassi JC, Vitti RP, Scatolin RS. Color stability of bulk fill composite resins submitted to coffee staining. Braz Dent Sci. 2021;24(1).
41. Paravina RD, Ghinea R, Herrera LJ, et al. Color difference thresholds in dentistry. J Esthet Restor Dent. 2015;27(1):1–9. doi:10.1111/jerd.12149
42. Lee YK. Comparison of CIELAB DeltaE(*) and CIEDE2000 color-differences after polymerization and thermocycling of resin composites. Dent Mater. 2005;21(7):678–682. doi:10.1016/j.dental.2004.09.005
43. Cazzaniga G, Ottobelli M, Ionescu A, Garcia-Godoy F, Brambilla E. Surface properties of resin-based composite materials and biofilm formation: a review of the current literature. Am J Dent. 2015;28(6):311–320.
44. Kooi TJ, Tan QZ, Yap AU, et al. Effects of food-simulating liquids on surface properties of giomer restoratives. Oper Dent. 2012;37(6):665–671. doi:10.2341/11-419-L
45. Bollen CM, Lambrechts P, Quirynen M. Comparison of surface roughness of oral hard materials to the threshold surface roughness for bacterial plaque retention: a review of the literature. Dent Mater. 1997;13(4):258–269. doi:10.1016/s0109-5641(97)80038-3
46. Jung M, Sehr K, Klimek J. Surface texture of four nanofilled and one hybrid composite after finishing. Oper Dent. 2007;32(1):45–52. doi:10.2341/06-9
 © 2025 The Author(s). This work is published and licensed by Dove Medical Press Limited. The
full terms of this license are available at https://www.dovepress.com/terms
and incorporate the Creative Commons Attribution
- Non Commercial (unported, 3.0) License.
By accessing the work you hereby accept the Terms. Non-commercial uses of the work are permitted
without any further permission from Dove Medical Press Limited, provided the work is properly
attributed. For permission for commercial use of this work, please see paragraphs 4.2 and 5 of our Terms.
© 2025 The Author(s). This work is published and licensed by Dove Medical Press Limited. The
full terms of this license are available at https://www.dovepress.com/terms
and incorporate the Creative Commons Attribution
- Non Commercial (unported, 3.0) License.
By accessing the work you hereby accept the Terms. Non-commercial uses of the work are permitted
without any further permission from Dove Medical Press Limited, provided the work is properly
attributed. For permission for commercial use of this work, please see paragraphs 4.2 and 5 of our Terms.