")
Back to Journals » International Journal of Nanomedicine » Volume 9 » Issue 1
Support for the initial attachment, growth and differentiation of MG-63 cells: a comparison between nano-size hydroxyapatite and micro-size hydroxyapatite in composites
Authors Filová E, Suchý T, Sucharda Z, Šupová M, Žaloudková M, Balík K, Lisá V, Šlouf M, Bačáková L
Received 27 October 2013
Accepted for publication 10 January 2014
Published 6 August 2014 Volume 2014:9(1) Pages 3687—3706
DOI https://doi.org/10.2147/IJN.S56661
Checked for plagiarism Yes
Review by Single anonymous peer review
Peer reviewer comments 5
Elena Filová,1 Tomáš Suchý,2,3 Zbynek Sucharda,2 Monika Šupová,2 Margit Žaloudková,2 Karel Balík,2 Vera Lisá,1 Miroslav Šlouf,4 Lucie Bacáková1
1Department of Biomaterials and Tissue Engineering, Institute of Physiology, 2Department of Composite and Carbon Materials, Institute of Rock Structure and Mechanics, Academy of Sciences of the Czech Republic, 3Laboratory of Biomechanics, Department of Mechanics, Biomechanics and Mechatronics, Faculty of Mechanical Engineering, CTU in Prague, 4Department of Morphology and Rheology of Polymer Materials, Institute of Macromolecular Chemistry, Academy of Sciences of the Czech Republic, Prague, Czech Republic
Abstract: Hydroxyapatite (HA) is considered to be a bioactive material that favorably influences the adhesion, growth, and osteogenic differentiation of osteoblasts. To optimize the cell response on the hydroxyapatite composite, it is desirable to assess the optimum concentration and also the optimum particle size. The aim of our study was to prepare composite materials made of polydimethylsiloxane, polyamide, and nano-sized (N) or micro-sized (M) HA, with an HA content of 0%, 2%, 5%, 10%, 15%, 20%, 25% (v/v) (referred to as N0–N25 or M0–M25), and to evaluate them in vitro in cultures with human osteoblast-like MG-63 cells. For clinical applications, fast osseointegration of the implant into the bone is essential. We observed the greatest initial cell adhesion on composites M10 and N5. Nano-sized HA supported cell growth, especially during the first 3 days of culture. On composites with micro-size HA (2%–15%), MG-63 cells reached the highest densities on day 7. Samples M20 and M25, however, were toxic for MG-63 cells, although these composites supported the production of osteocalcin in these cells. On N2, a higher concentration of osteopontin was found in MG-63 cells. For biomedical applications, the concentration range of 5%–15% (v/v) nano-size or micro-size HA seems to be optimum.
Keywords: nanoparticles, hydroxyapatite, osteoblasts, composite materials
Introduction
Bone implants are usually manufactured from metals, ceramics or polymers. Composite materials can take advantage of the properties of all compounds that are used, and the content and the ratio of the components can be adjusted to mimic natural bone properties. Bone matrix contains both an organic component, consisting mainly of fibrous type I collagen and small amounts of proteoglycans and glycoproteins, and a mineral component, consisting of apatites.1 In bone, nano-sized mineral platelets of poorly crystalline, essentially carbonated hydroxyapatite (HA) particles are incorporated within the organic matrix;2 they are stiff and brittle. Collagen fibers are softer but tougher than the mineral; they are able to dissipate energy, provide bone tissue with elastic properties, and ameliorate the brittleness of HA and calcium phosphates. The arrangement of both organic and mineral components contributes to bone strength and resistance to fracture. The stiffness of bone is about 23 GPa along the bone lamellae and 16.5 GPa transversely to them.2
HA is a mineral from the family of apatites; their general formula is Me10(XO4)6(Y)2, where Me are bivalent cations; XO4, trivalent anions; and Y, monovalent anions.3,4 HA is the most stable calcium orthophosphate in the pH range of 4.2–12.4. Apatites present in the organism are often impure and nonstechiometric. The main impurity is CO32− (3–8 wt%), and the minor impurities are Na+, Mg2+, K+, HPO4−, Cl−, and F−, for example. With the exception of F−, they weaken the structure and make it more soluble.5 Moreover, they change the lattice parameters, crystal morphology, crystallinity, solubility, thermal stability, and bioactivity. The properties of HA particles (Ca10(PO4)6(OH)2) depend on the way in which they are prepared, the shape and size of the particles, and their roughness. Smaller, nano-sized particles are associated with a higher resorption rate than micro-sized particles.6 Biological HA extracted from the organism contain a series of discrete and alternating domains of variously charged (both in size and magnitude) surfaces, independently of topography, which indicate their potential to bind different matrix proteins. The shape of HA particles can affect the distribution of the charge on their surface.4 The degree of mineralization of human bone matrix varies between 0% and 43%, as bone is continuously resorbed and subsequently replaced by the new bone matrix, which is later mineralized.2 In bones, the thickness of the HA platelets ranges from 2 to 7 nm; the length, from 15 to 200 nm; and they are 10–80 nm in width;7 although particles of different shapes can also be found. It has been found that the predominant orientation of the c-axis of mineral crystals is oriented to the longitudinal axis of the osteons, and that the crystals closely follow the plane of the lamellae.
In composite materials, HA or tricalcium phosphate is combined with a variety of monomeric and polymeric materials such as silica,8 alginate,9 polycaprolactone,10 poly(lactic-co-glycolic acid),11 poly-L-lactide,12 polymethylmethacrylate,13 gelatin and silk fibroin,14 poly(1,8-octanediol-co-citrate),15 collagen, chitosan, or synthetic peptide with a β-sheet structure.16 This combination of polymers and ceramics in the form of composite materials can overcome the drawbacks due to their inappropriate mechanical properties for load-bearing applications. The desired mechanical properties can be obtained with composites consisting of a ceramic17 or polyamide reinforcement, with the possibility of selecting the volume ratio of the reinforcement to the matrix. Polydimethylsiloxane (PDMS) is a material that has been used for constructing a non-resorbable, long-lasting and stress-absorbent matrix for use in several biomedical applications (eg, intervertebral cages for spine treatment).18 Due to its biocompatibility, permeability to oxygen and carbon dioxide, and transparency for optical imaging, PDMS can be used as a culture substrate material for studies on the effects of topographic features on cell adhesion and morphology.19 Surface modifications20 or bulk modifications21 have been used to improve the properties of PDMS for biomedical applications.
In the present study, we prepared composite materials composed of polyamide fabric reinforcement, PDMS, and nano/micro-sized HA particles. In in-vitro experiments, we evaluated the adhesion, proliferation, and differentiation of human osteoblast-like MG-63 cells on these materials.
Materials and methods
Composite preparation
A composite material was prepared on the basis of polyamide balanced fabric reinforcement (Aramid HM 215 fibers, Hexcel, France) and PDMS matrix (M130, LZ Kolín, Czech Republic). The composite matrix was modified by HA particles (Berkeley Advanced Biomaterials Inc., San Leandro, CA, USA), with average particle size 100±50 nm and/or 100±50 μm (Figure 1). HA particles (Table 1) were inserted into the matrix before impregnation, in the amount of 0, 2, 5, 10, 15, 20, and 25 vol% (HA/matrix); the volume fraction of the fabric was kept at 55±7 vol%. The total volume fraction of HA in the composites was as follows: 0, 0.5, 2.2, 5.6, 8.4, 13.1, and 16.2 vol%. The sample nomenclature is listed in Table 1. A balance calculation of the volume and weight fractions of the components of the composite (ie, matrix, fibrous reinforcement, and HA) was carried out on the basis of weighing the components and the final composite samples, and on knowledge of the theoretical densities of the components (Table 2). The DI 18 Basic homogenizer (IKA-Werke GmbH, Staufen, Germany) and a kneading machine (HAAKE; Thermo Electron Corporation, Waltham, MA, USA) were used for this purpose. A weighed amount of additive was gradually inserted into a weighed amount of PDMS matrix, so that uniform dispersion of the additive filler in the matrix was achieved. The green composite was heated in a mold at a temperature of 135°C for 2 hours and then cured under pressure of 1.1 MPa at 225°C in an air atmosphere for 4.5 hours and finally cured without applying pressure at a temperature of 250°C for 4 hours.
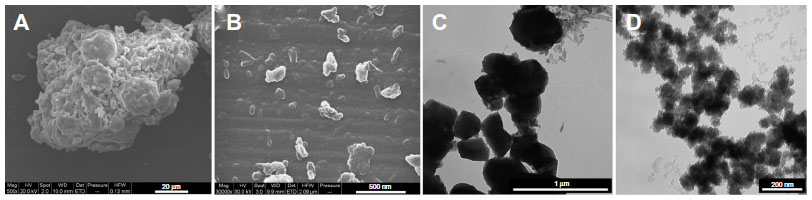 | Figure 1 Scanning electron microscopy (A and B) and transmission electron microscopy (C and D) micrographs of the HA particles. (A) Micro-HA (mag 500×, scale bar represents 20 μm). (B) Nano-HA (mag 30,000×, scale bar represents 500 nm). (C) Micro-HA (scale bar represents 1 μm). (D) Nano-HA (scale bar represents 200 nm). |
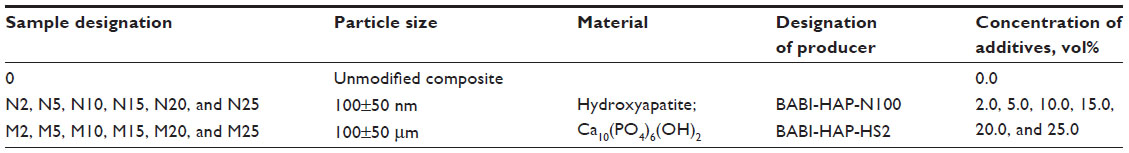 | Table 1 Nano- and microparticles used for composite matrix modifications, and their concentration in a composite matrix |
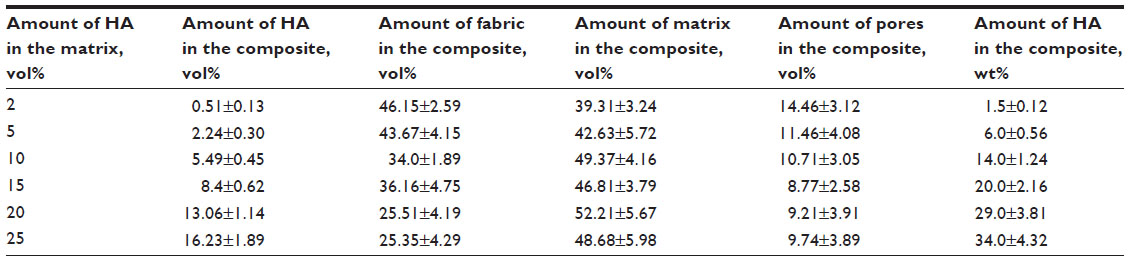 | Table 2 A balance calculation of particular composite components |
The homogeneity of the samples (ie, successful dispersion of additives in the matrix) was verified by image analysis of the polished sections, and results of investigations using scanning electron microscopy (SEM) and transmission electron microscopy (TEM) examinations have been published elsewhere.22 In brief, with composites with both types of HA particles, cracks appeared with volumes of 20 and 25 vol%. A greater number of cracks were observed on polished sections of composites with micro-HA particles added. It was shown that micro-HA particles form aggregates in the matrix of the composites (these findings were also illustrated by the decrease of bending strength). Nano-HA particles exhibited better dispersion, with less frequent formation of aggregates, and were in closer proximity to the fibers.
SEM and TEM
The morphology of the additives and their dispersion in the matrix were visualized by SEM and by TEM, followed by image analysis of the micrographs. Possible changes in the inner structure of the composites were verified by mechanical tests, as described elsewhere.22 The powder samples for SEM were suspended in ether and deposited on mica covered by a thin carbon film (prepared with the JEOL [Tokyo, Japan] JEE-4C vacuum evaporation device). The ether was left to evaporate at ambient temperature, and the samples were covered by a 4 nm thin Pt layer (prepared with vacuum sputter coaters: SCD 050; Balzers AG, Balzers, Liechtenstein). The dried specimens were observed in a Quanta 200 FEG SEM microscope (Fei Czech Republic s.r.o., Brno, Czech Republic) in low-vacuum mode, using a secondary electron detector accelerating voltage of 20 kV. Samples for TEM were cut from prepared bulk composites. Ultrathin sections for TEM study were prepared with an ultramicrotome (Ultracut UCT; Leica Microsystems, Wetzlar, Germany) under cryo-conditions (−90°C). The sections were observed in a TEM microscope (Tecnai G2 Spirit 120; FEI) using bright field imaging at 120 kV.
Energy dispersive spectrometry (EDS) analysis
An investigation of the effect of various volume fractions of micro/nano HA particles on the surface composition of the composites was carried out using the Quanta 450 scanning electron microscope (FEI) equipped with an Apollo XL Silicon Drift Detector 1 EA EDS extension (EDAX Inc., Mahwah, NJ, USA) at magnification 5,000× and accelerating voltage 20 kV. Prior to the EDS analyses, the samples were attached by carbon paste on an alumina stub and carbon-coated on a K550X (EMITech, Inc., Fall River, MA, USA) sputter coater in an argon atmosphere. The atomic fractions (at %) of chemical elements (namely C, O, Si, P, and Ca) were characterized in order to verify their surface incorporation. Ten 25 μm × 25 μm areas were analyzed at each HA volume fraction level.
Dissolution tests
The relationship between cell behavior and Ca2+ concentration was assessed by dissolution tests. For the dissolution test, calcium-free saline (CFS) at pH 7.3, containing sodium (85.5 mM/L), potassium (2.5 mM/L), magnesium (1 mM/L), and chloride (87 mM/L) was used. Tris(hydroxymethyl aminomethane) was used as a buffer to adjust the pH to 7.3. Under shaking, composite samples were immersed in 10 mL of CFS at 37°C for a period of 6 days. The calcium concentration of the solution was measured after 0, 24, 72, and 144 hours, using a calcium-selective electrode (20−20+, Elektrochemické detektory, s.r.o., Turnov, Czech Republic). The test was performed four times for all samples in order to verify any possible release of Ca2+.
Cell culture conditions, cell number, and doubling time
Samples 1 or 25 cm2 in size were sterilized in an autoclave, placed into 24-well cell culture dishes (TPP Techno Plastic Products AG, Trasadingen, Switzerland) and seeded with human osteoblast-like cells of the line MG-63 (European Collection of Cell Cultures, Salisbury, UK) in a density of 15,000 cells/well or 8,450 cell/cm2. The cells were cultured in Dulbecco-Modified Eagle Minimum Essential Medium (Sigma-Aldrich, St Louis, MO, USA, Cat No D5648) supplemented with 10% fetal bovine serum (SEBAK GmbH, Aidenbach, Germany) and gentamicin (40 μg/mL, LEK, Ljubljana, Slovenia). The cells were cultured for 1, 3, 6, or 7 days at 37°C in a humidified air atmosphere containing 5% CO2. Three samples were used for each experimental group and time interval.
For an evaluation of cell density, MG-63 cells were stained with the LIVE/DEAD® Viability/Cytotoxicity Kit (Invitrogen) and micrographs were taken under an epifluorescence microscope (Olympus IX51 DP70 digital camera; Olympus Corporation, Tokyo, Japan). The cell number and viability (ie, the percentage of living cells) were evaluated from 11–41 microscopic fields on days one, three, and seven. Cell densities per cm2 were used for constructing the growth curves and for calculating the cell population doubling time on the tested surfaces. The doubling time (DT) was calculated from 31–39 measurements on the basis of the equation,
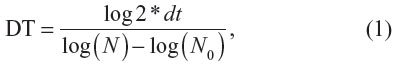
where dt = time of cultivation in hours, N = cell number after cultivation period dt, and N0 = cell number at the beginning of the interval.
Immunofluorescence staining of vinculin, talin, osteocalcin, and osteopontin
MG-63 cells were stained for focal adhesion proteins (vinculin and talin) and markers of osteogenic cell differentiation (osteocalcin and osteopontin). On day 3 after cell seeding (for talin, vinculin, and osteopontin) and on day 6 after cell seeding (for osteocalcin), the cells were fixed in 70% cold methanol (5 minutes, −20°C), washed twice in phosphate-buffered saline (PBS), pretreated with 1% albumin in PBS containing 0.1% Triton X-100 (30 minutes at room temperature), incubated in 1% Tween for 30 minutes, washed in PBS, and incubated with primary antibodies (ie, monoclonal anti-vinculin [clone hVIN-1; Sigma-Aldrich, Cat No V9131], monoclonal anti-talin [clone 8D4; Sigma-Aldrich, Cat No T3287, dilution 1:400], rabbit anti-osteocalcin [1–49, human, immunoglobulin G {IgG}, Peninsula Laboratories Inc., San Carlos, CA, USA, Cat No T-4743, dilution 1:200], polyclonal rabbit anti-human osteopontin [Cat No ALX-210-309, Alexis Biochemicals, Lörrach, Germany, dilution 1:200]). All antibodies were diluted in PBS and applied overnight at 4°C–8°C. After washing the samples three times in PBS containing 0.05% Tween, the following secondary antibodies were applied for 1 hour: Alexa Fluor®488-conjugated F(ab′)2 fragment of goat anti-mouse IgG (H + L), or Alexa Fluor®488-conjugated goat anti-rabbit IgG (H + L) (Molecular Probes, Carlsbad, CA, USA, Cat No A11017 or A11070, respectively, dilution 1:400). The cells were then washed three times in PBS and evaluated under an epifluorescence microscope (Olympus IX51, digital camera DP70; Olympus Corporation) and an AOBS (acousto-optical beam splitter) confocal laser scanning microscope based on a DM IRE2 inverted microscope (Leica Microsystems, Mannheim, Germany) and equipped with an argon laser (458 nm/5 mW, 476 nm/5 mW, 488 nm/20 mW, 514 nm/20 mW), and also green (543 nm/1.2 mW) and red (633 nm/10 mW), HC PL APO CS 20A (Leica Mircosystems) water immersion plan apochromat objective (working distance =250 mm, numerical aperture =0.7), zoom ×4. The images were taken every 3 μm on the z-axis. Due to autofluorescence of the composite, (Figure S1). the scans of the composite surface have been removed. The technique for scanning the samples does not allow all the volume of the cells to be depicted, and the images that were obtained were therefore not used for the quantitative analysis of the stained proteins.
Enzyme-linked immunosorbent assay (ELISA)
The concentration of vinculin, talin, osteocalcin, osteopontin, beta-actin (cytoskeletal protein), and intercellular adhesion molecule-1 (ICAM-1, an immunoglobulin adhesion molecule and a marker of cell immune activation) were measured in cell lysates (per mg of protein) after 3-day cultivation on composite materials. The cells were detached by trypsinization (trypsin-EDTA, Sigma-Aldrich, Cat No T4174; 5 minutes, 37°C), resuspended in PBS, centrifuged, resuspended in PBS (106 cells/mL), and kept in a freezer at −70°C overnight. The cell homogenates were then prepared by ultrasonication for 40 seconds using a sonicator (UP100H; Dr Hielscher GmBH, Stuttgart, Germany), and the total protein content was measured using a modified method by Lowry et al.23
Aliquots of the cell homogenates corresponding to 1–50 μg of protein in 50 μL of water were adsorbed on 96-well microtiter plates (MaxiSorp™, NUNC, Roskilde, Denmark) at 4°C overnight. After being washed twice with PBS (100 μL/well), the nonspecific binding sites were blocked by 0.02% gelatin in PBS (60 minutes, 100 μL/well). The primary monoclonal antibodies ie, monoclonal anti-beta-actin, clone AC-15, mouse ascites fluid (Sigma-Aldrich), Cat No A 5441, dilution 1:200, monoclonal anti-vinculin, mouse ascites fluid, clone hVIN-1 (Sigma-Aldrich), Cat No V 9131, dilution 1:400, monoclonal anti-talin, clone 8D4, mouse ascites fluid (Sigma-Aldrich), Cat No T 3287, dilution 1:200, rabbit anti-osteocalcin polyclonal antibody (CHEMICON International, Inc., Temecula, CA, USA), Cat No AB1857, dilution 1:200, or polyclonal antibody to osteopontin (Alexis Biochemicals), Cat No ALX-210-309-R100, dilution 1:200 and monoclonal mouse anti-human ICAM-1 (anti CD-54) antibody, clone MEM 111 (Cat No 11-228, dilution 1:200 [Exbio Praha a.s., Vestec, Czech Republic]) were diluted in PBS and applied for 60 minutes at room temperature (50 μL/well).
Goat anti-mouse F(ab′)2 IgG fragment and goat anti-rabbit IgG (Sigma-Aldrich; Cat No A3682 and A9169, dilution 1:1000 and 1:5000, respectively), were used as secondary antibodies (diluted in PBS, 50 μL/well, incubation 45 minutes). This step was followed by double washing in PBS with Triton X-100 (0.1%) and an ortho-phenylendiamine reaction (Sigma-Aldrich; concentration 2.76 mM) using 0.05% H2O2 in 0.1 M phosphate buffer (pH 6.0, dark place, 100 μL/well). The reaction was stopped after 10–30 minutes by 2M H2SO4 (50 μL/well) and the absorbance was measured at 492 nm by a VersaMax microplate reader (Molecular Devices LLC, Sunnyvale, CA, USA).
Statistical analyses
A statistical analysis of the chemical and structural analysis data was performed using statistical software (STATGRAPHICS Centurion XV; StatPoint Technologies, Inc., Warrenton, VA, USA). Normally distributed numerical data are expressed as mean ± standard deviation. For comparative purposes, the error bars represent confidence intervals. The normality of the data was checked by the Shapiro–Wilk test. Outliers were identified via the Grubbs and Dixon tests. For normally distributed data, the statistically significant differences were checked by parametric analysis of variance (F-test); a Fisher’s least significant difference post hoc test was employed after conforming the following assumptions: 1) the distribution for each of the samples was derived from the normal distribution, and 2) the variances of the population of the samples were equal to each other (assumption of homoscedasticity). Homoscedasticity was checked by the Levene and Bartlett tests. Statistical significance was accepted at P<0.05. The quantitative data for the in vitro tests was presented as averages ± standard error of the mean. The statistical significance of the differences was evaluated by one-way analysis of variance (Student–Newman–Keuls method or Dunn’s method), using SigmaStat software (Systat Software GmbH, Erkrath, Germany). P-values ≤0.05 were considered significant.
Results
EDS analysis
Figure 2 shows the results of an investigation of the dependence of the surface composition of the composites on various volume fractions of nano- and micro-HA. The compositions of the surfaces show differences in the atomic fractions of Ca and P when a different HA content is added. As expected, the mass percentage attributable to the elements Ca and P increased with the initial amount of HA in the matrix. This increasing tendency supports the suitable surface incorporation both of nano-HA and of micro-HA. The surfaces of composites with nano-HA had an average atomic Ca/P ratio of 1.6±0.2 (n=60). In the case of composites with micro-HA, an average ratio of 1.25±0.3 (n=60) was obtained. Stoichiometric HA has a theoretical Ca/P ratio of 1.67. In the cases of composites with 20–25 vol% of both micro- and nano-HA, relatively high variability in the atomic fraction data for Ca and P was obtained. This finding can indicate a non-homogeneous distribution of HA particles within the analyzed surfaces, especially in comparison with composites with a lower number of particles.
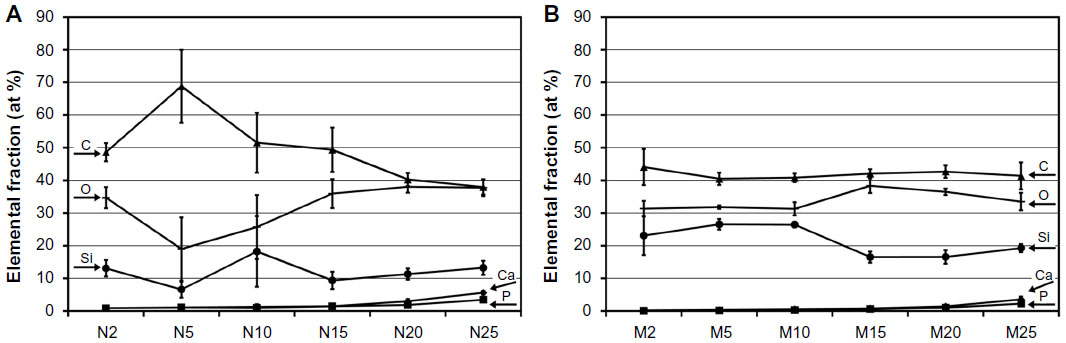 | Figure 2 Elemental composition of the surface of composites with nano-HA (A) and micro-HA (B). |
Dissolution tests
For the dissolution tests, parameters such as test duration and the ratio of composite sample dimensions/CFS volume were proposed according to the conditions of the in vitro tests. Figures 3–5 summarize the changes in Ca2+ release over time. The increasing trend in dissolution activity with increasing test duration is similar for all the composite samples. In general, a higher Ca2+ release was observed in the case of nano-HA composites, probably because they have a higher specific surface area than micro-HA composites. In addition, the composites with nano-HA, particularly those with lower concentrations, showed an earlier start of Ca2+ release (ie, they released higher concentrations of Ca2+ during the first 3 days than the corresponding micro-HA composites) (Figure 3). A statistical analysis was also performed in order to compare the various nano- and micro-HA contents within the same time period (Figures 4 and 5). The mean Ca2+ concentration values assessed within each time period of the dissolution test indicate no obvious trend (eg, an increasing tendency of Ca2+ concentration with an increasing amount of HA in the matrix). This trend was slightly apparent only on day 6 in composites with nano-HA. However, as mentioned above, a rather opposite trend was observed in these composites on days 1 and 3 of the analysis.
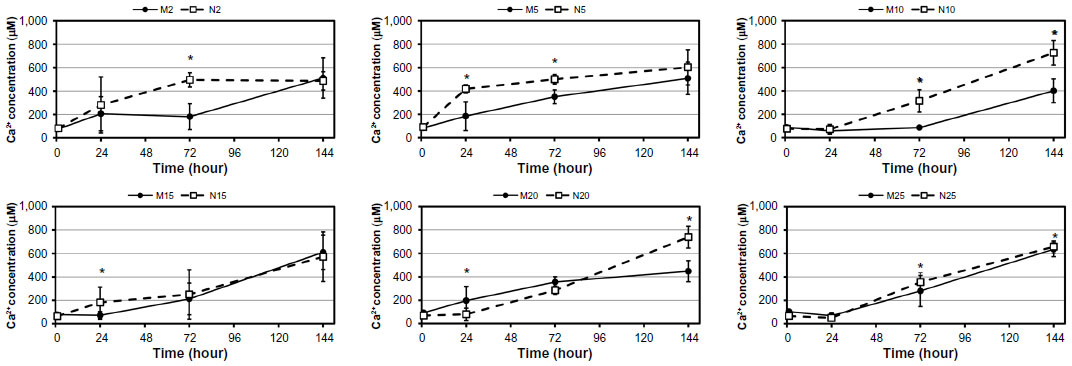 | Figure 3 Changes of Ca2+ release over time (1, 24, 72, and 144 hours) from composite samples with HA nanoparticles and microparticles. |
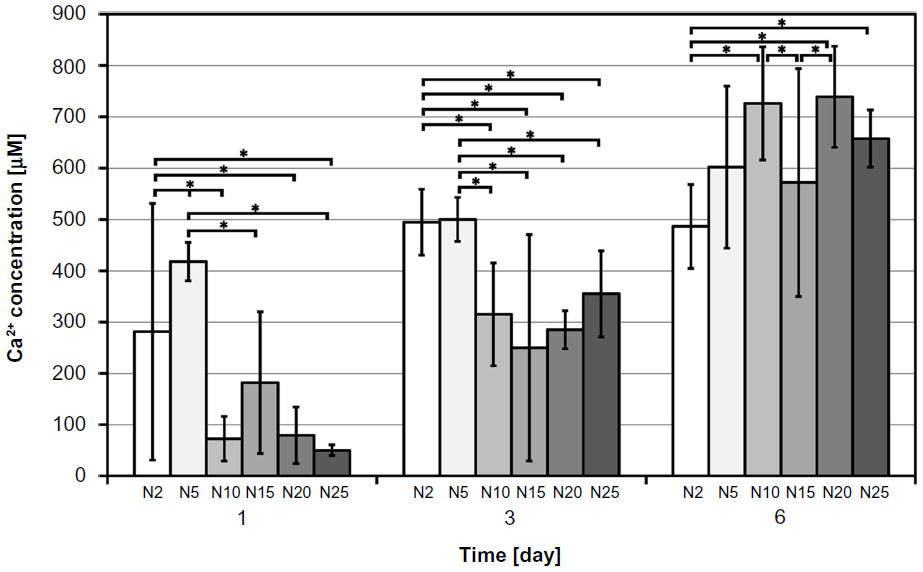 | Figure 4 Changes of Ca2+ release over time from composite samples with HA nanoparticles. |
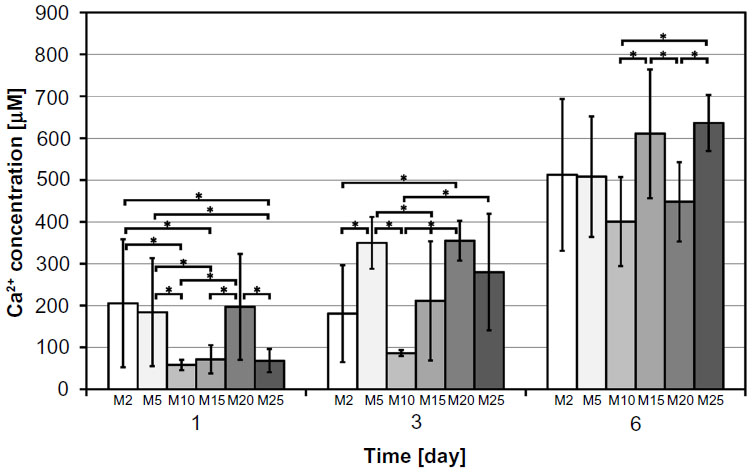 | Figure 5 Changes of Ca2+ release over time from composite samples with HA microparticles. |
Cell adhesion and proliferation
On day 1 after seeding, the number of initially attached MG-63 cells on composites with HA ranged from 5,940±367 to 9,762±500 cells/cm2, and was usually similar to the values on pure matrices without HA and on the control polystyrene dishes (Figure 6A). On average, the highest number of initially attached cells was observed on composite M10 (micro-sized, 10 vol%). A significantly lower number of adhered cells was found on composite M25, and this value was even lower than on the polymeric material with lower HA concentrations and polystyrene. From days 1 to 3, the longest cell doubling time was found on composite M20 (Figure 6B). On day 3, higher cell densities were obtained on composites containing nano-HA, particularly on samples N2–N15 (nano-sized, 2–15 vol%), than on samples containing micro-HA (Figure 6C). Moreover, the content of micro-sized HA higher than 20 vol% did not support cell proliferation between days 3 and 7. Within this time interval, the cells growing on M20 had a significantly longer doubling time than cells on all other samples (Figure 6D). MG-63 cells did not proliferate on M25, so the doubling time was not calculated on this sample. These results are in agreement with the extremely low cell densities found on M20 and M25 on day 7 (Figure 6E). Interestingly, the highest cell densities were found on M5–M15. These densities were significantly higher than those on all nano-sized HA samples. The dynamics of cell growth from days 1 to 7 after seeding on the tested materials is summarized in Figure 6F. It is evident that within the first 3 days after seeding, the cells grew more quickly and attained higher numbers on the composites with nano-HA. However, from days 3 to 7, the cells on composites with micro-HA (M5–M15) accelerated their growth and reached the highest final population densities.
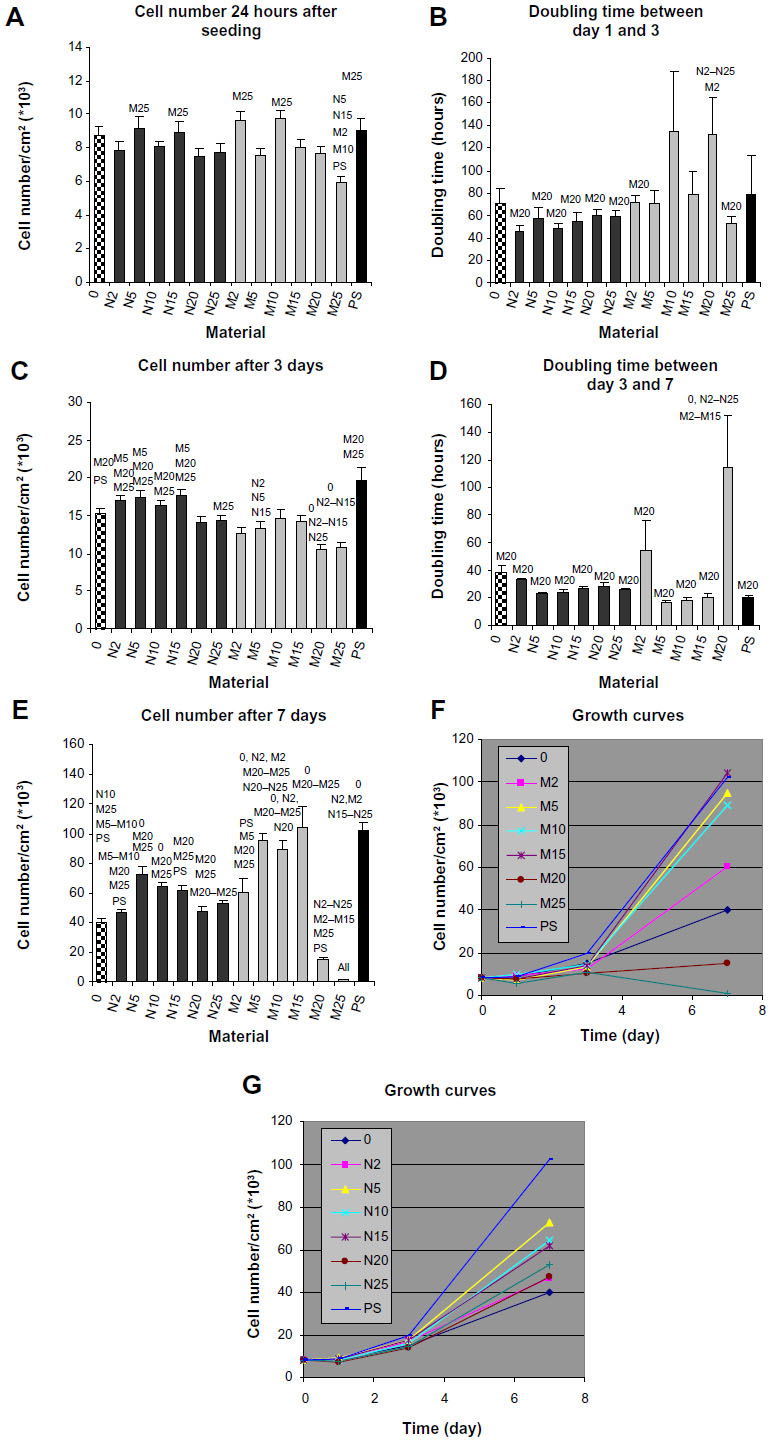 | Figure 6 Number of MG-63 cells 24 hours after seeding (A), on day 3 (C), and on day 7 (E) after seeding, doubling time between day 1 and day 3 (B) and between day 3 and day 7 (D), and growth curves (F, G) of MG-63 cells growing on composite materials with 0, 2, 5, 10, 15, 20, and 25 vol% of nano-sized (N2–N25) or micro-sized (M2–M25) hydroxyapatite. |
Immunofluorescence staining of cell adhesion and differentiation molecules
MG-63 cells growing on all samples were positively stained for vinculin (Figure 7) and talin (Figure 8). Immunofluorescence staining showed small dot-like focal adhesions containing talin, while the vinculin-containing focal adhesion plaques were more pronounced and localized, especially on the cell border. The staining of osteocalcin was more intense in the cytoplasm in MG-63 cells growing on nano-sized HA and was more apparent in the perinuclear region in cells on composites containing micro-sized HA (Figure 9). MG-63 cells were positively stained for osteopontin on all composites (Figure 10).
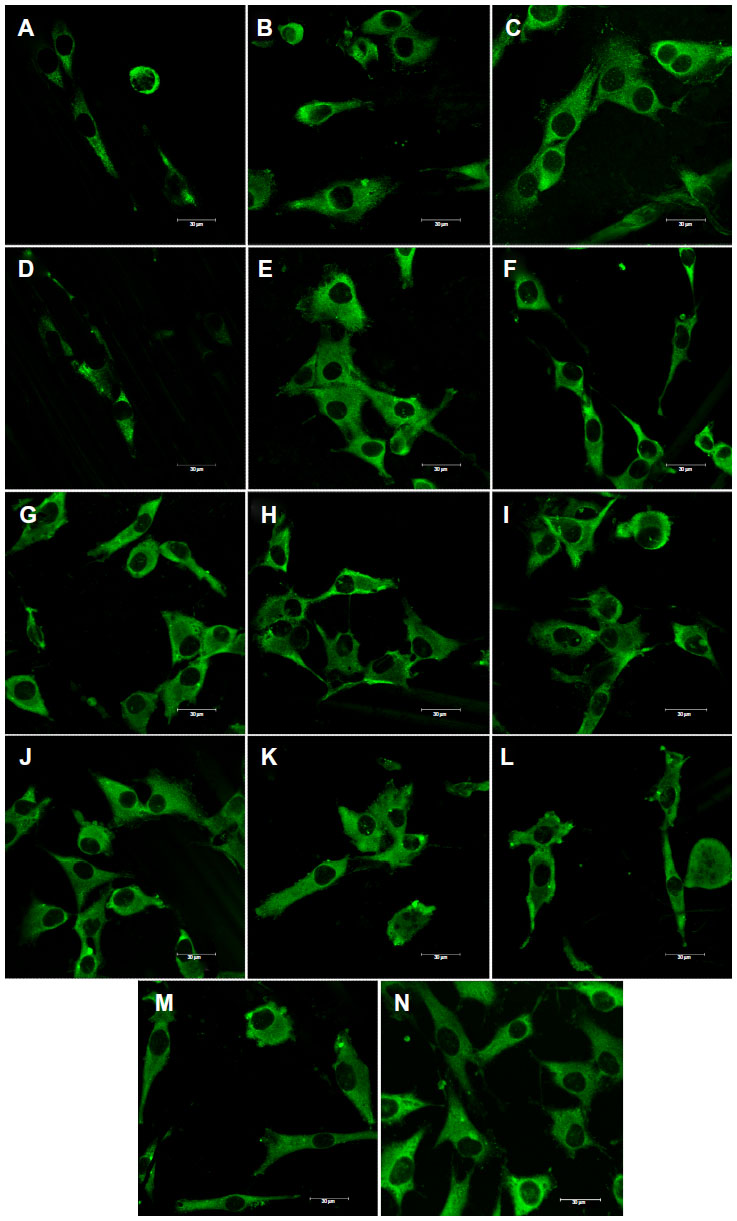 | Figure 7 Immunofluorescence staining of vinculin in MG-63 cells cultured on pure composite “0” (A), composites with 2–25 vol% nano-HA (ie, N2 [B], N5 [C], N10 [D], N15 [E], N20 [F], and N25 [G]), and composites with 2–25 vol% micro-HA (ie, M2 [H], M5 [I], M10 [J], M15 [K], M20 [L], and M25 [M]), and on polystyrene (N). |
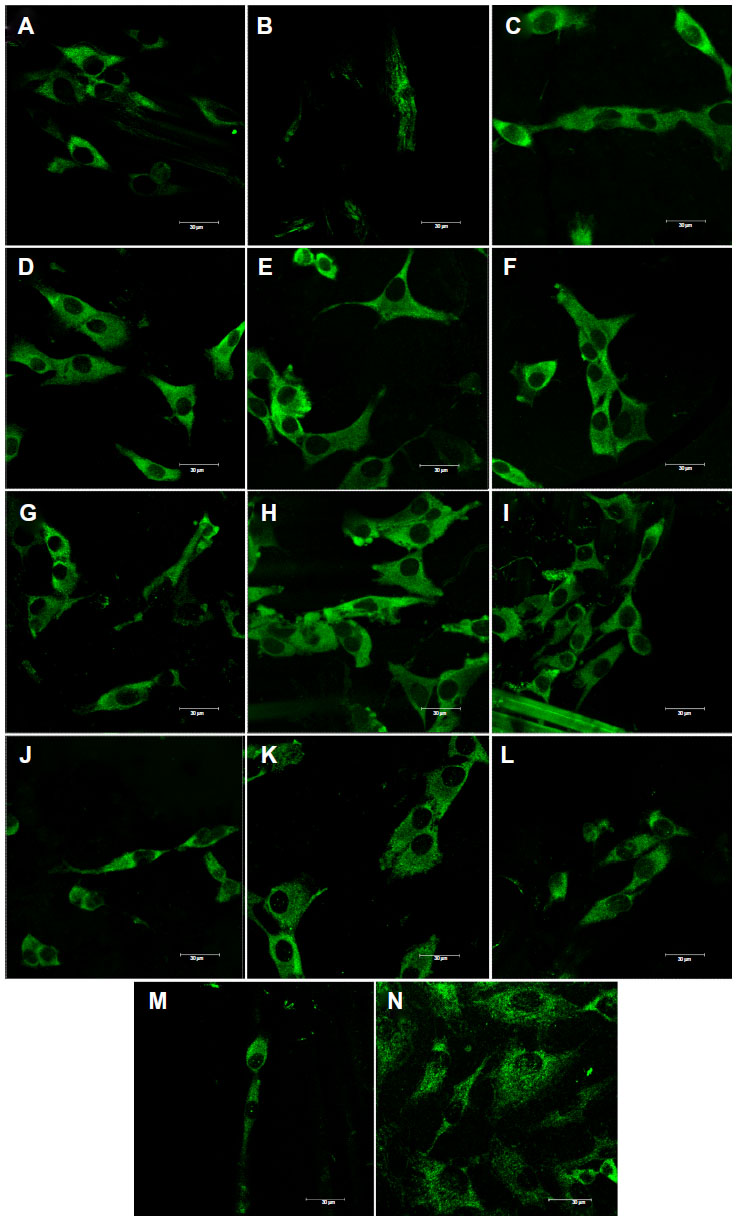 | Figure 8 Immunofluorescence staining of talin in MG-63 cells cultured on a pure composite “0” (A), composites with 2–25 vol% nano-HA (ie, N2 [B], N5 [C], N10 [D], N15 [E], N20 [F], and N25 [G]), and composites with 2–25 vol% micro-HA (ie, M2 [H], M5 [I], M10 [J], M15 [K], M20 [L], and M25 [M]), and on polystyrene (N). |
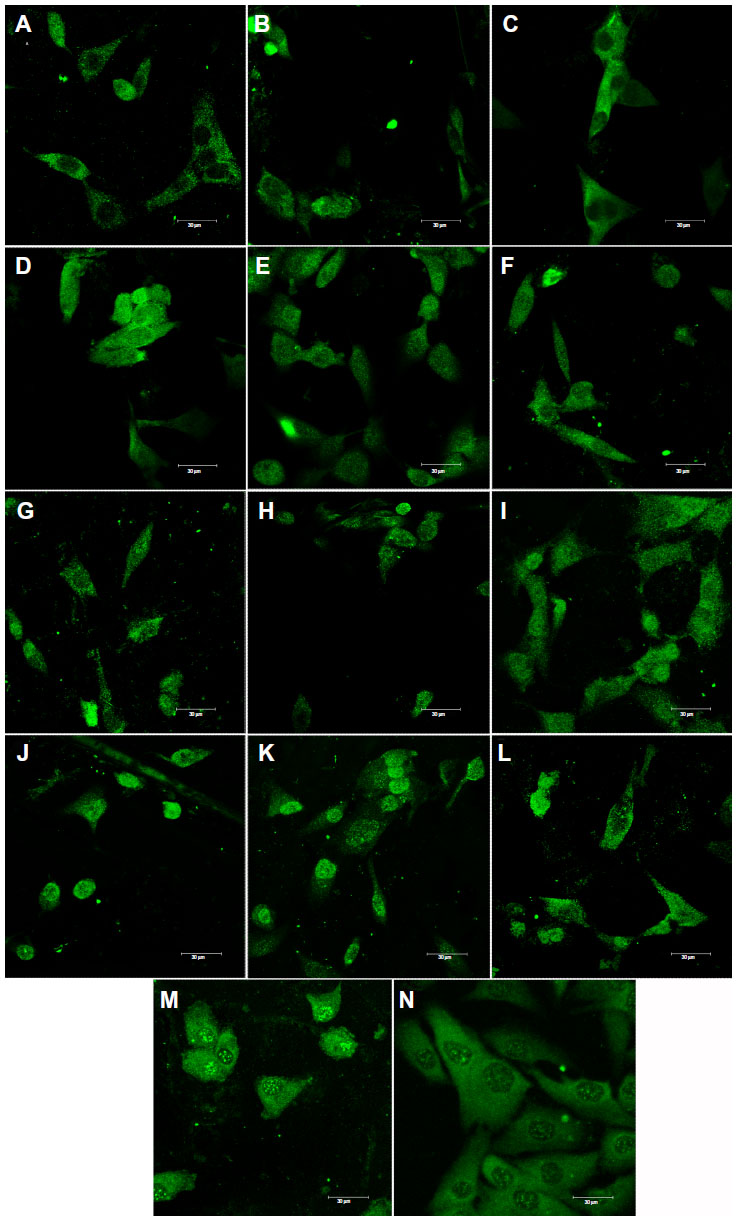 | Figure 9 Immunofluorescence staining of osteocalcin in MG-63 cells cultured on pure composite “0” (A), composites with 2%–25% nano-HA (ie, N2 [B], N5 [C], N10 [D], N15 [E], N20 [F], and N25 [G]), and composites with 2%–25% micro-HA (ie, M2 [H], M5 [I], M10 [J], M15 [K], M20 [L], and M25 [M]), and on polystyrene (N). |
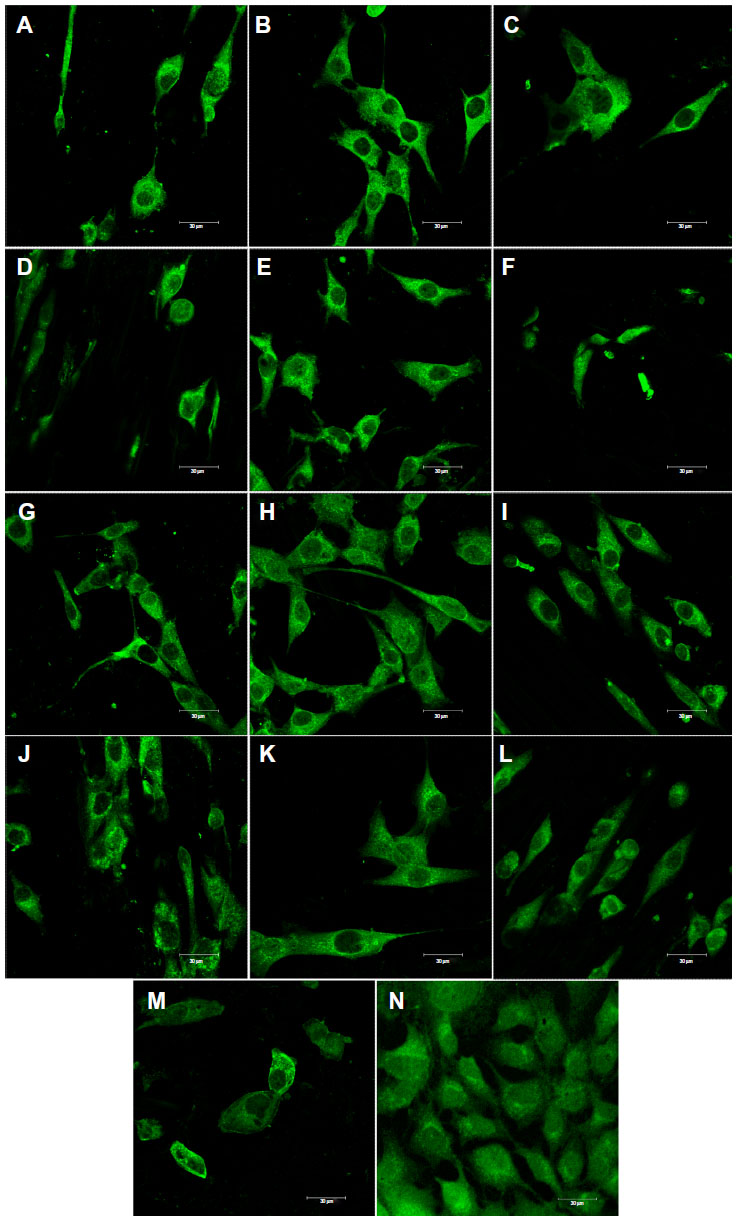 | Figure 10 Immunofluorescence staining of osteopontin in MG-63 cells cultured on pure composite “0” (A), composites with 2–25 vol% nano-HA (ie, N2 [B], N5 [C], N10 [D], N15 [E], N20 [F], and N25 [G]), and composites with 2%–25% micro-HA (ie, M2 [H], M5 [I], M10 [J], M15 [K], M20 [L], and M25 [M]), and on polystyrene (N). |
ELISA
ELISA experiments showed increased concentrations of beta-actin in MG-63 cells cultured on N15 and M25 in comparison with M5–M15 (Figure 11A). A similar trend was also apparent in concentrations of talin (ie, a focal adhesion protein associated with actin cytoskeleton), but these differences were not, in general, statistically significant. Only the concentration of talin in the cells on samples M2 and M5 was significantly lower than in the cells on polystyrene (Figure 11B). However, the concentration of vinculin, another focal adhesion protein, was similar in the cells on all samples regardless of the differences in HA concentrations (Figure 11C). The concentration of osteocalcin increased with increased content of micro-sized HA but was nearly the same on samples with nano-sized HA. At the same time, this concentration was on average higher in cells on composites with micro-sized HA than on samples with nano-sized HA. This difference is most apparent on composite M25, where the concentration of osteocalcin was significantly higher than on samples N2 and N5 (Figure 11D). The concentration of osteopontin showed an opposite trend, being highest in cells on samples with the lowest concentrations of nano-sized HA (samples 0 and N2; Figure 11E). The concentration of ICAM-1, a marker of cell immune activation, first showed an increasing tendency and reached the maximum values in cells cultured on samples N20, M10, and M15, and then decreased (Figure 11F).
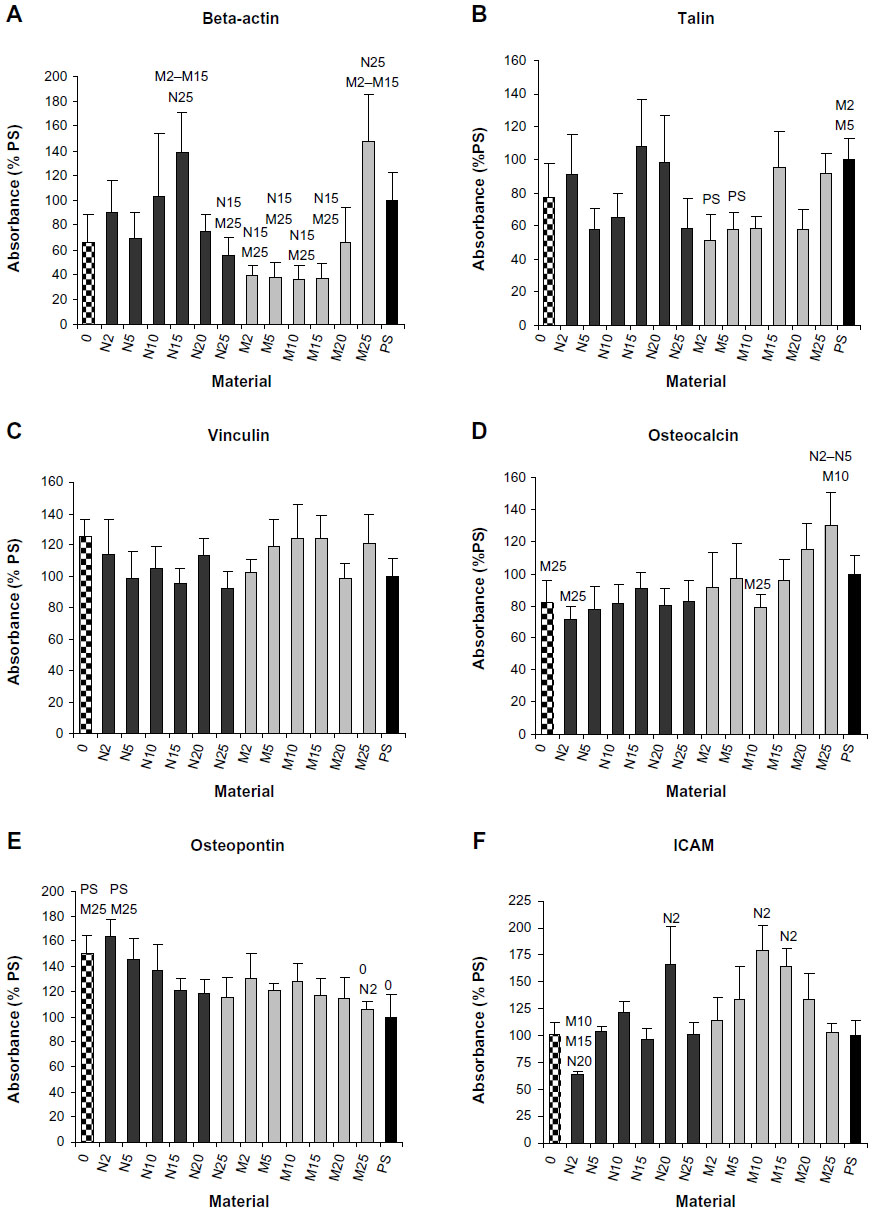 | Figure 11 Concentrations (percentage of PS) of beta-actin (A), vinculin (B), talin (C). osteocalcin (D), osteopontin (E), and ICAM (F) in MG-63 cells growing on composite material (0), composite materials with 2, 5,10, 15, and 25 vol% of nano-sized tricalcium phosphate (N2–N25) or of micro-sized tricalcium phosphate (M2–M25) or on control cell culture PS on day 3 after seeding. |
Discussion
We have prepared a composite material consisting of PDMS, polyamide fabric reinforcement, and nano- or micro-sized HA particles. PDMS is completely biocompatible and nontoxic, flexible, gas permeable, low cost, and it allows the fabrication of specific structures.24 Although the polyamide fabric was used predominantly to reinforce the composite, polyamide (aramid) fibers have been observed to provide suitable support for the growth of MG-63 cells.25 In agreement with these findings, our composite “0” (ie, polyamide-reinforced PDMS matrix without HA) supported initial adhesion of MG-63 cells and their proliferation after 3 days of culture; this was accompanied by high cell viability.
The effect of synthetic HA on cell behavior is ambiguous, as HA has been reported to be both biocompatible and cytotoxic. Similarly, the behavior of our newly constructed composites was also controversial, as some composites supported cell colonization and some composites inhibited it. Nevertheless, most of our composites (ie, all composites with nano-HA and composites with micro-HA up to 15 vol%) provided good support for cell growth. This is in accordance with a wide range of studies reporting unchanged or even increased biocompatibility of various materials after addition of HA. This phenomenon can be explained by the fact that HA is usually homogeneously dispersed in the bulk material in composites. Therefore, a substantial part of the HA is not in direct contact with the cells, and acts only after dissolving in a cell culture medium or in blood.
On our composites, the number and the growth dynamics of MG-63 cells were mostly similar to the values on the pure material without HA (Figure 2). Similar results were obtained on carbonated HA/poly-(L-lactic acid) (PLLA) nanocomposite microspheres, where the growth activity of Saos-2 cells was similar as on pure PLLA.26 In addition, the modification of siloxane/P(LLA-co-propargyl carbonate) (azidosilane) composites with HA-gelatin did not influence the attachment and growth of MC3T3-E1 preosteoblasts.27
In many other studies, the addition of HA to various materials has improved the growth of bone cells. For example, admixing HA nanoparticles into the poly-(vinyl alcohol) (PVA) hydrogel increases the adhesion and proliferation of human SV40 osteoblasts compared with the pure hydrogel, and this effect is further enhanced by combining HA with Fe2O3.28 Similarly, in a composite material made of poly(ε-caprolactone) (PCL) matrix containing 10, 20, or 30 wt% of iron-doped HA, nanoparticles support the viability and growth of human mesenchymal stem cells (MSCs). These composites also improve the cell spreading and the development of the actin cytoskeleton.29 Similarly in our study, the cells on composites with nano-HA (particularly N15) showed relatively high concentrations of beta-actin, and also talin, which is a focal adhesion protein associated with the actin cytoskeleton. The beneficial effects of HA particles on the cell adhesion and growth were explained by the increased wettability of the composite material, changes in the material surface topography, improved adsorption of cell adhesion-mediating proteins to the material surface, and also the osteoinductive effect of HA.28,29
In our study, on day 7 after seeding, the composites with 5–15 vol% of HA (HA/matrix) (ie, 2.2–8.4 vol% (HA/composite), similarly significantly increased the number of cells in comparison with the pure material without HA (Figure 2E). This effect was more pronounced on composites with micro-HA than with nano-HA. Similarly, a study performed on nanofibrous HA/PLLA scaffolds showed that micro-sized HA particles support proliferation and viability of rat osteosarcoma (ROS 17/2.8) cells better than nano-sized particles.30 This finding was explained by a larger surface area of HA microparticles exposed to cells, and thus the cells have more direct contact with the microparticles. Also, the osteogenic cell differentiation, measured by the activity of alkaline phosphatase, is higher on scaffolds with HA microparticles.30 In accordance with this, the concentration of osteocalcin, another marker of osteogenic cell differentiation used in our study, reached higher values on average in cells on the composites with micro-HA, particularly on M25 (Figure 7D).
However, most studies have reported a better adhesion and growth of cells on composites with nano-sized HA particles. On composites made of PCL and nano- or micro-sized HA particles, the attachment and proliferation of MG-63 cells and MSCs are better on composites with HA nanoparticles than on the material with HA microparticles. Under in vivo conditions, the ingrowth of newly formed bone tissue is also higher in the scaffolds with nanosized HA particles.31,32 In accordance with this, on day 3 after seeding, the numbers of MG-63 cells in our study were higher on composites with nano-HA than on composites with micro-HA, although they were mostly similar to the value obtained on the pure material without HA (Figure 2C).
The improved growth of cells on nanostructured surfaces has been attributed to an appropriate surface topography, mimicking the architecture of the natural extracellular matrix, a relatively large specific surface area, and increased hydrophilicity and surface energy. All these factors contribute to the increased adsorption of cell adhesion-mediating extracellular matrix molecules, such as vitronectin, fibronectin, and type I collagen, in an advantageous geometrical conformation promoting the accessibility of specific sites in these molecules by the cell adhesion receptors.31–34 The increased adsorption of vitronectin, fibronectin, and type I collagen, along with the decreased adsorption of albumin on nano-rough alumina, titanium, and HA33 results in preferential osteoblast adhesion compared with fibroblasts and endothelial cells. HA has strong binding affinity to other serum proteins osteopontin and osteocalcin. Osteopontin contains Arg-Gly-Asp oligopeptide, a cell-binding site for cell integrin receptors.35 This might favorably affect the attachment of MG-63 cells onto the composite with HA. Osteocalcin plays an important role in mineralization, and its concentration in blood serum reflects the rate of bone formation. The serum-containing culture medium used in our experiments mimicked the situation during graft implantation into an organism, when the blood serum proteins adsorb competitively on the graft surface.
Composites with nano-sized HA have also been reported to improve osteogenic cell differentiation more than composites with HA microparticles. For example, the transcriptional expression of early osteoblast-related genes in rat bone marrow-derived MSCs, such as ALP, COLIA1, and cbfa1, was enhanced more in the presence of nano-size HA particles than in the presence of micro-size HA particles.36 Both 2 wt% nano-size HA and 2 wt% nano-size tricalcium phosphate embedded in PCL nanofibers increase the activity of ALP, and mRNA expression levels of Runx-2 and bone sialoprotein in human MSCs cultured in a basal medium.37 Similarly, we observed the highest concentration of osteopontin, another marker of osteogenic cell differentiation, in cells on our composites with 2 vol% of nano-HA (N2). In cells on composites with 5 vol% of HA (N5), the concentration of osteopontin was also relatively high (Figure 11E). In the study, only the intracellular portions of osteocalcin and osteopontin have been quantified by ELISA, although these proteins are also excreted by cells into the medium. Interestingly, both N2 and N5 composites showed an early onset of Ca release (Figures 3 and 4). The release of Ca2+ ions from HA38 and other Ca-containing materials, such as beta-tricalcium phosphate38,39 or akermanite,39,40 has been shown to increase osteogenic cell differentiation, including the expression and synthesis of osteopontin. The addition of Ca2+ ions directly to the culture media also stimulated the production of osteopontin.41
On composites with micro-sized HA in concentrations of 20–25 vol% (HA/matrix) on day 7, which is equal to ~29–34 wt% HA (HA/composite) or 13.1–16.2 vol% (HA/composite), the cell number was significantly decreased. This reduction started already on day 1 on the M25 composites, continued on day 3 on the M20 and M25 composites, and was clearly apparent on day 7, when not only the cell number but also the cell viability was very low. This phenomenon can be explained by cytotoxic effects of HA. The potential toxicity or biocompatibility of HA particles depends on their concentration. In a study by Qing et al,42 it was found that concentrations of HA nanoparticles ranging from 100 to 500 μg/mL reduce the growth and the viability of MG-63 cells. At a concentration of 100 μg/mL, HA nanoparticles are found in cell lysosomes, and concentrations greater than 250 μg/mL causes apoptotic changes in the nuclei of MG-63 cells. On PVA-HA composites, the adhesion and growth of human SV40 osteoblasts is enhanced up to HA concentration of 50 wt%, and then decreases.28 HA-titanium composites with 5 and 10 wt% of Ti give more support than pure HA to the viability and growth of Saos-2 cells.43
One can expect that the cytotoxicity of HA at higher concentrations is mediated by a relatively high release of Ca2+ ions, which are known to have a negative effect on osteoblastic cells in vitro.44 The EDS analysis performed in our study demonstrated an increasing tendency of the atomic fractions of both Ca and P in the composites, which indicates increasing surface incorporation of both nano- and micro-HA with increasing HA concentration. The results of dissolution tests then showed an increasing trend of Ca2+ ion concentration with the duration of the test for all composite samples (ie, an increase in Ca2+ concentration from day 1 to day 7). However, the concentration of Ca2+ ions did not show the expected tendency toward an increasing Ca2+ concentration as the amount of HA in the matrix increased. This non-homogeneous nature of HA dissolution can be explained by non-homogeneous HA distribution and incorporation in the structure of the composite, variable porosity, and therefore a variable surface area in contact with CFS. Nevertheless, the concentrations (approximately hundreds of μM; Figures 3–5) of Ca2+ ions released from the composites with the highest volume fraction of micro-HA (20–25 vol%) were far below the cytotoxic concentrations (>10 mM) reported by Maeno et al.45 The standard Dulbecco’s Modified Eagle’s medium, also used in our study, contains 1.8 mM Ca2+ ions.41 Concentrations of Ca2+ ions ranging from 1.8 to 16.2 mM in the culture medium were found to have no significant effect on cell proliferation but stimulated osteogenic differentiation of human dental pulp cells, manifested by a higher expression of osteopontin and osteocalcin.41 In accordance with these findings, the cells on our composites with 25 vol% of Ca showed the highest concentrations of osteocalcin on day 3 after seeding (Figure 11D). However, the concentrations measured in our study reflect the average concentration in the solution volume, and the highest levels of HA volume fractions can lead to the presence of surface non-homogeneity and consequently to local cytotoxic oversaturation of Ca2+ ions.
Other factors that influence the cytotoxicity/biocompatibility of HA particles are their size and shape, the physicochemical properties of the particle surface, and also the type of cell exposed to HA. The growth inhibition and apoptotic changes in MG-63 cells cultured in a medium supplemented with sphere-like HA nanoparticles 20 or 80 nm in diameter are more pronounced in the presence of the larger nanoparticles.46 Similarly, we observed a significantly lower number and viability of cells cultured for 7 days on composites with 20 or 25 vol% of HA microparticles than on corresponding samples with HA nanoparticles (Figure 2E). The effect of nanoparticle shape was evaluated in a study by Xu et al.47 In the presence of needle-shaped particles in the cell culture medium, the cell population density on day 4 after seeding was reduced more than in the presence of spherical HA particles. These differences were explained by a different dissolution rate of HA in the two types of nanoparticles.47 The shape of the particles also significantly changed the expression of proteins. Human osteoblasts of the line hFOB 1.19 exposed to spherical particles of HA upregulated vimentin, actin, tubulin, ezrin, myosin, and transgelin, while filamin-A, filamin-B, and talin are downregulated.47 A study performed in human osteoblast-like Saos-2 cells, cultured on a titanium-niobium alloy coated with HA nanoparticles, revealed that the physical and chemical properties of the material surface also significantly influence the cell growth. The cell proliferation is stimulated mainly by increased surface wettability and energy, while the crystallinity and the surface roughness are less important.48 On HA-titanium composites, the surface roughness was inversely correlated with the proliferation activity of human SV40 osteoblasts.43 Also in our study, the growth of MG-63 cells was delayed on composites with HA microparticles, which generated higher surface roughness than HA nanoparticles (Figure 6C and E). The effects of HA on cell behavior also depend on the cell type. HA nanoparticles suspended in a cell culture medium slightly support the proliferation of primary human osteoblasts but inhibit the growth of MG-63 cells and induce apoptosis in this cell type.42
Previously, composites 0, N2–N25, and M2–M5 were tested for mechanical properties,22 aimed at finding a suitable ratio of HA nano/microparticles to optimize the mechanical properties to be comparable with that of human cortical bone. The modulus of elasticity in bending of the composites is similar to that in cortical bone, which is 14–20 GPa.49 The modulus of elasticity is highest for 2 vol% nano- and micro-sized HA, and decreases with an increased content of HA. Similarly, in the study with PVA-HA composites, the compressive strength was shown to reach its maximum in the material with 10 wt% of HA, and then decrease with increasing concentration of HA.28 In addition, nano-sized HA powder was more evenly dispersed throughout our composite, which is advantageous for in vivo applications.22 In accordance with this, the compressive modulus of HA-PCL composites with HA nanoparticles was higher than the compressive modulus of HA-PCL composites with HA microparticles, because the nanoparticles were more uniformly dispersed within the material.31
Conclusion
We prepared a novel composite material based on PDMS, polyamide fabric, and 2–25 vol% (HA/matrix), 0.5–16.2 vol% (HA/composite), respectively, of nano-sized or micro-sized HA. We evaluated these materials in terms of their biocompatibility in vitro with MG-63 cells. The composites containing nano-sized HA supported initial attachment and proliferation of MG-63 cells on day 3. Micro-sized HA supported cell attachment and, up to a concentration of 15 vol%, significantly increased cell density on day 7. However, higher concentrations of micro-sized HA (ie, 20%–25% micro-sized HA) significantly reduced the growth and the viability of MG-63 cells, although they supported osteocalcin synthesis in these cells. A concentration range of 5–15 vol% (HA/matrix) of both nano-sized and micro-sized HA particles seems to be the optimum for colonizing the composite with osteoblasts. These composites can potentially be used in medical applications.
Acknowledgments
This study was supported by the Grant Agency of the Ministry of Health NT13297-4/2012, by the Grant agency of the Czech Republic, by project GACR 106/09/1000, and by the project “BIOCEV – Biotechnology and Biomedicine Centre of the Academy of Sciences and Charles University” (CZ.1.05/1.1.00/02.0109), financed by the European Regional Development Fund. We thank Mrs Ivana Zajanova (Institute of Physiology, Academy of Sciences, Prague, Czech Republic) for her help with immunofluorescence staining, and Mr Robin Healey (Czech Technical University, Prague, Czech Republic) for his language revision of the manuscript.
Disclosure
The authors report no conflicts of interest in this work.
References
Rey C, Miquel JL, Facchini L, Legrand AP, Glimcher MJ. Hydroxyl groups in bone minerals. Bone. 1995;16(5):583–586. | |
Fratzl P, Gupta HS, Paschalis EP, Roschger P. Structure and mechanical quality of the collagen-mineral nano-composite in bone. J Mater Chem. 2004;14:2115–2123. | |
Cazalbou S, Eichert D, Ranz X, et al. Ion exchanges in apatites for biomedical application. J Mater Sci Mater Med. 2005;16(5):405–409. | |
Uskoković V, Uskoković DP. Nanosized hydroxyapatite and other calcium phosphates: Chemistry of formation and application as drug and gene delivery agents. J Biomed Mater Res B Appl Biomater. 2011;96(1):152–191. | |
LeGeros RZ. Calcium phosphate-based osteoinductive materials. Chem Soc Rev. 2008;108(11):4742–4753. | |
Ignjatovic NL, Ajdukovic ZR, Savic VP, Uskokovic DP. Size effect of calcium phosphate coated with poly-DL-lactide-co-glycolide on healing processes in bone reconstruction. J Biomed Mater Res B Appl Biomater. 2010;94(1):108–117. | |
Rubin MA, Jasiuk I, Taylor J, Rubin J, Ganey T, Apkarian RP. TEM analysis of the nanostructure of normal and osteoporotic human trabecular bone. Bone. 2003;33(3):270–282. | |
Shi X, Wang Y, Ren L, Zhao N, Gong Y, Wang DA. Novel mesoporous silica-based antibiotic releasing scaffold for bone repair. Acta Biomater. 2009;5(5):1697–1707. | |
Suarez-Gonzales D, Barnhart K, Saito E, Vanderby R Jr, Hollister SJ, Murphy WL. Controlled nucleation of hydroxyapatite on alginate scaffolds for stem cell-based bone tissue engineering. J Biomed Mater Res A. 2010;95(1):222–234. | |
Roohani-Esfahani S, Nouri-Khorasani S, Lu Z, Appleyard R, Zreiqat H. The influence hydroxyapatite shape and size on biphasic calcium phosphate scaffolds coated with hydroxyapatite-PCL composites. Biomaterials. 2010;31(21):5498–5509. | |
Miao X, Tan DM, Li J, Xiao Y, Crawford R. Mechanical and biological properties of hydroxyapatite/tricalcium phosphate scaffolds coated with poly(lactic-co-glycolic acid) Acta Biomater. 2008;4(3):638–645. | |
Matsuo A, Chiba H, Takahashi H, Toyoda J, Abukawa H. Clinical application of a custom-made bioresorbable raw particulate hydroxyapatite-poly-L-lactide mesh tray for mandibular reconstruction. Odontology. 2010;98(1):85–88. | |
Itokawa H, Hiraide T, Moriya M, et al. A 12 month in vivo study on the response of bone to a hydroxyapatite-polymethylmethacrylate cranioplasty composite. Biomaterials. 2007;28(33):4922–4927. | |
Tungtasana H, Shuangshoti S, Shuangshoti S, et al. Tissue response and biodegradation of composite scaffolds prepared from Thai silk fibroin, gelatin and hydroxyapatite. J Mater Sci Mater Med. 2010;21(12):3151–3162. | |
Chung EJ, Qiu H, Kodali P, et al. Early tissue response to citric acid-based micro- and nanocomposite. J Biomed Mater Res. 2011;96(1):29–37. | |
Takeuchi A, Ohtsuki C, Kamitakahara M, Ogata S, Miyazaki T, Tanihara M. Biomimetic deposition of hydroxyapatite on synthetic polypeptide with β-sheet structure in a solution mimicking body fluid. J Mater Sci Mater Med. 2008;19(1):387–393. | |
Suchý T, Rýglová Š, Balík K, et al. Biological evaluation of polydimethylsiloxane modified by calcium phosphate nanoparticles for potential application in spine surgery. Sci Advan Mat. 2013;5(5):484–493. | |
Balik K, Suchy T, Sucharda Z, Ryglova Š, Denk F. Design for a filler of an intervertebral cage for spine treatment on the basis of fibers and particulate composites. Ceram Silik. 2009;53(4):310–314. | |
Jeon K, Oh HJ, Lima H, et al. Self-renewal of embryonic stem cells through culture on nanopattern polydimethylsiloxane substrate. Biomaterials. 2012;33:5206–5220. | |
Mussard W, Kebir N, Kriegel I, Esteve M, Semetey V. Facile and efficient control of bioadhesion on poly(dimethylsiloxane) by using a biomimetic approach. Angew Chem Int Ed Engl. 2011;50(46):10871–10874. | |
Abbasi F, Mirzadeh H, Karban A. Modification of polysiloxane polymers for biomedical applications: a review. Polym Int. 2001;50(12):1279–1287. | |
Balik K, Suchy T, Sucharda Z, et al. Effect of nano/micro particles of calcium phosphates on the mechanical properties of composites based on polysiloxane matrix reinforced by polyamide. Ceram Silik. 2008;52(4):260–267. | |
Lowry OH, Rosebrough NJ, Farr AL, Randall RJ. Protein measurement with the Folin phenol reagent. J Biol Chem. 1951;193(1):265–275. | |
Rodriguez-Rodriguez R, Muñoz-Berbel X, Demming S, Büttgenbach S, Herrera MD, Llobera A. Cell-based microfluidic device for screening anti-proliferative activity of drugs in vascular smooth muscle cells. Biomed Microdevices. 2012;14(6):1129–1140. | |
Vagaská B, Bacáková L, Filová E, Balík K. Osteogenic cells on bio-inspired materials for bone tissue engineering. Physiol Res. 2010;59(3):309–322. | |
Duan B, Wang M, Zhou WY, Cheung WL, Li ZY, Lu WW. Three-dimensional nanocomposite scaffolds fabricated via selective laser sintering for bone tissue engineering. Acta Biomater. 2010;6(12):4495–4505. | |
Dyke JC, Knight KJ, Zhou H, Chiu CK, Ko CC, You W. An investigation of siloxane cross-linked hydroxyapatite-gelatin/copolymer composites for potential orthopedic applications. J Mater Chem. 2012;22(43):22888–22898. | |
Hou R, Zhang G, Du G, et al. Magnetic nanohydroxyapatite/PVA composite hydrogels for promoted osteoblast adhesion and proliferation. Colloids Surf B Biointerfaces. 2012;103C:318–325. | |
Gloria A, Russo T, D’Amora U, et al. Magnetic poly(ε-caprolactone)/iron-doped hydroxyapatite nanocomposite substrates for advanced bone tissue engineering. J R Soc Interface. 2013;10(80):20120833. | |
Peng F, Yu X, Wei M. In vitro cell performance on hydroxyapatite particles/poly(L-lactic acid) nanofibrous scaffolds with an excellent particle along nanofiber orientation. Acta Biomater. 2011;7(6):2585–2592. | |
Heo SJ, Kim SE, Wei J, et al. Fabrication and characterization of novel nano- and micro-HA/PCL composite scaffolds using a modified rapid prototyping process. J Biomed Mater Res A. 2009;89(1):108–116. | |
Heo SJ, Kim SE, Wei J, et al. In vitro and animal study of novel nano-hydroxyapatite/poly(epsilon-caprolactone) composite scaffolds fabricated by layer manufacturing process. Tissue Eng Part A. 2009;15(5):977–989. | |
Webster TJ, Ergun C, Doremus RH, Siegel RW, Bizios R. Specific proteins mediate enhanced osteoblast adhesion on nanophase ceramics. J Biomed Mater Res. 2000;51(3):475–483. | |
Bacáková L, Filová E, Parízek M, Ruml T, Švorcík V. Modulation of cell adhesion, proliferation and differentiation on materials designed for body implants. Biotechnol Adv. 2011;29(6):739–767. | |
Huang Y, Zhou G, Zheng L, Liu H, Niu X, Fan Y. Micro-/nano- sized hydroxyapatite directs differentiation of rat bone marrow derived mesenchymal stem cells towards an osteoblast lineage. Nanoscale. 2012;4(7):2484–2490. | |
Anselme K. Osteoblast adhesion on biomaterials. Biomaterials. 2000;21(7):667–681. | |
Polini A, Pisignano D, Parodi M, Quarto R, Scaglione S. Osteoinduction of human mesenchymal stem cells by bioactive composite scaffolds without supplemental osteogenic growth factors. PLoS One. 2011;6: e26211–e26222. | |
Barradas AM, Monticone V, Hulsman M, et al. Molecular mechanisms of biomaterial-driven osteogenic differentiation in human mesenchymal stromal cells. Integr Biol (Camb). 2013;5(7):920–931. | |
Xia L, Zhang Z, Chen L, et al. Proliferation and osteogenic differentiation of human periodontal ligament cells on akermanite and β-TCP bioceramics. Eur Cell Mater. 2011;22:68–82. | |
Gu H, Guo F, Zhou X, et al. The stimulation of osteogenic differentiation of human adipose-derived stem cells by ionic products from akermanite dissolution via activation of the ERK pathway. Biomaterials. 2011;32(29):7023–7033. | |
An S, Gao Y, Ling J, Wei X, Xiao Y. Calcium ions promote osteogenic differentiation and mineralization of human dental pulp cells: implications for pulp capping materials. J Mater Sci Mater Med. 2012;23(3):789–795. | |
Qing F, Wang Z, Hong Y, et al. Selective effects of hydroxyapatite nanoparticles on osteosarcoma cells and osteoblasts. J Mater Sci Mater Med. 2012;23(9):2245–2251. | |
Kumar A, Dhara S, Biswas K, Basu B. In vitro bioactivity and cytocompatibility properties of spark plasma sintered HA-Ti composites. J Biomed Mater Res B Appl Biomater. 2013;101(2):223–236. | |
Hoppe A, Güldal NS, Boccaccini AR. A review of the biological response to ionic dissolution products from bioactive glasses and glass-ceramics. Biomaterials. 2011;32(11):2757–2774. | |
Maeno S, Niki Y, Matsumoto H, et al. The effect of calcium ion concentration on osteoblast viability, proliferation and differentiation in monolayer and 3D culture. Biomaterials. 2005;26(23):4847–4855. | |
Shi Z, Huang X, Liu B, Tao H, Cai Y, Tang R. Biological response of osteosarcoma cells to size-controlled nanostructured hydroxyapatite. J Biomater Appl. 2010;25(1):19–37. | |
Xu JL, Khor KA, Sui JJ, Zhang JH, Chen WN. Protein expression profiles in osteoblasts in response to differentially shaped hydroxyapatite nanoparticles. Biomaterials. 2009;30(29):5385–5391. | |
Xiong J, Li Y, Hodgson PD, Wen C. In vitro osteoblast-like cell proliferation on nano-hydroxyapatite coatings with different morphologies on a titanium-niobium shape memory alloy. J Biomed Mater Res A. 2010;95(3):766–773. | |
Ramakrishna S, Mayer J, Wintermantel E, Leong KW. Biomedical applications of polymer-composite materials: a review. Comp Sci Tech. 2001;61(1):1189–1224. |
Supplementary materials
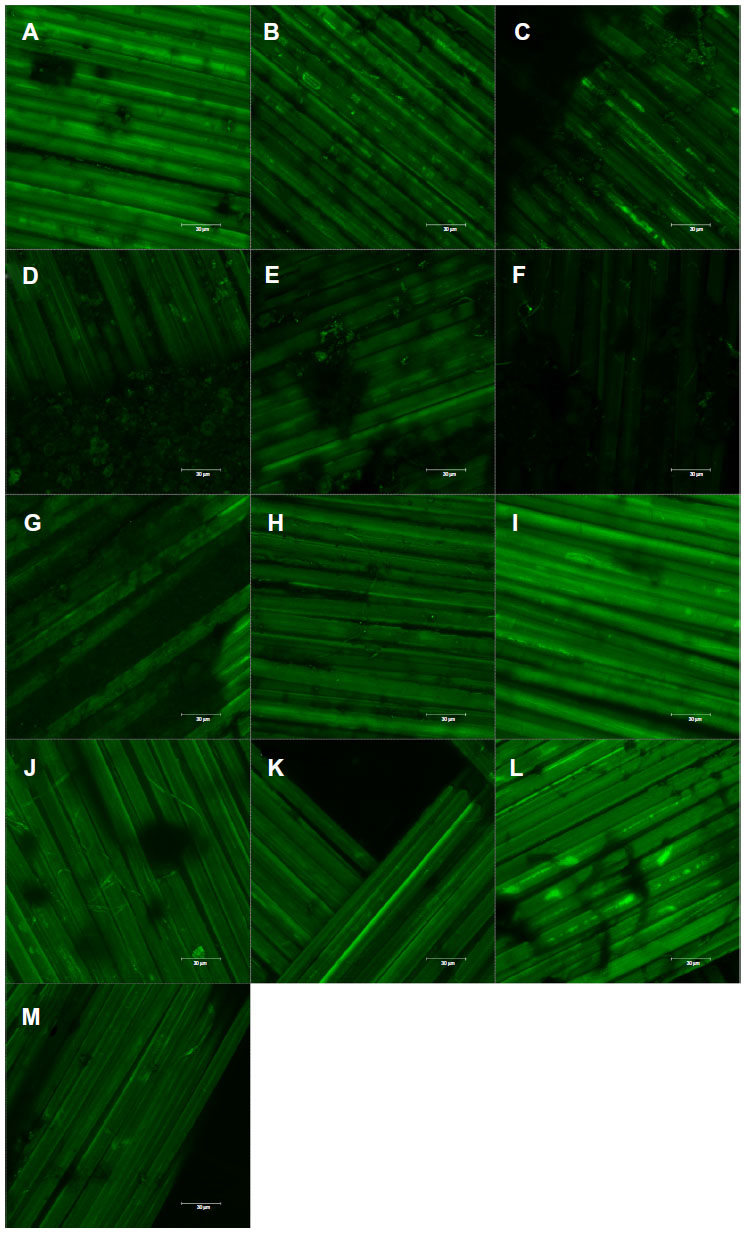 | Figure S1 Autofluorescence of pure composite “0” (A), composites with 2–25 vol% nano-HA (ie, N2 [B], N5 [C], N10 [D], N15 [E], N20 [F], and N25 [G]), and composites with 2%–25% micro-HA (ie, M2 [H], M5 [I], M10 [J], M15 [K], M20 [L], and M25 [M]).
|
 © 2014 The Author(s). This work is published and licensed by Dove Medical Press Limited. The full terms of this license are available at