Back to Journals » Nutrition and Dietary Supplements » Volume 11
Supplemental Nutrition Assistance Program (SNAP): does receiving assistance impact food choices?
Authors Sachdev PK, Babaei M ![]() , Freeland-Graves JH
, Freeland-Graves JH
Received 19 February 2019
Accepted for publication 26 June 2019
Published 9 August 2019 Volume 2019:11 Pages 19—35
DOI https://doi.org/10.2147/NDS.S177809
Checked for plagiarism Yes
Review by Single anonymous peer review
Peer reviewer comments 2
Editor who approved publication: Dr Chandrika Piyathilake
Prageet K Sachdev, Mahsa Babaei, Jeanne H Freeland-Graves
Department of Nutritional Sciences, College of Natural Sciences, The University of Texas at Austin, Austin, TX 78712, USA
Abstract: The Supplemental Nutrition Assistance Program (SNAP) is the largest federal program that provides assistance for the purchase of foods to low-income households in the United States. SNAP plays a valuable role in alleviating hunger and food insecurity in poor households; however, one consideration that remains relatively unexplored is the influence of this program on food choices. Food choices are guided by several factors in low-income individuals, including the cost of food, household size, nutrition knowledge, availability of fresh foods in the neighborhood, transportation, and cultural factors. Also, the complex relationship between SNAP participation and food choices is further confounded by the factors of demographics, food insecurity, poverty, and self-selection. There is a lack of quantitative investigations that directly evaluate food choices in SNAP recipients. As a result, this review will focus on summarizing finding from studies that assessed food purchasing patterns, diet quality, and weight gain in SNAP participants. These outcomes may serve as proxy measures to evaluate the food choices made by SNAP participants. In addition, this review discusses many behavioral economic strategies such as reducing the cost of healthy foods, providing monetary benefits for purchase of healthy foods, increasing the SNAP benefits, incentivizing small food retailers to offer more food choices in low-income neighborhoods, increasing grocery stores and supermarkets in poor neighborhood, and strengthening the SNAP-Ed program; some of which have been previously adopted to promote the selection of healthy foods in SNAP participants. SNAP has the potential to impact food choices in the society, as such longitudinal studies are needed to evaluate the effectiveness of any reforms in SNAP benefits or restrictions, which may seem logical but not impact food choices in reality.
Keywords: Supplemental Nutrition Assistance Program, food choices, grocery purchase, diet, diet quality, obesity
Introduction
The Supplemental Nutrition Assistance Program (SNAP) is the largest federal program that provides assistance for the purchase of foods to low-income households in the United States (U.S.).1 It provides food purchasing benefits to households with an annual income level of ≤130% of the Federal Poverty Level (FPL) and household assets of <$2000.2 The original name was the Food Stamps program which was established in 1964. The renaming occurred in 2008 in order to increase its focus to improve nutrition in beneficiaries.2 In the fiscal year 2018, SNAP benefits totaled $60.6 billion, which were provided to 40.3 million Americans. The average benefit per person per month was $125.63, with two-thirds of all SNAP participants being children, elderly or those with a disability; the majority live below the FPL.3 This program is based on United States Department of Agriculture’s (USDA) Thrifty Food Plan (TFP), a low-cost plan which suggests monthly food expenses derived from the consumer price index.4 The funds are distributed monthly on an electronic benefits transfer card, which can be used to purchase most foods and beverages, except dietary supplements, alcohol, tobacco, and ready to eat foods.5
The SNAP plays a major role in reducing hunger and food insecurity in low-income Americans.6 It is designed such that the maximum benefits (92%) are received by households with incomes at or below the poverty line, while 56% go to households at or below half of the poverty line (about $10,390 for a family of three in 2018).6 This program acts as a safety net for the elderly, those with disability, temporarily unemployed, and low-income wage workers.6 In addition, it provides adequate nutrition support to low-income groups by strengthening their power to purchase foods. Finally, SNAP nutrition education programs help to improve the food choices made by the recipients.6
However, food choices are guided by numerous factors in low-income individuals, including the cost of food,7 household size,8 nutrition knowledge,9 transportation,10, and cultural factors.11,12 A focus group study analyzed the food choices among food stamp participants.8 The conclusion was that the cost of the food was the major consideration in deciding which items were purchased. Family size was an additional influence, with those having larger families preferring inexpensive foods in bulk in order to satisfy the needs of everyone.8 Lack of nutrition knowledge, problems in understanding food labels and less support from the family for healthy recipes were few other barriers reported for eating healthy.8 Lack of personal transportation restricts grocery expenditures to the nearest convenience store.13 Yet, an analysis of the National Household Food Acquisition and Purchase Survey dataset study found that a constraint in transportation did not result in difference in types of stores, as compared to their non-participating counterparts.14 Culture is yet another significant factor in determining food choices. This is especially true in Hispanic and African-American households, as most preferred preparing traditional recipes.8 Very few individuals declared that their food choices were influenced by the media, nutrition knowledge, and/or physician advice.8
SNAP provides food assistance to the vulnerable and low-income populations. However, there is limited evidence from quantitative studies that directly assess the effect of participation in SNAP on food choices. Therefore, the goal of this review is to analyze the existing literature on outcomes of food expenditure patterns, diet quality, and obesity in SNAP participants, with the purpose of studying food choices from these proxy measures.
Potential impact of SNAP on food choices
About one in eight Americans participate in SNAP each month.15 It serves as a valuable program to reduce food insecurity in numerous high-risk segments of the population. However, recent adequacy of SNAP benefits has been debated. Reasons include geographical variations in the cost of foods,16 problems associated with the TFP which forms the basis of the SNAP4 and frequency of distribution of the monthly benefits.
Geographical variations in the cost of food
SNAP benefits are fixed across the 48 states (higher in Alaska and Hawaii); however, variations in pricing of the food items occur in different areas of the country. At present, SNAP benefits are not adjusted to regional differences in food prices, as it would be politically untenable.
Thrifty food plan
A problem with the TFP being the basis for the SNAP benefits is that it is focused primarily on food items that are raw or require significant time for preparation.4 The underlying assumption is that individuals have sufficient time and skills for preparation, accessibility, and affordability to all food items. Furthermore, the TFP offers only a limited variety of foods, hampering its ability to meet the Dietary Guidelines.4
Frequency of distribution
SNAP benefits are distributed at the beginning of every month. However, the majority of grocery shopping takes place within the first 3 days of receipt of benefits.17,18 This distribution leads to a pattern known as “food stamp cycle” in which participants use their SNAP benefits within the first 2 weeks of receipt.19 Research shows that this infrequent distribution of benefits may have a negative influence on participants’ nutritional status. It has been shown that some food stamp recipients have cyclical patterns of food consumption, characterized by periods of overconsumption during the first part of the month after receiving benefits when financial resources and food are more abundant.20,21 This is followed by a period of underconsumption at the end of the benefit cycle when the quantity and quality of foods being consumed are reduced due to the depletion of benefits.20,21
All the above factors may influence the choices for foods selected by SNAP participants. In the absence of studies that directly assess food choices, this review aims to collect, analyze, and summarize the evidence on food choices using outcomes of patterns of food expenditures, nutrient intake and diet quality, and weight gain in the SNAP participants.
Design
Figure 1 illustrates the process of literature review and study selection. A search of the databases of PubMed, Web of Science, Embase, and Cochrane Library was conducted to identify prospective, case-controlled, and cross-sectional studies investigating food purchasing patterns, food expenditures, food choices, nutrition, and diet quality assessment in SNAP participants from January 1963 to December 2018. Keywords chosen were Supplemental Nutrition Assistance Program or SNAP, low-income households, adequacy of the SNAP, variations in SNAP benefits, food purchasing patterns, food expenditure, diet quality, diet analysis, and nutrient analysis.
 |
Figure 1 Flowchart demonstrating the process of study selection for systematic review on the food purchasing patterns and diet quality of Supplemental Nutrition Assistance Program (SNAP) and non-SNAP participants. |
Inclusion and exclusion criteria
Inclusion criteria were prospective, cross-sectional, or case–control investigations that measured food expenditures and diet or diet quality of SNAP and income-eligible non-SNAP individuals. Exclusion criteria were the absence of full text and not being available in English.
Data extraction
A total of 124 studies were retrieved using the keywords listed above. Two investigators separately examined the studies and the results were compared. Duplicate experiments were removed, and any disagreement regarding inclusion was resolved with the help of a third researcher. Initially, 65 studies were retrieved, which were then subject to the exclusion criteria, this resulted in a total of 51 studies included in the final analysis. The main findings of the studies were divided into three topics for assessing evidence for food choices in SNAP participants: investigations on food expenditure; nutrient intake and diet quality; and obesity and body mass index (BMI).
Quality of evidence
This systematic review used the GRADE (Grading of Recommendations Assessment, Development, and Evaluation Working Group) to evaluate the quality of evidence for the three different outcomes considered: food expenditures, diet quality, and BMI/obesity in SNAP participants.22 The GRADE uses a criterion based on an assessment of four factors for each outcome: risk of bias, consistency, directness, and precision.22 Table 3 illustrates the process of grading the evidence for the three outcomes based on these four criteria. In this review, randomized-controlled trials were rated as high evidence and observational studies as low. The grade for the outcome was reduced if there were any inconsistencies in the results of the studies or the methods for assessment of the outcomes, uncertainty about directness, small data sizes, reporting bias or serious limitations in the studies.23 The grade was increased if there was a strong or very strong evidence of association (p<0.05) based on evidence from observational studies, with adjustment for confounders, with the satisfaction of internal validity.23 Based on the above criteria, the quality of evidence was rated as high, moderate, low, and very low.22
 |
Table 1 Characteristics of studies included in the systematic review of food purchasing patterns in the Supplemental Nutrition Assistance Program (SNAP) and non-SNAP participants |
 |
Table 2 Characteristics of the studies included in the systematic review on diet quality in the Supplemental Nutrition Assistance Program (SNAP) and non-SNAP participants |
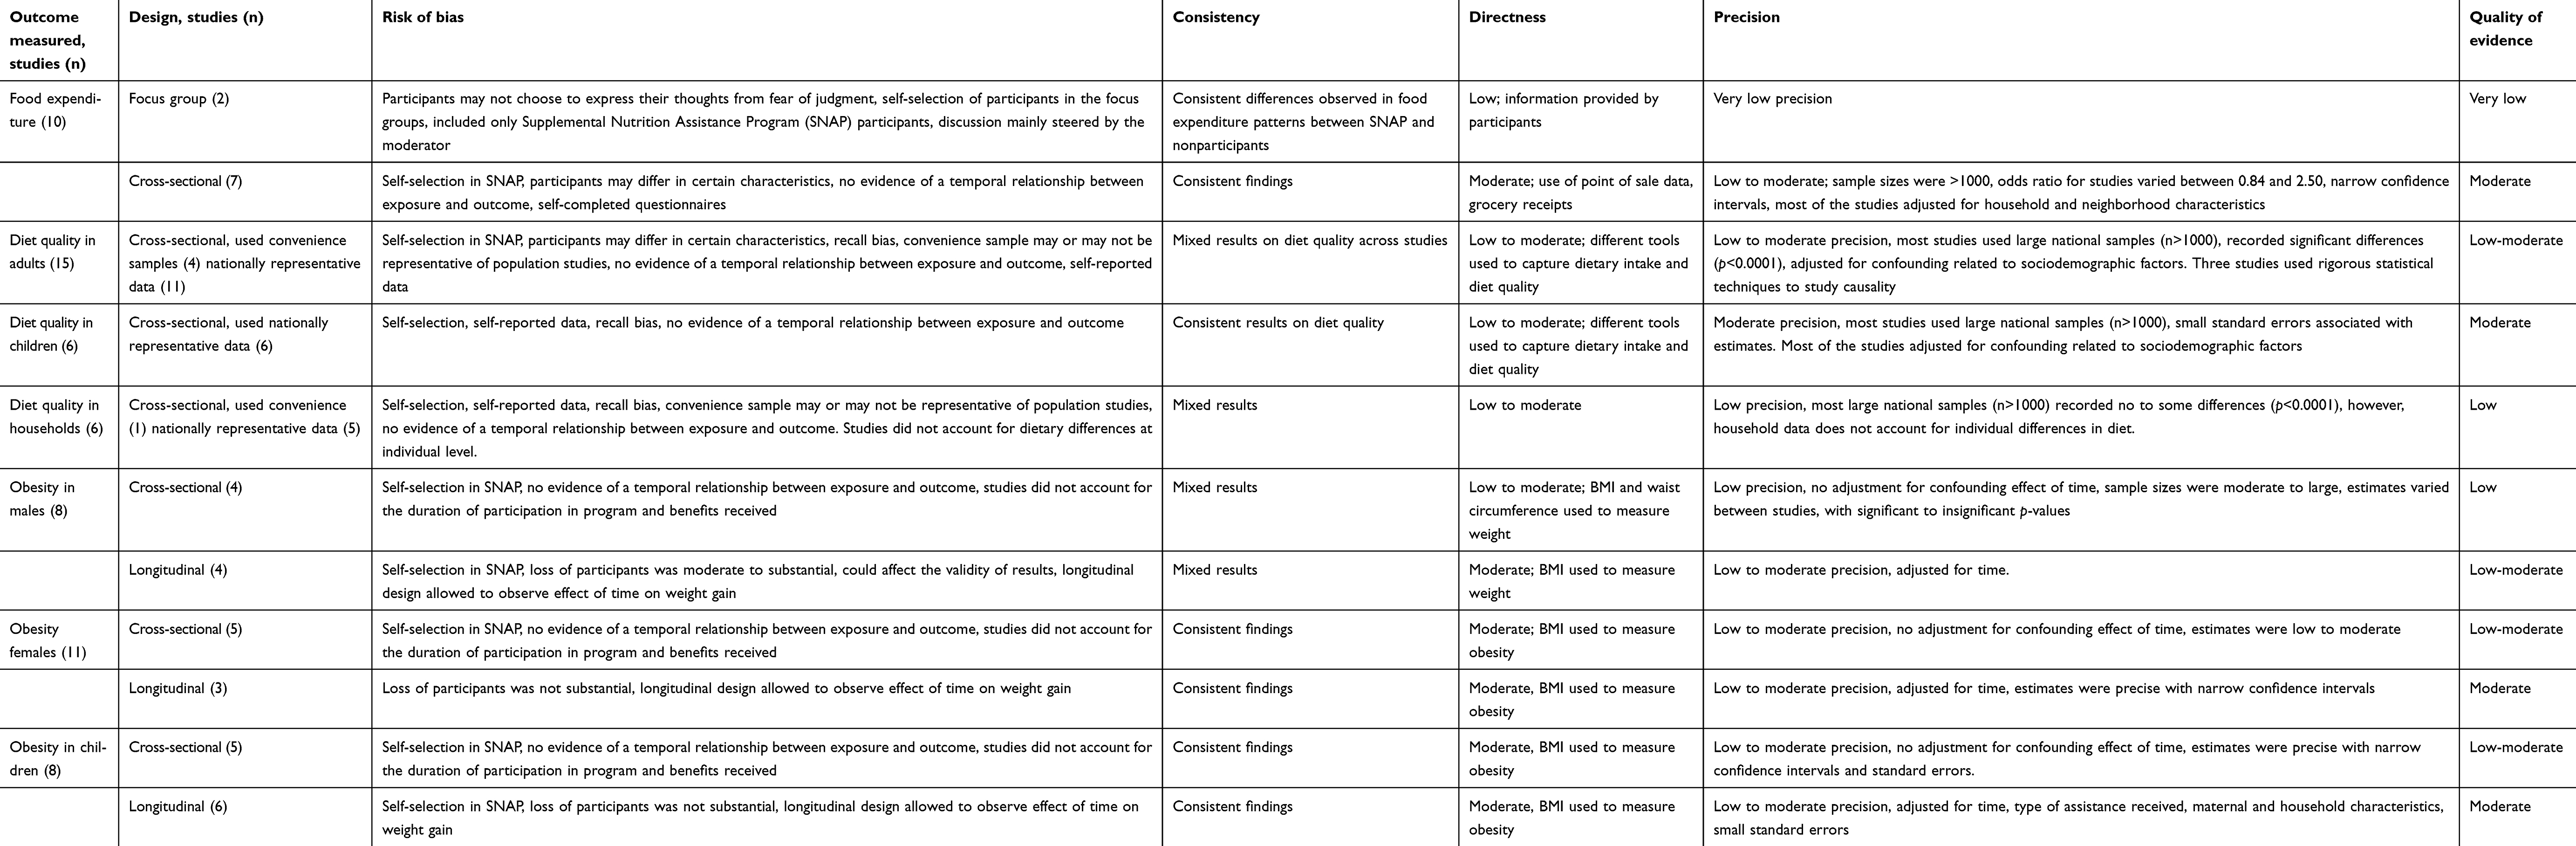 |
Table 3 GRADE (Grading of Recommendations Assessment, Development, and Evaluation Working Group) to evaluate the quality of evidence for the different outcomes used to assess food choices |
Results
Food choices influenced by the inadequacies of the SNAP
Leibtag et al, showed that food prices in the West and Northeast are above average, while those in the South and Midwest are below the mean.16 This uneven distribution of food costs suggests that clients in the South and Midwest can purchase more healthy food items, as compared to those in the West and Northeast.16 Bronchetti et al, utilized the 1999–2010 data from the National Health Interview Survey and found that in areas with lower food prices, higher real SNAP purchasing power was linked to a lower probability of being food insecure in children, ages 17 and under.24
The TFP is used to calculate the benefits for the SNAP clients. Research at the Tulane University concluded that the recipients would need to spend 2 hrs daily for preparing meals in order to follow the TFP.4 In single adult households with children, some are constrained by time for food preparation. These households spend 142% of the TFP cost on food, as compared to two adult households that spend 119% of the TFP cost. Thus, SNAP benefits may be insufficient to meet the needs of single-parent families.4
Few studies have investigated the variations in the utilization of the benefits over the period of a month. Hastings et al, reported that food expenditures, relative to non-benefit recipients, fall by 30% in week 4 after benefit distribution as compared to week 1.25 This uneven dissemination of funds leads to a decline of benefits as the month progresses, resulting in a deterioration of nutrient intake and diet quality over time.26 Hamrick et al, found that the likelihood of not eating in a day increased toward the end of the month, when the benefits are exhausted.27 Sanjeevi et al, observed a significant decrease in the consumption of fruits, vegetables, and diet quality of SNAP women participants toward the end of the monthly benefit period.26 In 244 African-American SNAP participants, a decrease in the diet quality occurred over time since SNAP distribution.28 Thus, these studies provide evidence of a decline in diet quality from the time of receipt of benefits.
Food choices as illustrated by food expenditure studies
The food purchasing patterns of SNAP households are described in Table 1. Previous studies have utilized grocery receipts and other food acquisition data to investigate the food purchasing patterns of SNAP households. In a cross-sectional study of 4826 households, Tiehen et al, documented lower expenditure of food in SNAP households, as compared to non-SNAP households, after adjusting for the household size and composition. Also, SNAP households exhibited the highest expenditure on food items just after receipt of the benefits.29
In a recent focus group study by Moran et al, SNAP participants reported that they purchased ultra-processed foods because these items have a long shelf life and could be stored to prevent food shortage at the end of the month.30 Franckle et al, analyzed the sales data over a period of two years and found that the SNAP participants spent greater on sugary beverages, red meat, and convenience foods and less on vegetables, fruits, and poultry as compared to nonparticipants.31 In 2017, Gustafson et al, reported that SNAP households purchased more (62%) sugar-sweetened beverages (SSBs) (41%) and less milk (60%) compared to non-SNAP participants.32 Similar results were shown by two other studies by Grummon et al, and Andreyeva et al, who documented that SNAP benefits were used to purchase foods higher in saturated fats and sodium33 and SSB, respectively.34
In contrast, a 2011 study by the USDA collected point of sale data from grocery stores, supermarkets, and drug stores. For every $1, both SNAP and non-SNAP households spent 40 cents on basic items of vegetables, milk, eggs, bread; 20 cents on sweetened beverages, desserts, and salty snacks; and 40 cents on cereals, rice, and beans.35 The conclusion was that SNAP and non-SNAP households spent a similar amount of money on sweetened beverages, salty snacks, and prepared beverages.35 In another study by Sanjeevi et al, higher expenditures were reported for red meat, refined grains, whole fruits, and other vegetables in SNAP households.36 In addition, the household percentage expenditures for dark green and orange vegetables, and whole grains were significantly lower than the TFP recommendations.36
Most of the research to date has conducted secondary analysis of national datasets to predict variations in food choices as SNAP benefits change. Anderson et al, predicted an increase in expenditure on groceries by $19.48, with a raise of $30 per capita in monthly SNAP benefits.37 It was further found that this increase in spending was related to higher consumption of healthier foods and lower food insecurity in the participants.37
Economic Research Service estimated the demand elasticities using the 1987–88 Nationwide Food Consumption Survey; it was concluded that a decline of 20% in food price would raise fruit and vegetable consumption by 2.2 cups in SNAP recipients.38 Yet, the Consumer Expenditure Survey (CE) of the Bureau of Labor Statistics data of 1991 and 2000 predicted no increase in purchase of fruits and vegetables as SNAP benefits escalated by $1.39
Finally, Castner et al, used data from the 1996 National Food Stamp Program Survey (NFSPS) and 2001–2004 surveys to investigate associations between spending on food and diet quality using the HEI-2005.40 A 10% increase in spending on food was positively associated with a rise in a household’s HEI-2005 score of 0.33% via NFSPS data, and an increase of 0.30% via NHANES data.40 With both datasets, improvements in diet quality were higher with an increase in benefits for fruit and vegetables.
Food choices as illustrated by nutrient intake and diet quality studies
The SNAP has played a major role in reducing hunger and food insecurity in the US. Table 2 illustrates the effect of participation in SNAP on the diet quality of individuals. Diet quality refers to both the quality and variety of the diet as measured by assessing the extent of alignment of food patterns with dietary guidelines.41 The results from studies investigating diet quality in SNAP recipients have been inconsistent, with some investigations observing none to negative42–44 impact on diet quality. For example, Lacko et al, documented comparable consumption of calories from fast-foods, and lower consumption of whole fruits and whole grain in both participants and nonparticipants.45 Yet, Zhang et al, analyzed NHANES data of 38,696 adults from 1999 to 2014 and found lower diet quality scores of SNAP participants as compared to the nonparticipants over the years.43 Furthermore, results from a secondary analysis of NHANES data from 1999–201246 and 2007–201044 showed that SNAP participants had lower diet quality as compared to income-eligible nonparticipants. Taille et al, documented that SNAP households consumed greater energy from SSBs, desserts, processed meats as compared to their counterparts.47 A systematic review documented that adult SNAP participants had poor diet quality as compared to the nonparticipants. However, intake of total kilocalories, macro and micronutrients did not differ significantly between participants and income-eligible nonparticipants.48 Finally, Nguyen et al, found that SNAP participation improved diet quality in the food insecure groups.49
In the analyses of a national dataset, participation in SNAP was associated with an increased probability of consumption of whole fruits by 23%.50 This increase may be because of the extra income through SNAP and the convenience factor associated with eating fruits that require no preparation time.50 Similar consumption of fruits and vegetable has been documented in both participants and nonparticipants.42,51,52 In contrast, consumption of dark green/orange vegetables was found to be low in SNAP participants.50
The evidence on the consumption of SSBs in SNAP vs the nonparticipants is mixed; with few reporting higher consumption42,53,54 to no differences.55,56 However, two of the investigations showing higher consumption in SNAP participants analyzed regional data sets34,57 and one did not report any difference for men.42 The evidence of SNAP on other food choices such as whole grains is also mixed. A study by Caster et al, found that SNAP recipients used more whole grains and grains that were more nutrient dense, as compared to income-eligible participants.40 In contrast, in a secondary analysis of the NHANES data involving 3142 women, Jun et al, reported no differences in whole grain intake between low-income and high-income women groups. The Hilmers et al, study on low-income women, consumption of whole grains was found to be lower both in participants and non-SNAP participants relative to the dietary guidelines.58 Few other studies have documented similar consumption of total grains among both groups.51,56
Food choices from weight and BMI studies
Previous research has documented higher weight gain and obesity in adult women SNAP participants20,59–61 and female children,62,63 but a decrease in obesity for male children.62 Analysis of the data from 2003 to 2006 NHANES showed that the SNAP participation was directly related to obesity [prevalence ratio: 1.58] in both adult men and women participants.64 In Los Angeles, SNAP participants were found to have twice the higher odds of obesity, as compared to nonparticipants.65 In contrast, analysis of the NHANES data from an earlier period, 1999–2002, did not find any differences in BMI between SNAP participants and nonparticipants.66 Zagarosky et al found that BMI of women SNAP participants was greater than one unit higher as compared to nonparticipants with similar socio-economic characteristics.67 Furthermore, the length of participation in SNAP showed a cumulative effect on BMI; longer periods were related to greater increases in BMI.67 In contrast, Fan et al, analyzed the National Longitudinal Study of Youth data, and found no association between participation in SNAP and obesity in adult women.68 Three longitudinal studies found that participation in SNAP over a long period of time was associated with a higher BMI in young girls, young daughters of mothers who were obese, and children living in cities.63,69,70
The results from studies in men are mixed. Results from studies, six59,61,67,70–72 found no association between participation in SNAP and risk of obesity, however, two other studies showed that participation was linked to higher BMI in men.60,73 In a study of 435 low-income individuals, receipt of SNAP benefits was related to a higher BMI.60 Also, Baum et al, documented that long-term participation in SNAP was associated with a 15% increase in the risk of obesity. However, this effect was not significant over a short and moderate period of 9 and 9–23 months, respectively.73
The effect of increased consumption of healthy foods on weight gain has been documented. In a simulation study by Han et al, a 20% reduction in the price of fruits and vegetables produced a greater reduction in BMI in SNAP participants vs nonparticipants.74 Similarly, a stochastic microsimulation analysis study observed a decrease in the incidence of obesity by 0.2% when fruits and vegetables were subsidized in SNAP clients.75 Thus, a reduction in prices of healthy foods might increase their consumption and lead to a reduction in the risk of obesity.
Discussion
SNAP is invaluable in terms of alleviating hunger and food insecurity in low-income households. Yet, it is difficult to evaluate whether SNAP influences the types of foods purchased as food choices are affected by numerous factors in the low-income, which include the cost of food, household size, nutrition knowledge, availability of fresh foods in the neighborhood, transportation, and cultural factors.8 Factors affecting food choices in low-income groups were evaluated using the focus group study held in six cities across the United States. The study included 28 focus groups of SNAP recipients from various ethnic groups (white non-Hispanics, African Americans, Hispanics), both working and non-working groups, as well as individuals from rural and urban areas. This focus group study included a diverse sample from all different groups and regions. However, a major limitation of focus group investigations is that participants may be hesitant to express their personal and honest opinions, from the fear of judgment or opposition from others.
SNAP has the potential to impact food choices due to issues with the design of the program. The benefit amount does not change in different geographic regions of the country, despite the varying cost of foods. Thus, the purchase of high cost, nutrient-rich foods such as fruits and vegetables may be compromised in areas where the cost of foods are higher.16 Although some adjustments exist in whether the way the net income is calculated in areas with a higher cost of living, evidence is limited as to whether these adjustments are sufficient to compensate for the greater expenditures on foods.24 Also, the benefits that are set based on the TFP may be too low for participants to purchase a healthy diet.4 This is particularly true because of the implicit assumption in the plan that SNAP clients prepare a large proportion of their foods from raw food materials.4
Another problem is that the distribution of benefits once a month may result in a “feast and famine cycle” among some SNAP participants.76 By the end of the month, the nutritional quality of the diet may have declined.26 Demonstration projects are needed to evaluate the impact of a bi-monthly distribution pattern on food expenditure and consumption in different demographic settings among SNAP participants.
Previous studies have analyzed grocery receipts or point of sale data for capturing food expenditure patterns in SNAP participants. Most of the studies reported differences between types of foods purchased and total spending in SNAP vs non-SNAP households. However, SNAP households may be different from households that do not participate in ways that affect their purchases. SNAP households have been found to be more disadvantaged, with a lower monthly income as compared to SNAP eligible nonparticipants households.29 In addition, family heads in the SNAP families were less educated and less likely to be employed as compared to heads in non-SNAP households.29 SNAP households were found to contain more children than eligible nonparticipant households.29 It is possible that the availability of free lunches and breakfasts at school, enables SNAP households with children to spend relatively less on food.29 Finally, all the food expenditure studies were cross-sectional in nature; as a result, no causal association between SNAP participation and food expenditures or choices can be inferred.
Whether diet quality differs between SNAP and income-eligible non-SNAP participants remain unclear. While most of these studies analyzed national datasets, a few have utilized local convenience samples.51,58 In addition, differences existed in populations studied ranging from children,52,77 adults,42,55,56 to the elderly.51,56 The variability in study designs, methodology, and sample makes it difficult to compare. The results from national samples document similar or low dietary quality in adult SNAP participants as compared to non-recipients; however, the diets of children on SNAP were similar to low-income nonparticipants. This disparity could be explained by the participation of low-income children in additional programs such as the National School Lunch Program and the School Breakfast Program.78 It should be noted that most of the dietary studies were cross-sectional in design, limiting the ability to establish a causal link between SNAP participation and poor diet quality or nutrient intake.
Self-selection is another factor that limits the ability to infer causality between SNAP participation and diet quality. Only 60% of the income-eligible recipients participate in food assistance programs and many report no need for nutrition assistance.79 Previous research has reported that SNAP nonparticipants may have attained higher education,80 live in higher-income neighborhoods,81 and have other sources of financial support. Leung et al, indicated that individuals who participate in SNAP may have greater poverty and food insecurity and receive inadequate nutrition than those who do not.82
The results of obesity studies are inconclusive. But why is there evidence that SNAP is associated with obesity? One suggestion has been that the absence of restrictions on the purchase of SSBs, or foods that are higher in sugar and fat, may increase consumption of these foods.83 Also, the “food stamp cycle” of receiving stamps just once a month in the beginning, and a decline in benefits over the time of distribution, could lead to periods of overconsumption and underconsumption and alternating patterns of energy intakes have been linked to overweight.20
The studies that link SNAP participation and obesity may serve as a proxy measure for food choices; however, these are confounded by variables of demographics, food insecurity, poverty, and self-selection. It has been documented that SNAP participation ensures an adequate quantity of food but may or may not ensure the quality of food purchased and consumed.43 Participants have shown increased consumption of sources of added sugars and solid fats.44,47,55 Nevertheless, the results should be interpreted with caution since these cross-sectional studies84,85 consider data at one point in time,60,61,84 but weight gain results from long-term imbalances of energy.66 Relatively few studies have investigated the effect of duration of the participation and obesity.62,63,67,70,73 Also, many factors may confound the association between exposure to SNAP and the risk for obesity such as duration of exposure and amount of benefits received. Further, differences might exist in the characteristics of people who participate for longer periods vs those that enroll for a shorter duration. Future studies could use statistical techniques such as random-effects model to address the problem of bias with self-selection into the program for varying durations.
Although the data on the increased consumption of SSB’s in SNAP vs non-SNAP are inconclusive, the unrestricted purchase of SSB’s with SNAP benefits may have contributed to this increased trend of consumption. Policymakers have proposed imposing sales taxes on SSBs or restricting purchase of these beverages with SNAP benefits.86 A study used point-of-sale data from 58 stores to estimate the changes in demand on taxation of sugar-sweetened among SNAP users.87 The taxation of SSBs reduced purchase and shifted focus toward non-taxed beverages of bottled water and milk.87 The implications of restricting the purchase of SSB’s through SNAP funds also are unclear. On the contrary, it is plausible that some SNAP recipients might shift on to using their own cash to purchase these items,88 or food manufacturers may create similar drinks with the same added sugar composition, which would not fall under the restricted category.89 In addition, it is unknown whether there is a significant difference in soda consumption between SNAP participants and nonparticipants that extends beyond the risk linked to poverty.90 More demonstration projects or pilot studies are warranted in order to obtain evidence on how such restrictions would affect choices for SSB.
Another point of consideration is that SNAP provides benefits for food purchases and not actual cash. The Southworth hypothesis provides distinctions between two groups of food stamp coupon recipients: inframarginal recipients, or those that have food expenditures higher than the value of the coupon benefits, and extramarginal recipients, whose food expenditures are less than or equal to the value of their coupon benefits.91 The hypothesis maintains that inframarginal recipients should choose the same amount and type of goods whether they receive food stamps or cash.91 Research on the Southworth hypothesis is inconclusive, with some investigations in support92,93 and other against this system.94,95 In an investigation by Lusk et al, in-kind transfers had a similar effect on food purchasing patterns as an unrestricted cash transfer for inframarginal consumers, but expenditures on food were higher for in-kind than cash transfers for extramarginal consumers.96 In the same study, which had a restriction on the purchase of SSBs with SNAP benefits, those who always purchased soda did so even after the restriction. They reported rearranging items purchased in cash or kind, with no extra cost. Thus, an increase in the food income through SNAP benefits or restriction of purchase of certain food items such as SSBs with SNAP benefits, might lead to varying purchasing patterns in different types of consumers.
Behavioral economic strategies to encourage SNAP recipients to select healthy choices could reduce cost of healthy foods,97 providing monetary benefits for the purchase of healthy foods,97 increasing the SNAP benefits, issuing SNAP benefits twice a month,98 incentivizing small food retailers to offer more food choices in low-income neighborhoods,98 increasing grocery stores and supermarkets in poor neighborhood and strengthening the SNAP-Ed program. Establishing supermarkets in low-income areas can be both costly and time-consuming.99 Also, a lack of transportation can still constitute a major barrier to accessing the supermarkets, thereby increasing the dependence on corner stores in low-income areas.100 Significantly higher purchase of unhealthy foods has been associated with shopping at corner stores as compared to that at the supermarkets.101 Results from the Baltimore Healthy Stores pilot project indicate that interventions targeted toward strengthening small food-based stores are effective in increasing healthy food availability in low-income neighborhoods.100
Which of the above strategies would be most effective is unclear, but economic incentives are certainly desirable. The USDA estimated that a decrease in the price of fruits and vegetables by 10%, would increase purchases of fruits and vegetables by 6–7% in SNAP participants.38 Blumenthal et al, surveyed 1250 individuals who had stakeholder interest in SNAP from different fields such as academia, advocacy groups, government, and the food industry.102 Respondents proposed the use of incentives in the form of vouchers and coupons to purchase healthy foods. An example of providing an economic benefit is seen in the Healthy Incentives Pilot randomized trial. The SNAP participants received 30 cents on every one dollar they spent on the targeted lists of fruits and vegetables.103 This resulted in a 26% increase in consumption of these foods.103 Another such initiative was the Double Up Food Bucks Program, in which SNAP participants received a $10 gift card, when they spent $10 on the purchase of fruits and vegetables in a single transaction. This program resulted in a rise in expenditure on fruits and vegetables by $0.40 per month. However, the effect deteriorated on withdrawal of the financial incentives, thereby indicating that the program did not produce long-lasting effects on the food choices and purchasing behaviors of the participants.104
Another suggestion is that an escalation in the total SNAP benefits would increase the spending on food in general. Greater spending on food is associated with higher consumption of fruits and vegetables for both SNAP participants and eligible nonparticipants.40 Lin et al, observed a rise in the consumption of fruits and vegetables with additional SNAP income, but the total intake was still below recommended levels. It is unclear whether an increase in SNAP benefits would result in greater consumption of these foods to match the level of the dietary recommendations.
The Farm Bill of 2014 requires SNAP-authorized retail stores to offer a larger variety of healthy food options.98 This provision will increase the access and availability of healthy foods to the beneficiaries. Yet, there might be problems associated with this approach as SNAP recipients may not be inclined to purchase these items, which may levy an economic strain on the retailer.98 Finally, increasing the availability of supermarkets and grocery stores in low-income neighborhoods may also be effective in reducing dependence on convenience stores or gas stations that do not offer adequate healthy food choices.98
There are some actions that can be taken by the government to improve the adequacy of the SNAP. One such action is to replace the TFP with the Low-Cost Food Plan.105 TFP is based on a national average of food prices; however, there is a wide variation in the food prices across the nation. As a result, higher food prices may limit the affordability of a healthy diet with the same SNAP benefits as compared to participants living in areas where food prices are low.105 Low-Cost Program is approximately 30% higher than the TFP, depending on household composition.105 Although the Low-Cost Food Plan, shares many limitations of the TFP, it is more in aligned to what low- and moderate-income families spend on food.105 In addition, it provides greater food choices for healthy foods.106
The current practice of the distribution of SNAP benefits is that they are received once a month and most of the funds are used in the first two weeks of receiving them. This pattern promotes the purchase of packaged goods that have a longer shelf life and can be used on a later date. A bi-monthly distribution of benefits may increase the purchase of perishable food items, and reduce the decline in diet quality by the end of the month.76
Encouraging alternate retailers such as mobile markets/vans and community gardens, which can increase access to healthy food options for groups who lack or have limited transportation for grocery shopping at supermarkets.102
Another promising strategy is strengthening SNAP-Ed, the nutrition education programs funded through SNAP. Two demonstration projects were undertaken by the USDA to increase the consumption of fruits and vegetables in SNAP recipients. The Building and Strengthening Iowa Community Support program delivered nutrition and physical activity education to elementary school children,107 while the Michigan State University Extension’s Eat Smart, Live Strong program provided education to low-income seniors.108 Both these programs increased the consumption of SNAP recipients for fruits and vegetables by 0.24 cups in children and 0.52 cups in the seniors, respectively.108 Thus, expansion of SNAP-Ed could play a valuable role in improving nutrition knowledge on understanding food labels, choosing healthy sources of macronutrients and micronutrients in the diet, identification of sources of added sugars, and ways to prepare balanced meals.109
Key research gaps
There is a lack of investigations that directly investigate food choices in SNAP participants. This research reviewed and summarized evidence on food choices as assessed from proxy measures of food expenditures, diet quality, and obesity in SNAP participants. However, this might not be the best approach as food choices are influenced by a number of individual, demographic, and socio-economic factors.
There was a wide diversity in the studies reviewed in terms of the design and sample sizes. They ranged from focus groups, convenience samples, national samples, cross-sectional studies to economic projection investigations. While focus group studies are qualitative in nature, cross-sectional studies could provide limited quantitative evidence on the causal relationship between SNAP participation and diet quality or obesity. However, this review has included a grading system to evaluate the grading of the evidence regarding different outcomes to provide more transparency and structure to the review.
There was a lack of consensus on the definitions and standards for measurements of outcomes such as diet quality. Diet quality is measured using different questionnaires and tools, making the standardization and interpretation of results difficult. These inconsistencies made it difficult to combine results across studies.
In summary, future research should use case-controlled or prospective study designs in low-income individuals to investigate the effects of participation in SNAP on food choices.
Conclusions
The SNAP in the US serves as an important safety net program for millions of low-income Americans. As such it has the potential to impact food choices and dietary intakes of a large segment of society. However, food choices are guided by factors other than socio-economic and demographic characteristics. These include human behavior with the biological propensity to eat foods high in sugar, salt, and fat. In addition, there are significant missed opportunities that limit the full potential of SNAP to promote the consumption of nutritious foods by SNAP recipients. Certain immediate steps can be taken by the government. These include replacing the TFP with the Low-Cost Food Plan; changing the pattern of distribution of SNAP benefits to bi-monthly; incentivizing food retailers to offer more food choices in low-income neighborhoods; encouraging mobile vendors to provide healthy foods to individuals who lack transportation; and strengthening the SNAP-Ed program. Finally, it would be beneficial to support pilot and demonstration projects to obtain evidence on policies of limiting SNAP benefits for the purchase of unhealthy foods.
Acknowledgments
This research was funded by the Bess Heflin Centennial Professorship #3086006875. The funder provided funds for conducting the study.
Disclosure
The authors report no conflicts of interest in this work.
References
1. Tiehen L, Jolliffe D, Gundersen C. Alleviating poverty in the United States: the critical role of SNAP benefits. ERR-132. Washington, DC: U.S. Department of Agriculture, Economic Research Service; 2012. Available from: https://www.ers.usda.gov/webdocs/publications/44963/17741_err132_reportsummary_2_.pdf?v=41995. Accessed July 09, 2019.
2. Blumenthal S, Hoffnagle E, Willett W, et al. SNAP to health: a fresh approach to improving nutrition in the Supplemental Nutrition Assistance Program. Paper presented at: Washington, DC: Center for the Study of the Presidency and Congress Health Medicine Program; 2012.doi:10.1094/PDIS-11-11-0999-PDN
3. Gray KF, Eslami E Characteristics of Supplemental Nutrition Assistance Program households: fiscal year 2012. U.S. Department of Agriculture, Food and Nutrition Service. Nutrition Assistance Program Report Series. No. SNAP-14-CHAR. VA. 2014. Available from: http://www.fns.usda.gov/fns/research.htm.
4. Rose D. Food stamps, the thrifty food plan, and meal preparation: the importance of the time dimension for US nutrition policy. J Nutr Educ Behav. 2007;39(4):226–232. doi:10.1016/j.jneb.2007.04.180
5. Food and Nutrition Service, U.S. Department of Agriculture. The Supplemental Nutrition Assistance Program. Training Guide for Retailers. Alexandria, VA;2014:1–8.
6. Center of Budget and Policy Priorities. Policy Basics: Special Features of Supplemental Nutrition Assistance Program. Washington DC;2018:1–13.
7. De Irala-Estevez J, Groth M, Johansson L, Oltersdorf U, Prättälä R, Martínez-González MA. A systematic review of socio-economic differences in food habits in Europe: consumption of fruit and vegetables. Eur J Clin Nutr. 2000;54(9):706–714.
8. Bradbard S, Micahels E, Fleming K, Campbell M. Understanding the food choices of low-income families. U S Department Agric. 1997;1–5. Available from: https://fns-prod.azureedge.net/sites/default/files/NUTRI.PDF. Accessed July 09, 2019.
9. Wardle J, Parmenter K, Waller J. Nutrition knowledge and food intake. Appetite. 2000;34(3):269–275. doi:10.1006/appe.1999.0311
10. Wiig K, Smith C. The art of grocery shopping on a food stamp budget: factors influencing the food choices of low-income women as they try to make ends meet. Public Health Nutr. 2009;12(10):1726–1734. doi:10.1017/S1368980008004102
11. Devine CM, Sobal J, Bisogni CA, Connors M. Food choices in three ethnic groups: interactions of ideals, identities, and roles. J Nutr Educ Behav. 1999;31(2):86–93. doi:10.1016/S0022-3182(99)70400-0
12. James D. Factors influencing food choices, dietary intake, and nutrition-related attitudes among African Americans: application of a culturally sensitive model. Ethnicity Health. 2004;9(4):349–367. doi:10.1080/1355785042000285375
13. Drewnowski A. Obesity, diets, and social inequalities. Nutr Rev. 2009;67(Suppl 1):S36–S39. doi:10.1111/j.1753-4887.2009.00157.x
14. Ver Ploeg M, Mancino L, Todd JE, Clay DM, Scharadin B Where do Americans usually shop for food and how do they travel to get there?: initial findings from the national household food acquisition and purchase survey. United States Department of Agriculture, Economic Research Service. No. 1476-2017-3882. 2015.
15. Nchako C, Lexin C SNAP: state by state fact sheets; 2018. Available from: https://www.cbpp.org/research/food-assistance/a-closer-look-at-who-benefits-from-snap-state-by-state-fact-sheets#Texas.
16. Leibtag E. Stretching the Food Stamp Dollar: Regional Food Prices Affect Affordability of Food. Washington, DC: U.S. Department of Agriculture, Economic Research Service, Economic Information Bulletin 29-2. Available from: http://www.ers.usda.gov/publications/eib29/eib29-2/eib29-2.pdf.
17. Wilde PE, Andrews MS. The food stamp program in an era of welfare reform: electronic benefits and changing sources of cash income. J Consum Affairs. 2000;34(1):31–46. doi:10.1111/j.1745-6606.2000.tb00082.x
18. Wilde PE, Ranney CK. The monthly food stamp cycle: shooping frequency and food intake decisions in an endogenous switching regression framework. Am J Agric Econ. 2000;82(1):200–213. doi:10.1111/0002-9092.00016
19. Cole N, Lee E. Analysis of EBT Redemption Patterns: Methods and Detailed Tables. Prepared for the U.S. Department of Agriculture, Food and Nutrition Service, Office of Analysis, Nutrition and Evaluation. Cambridge, MA: Abt Associates. Available from: http://www.fns.usda.gov/ora/menu/Published/snap/FILES/ProgramOperations/EBTRedemptionTables.pdf.
20. Townsend MS, Peerson J, Love B, Achterberg C, Murphy SP. Food insecurity is positively related to overweight in women. J Nutr. 2001;131(6):1738–1745. doi:10.1093/jn/131.6.1738
21. Dinour LM, Bergen D, Yeh MC. The food insecurity–obesity paradox: a review of the literature and the role food stamps may play. J Am Diet Assoc. 2007;107(11):1952–1961. doi:10.1016/j.jada.2007.08.006
22. Guyatt G, Oxman AD, Akl EA, et al. GRADE guidelines: 1. Introduction—GRADE evidence profiles and summary of findings tables. J Clin Epidemiol. 2011;64(4):383–394.
23. Johnson CC. The benefits of physical activity for youth with developmental disabilities: a systematic review. Am J Health Promotion. 2009;23(3):157–167. doi:10.4278/ajhp.070930103
24. Bronchetti E, Christensen G, Hoynes H. Local Food Prices, SNAP Purchasing Power, and Child Health. Available from: https://www.ocf.berkeley.edu/~garret/NHIS_JMP.pdf.
25. Hastings J, Washington E. The first of the month effect: consumer behavior and store responses. Am Econ J. 2010;2(2):142–162.
26. Sanjeevi N, Freeland-Graves J. Monthly variations in dietary intake of women participating in the Supplemental Nutrition Assistance Program. J Acad Nutr Diet. 2019;119(2):261–271. doi:10.1016/j.jand.2018.05.012
27. Hamrick KS, Andrews M. SNAP participants’ eating patterns over the benefit month: a time use perspective. PLoS One. 2016;11(7):e0158422–e015440. doi:10.1371/journal.pone.0158422
28. Kharmats AY, Jones-Smith JC, Cheah YS. Relation between the Supplemental Nutritional Assistance Program cycle and dietary quality in low-income African Americans in Baltimore, Maryland. Am J Clin Nutr. 2014;99(5):1006–1014. doi:10.3945/ajcn.113.075994
29. Tiehen L, Newman C, Kirlin JA. The food-spending patterns of households participating in the Supplemental Nutrition Assistance Program: findings From USDA’s FoodAPS. No. 1476-2017-4105. 2017.
30. Moran AJ, Khandpur N, Polacsek M, Rimm EB. What factors influence ultra-processed food purchases and consumption in households with children? A comparison between participants and non-participants in the Supplemental Nutrition Assistance Program (SNAP). Appetite. 2019;134:1–8. doi:10.1016/j.appet.2018.12.009
31. Franckle RL, Moran A, Hou T. Transactions at a Northeastern supermarket chain: differences by Supplemental Nutrition Assistance Program use. Am J Prev Med. 2017;53(4):e131–e138. doi:10.1016/j.amepre.2017.06.019
32. Gustafson A. Shopping pattern and food purchase differences among Supplemental Nutrition Assistance Program (SNAP) households and Non-supplemental Nutrition Assistance Program households in the United States. Preventive Med Rep. 2017;7:152. doi:10.1016/j.pmedr.2017.06.005
33. Grummon AH, Taillie LS. Nutritional profile of Supplemental Nutrition Assistance Program household food and beverage purchases. Am J Clin Nutr. 2017;105(6):1433–1442. doi:10.3945/ajcn.116.147173
34. Andreyeva T, Luedicke J, Henderson KE, Tripp AS. Grocery store beverage choices by participants in federal food assistance and nutrition programs. Am J Prev Med. 2012;43(4):411–418. doi:10.1016/j.amepre.2012.06.015
35. Garasky S, Mbwana K, Romualdo A, Tenaglio A, Roy M. Foods Typically Purchased by Supplemental Nutrition Assistance Program (SNAP) Households. US Department of Agriculture, Food and Nutrition Service, Alexandria, VA; Published November 2016.
36. Sanjeevi N, Freeland-Graves JH, Sachdev PK, Sands J. Do food expenditure patterns of supplemental nutrition assistance program households meet thrifty food plan recommendations? J Hunger Environ Nutr. 2019;117(12):1–13.
37. Anderson PM, Butcher KF. The Relationships among SNAP Benefits, Grocery Spending, Diet Quality, and the Adequacy of Low-Income Families’ Resources. Center on Budget and Policy Priorities; Washington DC;2016:14–20.
38. Guthrie JF, Lin B-H, Ver Ploeg M, Frazao E. Can food stamps do more to improve food choices. Econ Inform Bull. 2007;29(1):1–48.
39. Blisard N, Stewart H, Jolliffe D. Low-Income Households’ Expenditures on Fruits and Vegetables. Economic Research Service of the U.S. Department of Agriculture, Washington DC; 2004. (Agricultural Economic Report publication 833).
40. Castner L, Mabli J. Food Expenditures and Diet Quality among Low-Income Households and Individuals (summary). Mathematica Policy Research; Washington DC;2010.
41. Wirt A, Collins CE. Diet quality–what is it and does it matter? Public Health Nutr. 2009;12(12):2473–2492. doi:10.1017/S136898000900531X
42. Leung CW, Ding EL, Catalano PJ, Villamor E, Rimm EB, Willett WC. Dietary intake and dietary quality of low-income adults in the Supplemental Nutrition Assistance Program. Am J Clin Nutr. 2012;96(5):977–988. doi:10.3945/ajcn.112.040014
43. Zhang FF, Liu J, Rehm CD, Wilde P, Mande JR, Mozaffarian D. Trends and disparities in diet quality among US adults by Supplemental Nutrition Assistance Program Participation Status. JAMA Netw Open. 2018;1(2):e180237–e180237. doi:10.1001/jamanetworkopen.2018.0237
44. Condon E, Drilea S, Jowers K, et al. Diet Quality of Americans by SNAP Participation Status: Data from the National Health and Nutrition Examination Survey, 2007–2010. Available from: http://www.fns.usda.gov/sites/default/files/ops/NHANES-SNAP07-10.pdf.
45. Lacko AM, Popkin BM, Taillie LS. Grocery stores are not associated with more healthful food for participants in the Supplemental Nutrition Assistance Program. J Acad Nutr Diet. 2018. doi:10.1016/j.jand.2018.06.006
46. Gu X, Tucker KL. Dietary quality of the US child and adolescent population: trends from 1999 to 2012 and associations with the use of federal nutrition assistance programs. Am J Clin Nutr. 2017;105(1):194–202. doi:10.3945/ajcn.116.135095
47. Taillie LS, Grummon AH, Miles DR. Nutritional profile of purchases by store type: disparities by income and food program participation. Am J Prev Med. 2018;55(2):167–177. doi:10.1016/j.amepre.2018.04.024
48. Andreyeva T, Tripp AS, Schwartz MB. Dietary quality of Americans by Supplemental Nutrition Assistance Program participation status: a systematic review. Am J Prev Med. 2015;49(4):594–604. doi:10.1016/j.amepre.2015.04.035
49. Nguyen BT, Shuval K, Bertmann F, Yaroch AL. The Supplemental Nutrition Assistance Program, food insecurity, dietary quality, and obesity among US adults. Am J Public Health. 2015;105(7):1453–1459. doi:10.2105/AJPH.2015.302580
50. Gregory CA, Ver Ploeg M, Andrews M, Coleman-Jensen A Supplemental Nutrition Assistance Program (SNAP) participation leads to modest changes in diet quality. No.1477-2017-3991. 2013.
51. Fey-Yensan N, English C, Pacheco HE, Belyea M, Schuler D. Elderly food stamp participants are different from eligible nonparticipants by level of nutrition risk but not nutrient intake. J Am Diet Assoc. 2003;103(1):103–107. doi:10.1053/jada.2003.50010
52. Leung CW, Blumenthal SJ, Hoffnagle EE. Associations of food stamp participation with dietary quality and obesity in children. Pediatrics. 2013;131(3):463–472. doi:10.1542/peds.2012-0889
53. Watt TT, Appel L, Roberts K, Flores B, Morris S. Sugar, stress, and the Supplemental Nutrition Assistance Program: early childhood obesity risks among a clinic-based sample of low-income Hispanics. J Community Health. 2013;38(3):513–520. doi:10.1007/s10900-012-9641-1
54. Nguyen BT, Powell LM. Supplemental nutrition assistance program participation and sugar-sweetened beverage consumption, overall and by source. Prev Med. 2015;81:82–86. doi:10.1016/j.ypmed.2015.08.003
55. Bleich SN, Vine S, Wolfson JA. American adults eligible for the Supplemental Nutritional Assistance Program consume more sugary beverages than ineligible adults. Prev Med. 2013;57(6):894–899. doi:10.1016/j.ypmed.2013.10.006
56. Cole N, Fox MK Diet quality of Americans by food stamp participation status: data from the National Health and Nutrition Examination Survey, 1999–2004. Mathematica Policy Research. No. 364f57606a8646dfa102c621537dd586. 2008.
57. Leung CW, Villamor E. Is participation in food and income assistance programmes associated with obesity in California adults? Results from a state-wide survey. Public Health Nutr. 2011;14(4):645–652. doi:10.1017/S1368980010002090
58. Hilmers A, Chen T-A, Dave JM, Thompson D, Cullen KW. Supplemental Nutrition Assistance Program participation did not help low income Hispanic women in Texas meet the dietary guidelines. Prev Med. 2014;62:44–48. doi:10.1016/j.ypmed.2014.01.016
59. Chen Z, Yen ST, Eastwood DB. Effects of food stamp participation on body weight and obesity. Am J Agric Econ. 2005;87(5):1167–1173. doi:10.1111/ajae.2005.87.issue-5
60. Webb AL, Schiff A, Currivan D, Villamor E. Food Stamp Program participation but not food insecurity is associated with higher adult BMI in Massachusetts residents living in low-income neighbourhoods. Public Health Nutr. 2008;11(12):1248–1255. doi:10.1017/S1368980008002309
61. Fox MK, Cole N. Nutrition and Health Characteristics of Low-Income Populations, Volume III, School-Age Children. US Department of Agriculture; Washington DC;2004. E-FAN-04-014-3.
62. Gibson D. Long-term food stamp program participation is differentially related to overweight in young girls and boys. J Nutr. 2004;134(2):372–379. doi:10.1093/jn/134.2.372
63. Gibson D. Long-term food stamp program participation is positively related to simultaneous overweight in young daughters and obesity in mothers. J Nutr. 2006;136(4):1081–1085. doi:10.1093/jn/136.4.1081
64. Leung CW, Willett WC, Ding EL. Low-income Supplemental Nutrition Assistance Program participation is related to adiposity and metabolic risk factors–. Am J Clin Nutr. 2011;95(1):17–24. doi:10.3945/ajcn.111.012294
65. Chaparro MP, Harrison GG, Wang MC, Seto EY, Pebley AR. The unhealthy food environment does not modify the association between obesity and participation in the Supplemental Nutrition Assistance Program (SNAP) in Los Angeles County. BMC Public Health. 2017;17(1):81–87. doi:10.1186/s12889-016-4011-z
66. Ver Ploeg M, Mancino L, Lin B-H, Wang C-Y. The vanishing weight gap: trends in obesity among adult food stamp participants (US)(1976–2002). EconHuman Biol. 2007;5(1):20–36. doi:10.1016/j.ehb.2006.10.002
67. Zagorsky JL, Smith PK. Does the US food stamp program contribute to adult weight gain? EconHuman Biol. 2009;7(2):246–258. doi:10.1016/j.ehb.2009.05.003
68. Fan M. Do food stamps contribute to obesity in low-income women? Evidence from the National Longitudinal Survey of Youth 1979. Am J Agric Econ. 2010;92(4):1165–1180. doi:10.1093/ajae/aaq047
69. Kimbro RT, Rigby E. Federal food policy and childhood obesity: a solution or part of the problem? Health Aff. 2010;29(3):411–418. doi:10.1377/hlthaff.2009.0731
70. Gibson D. Food stamp program participation is positively related to obesity in low income women. J Nutr. 2003;133(7):2225–2231. doi:10.1093/jn/133.7.2225
71. Meyerhoefer CD, Pylypchuk Y. Does participation in the food stamp program increase the prevalence of obesity and health care spending? Am J Agric Econ. 2008;90(2):287–305. doi:10.1111/ajae.2008.90.issue-2
72. Ver Ploeg M, Mancino L, Lin B-H, 2007. Food and nutrition assistance programs and obesity: 1976–2002. Economic Research Report 55965. United States Department of Agriculture, Economic Research Service. doi:10.1094/PDIS-91-4-0467B
73. Baum CL. The effects of food stamps on obesity. South Econ J. 2011;77(3):623–651. doi:10.4284/sej.2011.77.3.623
74. Han E, Powell LM, Isgor Z. Supplemental nutrition assistance program and body weight outcomes: the role of economic contextual factors. Soc Sci Med. 2012;74(12):1874–1881. doi:10.1016/j.socscimed.2012.02.032
75. Choi SE, Seligman H, Basu S. Cost effectiveness of subsidizing fruit and vegetable purchases through the Supplemental Nutrition Assistance Program. Am J Prev Med. 2017;52(5):e147–e155. doi:10.1016/j.amepre.2016.12.013
76. Blumenthal S, Willett W, Leung C SNAP to health: a fresh approach to strengthening the Supplemental Nutrition Assistance Program. Paper presented at: Center for the Study of the Presidency and Congress (CSPC). Available from: http://www.thepresidency.org/storage/documents/CSPC_SNAP_Report.pdf.
77. Yen ST. The effects of SNAP and WIC programs on nutrient intakes of children. Food Policy. 2010;35(6):576–583. doi:10.1016/j.foodpol.2010.05.010
78. Fox MK, Hamilton WL, Lin B-H. Effects of Food Assistance and Nutrition Programs on Nutrition and Health. Food and Rural Economics Division, Economic Research Service, U.S. Department of Agriculture, Food Assistance and Nutrition Research; Washington DC; 2004.
79. Ratcliffe C, McKernan S-M, Zhang S. How much does the Supplemental Nutrition Assistance Program reduce food insecurity? Am J Agric Econ. 2011;93(4):1082–1098. doi:10.1093/ajae/aar026
80. Chaparro MP, Harrison GG, Pebley AR. Individual and neighborhood predictors of participation in the Supplemental Nutrition Assistance Program (SNAP) in Los Angeles County. J Hunger Environ Nutr. 2014;9(4):498–511. doi:10.1080/19320248.2014.962768
81. Cheng TC, Tang N. SNAP out of it: a study of low-income families’ underutilization of food stamps. J Poverty. 2016;20(2):152–167. doi:10.1080/10875549.2015.1094765
82. Leung CW, Tester JM, Rimm EB, Willett WC. SNAP participation and diet-sensitive cardiometabolic risk factors in adolescents. Am J Prev Med. 2017;52(2):S127–S137. doi:10.1016/j.amepre.2016.06.011
83. Freeland-Graves J, Sanjeevi N. Food purchasing patterns of Supplemental Nutrition Assistance Program Participants. J Acad Nutr Diet. 2016;116(9):A19. doi:10.1016/j.jand.2016.06.052
84. Jones SJ, Jahns L, Laraia BA, Haughton B. Lower risk of overweight in school-aged food insecure girls who participate in food assistance: results from the panel study of income dynamics child development supplement. Arch Pediatr Adolesc Med. 2003;157(8):780–784. doi:10.1001/archpedi.157.8.780
85. Ver Ploeg M, Mancino L, Lin B-H, Guthrie J. US food assistance programs and trends in children’s weight. Int J Pediatr Obesity. 2008;3(1):22–30. doi:10.1080/17477160701520231
86. Pomeranz JL. Implications of the Supplemental Nutrition Assistance Program tax exemption on sugar-sweetened beverage taxes. Am J Public Health. 2015;105(11):2191–2193. doi:10.2105/AJPH.2015.302850
87. Jithitikulchai T, Andreyeva T. Sugar-sweetened beverage demand and tax simulation for federal food assistance participants: a case of two New England States. Appl Health Econ Health Policy. 2018;16(4):549–558. doi:10.1007/s40258-018-0399-1
88. Bartfeld J, Gundersen C, Smeeding T, Ziliak JP. SNAP Matters: How Food Stamps Affect Health and Well-being. Redwood, CA: Stanford University Press; 2015.
89. Basu S, Seligman H, Bhattacharya J. Nutritional policy changes in the supplemental nutrition assistance program: a microsimulation and cost-effectiveness analysis. Med Decis Making. 2013;33(7):937–948. doi:10.1177/0272989X13493971
90. Schwartz MB. Moving beyond the debate over restricting sugary drinks in the Supplemental Nutrition Assistance Program. Am J Prev Med. 2017;52:S199–205. doi:10.1016/j.amepre.2016.09.022
91. Wilde P, Ranney C. The distinct impact of food stamps on food spending. J Agric Resour Econ. 1996;21:174–185.
92. Hoynes HW, Schanzenbach DW. Consumption responses to in-kind transfers: evidence from the introduction of the food stamp program. Am Econ J. 2009;1(4):109–139.
93. Moffitt R. Estimating the value of an in-kind transfer: the case of food stamps. Econometrica. 1989;385–409. doi:10.2307/1912560
94. Beatty TK, Tuttle CJ. Expenditure response to increases in in-kind transfers: evidence from the Supplemental Nutrition Assistance Program. Am J Agric Econ. 2014;97(2):390–404. doi:10.1093/ajae/aau097
95. Senauer B, Young N. The impact of food stamps on food expenditures: rejection of the traditional model. Am J Agric Econ. 1986;68(1):37–43. doi:10.2307/1241647
96. Lusk JL, Weaver A. An experiment on cash and in-kind transfers with application to food assistance programs. Food Policy. 2017;68:186–192. doi:10.1016/j.foodpol.2017.02.005
97. Richards MR, Sindelar JL. Rewarding healthy food choices in SNAP: behavioral economic applications. Milbank Q. 2013;91(2):395–412. doi:10.1111/milq.12017
98. Ammerman AS, Hartman T, DeMarco MM. Behavioral economics and the Supplemental Nutrition Assistance Program: making the healthy choice the easy choice. Am J Prev Med. 2017;52(2):S145–S150. doi:10.1016/j.amepre.2016.08.017
99. Gittelsohn J, Franceschini MC, Rasooly IR, et al. Understanding the food environment in a low-income urban setting: implications for food store interventions. J Hunger Environ Nutr. 2008;2(2–3):33–50. doi:10.1080/19320240801891438
100. Gittelsohn J, Suratkar S, Song H-J, et al. Process evaluation of Baltimore healthy stores: a pilot health intervention program with supermarkets and corner stores in Baltimore City. Health Promot Pract. 2010;11(5):723–732. doi:10.1177/1524839908329118
101. D’Angelo H, Suratkar S, Song HJ, Stauffer E, Gittelsohn J. Access to food source and food source use are associated with healthy and unhealthy food-purchasing behaviours among low-income African-American adults in Baltimore City. Public Health Nutr. 2011;14(9):1632–1639. doi:10.1017/S1368980011000498
102. Blumenthal SJ, Hoffnagle EE, Leung CW, et al. Strategies to improve the dietary quality of Supplemental Nutrition Assistance Program (SNAP) beneficiaries: an assessment of stakeholder opinions. Public Health Nutr. 2014;17(12):2824–2833. doi:10.1017/S1368980013002942
103. Olsho LE, Klerman JA, Wilde PE, Bartlett S. Financial incentives increase fruit and vegetable intake among Supplemental Nutrition Assistance Program participants: a randomized controlled trial of the USDA healthy incentives pilot–3. Am J Clin Nutr. 2016;104(2):423–435. doi:10.3945/ajcn.115.129320
104. Steele-Adjognon M, Weatherspoon D. Double up food bucks program effects on SNAP recipients’ fruit and vegetable purchases. BMC Public Health. 2017;17(1):946–953. doi:10.1186/s12889-017-4942-z
105. Heather Hartline-Grafton JW. Replacing the Thrifty Food Plan in order to Provide Adequate Allotments for SNAP Beneficiaries. Food Research and Action Center; Washington DC;2012.
106. Peterkin BB, Kerr RL. Food stamp allotment and diets of US households. Fam Econ Rev. 1982;23–26.
107. Blitstein JL, Cates SC, Hersey J. Adding a social marketing campaign to a school-based nutrition education program improves children’s dietary intake: a quasi-experimental study. J Acad Nutr Diet. 2016;116(8):1285–1294. doi:10.1016/j.jand.2015.12.016
108. Long V, Cates S, Blitstein J, Deehy K, Williams P, Morgan R. Supplemental Nutrition Assistance Program Education and Evaluation Study (wave II). Washington, DC. Available from: http://www.fns.usda.gov/research-and-analysis.
109. Guthrie JF, Lin B-H, Reed J, Stewart H. Understanding economic and behavioral influences on fruit and vegetable choices. Amber Waves. 2005;3(2):36–41.
 © 2019 The Author(s). This work is published and licensed by Dove Medical Press Limited. The
full terms of this license are available at https://www.dovepress.com/terms
and incorporate the Creative Commons Attribution
- Non Commercial (unported, 3.0) License.
By accessing the work you hereby accept the Terms. Non-commercial uses of the work are permitted
without any further permission from Dove Medical Press Limited, provided the work is properly
attributed. For permission for commercial use of this work, please see paragraphs 4.2 and 5 of our Terms.
© 2019 The Author(s). This work is published and licensed by Dove Medical Press Limited. The
full terms of this license are available at https://www.dovepress.com/terms
and incorporate the Creative Commons Attribution
- Non Commercial (unported, 3.0) License.
By accessing the work you hereby accept the Terms. Non-commercial uses of the work are permitted
without any further permission from Dove Medical Press Limited, provided the work is properly
attributed. For permission for commercial use of this work, please see paragraphs 4.2 and 5 of our Terms.