Back to Archived Journals » Research and Reports in Biology » Volume 6
Superresolution microscopy for bioimaging at the nanoscale: from concepts to applications in the nucleus
Authors Georgieva M, Nöllmann M
Received 5 May 2015
Accepted for publication 1 July 2015
Published 28 September 2015 Volume 2015:6 Pages 157—169
DOI https://doi.org/10.2147/RRB.S60501
Checked for plagiarism Yes
Review by Single anonymous peer review
Peer reviewer comments 3
Editor who approved publication: Professor Zvi Kelman
Mariya Georgieva,1 Marcelo Nöllmann1,2
1Centre de Biochimie Structurale, Centre National de la Recherche Scientifique (UMR5048), Institut National de la Santé et la Recherche Médicale (U1054), 2University of Montpellier, Montpellier, France
Abstract: Superresolution microscopy breaks the diffraction limit of light, making it possible to visualize a broad range of subcellular components with nearly molecular scale detail. The potential of this powerful tool is continuously growing since the implementation of optical configurations and data analyses compatible with the technically challenging, yet frequent in biology, thick and crowded samples. We review the principles underlying stimulated emission depletion, structured illumination, and single-molecule localization microscopy approaches, and their technical developments, with an emphasis on three-dimensional and live-cell imaging. Special attention is brought to the new requirements for probe efficiency, namely their size and their photophysical properties. Finally, recent applications exploring the interphase nucleus are described to illustrate the performance of superresolution techniques.
Keywords: fluorescence microscopy, superresolution techniques, nucleus, single-molecule localization microscopy, structured-illumination microscopy
Introduction
Microscopy has long been a valuable tool for visualizing the complexity of biological structures as well as for directly probing the dynamics of biological processes within cells, tissues, and organisms. The components of living matter span several orders of magnitude in size, ranging typically from several nanometers for individual proteins to tens of micrometers for a mammalian cell. Various microscopy techniques have been developed for the study of biological questions at these multiple scales. Electron microscopy (EM) is the method offering the highest resolution (~nm) and has allowed the detailed study of numerous cellular nanostructures. However, EM does not provide information on the identity of molecules building subcellular structures and is unsuitable for applications in living systems, excluding the possibility to follow dynamics. Atomic force microscopy is a scanning probe method providing high resolution, comparable to that of EM, and can be used for live imaging. Specific structural information can also be obtained by functionalization of the scanning tip, but atomic force microscopy can only explore the surface of cells.
A technique that has been widely used for the specific study of dynamics and localization of intra- and extracellular components in living specimens is fluorescence microscopy (FM). The simplest method for fluorescence imaging is the wide-field configuration (ie, epifluorescence). Diffraction of light within the optical system sets a theoretical boundary for the maximal resolution of a fluorescence microscope. The theoretical image of a point source through an optical system is best described by an Airy pattern. In practice, however, aberrations and other factors modify this theoretical profile. The point spread function (PSF) is the real three-dimensional (3D) image of a point source obtained through the microscope and comprises both the effect of diffraction and aberrations of the system (Figure 1A). The width of the PSF in the lateral direction is Δ ~ λ ×0.6/NA, where λ is the wavelength of the excitation light and NA is the numerical aperture of the objective. The resolution of an optical system is defined by the distance at which two point sources in the sample can be resolved in the image plane.1,2 When the two point sources are found closer than Δ, their diffraction patterns overlap and the two sources cannot be resolved (Figure 1B). Thus, Δ represents the resolution of the optical system, and structures smaller than this intrinsic distance cannot be resolved optically. This limit in resolution prevented scientists from visualizing the structures and processes happening below that scale length. Confocal microscopy improves the contrast of the image by reducing the out-of-focus light using a pinhole located at the confocal image plane of the light path. The sample is illuminated with a focused spot of laser light, and images are constructed pixel-by-pixel by raster scanning. The sizes of the spot PSF and the pinhole determine the diffraction-limited resolution of the constructed image, typically 200–300 nm in the lateral and ~500–700 nm in the axial directions.
 | Figure 1 Resolution in conventional fluorescence microscopy. |
Given the aforementioned advantages of FM, a major direction for instrumental development has been to beat the diffraction limit of light and increase the resolution up to that of EM. In the past decade, three classes of techniques that allow subdiffraction fluorescence imaging have been implemented, developed, and commercialized (reviewed in Schermelleh et al,3 Cox,4 Habuchi,5 and Fornasiero and Opazo6). Stimulated emission depletion (STED) microscopy is based on a confocal system and reaches subdiffraction resolution by decreasing the size of the detected PSF. This is achieved by selectively turning off molecules found away from the center of the excitation beam.7,8 Structured illumination microscopy (SIM) is a wide-field technique that beats the diffraction limit by illuminating the sample with patterned light, thus allowing the microscope to transmit higher spatial frequencies, ie, finer sample structures, than allowed by the Abbe limit.9 Single-molecule localization microscopies (SMLMs) access the precise positions of individual fluorophore molecules and use them to reconstruct high-resolution images.10–13 Over the past few years, studies applying superresolution microscopy (SRM) have revealed that these three approaches have their specific advantages and drawbacks, suggesting their potential complementarity in unraveling nanoscale biological processes. A valuable comparative overview of SRM methods characteristics and performance, including light sources, spatial and temporal resolution, and limitations, has been provided in a study by Schermelleh et al.3
Here, we review the principles and fundamental advances in SRM methods and discuss their live cell imaging and probe requirements. We then highlight diffraction-unlimited quantitative microscopy studies that have allowed to gain unprecedented detailed insight into the structure and inherent dynamics of fine cellular components in the nuclear compartment.
Technology overview of superresolution imaging
Stimulated emission depletion
The first technique that has achieved subdiffraction resolution fluorescence imaging is STED microscopy. STED was theoretically introduced in the 1990s14 and experimentally demonstrated in 2000.15 This method relies on the photophysical phenomenon formalized by Albert Einstein, termed stimulated emission. When a fluorophore in its excited state is illuminated, it can return to its ground state through emission of a photon with the same energy as the stimulating photon.
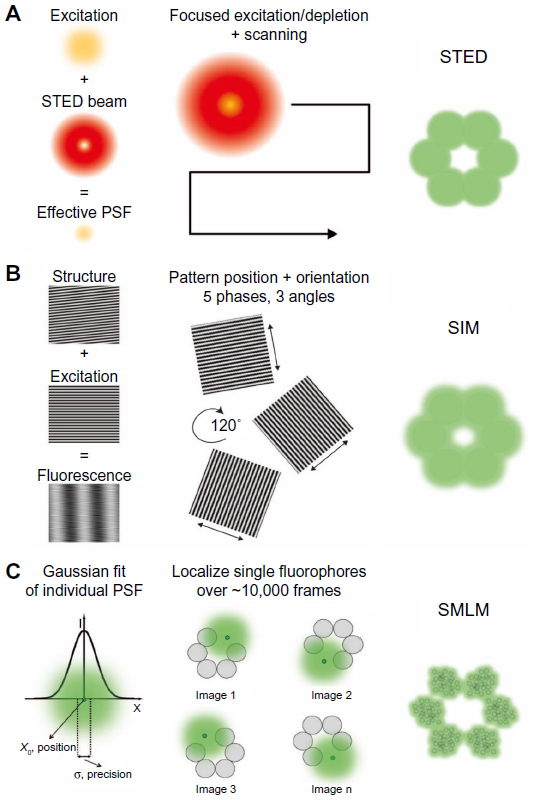
In STED microscopy, subdiffraction resolution is obtained by shrinking the effective PSF of the diffraction-limited excitation spot in a confocal setup (Figure 2A). Stimulated emission is used to deplete the population of excited fluorophores that are located at the periphery of the excitation spot. Selective depletion is achieved by applying a doughnut-shaped beam with zero intensity at its center, aligned with the center of the excitation beam. The excitation laser has a wavelength near the absorption maximum of the fluorophore used for sample labeling, and the depletion laser has a longer wavelength than the fluorophore maximum emission wavelength. Thus, the excited fluorophores found within the minimum of the doughnut will emit at the natural emission wavelength, and those outside will emit at the depletion laser wavelength. The resolution of the system is increased when the size of the doughnut hole is reduced by increasing the depletion laser power. In biological samples, resolutions up to 20 nm have been reported.16 The spatial resolution of a STED microscope is strongly dependent on the quality of the depletion beam profile, which will define the shape and size of the STED excitation spot. Improving the spatial resolution requires a finely tuned depletion beam and a perfect alignment with the excitation line.
 | Figure 2 Superresolution microscopy techniques. |
According to the excitation and depletion schemes used, there are several designs of STED microscopes, namely with pulsed, continuous wave (CW) and two-photon laser sources. Pulsed mode STED (p-STED) achieves the highest resolution and requires synchronization of the excitation and depletion laser pulses.17 To detect nondepleted fluorophores, either the timing14,15 or the lifetime information18,19 is used in p-STED. Using CW lasers for both excitation and depletion simplifies the setup since no precise time delays between laser pulses are needed.20 However, the resolutions achieved are lower compared to p-STED. Two-photon excitation has been combined with STED,21 both in the pulsed and the CW modes in order to image thick samples, such as tissue slices, with diffraction-unlimited resolution.22,23 The different modes of STED microscopy have been widely used for both fixed and live cells, and applications have been reviewed.7,8
In STED, the use of a doughnut-shaped depletion laser beam improves lateral resolution, but the axial resolution remains that of a confocal setup, since zero depletion intensity is distributed along the optical axis. Subdiffraction axial resolution was achieved by tuning the shape of the depletion beam.15,24 Another approach has been to combine STED with either total internal reflection fluorescence (TIRF)25,26 or with a 4Pi microscope configuration. In TIRF, the incident angle of the excitation light is highly inclined to obtain an evanescent wave with exponential decay, which restricts excitation to a thin region of 100–200 nm above the surface of the coverslip. TIRF effectively removes out-of-focus blur; however, its use is limited to imaging cellular components near the cell surface. The 4Pi setup uses two opposing objective lenses, both focused at the same point. This method improves axial resolution down to ~80 nm and can be applied to samples a few micrometers thick, though its implementation is challenging.27,28
Multicolor imaging has also been achieved in STED microscopy. The first type of multicolor STED requires an excitation/depletion laser couple per fluorophore,29–31 which is technically demanding. Efforts have been made to reduce the number of laser lines by exploiting the spectral properties of both fluorescent proteins (FPs) and organic dyes.16,32–34
Structured illumination microscopy
When a fluorescent sample is observed with an optical microscope, the structure is blurred in the resulting image due to the diffraction of light (Figure 1B). In other words, features of a sample smaller than ~200 nm in the lateral and ~700 nm in the axial directions could not be transmitted by the optical setup. This is the case in conventional wide-field microscopy, in which the specimen is illuminated with a nearly homogeneous beam of light. SIM is a wide-field configuration capable of doubling the diffraction-limited resolution. In two-dimensional (2D) SIM,35 this is achieved by exciting the sample with a line pattern of sinusoidally alternating intensity maxima and minima with a frequency at the diffraction limit (Figure 2B). For a given orientation and phase of the sinusoidal stripes, the resulting raw image is an interference pattern between the illumination and the sample and encodes subresolution structural information that is filtered by a conventional microscope. A high-resolution image is thus reconstructed by mathematical processing of raw images acquired with several directions of the patterned excitation.9 Typically, 2D imaging requires nine raw images (three phases along three orientations at 120°).
By modulating the illumination pattern so that it varies sinusoidally in all three directions in space, the third dimension was introduced to SIM.36 The 3D SIM allows physical optical sectioning with axial resolution of ~300 nm. The increased complexity of the excitation pattern requires to image at five different phases so that the resulting data can be mathematically decomposed into the constituting high-resolution parts. To be able to computationally reconstruct a high-resolution 3D-SIM dataset, each Z-section requires 15 exposures (Figure 2B). The sections have to be taken not more than 125 nm apart to allow full sampling in the axial direction.
A major disadvantage of SIM with respect to STED and SMLM is the relatively low attainable resolution. It has been shown that, in principle, SIM can reach higher resolutions if the fluorescence response is no longer linear, by saturating fluorophores in the excited state.37 The concept was applied in saturated SIM (SSIM) with lateral resolution of ~50 nm using fluorescent beads.38 The high laser intensities required in this approach make its application in biological imaging challenging. An alternative to obtain nonlinearity is the use of reversible on–off transitions of a specific class of fluorescent probes. SSIM with the photoswitchable protein Dronpa allowed ~60 nm resolution imaging of nuclear pores in extracted nuclei using the TIRF mode.39
The relatively large number of acquisitions per plane (~15) in SIM can lead to photobleaching and sample drift during the acquisition. These effects can severely degrade performance and produce reconstruction artifacts. To reduce these shortcomings, it is important to correctly match the refractive indices, increase labeling contrast, and reduce sample movement during acquisition (either mechanical or biological). Particular attention must be paid when interpreting structures that are close to the SIM resolution limit, as reconstruction at these length scales is intrinsically prone to artifacts. SIM has been a popular choice to reveal various cellular structures at higher contrast.40 It offers the possibility of fast 3D imaging with most conventional fluorophores as long as they are sufficiently photostable and is highly convenient for multicolor applications.
Single-molecule localization microscopies
SMLM or probe-based superresolution imaging is a family of techniques that utilizes the particular photophysical properties of a subset of fluorescent dyes to accurately determine their individual positions and thus obtain diffraction unlimited resolution.10 These include photoactivated localization microscopy (PALM),41 fluorescence PALM (FPALM),42 stochastic optical reconstruction microscopy (STORM),43 and direct STORM (dSTORM).44 Unlike STED and SIM, which tune the illumination pattern to improve imaging resolution, SMLM employs a classical wide-field configuration. The principle of SMLM methods relies on the possibility to localize a single point source of light by fitting its PSF with a Gaussian or Lorentzian function. The precision of localization is dependent on the number of photons emitted by the molecule, the background, and the width of the PSF.45 An underlying condition is a low probability of emitter overlap, ie, only a small subset of fluorophores is to be emitting in the same time over the field of view (Figure 2C). This is achieved either using photoactivatable proteins that are reversibly/irreversibly turned on (PALM/FPALM) or through reversible stochastic photoswitching of organic dyes in the presence of a reducer in oxygen-depleted medium (STORM/dSTORM). The amount of simultaneously emitting molecules can be controlled by modulating the intensities of an excitation laser (typically in the visible spectrum), which serves to image and turn off (or photobleach) the fluorophores. In addition, a lower wavelength laser is used to repopulate the excited state through dye-dependent mechanisms.46–48 STORM relies on pairs of activator and reporter dyes coupled to the same probe molecule. The activator dye absorbs at the activation laser wavelength and facilitates the activation of the reporter dye through energy transfer between adjacent molecules. The activated reporter dye absorbs light from the excitation laser, and its emission position is localized. In contrast, dSTORM makes use only of the absorption properties of the reporter dye. It is worth mentioning that both methods use similar activation/excitation schemes and imaging buffer composition.
Localization precision in SMLM is in the range of ~10–30 nm and can be improved using brighter probes. However, the smaller the uncertainty in the emitter position, the higher the fluorophore-labeling density required to effectively increase the structural resolution.49 According to the Nyquist sampling theorem, the average distance between adjacent fluorophores must be twice smaller than the desired resolution. For the evaluation of SMLM image resolution, a Fourier ring correlation method was introduced, with the advantage that no detailed knowledge of the sample is needed for the calculation.50
For the reconstruction of a high-resolution image, the positions of all the detected single-molecule fluorescent events are overlaid, with intensities reflecting both density and localization uncertainty (Figure 2C, right). To collect a sufficient amount of localization data, most often tens of thousands of frames are needed for biological samples. The long acquisition times, typically lasting tens of minutes, lead to nonnegligible sample drift. In the axial direction, drift is corrected during acquisition with an autofocus feedback system. Lateral drift is corrected during postprocessing thanks to fiducial markers added to the sample or using spatiotemporal cross-correlation of localizations.51
The first studies of SMLM were performed in the TIRF mode, which limits the depth of excitation, achieving subdiffraction resolution in all three directions.41–43 However, to image structures located further than ~200 nm above the coverslip surface, several optical and computational techniques have been developed to obtain axial localization information (3D SMLM). Three categories of 3D-SMLM methods can be distinguished: interferometric approaches (including 4Pi, also used in 3D-STED and 3D-SIM configurations),52 multiple plane imaging,53 and PSF engineering. The last category breaks the symmetry of the PSF, thus the axial position of fluorophores can be determined using calibration curves. A widely used approach is the introduction of astigmatism in the microscope emission path either with a cylindrical lens54 or with adaptive optics, which in addition allow optical aberrations correction.55 Axial resolutions reported with this method have reached ~50 nm within a range of ~750 nm. Alternatively, higher probing depth has been obtained by double helix shaping of the PSF (~1.5 μm) with similar axial resolution.56 Isotropic resolution of ~10–15 nm with a 3 μm axial range was achieved with the self-bending PSF method.57 A detailed overview of 3D SMLM approaches as well as a critical assessment of their performances and applicability have been recently provided by Hajj et al.58
A further improvement of SMLM has been the optical sectioning capacity. Thick samples, such as whole cells (up to ~10 μm above the coverslip surface) and 3D cell cultures (50–150 μm deep), have been imaged combining 3D PALM with two-photon activation59 and light-sheet microscopy,60,61 respectively.
The development and characterization of new photoswitchable proteins and organic fluorophores with different spectral and photophysical properties favored the multicolor extension of SMLM.10,62–64 Thus, the relative distribution of various molecular assemblies and cellular structures in both fixed65,66 and live67–69 cells have been revealed with remarkable detail.
Live cell imaging
A notable strength of FM is the possibility to directly probe biological processes in living samples. This allows not only the visualization of biomolecules in their nearly natural environment, but also the study of dynamics and structures of biomolecular factors, their interactions, and their transport. The high contrast, specificity, and sensitivity and the relatively low invasiveness and versatility of the labeling have contributed to the establishment of FM as a method of choice for live cell imaging. However, the time scale of a large number of cellular events is such that it remains technically challenging to obtain sufficient temporal resolution, while preserving the sensitivity of detection and the survival of the specimen.70 The challenge is even greater when in addition high-spatial resolution is needed to study smaller than the diffraction limit cell components with inherently low molecular density. In this context, the performance of fluorescence microscope configurations for a given live cell experiment is to be evaluated by taking into account the imposed trade-offs in imaging parameters, namely acquisition speed, spatial resolution, imaging depth, and the extent of light-induced photodamage, affecting both the fluorescent probe and sample viability. For instance, improving the temporal resolution demands a faster imaging rate, hence shorter exposure times for excitation. The result is a lower fluorescence signal which affects the attainable spatial resolution regardless of the superresolution technique employed. Consequently, laser power is to be increased for better signal detection, leading to phototoxicity, which generates a risk of artifactual observations.
In practice, SRM methods, while having their specific weaknesses and strengths, have been successfully applied for the study of nanoscale-sized dynamic biological phenomena, with imaging speed of tens of frames per second (fps). SIM offers the highest acquisition rates and reduced photodamage compared to STED and SMLM (103–106 times lower light exposure), although spatial resolution is limited. Both fast imaging (28 fps) and high resolution (62 nm) have been achieved in STED in a molecularly crowded environment.71 However, phototoxicity due to the elevated laser powers required to reach high spatial resolution remains a major limitation for live cell imaging with STED. The photon charge applied on the sample was significantly reduced with a STED variant, which uses fluorophore photoswitching in line with the concept of reversible saturable optically linear fluorescence transitions (RESOLFT).72 The imaging speed was further increased as RESOLFT was combined with multiple doughnut beams to scan the sample simultaneously.73
SMLM is intrinsically slow since accurate localization of individual fluorophores requires that only a sparse subset of emitters is fluorescent in each frame within a diffraction-limited spot. Thus, a large number of frames are needed for image reconstruction, which limits the temporal resolution. However, SMLM is able to access single-molecule information, making it an attractive technique to obtain quantitative information on protein numbers and dynamics. The development of high-density localization algorithms74–76 led to a considerable decrease in acquisition time. The performance of SRM methods in the context of live cell imaging, and the most recent developments have been discussed elsewhere.4,77
Probes for superresolution imaging
Specific identification of molecules within biological samples with low invasiveness and high imaging contrast are the hallmarks of FM. However, depending on the fluorescent probe and the individual requirements of the imaging technique, particular attention must be paid during sample preparation and the acquisition procedure to avoid potential artifacts.
Molecular tags
Specificity in fluorescent labeling is obtained either with genetically encoded tags fused to the molecular target or with affinity probes. The former strategy allows the labeling of proteins, the tag size is relatively low (~25 kDa), and it is live cell compatible. Fusion protein labels can be either intrinsically fluorescent, ie, the well-known GFP and its variants, or coupled to a fluorescent dye by covalent enzyme–ligand binding, such as the commercially available SNAP-tag (~20 kDa).78 When introducing tagged proteins in a biological specimen, cell physiology may be altered by overexpression, aggregation, mistargeting, misfolding, and perturbation of protein function, which constitute the main limitation of this labeling approach in conventional microscopies, and to an even greater extent at subdiffraction resolution. A powerful solution is the use of knock-in strategies, providing endogenous expression levels, especially when protein quantification is intended, as in most PALM applications.79
Biological structures can alternatively be tagged with affinity probes, among which antibodies are the most widely spread. Antibodies are an accessible, versatile tool, which allows direct specific labeling of endogenous epitopes. They are particularly useful to target, among others, posttranslational protein modifications (phosphorylation, ubiquitination, SUMOylation, etc) and even to recognize methylation sites on DNA. Whereas diffraction-limited microscopy is insensitive to the large dimensions of antibodies (~150 kDa/~15 nm) allowing secondary antibody labeling, in superresolution imaging (SMLM in particular), probe size becomes a parameter potentially limiting the achievable structural resolution. Consequently, primary antibody monovalent fragments (Fab, ~50 kDa) or the naturally occurring single-chain camelid antibodies (also named VHHs or nanobodies, ~15 kDa) are a promising development,80 though their availability is still limited.
In SRM, a nonnegligible aspect of intracellular component visualization with affinity probes is the requirement for sample fixation and permeabilization. These processing steps inevitably introduce alterations in the specimen, and structural preservation is critical for properly interpreting observations of molecular scale detail. For instance, insufficient fixation or destructive permeabilization may result in target mislocalization or degradation. In contrast, strong fixation (as practiced in EM) preserves the structures, but may also restrain epitope accessibility, thus limiting the labeling density and therefore the achievable structural resolution in subdiffraction imaging experiments. An optimized protocol for SMLM sample preparation has been recently introduced.81
Fluorescent molecules
Imaging contrast (ie, how well the structure of interest can be discriminated from its environment) is a crucial component of FM, which relies on the performance of fluorescent molecules. Some general parameters for assessing fluorophores are brightness (calculated as the product of the extinction coefficient and the quantum yield), photostability, and water solubility. Recently, an additional property that describes the ability of fluorescent molecules to transit between bright and dark states, termed photoswitching, has become fundamental in SRM applications.46 The principle of SMLM relies on the detection of single molecules with nanometer precision. Most often this is achieved by separating emission from each single emitter in time by making use of their stochastic photoswitching behavior. In addition, the use of photoswitchable probes has contributed to considerably improve the performance of other superresolution methods such as RESOLFT and SSIM. Fluorophore photoswitching is usually quantified by the number of switching cycles, the number of detected photons per switching event, the duty cycle (fraction of time a fluorophore spends in an on state), and the on and off switching rates.63
The number of switching cycles reflects the number of times an emitter enters the bright state and can be detected. For SSIM, RESOLFT, and live cell SMLM, multiple detections are preferred to construct high-resolution images. In contrast, quantification of absolute protein numbers with PALM would ideally benefit from a single switch before photobleaching. In practice though, all known fluorophores display multiple switching cycles that must be accounted for in quantification procedures82–85 (reviewed in Durisic et al86 and Shivanandan et al87). The number of detected photons per switching event (a metric of the photoswitch brightness) and the duty cycle (the fraction of time an emitter spends in the fluorescent state) together determine the spatial resolution achievable in SMLM methods. The former is proportional to the localization precision, while the latter limits the number of fluorophores that may be localized within the volume of the PSF. Finally, the on/off switching rates are one factor limiting the speed of image acquisition and thus the temporal resolution of superresolution methods employing photoswitchable probes.
According to their origin, fluorophores are of two types: naturally existing in living organisms and subsequently genetically engineered (FPs), and chemically synthesized (organic dyes). In the context of superresolution imaging, specific advantages of each category impact on the labeling strategy. Typically, the duty cycle of photoswitchable FPs tends to be lower than organic fluorophores and allows imaging of densely labeled structures. In addition, FPs label proteins with a controlled stoichiometry of 1:1, crucial in quantification experiments, whereas organic fluorophores are generally coupled to affinity probes, for which labeling efficiency is difficult to evaluate. In contrast, organic dyes display superior brightness and photostability, allowing higher localization precision. They are available in a broader variety of absorption/emission spectra spanning the visible and importantly the near infrared wavelengths, which makes them convenient for multicolor experiments. While FPs do not require a particular composition of the imaging medium in SMLM experiments, photoswitching of organic fluorophores has been initially obtained by depleting oxygen in the imaging buffer and by addition of a reducer (thiol), toxic for cells. Eventually, the exploration of cell-permeative tags and the optimization of imaging buffers have introduced organic fluorophores in live cell superresolution applications.88–93
Several studies provide systematic evaluation of FPs and organic fluorophores for superresolution applications.62,64,94 While most fluorophores have been optimized for a single superresolution technique, probes that display good performance in several of them have been recently developed, such as the photoswitchable proteins Dreiklang95 and mMaple,96 which will foster the development of multimodal SRM approaches.
The nuclear compartment studied with SRM
Since its first implementation, SRM has made molecular scale insight into major cellular processes, notably membrane receptor distribution and oligomerization, a critical step in cell signaling, possible.83,97,98 With the evolution of optical setups providing the possibility to image thick samples and the improvement of analysis procedures performance in lower signal to noise conditions, structures and phenomena deeper in the specimens have become accessible to quantitative analysis. In this section, we review recent SRM studies that have contributed to enrich our understanding of the organization and functioning of the nuclear compartment. Specifically, we will focus on research performed in interphase chromatin folding and transcription machinery dynamics, two crucial components of gene regulation.
RNA polymerase 2 (RNAP2) distribution and dynamics
The most regulated step in gene expression is transcription. It involves complex interactions between DNA and transregulatory elements, the latter including histone modifying enzymes, transcription factors, and RNAP complexes. The DNA-binding properties and dynamics of nuclear factors are central to the understanding of transcription and have been intensively explored with biochemical assays, or more recently with genome-wide chromatin immunoprecipitation techniques and single-particle tracking.99 RNAP2 is a well-studied transcription effector; however, its nuclear distribution and dynamics at the molecular level had not been directly probed. In particular, quantitative imaging has been lacking essentially due to the relative abundance of RNAP2 in the nucleus and microscope limitations. Recently, two elegant SMLM studies have provided molecular scale spatiotemporal insight into RNAP2 clustering in mammalian cells.100,101
Transcription was proposed to take place in RNAP2-enriched foci known as transcription factories, where transcription of multiple loci can be coordinated and potentiated.102 Cisse et al100 tested this hypothesis by investigating the dynamics of RNAP2 assembly in live U2OS cells by 2D single-particle tracking PALM, a variant of PALM allowing for the study of the assembly and disassembly dynamics of clusters with a size smaller than the resolution limit. Potential labeling artifacts were discarded by engineering a stable cell line expressing a Dendra2-fused catalytic subunit (RPB1), replacing the endogenous RPB1. Pair-correlation analysis83 identified clusters of ~220 nm, while time-correlated detection counting within individual high-density clusters revealed average lifetime of ~5.1 seconds, reflecting the transient nature of RNAP2 clustering. An analogous labeling strategy was used by Zhao et al,101 in which RPB1 was fused to a SNAP-tag and labeled with rhodamine dyes. Localization accuracy and efficiency were improved as STORM imaging was performed in a reflected light-sheet configuration, achieving optical sections of ~1 μm. Absolute numbers of RNAP2 molecules were determined through a novel spatiotemporal clustering analysis, which together with colocalization estimated that the majority (>70%) of detected foci are composed of single RNAP2 molecules. Quantitative SRM has thus brought arguments against a preassembled, stable organization of transcription sites in the nucleus.
Chromatin organization and dynamics
It is well established that gene regulation and cell fate determination depend on the spatial organization of DNA. Until recently, endogenous genome folding could only be addressed through genetic or biochemical methods103,104 since nuclear substructures are typically smaller than the resolution limit of conventional optical microscopes. From this perspective, SRM is well suited to provide physical maps of gene regulation processes at molecular resolution and reveal subnuclear structures in situ.
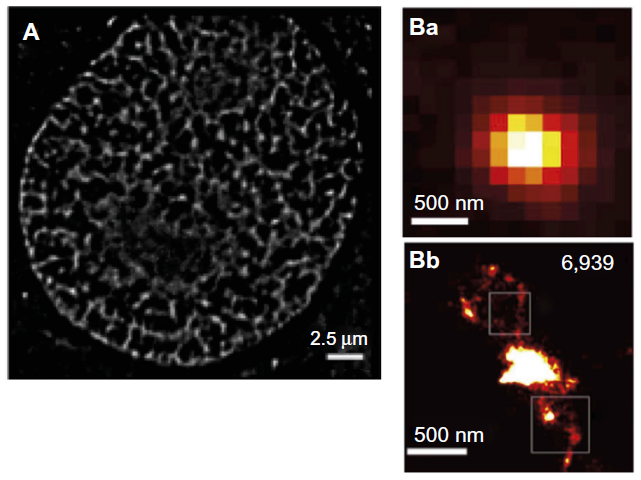
The genetic material in eukaryotes is packed within the nucleus in the form of a nucleoprotein complex termed chromatin. The structural unit of chromatin is the nucleosome, composed of an octamer of the highly conserved histone proteins (H2A, H2B, H3, and H4) and 1.65 turns of the DNA molecule. Hence, fluorescent tagging of chromatin can be performed by labeling the core histone proteins, or directly the DNA.105 The former implies the use of immunofluorescence or protein fusions as discussed before. For instance, dihydrofolate reductase and SNAP-tag fusions have been used for live cell STORM imaging of the histone H2B in mammalian cells, potentially allowing the study of chromatin dynamics in situ.88,89 The second strategy takes advantage of a large variety of intercalating dyes available for sequence-independent DNA labeling. Some of them display SMLM-compatible blinking characteristics and have been successfully used for STORM imaging, namely YOYO-1 in DNA extracts106,107 and more recently PicoGreen in live cells90 (Figure 3A). Furthermore, incorporation of modified nucleotides using the DNA replication machinery combined with Click chemistry fluorescent labeling was employed for the visualization of nascent DNA fragments in live HeLa cells with STORM.108 Another SMLM approach using the DNA-binding kinetics of intercalating dyes rather than blinking is binding-activated localization microscopy.109 Alternatively, DNA can be stained in a sequence-specific manner through the fluorescence in situ hybridization (FISH) assay. However, ultrastructural preservation is a major concern in FISH experiments, particularly at enhanced resolution. Adapted protocols have been designed for SIM110 and will likely be applicable to the higher resolution techniques STED and SMLM. Furthermore, a systematic evaluation of performance of the different histone or DNA-labeling strategies in SRM will allow the validation of the newly observed structural details of chromatin organization (Figure 3).
 | Figure 3 Chromatin labeling strategies for single-molecule localization microscopy. |
The global chromatin folding drastically changes throughout the cell cycle, from the ~500 nm thick and highly compacted chromosomes with characteristic shape in mitosis to the decondensed ~10 nm chromatin fiber in interphase. These orders of magnitude structural variations represent a specific challenge in superresolution experiments. In mitosis, the high density of DNA and histones is an obstacle to efficient labeling, and sample thickness deteriorates the signal to noise ratio due to out of focus light. Mitotic chromosome organization has been addressed both by 3D SIM and SMLM, and notable achievements have been reviewed elsewhere.111
Interphase chromatin, on the other hand, adopts a loose conformation heterogeneously spreading throughout the entire nuclear volume, resulting in low contrast in SIM and STED images or low localization event numbers in SMLM. Several groups have investigated chromatin heterogeneity and reorganization by labeling core histone proteins in mammalian cells under normal cell growth conditions, comparing differentiation states, and upon physiological stimuli. In an early study, Gunkel et al112 applied an SMLM variant, namely spectral precision distance microscopy (SPDM) in two colors to investigate nuclear distributions of mRFP1-fused H2A and the GFP-fused chromatin remodeler Snf2H in transiently transfected U2OS fixed cells. Counting the number of neighbors in a 300 nm radius showed nonrandom distributions for both factors, with nuclear regions depleted in H2A, sites of local enrichment of Snf2H, and a partial colocalization of the two proteins. Subsequently, a radial distribution function was calculated to quantitatively explore H2B–GFP localizations with 2D SPDM,113 uncovering chromatin nanostructures on a scale <100 nm. The authors introduced compressibility measures to compare large-scale structural fluctuations with polymer models, which indicated nonrandom chromatin distributions even on the micrometer range. Remarkably, significant differences of H2B distribution depended on the expression method, highlighting the crucial importance of proper fusion proteins targeting. Deeper investigation of H2B nonhomogeneity at the nanometric length scale in the nuclei of fixed U2OS cells was performed using 3D PALM.114 The Ripley K(r) statistics of H2B-Dendra2 indicated clusterization without specific size in the range of 10 nm to 1 μm, compatible with the fractal globule model proposed by chromosome conformation capture (Hi-C)115 and FISH studies,116 and supporting the idea that chromatin organization is influenced by interloci contacts. Live cell imaging of H2B-PAGFP further revealed that this organization is highly transient.114 More recently, secondary antibody immunostaining combined with 2D STORM was used to follow the endogenous H2B heterogeneity throughout differentiation in human and mouse cells.117 The super resolved images indicated that H2B is distributed in discrete nanodomains throughout the nucleus, and clustering analysis of raw detections confirmed the lack of a characteristic size of nucleosome-enriched domains. The number of histone molecules per nanodomain was extracted using a calibration curve of H2B localizations densities, which were measured in vitro for nucleosome arrays of known length. Nucleosome density and number correlated with the pluripotency grade, indicating that differentiation leads to an increase in domain compaction. Interestingly, computer simulations showed that the observed H2B heterogeneity can be explained by the incomplete nucleosome occupancy of the DNA fiber.
In addition to SMLM, other superresolution methods have been applied to investigate chromatin structure. The transient organization of chromatin was probed with STED in immunostained rat cardiomyocytes, where pixel intensity levels accounted for the local densities of molecules.118 Induction of hypertrophy, known to cause massive gene expression changes, resulted in multilevel redistribution of endogenous H3. Furthermore, SIM imaging of the β-globin locus with FISH in mouse erythroid cells allowed for following of chromatin folding dynamics in opposing transcriptional states.119 Size and shape analysis revealed that inactive chromatin explores a wide range of conformations, while gene activation resulted in the FISH spot condensation.
Overall, whole-genome labeling methods combined with SMLM have provided a glimpse at the complexity in chromatin organization. However, two main drawbacks currently make interpretation of images difficult and functional studies complicated. The first is the lack of genomic specificity, and the second is the common appearance in the observed structures of collections of protein clusters displaying no clear continuity. Recently, a new approach based on Oligopaint technologies provided one possible solution to these issues. In this method, thousands of short, fluorescently labeled oligonucleotides are used to produce a FISH probe that covers large genomic regions.120 The application of this method to visualize topological domains has produced impressive superresolution reconstructions of the Bithorax Complex domain in Drosophila (Figure 3B).121
Conclusion and prospects
Superresolution fluorescence imaging allows visualization of cellular components in the range of 10–200 nm, so far unexplored by diffraction-limited fluorescence microscopies. The optical configurations and analysis methods have undergone significant development over the last few years. However, several important obstacles need to be circumvented for superresolution microscopies to become widespread.
Superresolution microscopies are typically more difficult to implement than conventional microscopies, and their results more difficult to assess. Several important controls have to be performed in the quality of acquisition and analysis in order to ensure an accurate reconstruction. These are usually performed by custom-made software packages. Unfortunately, few tools currently exist that allow for quality controls, and these are often not available to the community. Ideally, future software developments should be made in a common, open-source platform easy to port, validate, and improve. In this respect, much is to be learned from software development paradigms used by other communities (ie, CCP4 package for crystallography).
Conventional microscopy can be performed in multicolor due to the large panel of organic and genetically encoded fluorescent probes available. This is currently not the case for SRM, which is in practice limited to at most two colors or less for live applications on real biological systems. In part, this limitation is due to a general lack of adapted fluorophores. Hopefully, future developments will improve our choice of available dyes. The careful study of dye photophysics will likely improve our ability to rationally engineer better dyes and devise new acquisition and analysis modes, as well as help characterize novel fluorophores found by screening methods.
Finally, an important limitation of current SRM relies on their poor performance in thick specimens (eg, embryos, tissues). This limitation is due to the increase in aberrations with the distance to the objective as well as to the diffusion of light through highly inhomogeneous media. Recent developments using selective plane illumination, adaptive optics, and multifocus microscopy will likely be key to alleviate, at least in part, these important current hurdles.122–124
Acknowledgments
This research was supported by funding from the European Research Council (ERC) under the 7th Framework Program (FP7) (FP7/2007-2013) to MN (smINSULATOR, ERC grant agreement 260787).
Disclosure
The authors report no conflicts of interest in this work.
References
Abbe E. Beiträge zur Theorie des Mikroskops und der mikroskopischen Wahrnehmung [Contributions to the theory of the microscope and microscopic perception]. Arch Für Mikrosk Anat. 1873;9(1):413–418. German. | |
Lord Rayleigh. On the theory of optical images, with special reference to the microscope. Philos Mag Ser 5. 1896;42(255):167–195. | |
Schermelleh L, Heintzmann R, Leonhardt H. A guide to super-resolution fluorescence microscopy. J Cell Biol. 2010;190(2):165–175. | |
Cox S. Super-resolution imaging in live cells. Dev Biol. 2015;401(1):175–181. | |
Habuchi S. Super-resolution molecular and functional imaging of nanoscale architectures in life and materials science. Front Bioeng Biotechnol. 2014;2:20. | |
Fornasiero EF, Opazo F. Super-resolution imaging for cell biologists. BioEssays. 2015;37(4):436–451. | |
Müller T, Schumann C, Kraegeloh A. STED microscopy and its applications: new insights into cellular processes on the nanoscale. Chem Phys Chem. 2012;13(8):1986–2000. | |
Neupane B, Ligler FS, Wang G. Review of recent developments in stimulated emission depletion microscopy: applications on cell imaging. J Biomed Opt. 2014;19(8):080901. | |
Allen JR, Ross ST, Davidson MW. Structured illumination microscopy for superresolution. Chem Phys Chem. 2014;15(4):566–576. | |
Patterson G, Davidson M, Manley S, Lippincott-Schwartz J. Superresolution imaging using single-molecule localization. Annu Rev Phys Chem. 2010;61(1):345–367. | |
Manley S, Gunzenhäuser J, Olivier N. A starter kit for point-localization super-resolution imaging. Curr Opin Chem Biol. 2011;15(6):813–821. | |
Sengupta P, Van Engelenburg S, Lippincott-Schwartz J. Visualizing cell structure and function with point-localization superresolution imaging. Dev Cell. 2012;23(6):1092–1102. | |
Sauer M. Localization microscopy coming of age: from concepts to biological impact. J Cell Sci. 2013;126(16):3505–3513. | |
Hell SW, Wichmann J. Breaking the diffraction resolution limit by stimulated emission: stimulated-emission-depletion fluorescence microscopy. Opt Lett. 1994;19(11):780–782. | |
Klar TA, Jakobs S, Dyba M, Egner A, Hell SW. Fluorescence microscopy with diffraction resolution barrier broken by stimulated emission. Proc Natl Acad Sci U S A. 2000;97(15):8206–8210. | |
Göttfert F, Wurm CA, Mueller V, et al. Coaligned dual-channel STED nanoscopy and molecular diffusion analysis at 20 nm resolution. Biophys J. 2013;105(1):L01–L03. | |
Klar TA, Hell SW. Subdiffraction resolution in far-field fluorescence microscopy. Opt Lett. 1999;24(14):954–956. | |
Vicidomini G, Moneron G, Han KY, et al. Sharper low-power STED nanoscopy by time gating. Nat Methods. 2011;8(7):571–573. | |
Moffitt JR, Osseforth C, Michaelis J. Time-gating improves the spatial resolution of STED microscopy. Opt Express. 2011;19(5):4242–4254. | |
Willig KI, Harke B, Medda R, Hell SW. STED microscopy with continuous wave beams. Nat Methods. 2007;4(11):915–918. | |
Moneron G, Hell SW. Two-photon excitation STED microscopy. Opt Express. 2009;17(17):14567–14573. | |
Ding JB, Takasaki KT, Sabatini BL. Supraresolution imaging in brain slices using stimulated-emission depletion two-photon laser scanning microscopy. Neuron. 2009;63(4):429–437. | |
Takasaki KT, Ding JB, Sabatini BL. Live-cell superresolution imaging by pulsed STED two-photon excitation microscopy. Biophys J. 2013;104(4):770–777. | |
Neupane B, Chen F, Sun W, Chiu DT, Wang G. Tuning donut profile for spatial resolution in stimulated emission depletion microscopy. Rev Sci Instrum. 2013;84(4):043701. | |
Gould TJ, Myers JR, Bewersdorf J. Total internal reflection STED microscopy. Opt Express. 2011;19(14):13351–13357. | |
Leutenegger M, Ringemann C, Lasser T, Hell SW, Eggeling C. Fluorescence correlation spectroscopy with a total internal reflection fluorescence STED microscope (TIRF-STED-FCS). Opt Express. 2012; 20(5):5243–5263. | |
Gugel H, Bewersdorf J, Jakobs S, Engelhardt J, Storz R, Hell SW. Cooperative 4Pi excitation and detection yields sevenfold sharper optical sections in live-cell microscopy. Biophys J. 2004;87(6):4146–4152. | |
Schmidt R, Wurm CA, Jakobs S, Engelhardt J, Egner A, Hell SW. Spherical nanosized focal spot unravels the interior of cells. Nat Methods. 2008;5(6):539–544. | |
Donnert G, Keller J, Wurm CA, et al. Two-color far-field fluorescence nanoscopy. Biophys J. 2007;92(8):L67–L69. | |
Meyer L, Wildanger D, Medda R, et al. Dual-color STED microscopy at 30-nm focal-plane resolution. Small. 2008;4(8):1095–1100. | |
Bückers J, Wildanger D, Vicidomini G, Kastrup L, Hell SW. Simultaneous multi-lifetime multi-color STED imaging for colocalization analyses. Opt Express. 2011;19(4):3130–3143. | |
Pellett PA, Sun X, Gould TJ, et al. Two-color STED microscopy in living cells. Biomed Opt Express. 2011;2(8):2364–2371. | |
Willig KI, Stiel AC, Brakemann T, Jakobs S, Hell SW. Dual-label STED nanoscopy of living cells using photochromism. Nano Lett. 2011;11(9):3970–3973. | |
Tønnesen J, Nadrigny F, Willig KI, Wedlich-Söldner R, Nägerl UV. Two-color STED microscopy of living synapses using a single laser-beam pair. Biophys J. 2011;101(10):2545–2552. | |
Gustafsson MG. Surpassing the lateral resolution limit by a factor of two using structured illumination microscopy. J Microsc. 2000;198(2):82–87. | |
Gustafsson MG, Shao L, Carlton PM, et al. Three-dimensional resolution doubling in wide-field fluorescence microscopy by structured illumination. Biophys J. 2008;94(12):4957–4970. | |
Heintzmann R, Jovin TM, Cremer C. Saturated patterned excitation microscopy – a concept for optical resolution improvement. J Opt Soc Am A Opt Image Sci Vis. 2002;19(8):1599–1609. | |
Gustafsson MG. Nonlinear structured-illumination microscopy: wide-field fluorescence imaging with theoretically unlimited resolution. Proc Natl Acad Sci U S A. 2005;102(37):13081–13086. | |
Rego EH, Shao L, Macklin JJ, et al. Nonlinear structured-illumination microscopy with a photoswitchable protein reveals cellular structures at 50-nm resolution. Proc Natl Acad Sci U S A. 2012;109(3):E135–E143. | |
Schermelleh L, Carlton PM, Haase S, et al. Subdiffraction multicolor imaging of the nuclear periphery with 3d structured illumination microscopy. Science. 2008;320(5881):1332–1336. | |
Betzig E, Patterson GH, Sougrat R, et al. Imaging intracellular fluorescent proteins at nanometer resolution. Science. 2006;313(5793):1642–1645. | |
Hess ST, Girirajan TP, Mason MD. Ultra-high resolution imaging by fluorescence photoactivation localization microscopy. Biophys J. 2006;91(11):4258–4272. | |
Rust MJ, Bates M, Zhuang X. Sub-diffraction-limit imaging by stochastic optical reconstruction microscopy (STORM). Nat Methods. 2006;3(10):793–796. | |
Heilemann M, van de Linde S, Schüttpelz M, et al. Subdiffraction-resolution fluorescence imaging with conventional fluorescent probes. Angew Chem Int Ed Engl. 2008;47(33):6172–6176. | |
Thompson RE, Larson DR, Webb WW. Precise nanometer localization analysis for individual fluorescent probes. Biophys J. 2002;82(5):2775–2783. | |
Heilemann M, Margeat E, Kasper R, Sauer M, Tinnefeld P. Carbocyanine dyes as efficient reversible single-molecule optical switch. J Am Chem Soc. 2005;127(11):3801–3806. | |
Dempsey GT, Bates M, Kowtoniuk WE, Liu DR, Tsien RY, Zhuang X. Photoswitching mechanism of cyanine dyes. J Am Chem Soc. 2009; 131(51):18192–18193. | |
Zhou XX, Lin MZ. Photoswitchable fluorescent proteins: ten years of colorful chemistry and exciting applications. Curr Opin Chem Biol. 2013;17(4):682–690. | |
Van de Linde S, Wolter S, Heilemann M, Sauer M. The effect of photoswitching kinetics and labeling densities on super-resolution fluorescence imaging. J Biotechnol. 2010;149(4):260–266. | |
Nieuwenhuizen RP, Lidke KA, Bates M, et al. Measuring image resolution in optical nanoscopy. Nat Methods. 2013;10(6):557–562. | |
Wang Y, Schnitzbauer J, Hu Z, et al. Localization events-based sample drift correction for localization microscopy with redundant cross-correlation algorithm. Opt Express. 2014;22(13):15982–15991. | |
Von Middendorff C, Egner A, Geisler C, Hell SW, Schönle A. Isotropic 3D Nanoscopy based on single emitter switching. Opt Express. 2008;16(25):20774–20788. | |
Ram S, Prabhat P, Chao J, Ward ES, Ober RJ. High accuracy 3D quantum dot tracking with multifocal plane microscopy for the study of fast intracellular dynamics in live cells. Biophys J. 2008;95(12):6025–6043. | |
Huang B, Wang W, Bates M, Zhuang X. Three-dimensional super-resolution imaging by stochastic optical reconstruction microscopy. Science. 2008;319(5864):810–813. | |
Izeddin I, El Beheiry M, Andilla J, Ciepielewski D, Darzacq X, Dahan M. PSF shaping using adaptive optics for three-dimensional single-molecule super-resolution imaging and tracking. Opt Express. 2012;20(5):4957. | |
Pavani SR, Thompson MA, Biteen JS, et al. Three-dimensional, single-molecule fluorescence imaging beyond the diffraction limit by using a double-helix point spread function. Proc Natl Acad Sci U S A. 2009;106(9):2995–2999. | |
Jia S, Vaughan JC, Zhuang X. Isotropic 3D super-resolution imaging with a self-bending point spread function. Nat Photonics. 2014;8:302–306. | |
Hajj B, Beheiry ME, Izeddin I, Darzacq X, Dahan M. Accessing the third dimension in localization-based super-resolution microscopy. Phys Chem Chem Phys. 2014;16(31):16340–16348. | |
York AG, Ghitani A, Vaziri A, Davidson MW, Shroff H. Confined activation and subdiffractive localization enables whole-cell PALM with genetically expressed probes. Nat Methods. 2011;8(4):327–333. | |
Cella Zanacchi F, Lavagnino Z, Perrone Donnorso M, et al. Live-cell 3D super-resolution imaging in thick biological samples. Nat Methods. 2011;8(12):1047–1049. | |
Hu YS, Zimmerley M, Li Y, Watters R, Cang H. Single-molecule super-resolution light-sheet microscopy. Chem Phys Chem. 2014; 15(4):577–586. | |
Dempsey GT, Vaughan JC, Chen KH, Bates M, Zhuang X. Evaluation of fluorophores for optimal performance in localization-based super-resolution imaging. Nat Methods. 2011;8(12):1027–1036. | |
Chozinski TJ, Gagnon LA, Vaughan JC. Twinkle, twinkle little star: photoswitchable fluorophores for super-resolution imaging. FEBS Lett. 2014;588(19):3603–3612. | |
Shcherbakova DM, Sengupta P, Lippincott-Schwartz J, Verkhusha VV. Photocontrollable fluorescent proteins for superresolution imaging. Annu Rev Biophys. 2014;43(1):303–329. | |
Bates M, Huang B, Dempsey GT, Zhuang X. Multicolor super-resolution imaging with photo-switchable fluorescent probes. Science. 2007;317(5845):1749–1753. | |
Shroff H, Galbraith CG, Galbraith JA, et al. Dual-color superresolution imaging of genetically expressed probes within individual adhesion complexes. Proc Natl Acad Sci U S A. 2007;104(51):20308–20313. | |
Subach FV, Patterson GH, Manley S, Gillette JM, Lippincott-Schwartz J, Verkhusha VV. Photoactivatable mCherry for high-resolution two-color fluorescence microscopy. Nat Methods. 2009;6(2):153–159. | |
Klein T, van de Linde S, Sauer M. Live-cell super-resolution imaging goes multicolor. ChemBioChem. 2012;13(13):1861–1863. | |
Xu K, Zhong G, Zhuang X. Actin, spectrin, and associated proteins form a periodic cytoskeletal structure in axons. Science. 2013;339(6118):452–456. | |
Stephens DJ, Allan VJ. Light microscopy techniques for live cell imaging. Science. 2003;300(5616):82–86. | |
Westphal V, Rizzoli SO, Lauterbach MA, Kamin D, Jahn R, Hell SW. Video-rate far-field optical nanoscopy dissects synaptic vesicle movement. Science. 2008;320(5873):246–249. | |
Hofmann M, Eggeling C, Jakobs S, Hell SW. Breaking the diffraction barrier in fluorescence microscopy at low light intensities by using reversibly photoswitchable proteins. Proc Natl Acad Sci U S A. 2005;102(49):17565–17569. | |
Chmyrov A, Keller J, Grotjohann T, et al. Nanoscopy with more than 100,000 “doughnuts.” Nat Methods. 2013;10(8):737–740. | |
Holden SJ, Uphoff S, Kapanidis AN. DAOSTORM: an algorithm for high-density super-resolution microscopy. Nat Methods. 2011;8(4):279–280. | |
Zhu L, Zhang W, Elnatan D, Huang B. Faster STORM using compressed sensing. Nat Methods. 2012;9(7):721–723. | |
Huang F, Hartwich TMP, Rivera-Molina FE, et al. Video-rate nanoscopy using sCMOS camera-specific single-molecule localization algorithms. Nat Methods. 2013;10(7):653–658. | |
Lakadamyali M. Super-resolution microscopy: going live and going fast. Chem Phys Chem. 2014;15(4):630–636. | |
Gautier A, Juillerat A, Heinis C, et al. An engineered protein tag for multiprotein labeling in living cells. Chem Biol. 2008;15(2):128–136. | |
Specht CG, Izeddin I, Rodriguez PC, et al. Quantitative nanoscopy of inhibitory synapses: counting gephyrin molecules and receptor binding sites. Neuron. 2013;79(2):308–321. | |
Ries J, Kaplan C, Platonova E, Eghlidi H, Ewers H. A simple, versatile method for GFP-based super-resolution microscopy via nanobodies. Nat Methods. 2012;9(6):582–584. | |
Whelan DR, Bell TD. Image artifacts in single molecule localization microscopy: why optimization of sample preparation protocols matters. Sci Rep. 2015;5:7924. | |
Annibale P, Vanni S, Scarselli M, Rothlisberger U, Radenovic A. Quantitative photo activated localization microscopy: unraveling the effects of photoblinking. PLoS One. 2011;6(7):e22678. | |
Sengupta P, Jovanovic-Talisman T, Skoko D, Renz M, Veatch SL, Lippincott-Schwartz J. Probing protein heterogeneity in the plasma membrane using PALM and pair correlation analysis. Nat Methods. 2011;8(11):969–975. | |
Veatch SL, Machta BB, Shelby SA, Chiang EN, Holowka DA, Baird BA. Correlation functions quantify super-resolution images and estimate apparent clustering due to over-counting. PLoS One. 2012;7(2):e31457. | |
Puchner EM, Walter JM, Kasper R, Huang B, Lim WA. Counting molecules in single organelles with superresolution microscopy allows tracking of the endosome maturation trajectory. Proc Natl Acad Sci U S A. 2013;110(40):16015–16020. | |
Durisic N, Cuervo LL, Lakadamyali M. Quantitative super-resolution microscopy: pitfalls and strategies for image analysis. Curr Opin Chem Biol. 2014;20:22–28. | |
Shivanandan A, Deschout H, Scarselli M, Radenovic A. Challenges in quantitative single molecule localization microscopy. FEBS Lett. 2014;588(19):3595–3602. | |
Wombacher R, Heidbreder M, van de Linde S, et al. Live-cell super-resolution imaging with trimethoprim conjugates. Nat Methods. 2010;7(9):717–719. | |
Klein T, Löschberger A, Proppert S, Wolter S, van de Linde S, Sauer M. Live-cell dSTORM with SNAP-tag fusion proteins. Nat Methods. 2011;8(1):7–9. | |
Benke A, Manley S. Live-Cell dSTORM of cellular DNA based on direct DNA labeling. ChemBioChem. 2012;13(2):298–301. | |
Carlini L, Manley S. Live intracellular super-resolution imaging using site-specific stains. ACS Chem Biol. 2013;8(12):2643–2648. | |
Lukinavicius G, Umezawa K, Olivier N, et al. A near-infrared fluorophore for live-cell super-resolution microscopy of cellular proteins. Nat Chem. 2013;5(2):132–139. | |
Carlini L, Benke A, Reymond L, Lukinavicius G, Manley S. Reduced dyes enhance single-molecule localization density for live superresolution imaging. Chem Phys Chem. 2014;15(4):750–755. | |
Wang S, Moffitt JR, Dempsey GT, Xie XS, Zhuang X. Characterization and development of photoactivatable fluorescent proteins for single-molecule–based superresolution imaging. Proc Natl Acad Sci U S A. 2014;111(23):8452–8457. | |
Jensen NA, Danzl JG, Willig KI, et al. Coordinate-targeted and coordinate-stochastic super-resolution microscopy with the reversibly switchable fluorescent protein Dreiklang. Chem Phys Chem. 2014;15(4):756–762. | |
McEvoy AL, Hoi H, Bates M, et al. mMaple: a photoconvertible fluorescent protein for use in multiple imaging modalities. PLoS One. 2012;7(12):e51314. | |
Scarselli M, Annibale P, Radenovic A. Cell type-specific β2-adrenergic receptor clusters identified using photoactivated localization microscopy are not lipid raft related, but depend on actin cytoskeleton integrity. J Biol Chem. 2012;287(20):16768–16780. | |
Pageon SV, Cordoba S-P, Owen DM, Rothery SM, Oszmiana A, Davis DM. Superresolution microscopy reveals nanometer-scale reorganization of inhibitory natural killer cell receptors upon activation of NKG2D. Sci Signal. 2013;6(285):ra62. | |
Izeddin I, Récamier V, Bosanac L, et al. Single-molecule tracking in live cells reveals distinct target-search strategies of transcription factors in the nucleus. ELife. 2014;3:02230. | |
Cisse II, Izeddin I, Causse SZ, et al. Real-time dynamics of RNA polymerase II clustering in live human cells. Science. 2013;341(6146):664–667. | |
Zhao ZW, Roy R, Gebhardt JC, Suter DM, Chapman AR, Xie XS. Spatial organization of RNA polymerase II inside a mammalian cell nucleus revealed by reflected light-sheet superresolution microscopy. Proc Natl Acad Sci U S A. 2014;111(2):681–686. | |
Papantonis A, Cook PR. Transcription factories: genome organization and gene regulation. Chem Rev. 2013;113(11):8683–8705. | |
Dekker J, Marti-Renom MA, Mirny LA. Exploring the three-dimensional organization of genomes: interpreting chromatin interaction data. Nat Rev Genet. 2013;14(6):390–403. | |
Sexton T, Cavalli G. The role of chromosome domains in shaping the functional genome. Cell. 2015;160(6):1049–1059. | |
Flors C. DNA and chromatin imaging with super-resolution fluorescence microscopy based on single-molecule localization. Biopolymers. 2011;95(5):290–297. | |
Flors C, Ravarani CN, Dryden DTF. Super-Resolution Imaging of DNA Labelled with Intercalating Dyes. Chem Phys Chem. 2009;10(13):2201–2204. | |
Flors C. Photoswitching of monomeric and dimeric DNA-intercalating cyanine dyes for super-resolution microscopy applications. Photochem Photobiol Sci. 2010;9(5):643–648. | |
Zessin PJ, Finan K, Heilemann M. Super-resolution fluorescence imaging of chromosomal DNA. J Struct Biol. 2012;177(2):344–348. | |
Schoen I, Ries J, Klotzsch E, Ewers H, Vogel V. Binding-activated localization microscopy of DNA structures. Nano Lett. 2011;11(9):4008–4011. | |
Markaki Y, Smeets D, Fiedler S, et al. The potential of 3D-FISH and super-resolution structured illumination microscopy for studies of 3D nuclear architecture. BioEssays. 2012;34(5):412–426. | |
Flors C, Earnshaw WC. Super-resolution fluorescence microscopy as a tool to study the nanoscale organization of chromosomes. Curr Opin Chem Biol. 2011;15(6):838–844. | |
Gunkel M, Erdel F, Rippe K, et al. Dual color localization microscopy of cellular nanostructures. Biotechnol J. 2009;4(6):927–938. | |
Bohn M, Diesinger P, Kaufmann R, et al. Localization microscopy reveals expression-dependent parameters of chromatin nanostructure. Biophys J. 2010;99(5):1358–1367. | |
Récamier V, Izeddin I, Bosanac L, Dahan M, Proux F, Darzacq X. Single cell correlation fractal dimension of chromatin. Nucleus. 2014; 5(1):75–84. | |
Lieberman-Aiden E, van Berkum NL, Williams L, et al. Comprehensive mapping of long-range interactions reveals folding principles of the human genome. Science. 2009;326(5950):289–293. | |
Sachs RK, van den Engh G, Trask B, Yokota H, Hearst JE. A random-walk/giant-loop model for interphase chromosomes. Proc Natl Acad Sci U S A. 1995;92(7):2710–2714. | |
Ricci MA, Manzo C, García-Parajo MF, Lakadamyali M, Cosma MP. Chromatin fibers are formed by heterogeneous groups of nucleosomes in vivo. Cell. 2015;160(6):1145–1158. | |
Mitchell-Jordan S, Chen H, Franklin S, Stefani E, Bentolila LA, Vondriska TM. Features of endogenous cardiomyocyte chromatin revealed by super-resolution STED microscopy. J Mol Cell Cardiol. 2012;53(4):552–558. | |
van de Corput MP, de Boer E, Knoch TA, et al. Super-resolution imaging reveals three-dimensional folding dynamics of the β-globin locus upon gene activation. J Cell Sci. 2012;125(19):4630–4639. | |
Beliveau BJ, Joyce EF, Apostolopoulos N, et al. Versatile design and synthesis platform for visualizing genomes with Oligopaint FISH probes. Proc Natl Acad Sci U S A. 2012;109(52):21301–21306. | |
Beliveau BJ, Boettiger AN, Avendaño MS, et al. Single-molecule super-resolution imaging of chromosomes and in situ haplotype visualization using Oligopaint FISH probes. Nat Commun. 2015;6:7147. | |
Galland R, Grenci G, Aravind A, Viasnoff V, Studer V, Sibarita J-B. 3D high- and super-resolution imaging using single-objective SPIM. Nat Methods. 2015;12(7):641–644. | |
Hajj B, Wisniewski J, El Beheiry M, et al. Whole-cell, multicolor superresolution imaging using volumetric multifocus microscopy. Proc Natl Acad Sci U S A. 2014;111(49):17480–17485. | |
Chen B-C, Legant WR, Wang K, et al. Lattice light-sheet microscopy: Imaging molecules to embryos at high spatiotemporal resolution. Science. 2014;346(6208):1257998. |
 © 2015 The Author(s). This work is published and licensed by Dove Medical Press Limited. The
full terms of this license are available at https://www.dovepress.com/terms
and incorporate the Creative Commons Attribution
- Non Commercial (unported, 3.0) License.
By accessing the work you hereby accept the Terms. Non-commercial uses of the work are permitted
without any further permission from Dove Medical Press Limited, provided the work is properly
attributed. For permission for commercial use of this work, please see paragraphs 4.2 and 5 of our Terms.
© 2015 The Author(s). This work is published and licensed by Dove Medical Press Limited. The
full terms of this license are available at https://www.dovepress.com/terms
and incorporate the Creative Commons Attribution
- Non Commercial (unported, 3.0) License.
By accessing the work you hereby accept the Terms. Non-commercial uses of the work are permitted
without any further permission from Dove Medical Press Limited, provided the work is properly
attributed. For permission for commercial use of this work, please see paragraphs 4.2 and 5 of our Terms.