Back to Journals » Drug Design, Development and Therapy » Volume 15
Superhydrophobic Surface for Enhancing the Bioavailability of Salbutamol Sulfate from Cross-Linked Microspheres: Formulation, Characterization, and in vivo Evaluation
Authors Gaber D, Abdoun S, Alfuraihy A, Altasan B, Alsubaiyel A
Received 13 March 2021
Accepted for publication 17 June 2021
Published 2 July 2021 Volume 2021:15 Pages 2869—2884
DOI https://doi.org/10.2147/DDDT.S309078
Checked for plagiarism Yes
Review by Single anonymous peer review
Peer reviewer comments 2
Editor who approved publication: Professor Manfred Ogris
Dalia Gaber,1 Siham Abdoun,1 Ameerah Alfuraihy,2 Bushra Altasan,2 Amal Alsubaiyel1
1Department of Pharmaceutics, College of Pharmacy, Al- Qassim University, Buraidah, Kingdom of Saudi Arabia; 2College of Pharmacy, Al- Qassim University, Buraidah, Kingdom of Saudi Arabia
Correspondence: Dalia Gaber Email [email protected]
Introduction: The aim of the work was to formulate salbutamol sulfate (SB) microspheres by using superhydrophobic surface (SHS) under different processing factors for improving its encapsulation efficiency, controling its release rate, and hence enhancing its bioavailability.
Methods: Cross-linked microspheres of chitosan (CN) and carrageenan (KN) were made on a SHS under a glutaraldehyde-saturated atmosphere. The formulations were designed and optimized based on 42 factorial design. Percentage encapsulation efficiency (%EE), particle size, swelling ratio, and in vitro release rate were characterized, and the in vivo performance of optimized formula was investigated in beagle dogs.
Results: The results showed that the prepared microspheres have a high %EE (97.11± 0.78%) for F13. The swelling ratio was 4.2 at the end of the 8 hours for the optimized formula, and the in vitro release rate was controlled for 12 hours. In vivo study verified that there was a 1.61-fold enhancement in SB bioavailability from optimized formula (F13) compared to market tablet.
Conclusion: The study suggested that microspheres prepared from CN/KN crosslinking on an SHS using glutaraldehyde atmosphere is a promising technique that can encapsulate and sustain the release of water-soluble drugs such as SB in addition to improving its in vivo pharmacokinetic profile.
Keywords: cross-linked complex, water-soluble drugs, salbutamol sulfate, sustain release, bioavailability, microspheres, superhydrophobic
Introduction
Recent studies in dosage form formulation and design are focused on developing delivery systems able to enhance therapeutic benefits while minimizing drug side effects.1,2 Multi-particulate systems are able to control the release from oral formulations with a lower risk of dose dumping and a higher ability to achieve different release patterns compared with single-unit systems.3–5 Many challenges face the multi-particulate systems in the industry, including the low encapsulation efficiency, the use of organic or toxic solvents, the need for high temperature, in addition to many difficulties in removing the solvents.6–8
A lot of work has been done to encapsulate hydrophilic drugs with minimum drug loss.6 Rapid diffusion from the systems to the external solvent phase was the main challenge in formulating such drugs.9,10 To overcome this challenge, many trials were done based on changing the external phase media, changing the media pH, altering the media viscosity, and the addition of high concentrations of electrolyte to minimize the drug escape to the outer media.11–13 Using glutaraldehyde-saturated atmosphere for hardening the multi-particulate systems was introduced as an alternative to an external liquid phase to reduce the drug loss to the outer liquid media.9,14 Ultra-hydrophobic surfaces with low surface free energy and high water repellency were introduced in many life applications due to their ease of preparation and cleaning in addition to their non-polluting properties.9,15 Many drugs have been successfully encapsulated using ultra-hydrophobic surfaces, for example, 5-fluorouracil has been encapsulated into pectin/chitosan microspheres using polystyrene superhydrophobic surfaces.16 Theophylline also has been encapsulated with high %EE in alginate beads on a treated polystyrene superhydrophobic surface.17 In addition, dextran- methacrylated beads were formulated on hydrophobic surfaces to encapsulate bioactive substances.18 Although ultra-hydrophobic rough surfaces were used in the encapsulation of many hydrophilic drugs, and results revealed an accepted encapsulation efficiency, more studies are still needed to achieve the optimal formulation conditions.7 Hydrogels have been widely used in the preparation of sustained-release systems due to their non-toxic properties, biodegradability, and biocompatibility.19 One of the most widely used hydrogels in the pharmaceutical industry is chitosan (CN).20 CN (Figure 1A) is an N-deacetylate derivative of chitin polysaccharide, which can adsorb water and swell, therefore controlling the diffusion of drugs.21 Also, CN has a gentle behavior, and hence it helps to decrease the irritant effect of drugs on the stomach.22 CN was used with anionic polymers such as carbopol, eudragit, carrageenan, and sodium alginate in the preparation of polyelectrolyte complex (PEC) multiparticulate systems (eg, beads and microspheres) that could enhance the controlled properties of CN.23
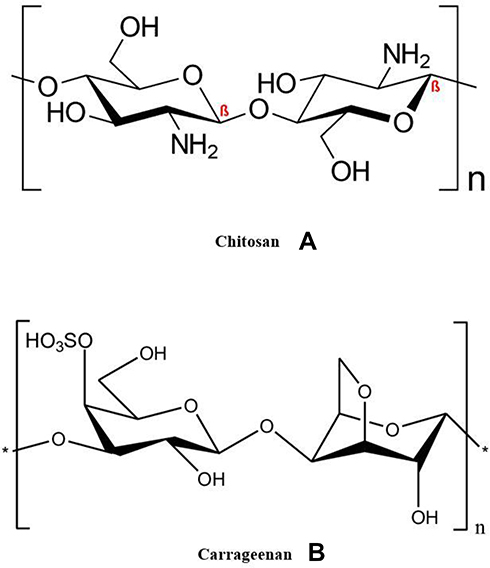 |
Figure 1 (A) Chemical structure of chitosan (CN), (B) chemical structure of carrageenan (KN). |
Carrageenan (Figure 1B, KN) is an anionic polymer extracted from marine red algae. It is composed of linear heteropolysaccharides with ester-sulfate groups.24 The main chain consists of alternative units of (1, 4-α and 1, 3-β-D-galactopyranose and 3,6-anhydrous-D-galactopyranose).24 KN has acknowledged viscosity and gelling properties that make it a good candidate in many sustained-release systems.25 PEC of CN/KN loaded with theophylline showed zero-order release kinetics as reported by Tomida et al.17
Salbutamol sulfate (SB, Figure 2) was selected as a model of a water-soluble drug.26 It is one of the sympathomimetic drugs that is used as a bronchodilator to treat asthma, bronchitis, and emphysema.26 Plasma half-life of SB is 2 to 4 hours, so it should be given three to four times per day, which increases dose-related side effects and reduces patient compliance.27 Short biological half-life and small oral dose (4 mg) of SB make it a good candidate for sustained-release formulations.27,28
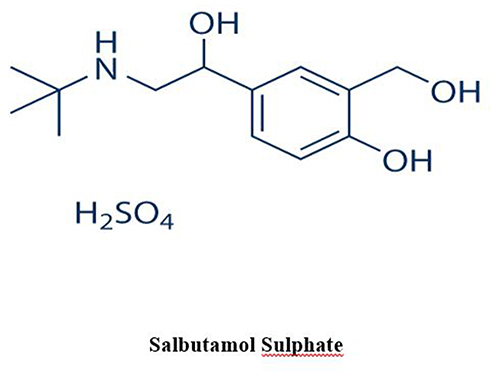 |
Figure 2 Chemical structure of salbutamol sulfate (SB). |
The following study aimed to control the release of SB and hence improve its pharmacokinetic profile via using superhydrophobic substrates. The superhydrophobic surface was fabricated from carnauba wax. Microspheres were formulated by complexing CN and KN polymer, and glutaraldehyde atmosphere was used for hardening of formed microspheres. Different processing parameters based on 42 full factorial design, namely SB-to-chitosan ratio, diameter of dropping needle, dropping distance, and duration of crosslinking, were studied. Finally, an in vivo study in beagle dogs was performed for the optimized formula. The pharmacokinetic (PK) results were then compared with market tablets.
Materials and Methods
Materials
Salbutamol sulfate (SB) was a kind gift from Alexandria Company for Pharmaceuticals and Chemical Industries (AXPH, Egypt). Hydrophobic Carnauba Spray Wax® spray 53,139 (Liverpool, UK), chitosan (CN) high molecular weight (310–375 kDa) was purchased from Sigma-Aldrich Inc. Al. (St. Louis, MO, USA). Carrageenan (Kappa) (KN) was purchased from Special Ingredients (Chesterfield, UK). Glutaraldehyde solution (50% v/v), glacial acetic acid, talc, and magnesium stearate were purchased from El-Nasr pharmaceutical and chemicals company (Cairo, Egypt). All other reagents and solvents used were of analytical grade and used as received. Glass slides (50 mm × 50 mm × 3 mm) were used for the preparation of superhydrophobic surface.
Preparation and Evaluation of Superhydrophobic Surface
Superhydrophobic surface (SHS) was prepared by spraying Carnauba Wax® on clean, dry glass slides. Briefly, three thin layers of the hydrophobic base were sprayed with 30-minute breaks between each spray. After complete drying of the last layer, other three-coat layers were sprayed with 5-minute intervals to increase the strength and roughness of the hydrophobic surface, and then the glass slides were left to dry in a fuming hood for 1 hour at 25°C before use.29 The SHS was examined for its roughness by scanning electron microscopy and static contact angles test (CA). CA was performed by dropping 10 µL of water, CN, SB/CN dispersion (1:1), and SB/CN/KN dispersion (1:1:1) above an untreated surface and the treated hydrophobic glass surface to compare the results, and the contact angle was measured using contact angle meter Drop Shape Analyzer – DSA100 with ADVANCE software (KRÜSS GmbH Co., Hamburg, Germany). In addition, sliding angles (SA) for each of the above-mentioned liquids were identified by slowly tilting the hydrophobic glass slide until the studied liquid droplet begins to move. The mean values of three measurements were recorded.9 Cassie and Baxter’s equation was used to calculate the fraction of the air in contact with the liquid droplet as follows:10
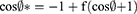
Where  and
and  are the CA of the liquid droplet on the treated surface and untreated surface, respectively; f expresses the fraction of solid surface in contact with the liquid droplet, and hence (1-f) states the fraction of the trapped air beneath the liquid droplet.
Preparation of SB-Loaded CN/KN Microspheres
The study was designed based on 42 full factorial design. The process estimated the impact of drug-to-polymer ratio, dropper tip inner size, dropping distance, and duration of crosslinking on the characteristics of the prepared microspheres (Table 1), whereas the encapsulation efficiency and the rate of drug release from the microspheres were taken as an index. Briefly, 3.5 g of KN were dispersed in a 100 mL acetic acid solution (1% v/v), and weighted amounts of SB and CN according to the design displayed in Table 1 were added to KN solution and stirred using a magnetic stirrer at 1000 rpm until complete homogenization of the mixture. Droplets from each mixture according to the formulations scheme were dropped through a syringe on the pre-prepared SHS. The SHS slides were then quietly placed on the top of the meshes inside a desiccator prefilled with 300 mL of glutaraldehyde solution (50%, v/v in water) at its bottom without any contact with glass slides; the desiccator was kept closed for the specified duration, then excess glutaraldehyde was withdrawn under vacuum.30 Microspheres were then kept for 24 hours in a desiccator until complete solidification.
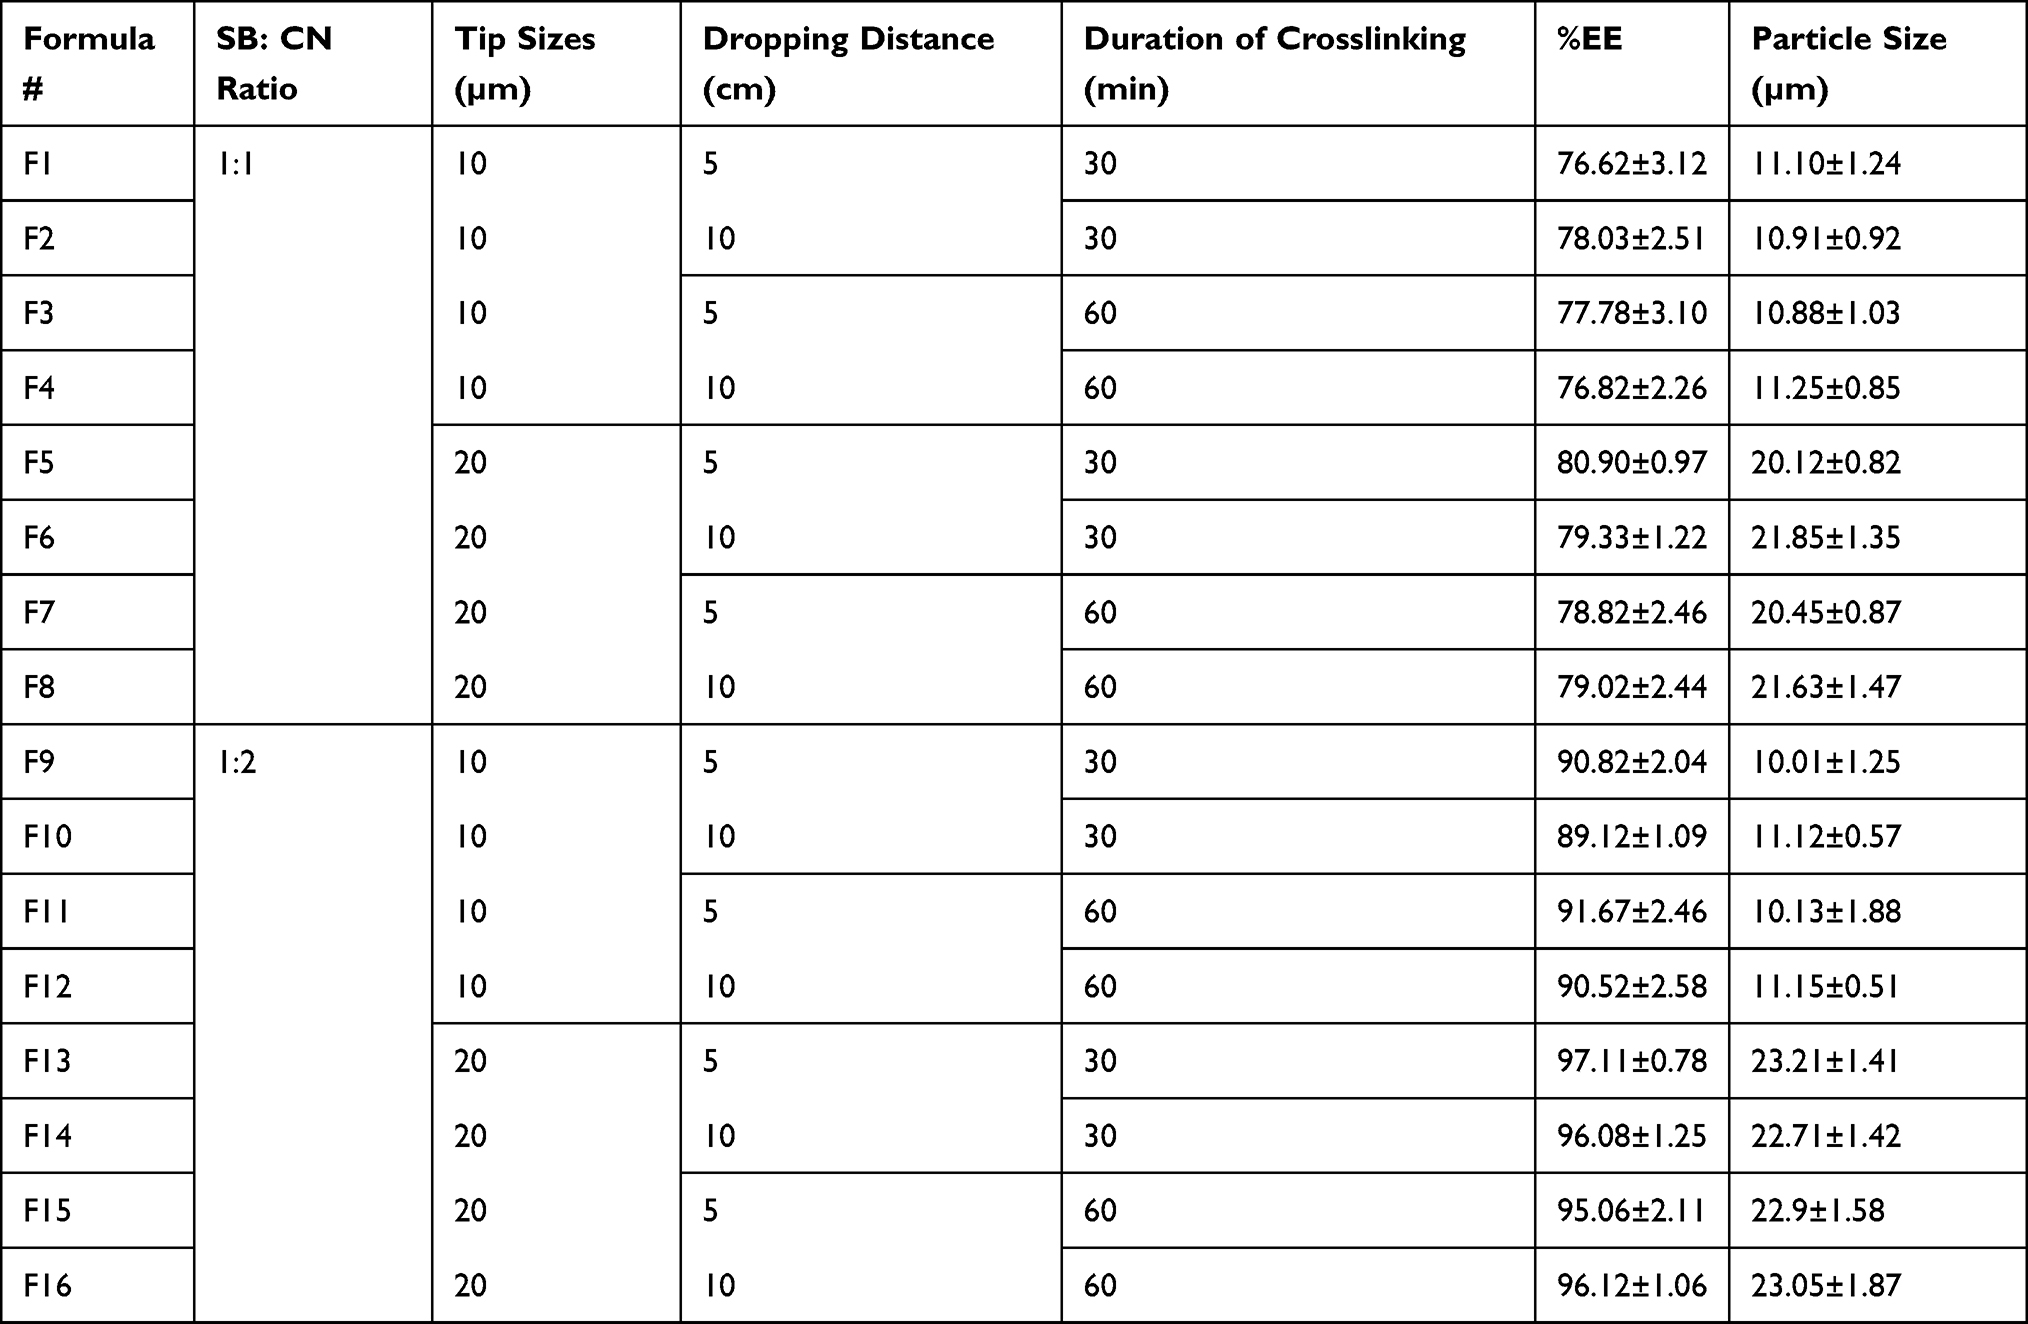 |
Table 1 Formulation Number, SB: CN Ratio, Dropper Tip Size, Dropping Distance, Duration of Crosslinking, % EE and Particle Size of SB Microspheres Formulations |
Examination of Morphology of the Microspheres and Determination of Particle Size Distribution
Morphology of the optimized formula of microspheres was examined using scanning electron microscopy technique (SEM) (Metler Toledo, Tokyo, Japan); samples were vacuum-coated uniformly with gold. Dried microspheres were suspended in 250 mL of deionized water, and its particle size was identified by a particle size analyzer (Mastersizer 3000; Malvern Co., UK). The particle size was measured in triplicate and expressed as mean±SD.
Encapsulation Efficiency Percentage (%EE)
Weighted amounts of dried microspheres were crushed and mounted in 100 mL deionized water and stirred for 12 hours for complete extraction of SB. The percentage of encapsulated SB was determined by HPLC method that was published by Selvadurai after validation of the method for selectivity, sensitivity, accuracy, and stability. Briefly, reversed-phase C18 column (250 × 4.6 mm, 5 μ) was used for separation of SB, using a mixture of acetonitrile and ammonium acetate (80:20% v/v) as a mobile phase at a flow rate of 1.0 mL/min with UV detection at 276 nm. Terbutaline was used as an internal standard (IS), and the analysis was conducted under room temperature conditions. The encapsulation efficiency percentage was calculated based on the amount of SB in microspheres and the actual amount of SB used in the preparation.7,31
Fourier Transform Infrared Spectroscopic (FTIR) Analysis
FTIR studies were conducted to verify the possible interaction between SB, CN, and KN in microspheres. Samples were pulverized, blended with potassium bromide powder and pressed into pellets, and examined using FTIR spectrophotometer (Shimadzu 1800, Japan).
Differential Scanning Calorimetry
Thermal behavior of SB in the optimized formula was studied using differential scanning calorimetry (DSC) (Mettler Toledo, Switzerland): 5 mg samples were heated in aluminum pans at 50–400°C at a scanning rate of 10°C/min under 50 mL/min nitrogen flow.
Swelling Study
Five grams of selected formulations of SB microspheres were soaked in 200 mL of 0.1N HCl buffer at 37±0.5°C for 2 hours followed by phosphate buffer (pH 6.8) for another 6 hours. Soaked samples were then removed by stainless steel mesh at specified time intervals, placed on filter paper to remove excess water, and weighed to calculate the swelling index. Swelling ratio was measured from the following equation.20
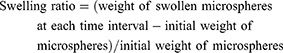
The experiment was done in triplicate, and the results were expressed as mean±SD.
Compression of SB Microspheres into Compact Tablets
Weighted amounts of each microsphere formula equivalent to 4 mg SB were passed through a 125 μm sieve, mixed with 1% talc and 1.5% magnesium stearate, and compressed into compact tablets using a single punch tablet press machine fitted with a 6 mm diameter concave punch.
Characterization of Pre and Post Compression Limits of SB Compact Tablets (SBT)
Pre-compression tests (angle of repose, compressibility index, and Hausner’s ratio) were done for each mixture. Compressed tablets were also evaluated for weight variation, thickness, diameter, friability, and drug content uniformity.32,33
In vitro Release Studies
The release of SB from the SBTs was assayed in a dissolution tester USP apparatus type II at 37°C with a 50-rpm rotation speed. One tablet from each formula was suspended separately in 500 mL 0.1N HCl (pH 1.2) for two hours to simulate gastric conditions, then removed and transferred to another dissolution flask filled with 500 mL phosphate buffer pH 6.8 to simulate intestinal pH up to 24 hours.34 At each time interval, 5 mL samples were withdrawn and replaced with pre-warmed media. SB concentration in each sample was determined using a UV spectrophotometer at 276 nm. The degree of similarity in the release rate between selected batches was studied by the mean of the similarity factor (f2) method; f2 was calculated as follow:
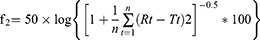
Where Rt and Tt are the cumulative release of the compared two formulations at time t; n is the number of sampling. The value of f2 ranges between 0 and 100. The higher the f2, the higher the similarity between the two curves. If f2 for two curves is >50, the two release curves were considered similar.35 Salbovent® (4 mg) tablet was used as a reference tablet for the in vitro release studies.
Modeling of the Kinetics of Release
The kinetics of release was studied by fitting the profiles to each of zero-order, first-order, Higuchi, and Peppas models. The model with the highest coefficient of determination (R2) was considered the best fitting one.36
Statistical Analysis
Software SPSS 17.0 (SPSS Inc., Chicago, IL, USA) was used to analyze the results, applying one-way analysis of variance (ANOVA) and paired Student’s t-test. Differences were considered to be significant at p>0.05.
In vivo Study in Beagle Dogs
Animal ethics committee/Al-Qassim University approved the study (no. PI/1125). The pharmacokinetic study was conducted according to the ethics of animal care reported by The European Centre for the Validation of Alternative Methods guidelines for investigations in laboratory animals. Six male beagle dogs weighing 10.5–12 kg were used and divided randomly into two groups. The study was conducted in a crossover design in two phases with a one-week washout period to eradicate the influence of the previous dose. No food was allowed overnight prior to the experiment; then food was served two hours after dosing. Water was available ad libitum throughout the study period. During the first phase, dogs received orally the whole tablet of the selected formulation (F13) based on the %EE and the in vitro release test, and after the washout period dogs received a whole tablet from the reference product. Blood samples (5 mL) were withdrawn and injected into a heparinized collection tube by means of a detaining needle at each of the following intervals: pre-dose, 0.5, 1, 2, 3, 4, 6, 8, 12, 18, and 24 h post-dose. The plasma separation was obtained by sample centrifugation at 4000 rpm for 10 min, and samples were stored at −20°C until further analysis.37 The concentration of SB in plasma was assayed using HPLC.38
Chromatographic Analysis of Plasma Samples
SB concentrations in plasma samples were determined by a reported HPLC method. The method determines the concentration of SB using terbutaline (TB) as an internal standard. The HPLC analysis was carried out using Waters Acquity HPLC™ (Waters Corp., Milford, MA, USA). Compound separation was conducted on a Waters® C18 column (250 mm, 4.6 mm i.d., 5 m particle size) using an isocratic mobile phase composed of a mixture of acetonitrile and ammonium acetate (80:20) (v/v), with a flow rate of 1 mL/min. The pH was pre-adjusted at 7 using an orthophosphoric acid solution. The injection volume was adjusted at 20.0 μL. The UV-visible detector was set at 276 nm. Preceding the analysis, the mobile phase was filtered using 0.45 μm filters [44]. The system was equilibrated with the mobile phase before injection. All determinations were made at room temperature. All data were analyzed via Lynx TMV 4.1 software (Waters Corp.). Briefly before the beginning of the study, the method was validated for selectivity, precision, accuracy, linearity, and stability.
Calculation of Pharmacokinetic Parameters of SB in Plasma Samples
A plasma concentration versus time profile was used to assess SB pharmacokinetic parameters. Plasma concentrations of SB are shown as the mean±SD. The peak of plasma concentration (Cmax) and the time required to reach the maximum concentration (tmax) were represented as directly measured. The terminal elimination rate constant (Kel) was calculated by linear regression analysis method of the final portion of the log plasma concentration time curve of SB. Linear trapezoidal rules were used to calculate the extent of SB absorption (AUC0–t). The bioavailability of the selected formula relative to the reference commercial product was calculated using the following formula:39

IBM SPSS Statistics 20 (Armonk, USA) with one-way ANOVA and post hoc test, using p-value≥ 0.05, was used for all statistical evaluation of data. Mann–Whitney’s (nonparametric signed rank) test was used to compare tmax between the data obtained from the tested groups.
Results
In the presented study, SB was encapsulated and its release was controlled through the formulation of CN/KN polyelectrolyte complex using a SHS. CN is a cationic, natural, high charge density biodegradable polysaccharide. It forms polyelectrolyte complexes by interactions with counter ions such as KN, sulfates, polyphosphates.40,41 The designed microspheres showed modified gel characteristics with a higher ability to control the release of entrapped drug.20 Glutaraldehyde-saturated atmosphere was used for solidifying SB-CN microspheres, which excludes the need to remove excess crosslinking solution after the solidification of microspheres.14 Sixteen formulas were designed based on different process parameters, namely: drug–polymer ratio, dropping tip inner diameter, dropping distance, and duration of crosslinking. Subsequently, the optimized formula based on percentage EE and rate of drug release was evaluated for in vivo parameters in comparison to the reference product.
SEM Images of Superhydrophobic Surface
After spraying of all layers of Hydrophobic Carnauba Spray Wax® and complete drying of the surface, SEM images of the superhydrophobic surface were captured (Figure 3): the glass surface showed a rough, amphiphobic, amalgamated, hierarchical texture with protrusions, with a low sliding angle and minimal wettability which has a high ability to entrap air. Table 2 shows a significant increase in CA of water droplets on the surface of the treated glass compared with the untreated one. CA of water on SHS was 153.32°±2.07°, indicating a good entrapment of air and minimal wettability of the surface.
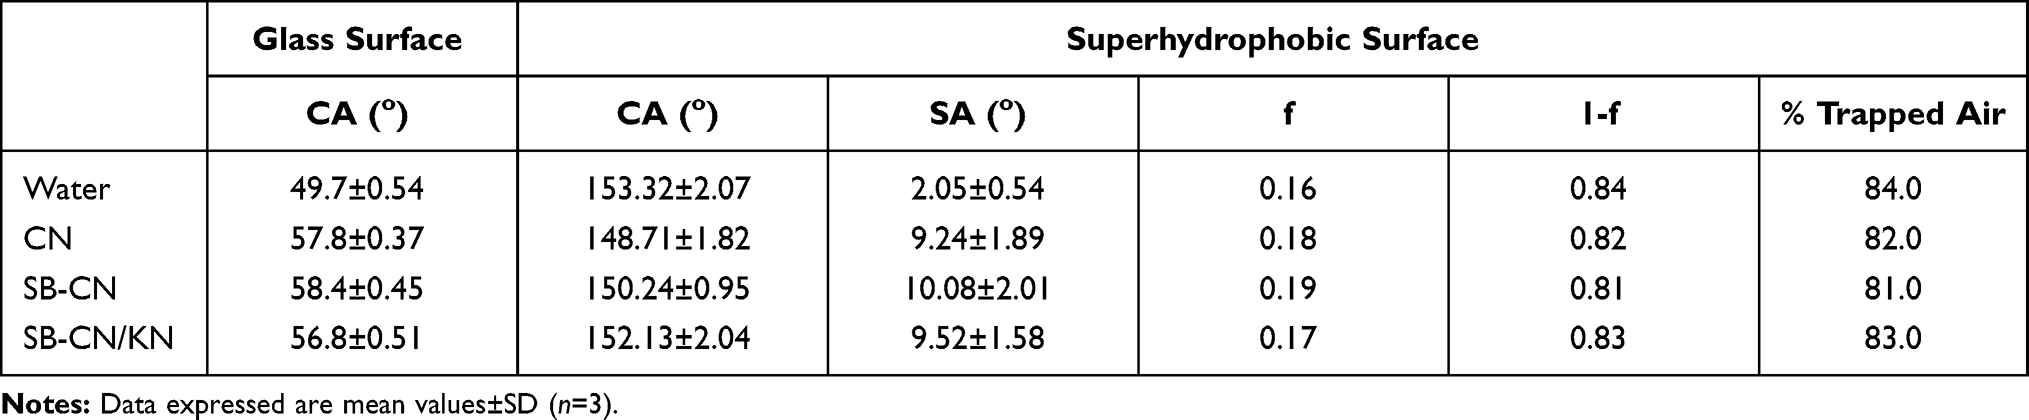 |
Table 2 Static Contact Angles (CA), Sliding Angles (SA), and Percentage-Trapped Air for the Tested Dispersions on SHS Treated Glass Surfaces Compared to Their CA on Untreated Glass Surfaces |
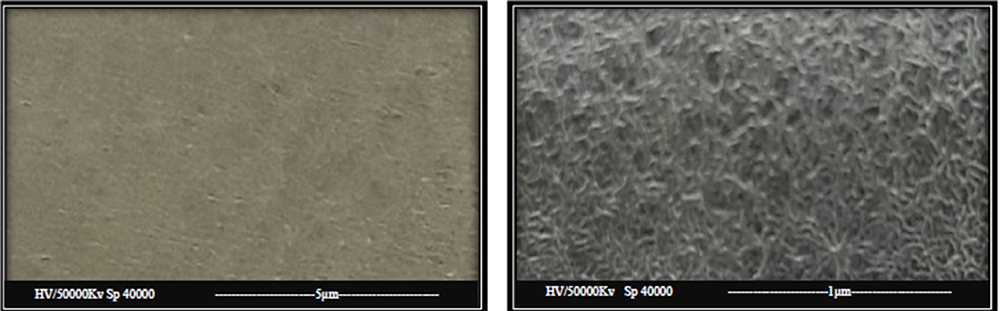 |
Figure 3 SEM images of the prepared superhydrophobic surface (the magnification power 25,000×, 100,000×)ss. |
The SHS offered good CA and SA characteristics for CN, SB-CN, and SB-CN/KN hydrogel dispersions, as specified by the measured CA (Table 2, Figure 4). A slight reduction in the CA (150.24°±0.95°) and increase in the SA (10.08°±2.01°) were observed with SB-CH hydrogel when compared to water, which could be interpreted as based on the viscous and sticky characteristics of CN. An increment of CA (152.13°±2.04°) with a reduction of SA (9.52°±1.58°) was reported with SB-CN/KN compared with SB-CN, which could be due to a decrease in the sticky characteristics of CN by complexing with KN.
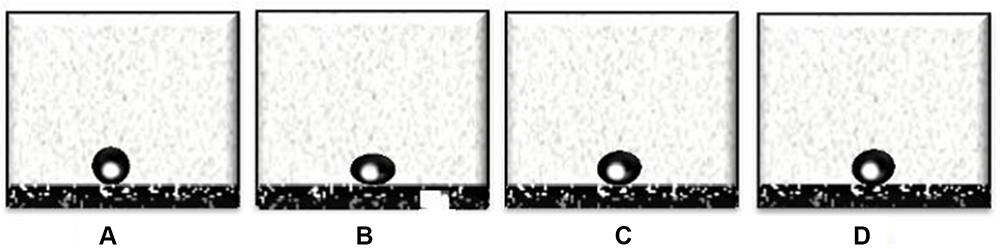 |
Figure 4 Images show contact angles for (A) water, (B) CN, (C) SB-CN-based dispersion, and (D) SB-CN/KN-based dispersion droplets on SHS. |
SEM Images and Particle Size Determination
SEM image of F13 (Figure 5) showed a microsphere with a rough folded surface with an average size of 23.21±2.41µm. Folds act as another barrier to the drug diffusion to the external phase, verifying more control of SB release to external media. The average particle sizes were controlled mainly by dropper tip size and CN content. Smaller particle sizes ranging between 10.01±1.25 and 11.25±0.85 were observed for particles dropped from a smaller dropping tip, with a statistically significant (p>0.05) increase in size with a larger one. A proportional relationship was observed between the average sizes of microspheres relative to CN content, and an increase in the size may be interpreted on the basis of increasing the density of the dropped dispersion, which results in larger spheres.42
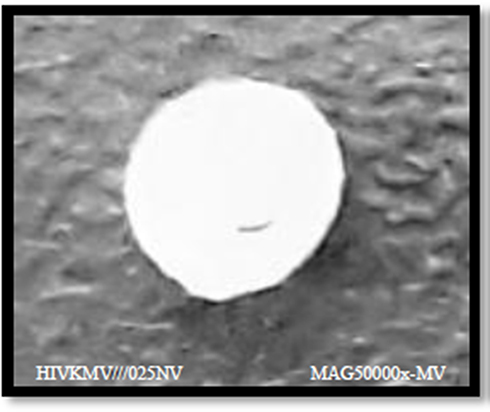 |
Figure 5 Scanning image of F13 microsphere formula. |
Encapsulation Efficiency (%EE) of SB in Microspheres
The study aimed to enhance the encapsulation of SB (a highly water-soluble drug) with minimal drug loss to the external media. Many studies have been done to encapsulate SB in controlled release encapsulated systems; their results revealed low encapsulation efficiency due to rapid loss of drug in the treatment solution.8 Hence our study is based on encapsulation of SB in a glutaraldehyde atmosphere without any external solution. Our results showed the ability of the followed technique to enhance SB encapsulation, which ranged between 76.82±2.26% and 97.11±0.78% for F1 and F13, respectively (Table 1). Statistical analysis of the %EE data at p<0.05 showed that SB-to-CN ratio and dropping tip size have significant (p<0.05) effect on the encapsulation of SB, whereas dropping distance and duration of crosslinking showed little non-significant effect (p>0.05); similar results were reported by Liu et al.43 The ratio of 1:2 of SB and CN showed significantly higher %EE (p<0.05) than a 1:1 ratio (Figure 6). The lower entrapment efficiency might be attributed to the inability of a lower polymer concentration to entrap the drug efficiently and a potential for drug escaping from the microspheres before complete crosslinking,15 while the higher concentration of CN showed a better ability to encapsulate the drug and obstruct the diffusion of the drug to the outer superhydrophobic surface. In addition, the higher CN concentration provides surfaces with lower pores and higher numbers of functional groups available to crosslinking that minimize drug escape to the outer surface, therefore ensuring microspheres with high %EE up to 97.11%.17,22 The larger tip size showed higher %EE of SB in microspheres, which might be accredited to the increase in droplet size and increase in the CN content in each drop, which enhances the entrapment of the drug.23
 |
Figure 6 Line plot for the effect of (A) drug-to-polymer ratio, (B) dropper tip size, (C) dropping distance, and (D) duration of crosslinking on the encapsulation efficiency (%EE) of SB-CN microspheres. |
In addition, results revealed the advantage of using a glutaraldehyde atmosphere as a crosslinking medium instead of crosslinking solutions that cause escaping of the drug and a potential decrease in the encapsulation efficiency of hydrophilic drugs.7,18
Differential Scanning Calorimetry Study (DSC)
The DSC thermograms of SB, CN, KN, and the selected formula of SB-loaded microspheres (F13) are shown in Figure 7. The DSC curve of the SB shows a sharp characteristic endothermic melting peak starting at 200°C and reaching a maximum at 215.32°C; the same peak was observed in the drug-loaded microsphere thermogram. Characteristic peaks at 297.58°C and 326.25°C are observed for CN and KN thermograms, respectively.28 In addition, the DSC curve of SB-loaded microspheres showed a broad peak from 290°C up to 310°C due to the physicochemical binding of the drug with the polymer structure.44
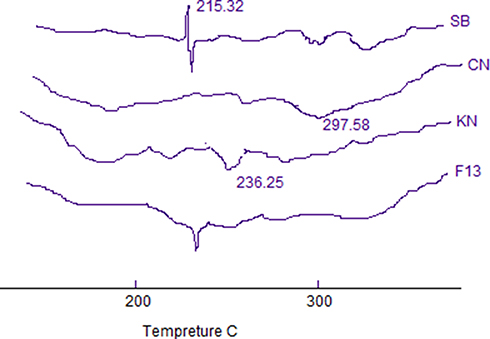 |
Figure 7 DSC thermogram of pure salbutamol sulfate SB, chitosan CN, carrageenan, and optimized formula F13. |
Fourier Transform Infrared Spectroscopy (FTIR) Study
FTIR study was conducted to detect any possible chemical interactions between SB and the used polymers in the microspheres. Figure 8 shows the IR spectra of CN, KN, SB, plain CN/KN microspheres, and SB-loaded microspheres. The IR spectrum of CN revealed many characteristic peaks at different positions such as vibrations at 1629 cm−1 representing the primary amine groups.11 The IR spectrum of KN showed a distinctive significant peak of the sulfonic group (-OSO3−) at 1265 cm−1.26 Plain CN/KN microspheres displayed the disappearance of vibrations at 1265 cm−1 which is characteristic to KN sulfonic group (-OSO3−), which provides evidence on the inclusion of KN in microspheres.13 In addition the characteristic vibration of the amine group at 1629 cm−1 was slightly shifted to 1751 cm−1, due to the formation of NH3 ion in the complex and the electrostatic interaction between NH3 (cationic group) and the sulfonic (anionic group) in KN.28 The FTIR spectrum of SB has shown an intense peak of the tri-methyl group at 1375 cm−1, another peak at 1625 cm−1 representing the secondary amine group, and a third peak at 1380 cm−1 corresponding to the presence of the phenol group.25 SB-loaded microsphere figures showed an attenuation in SB peaks that might be due to the decrease in drug concentration in the system. But there was no shift in drug-characteristic peaks, which indicates that there was no interaction between the drug and excipients in the system.44
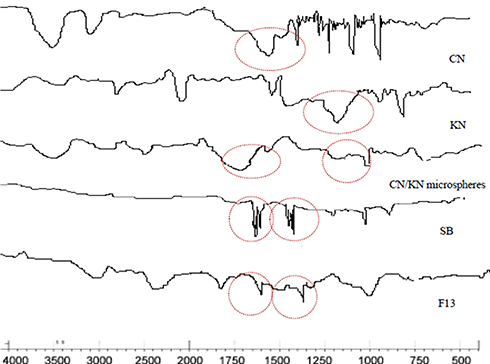 |
Figure 8 FTIR spectra of CN, KN, CN/KN microspheres dispersion, SB, and F13. |
Swelling Features of SB Microspheres
The swelling characteristics of microspheres in term of swelling ratio were studied by immersing the selected formula of microspheres in an acidic medium (pH 1.2) at 37°C for 2 hours followed by phosphate buffer (pH 6.8) up to 8 hours. Figure 9 shows that SB microspheres remained intact during the experimental time and appeared larger and more transparent due to the absorption of water and swollen with CN gel.22 Figure 10 shows that the swelling ratios were increased by increasing CN content due to the higher ability of microspheres to adsorb water. Formulations with the same size and polymer content showed a non-significant statistical difference in swelling ratio at p>0.05 level. Swelling ratios were 4.1 and 4.2 for F13 and F15, respectively, after 8 hours, which could be interpreted on the basis of its initial size and CN content. Results also revealed that the swelling ratio increased in alkaline media compared with acidic ones, which can be interpreted on the basis of increasing the density of CN charge in acidic media, which reacts strongly with the carrageenan sulfonic group, creating a stronger complex and reduced swelling degree. At alkaline pH, amino groups' charge will decrease, which leads to a weakness in the ionic reactions, and increases in the swelling rate take place.
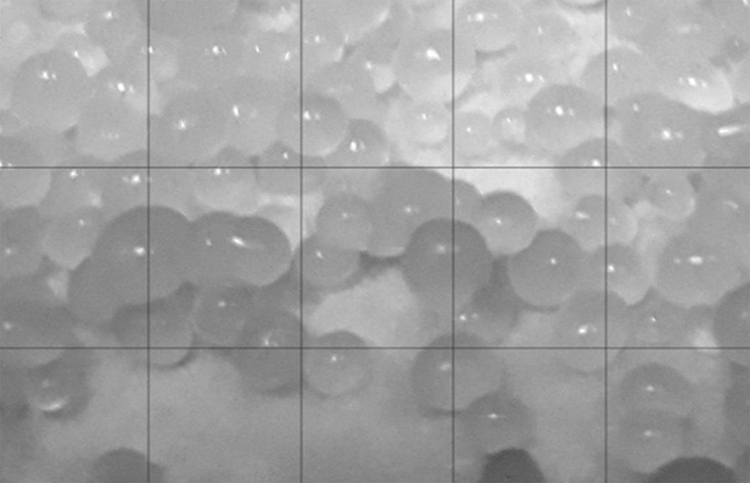 |
Figure 9 Digital image of swollen SB microspheres (F13) after immersing in 0.1N HCl for 2 hours then in phosphate buffer up to 8 hours. |
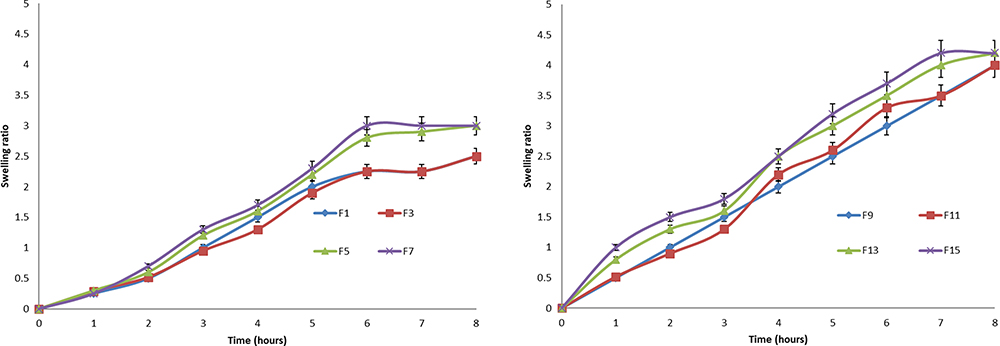 |
Figure 10 Swelling ratios of SB microspheres (F1, F3, F5, F7, F9, F11, F13, and F15) in 0.1N HCl for 2 hours then phosphate buffer (pH 6.8) up to 8 hours. |
Pre and Post Compression Characteristics of SBTs
Microspheres were sieved, mixed with talc and magnesium stearate, then compressed into tablets by a single compression method. All formulations showed good flowing properties. The angle of repose for all formulation mixtures (FT-1–FT-16) was ≤28°, indicating good flow properties.45 Compressibility indices and Hauser’s ratios were ranged from 9.22% to 10.05%, and 1.11 to 1.20, respectively (data not shown). SBTs were white to whitish-buff, concave, rounded, with a smooth surface. No cracks, pitting, or lamination were observed. The mean diameter of SBTs was 6.0±0.0 mm, while the mean thickness ranged between 3.0 mm and 3.12 mm. The average hardness was ranged between 7.5 kg/cm2 and 8.1 kg/cm2, indicating sufficient strength of tablets.33 The percentage friability was less than 1% for all formulations, which expresses sufficient mechanical resistance. All SBTs were within the accepted pharmacopoeia limits (±7.5%) for weight variation test.46
In vitro Release Studies
In vitro drug release experiments were completed to give an idea about the control of SB release upon oral administration of tablets. The drug release from hydrophilic polymers is usually controlled by several factors, such as the extent of crosslinking, polymer composition, size, and physicochemical characteristics of the drug, mainly its hydrophilicity.26 The release of drugs from such hydrogels occurs through one of the following mechanisms: diffusion, desorption, erosion, or by a combined mechanism.25 In the presented study, one tablet from each formula was suspended for two hours in 0.1N HCl then in phosphate buffer up to 24 hours. Initial burst release was observed with all tablets, which ranged between 25.2±3.5% and 45.5±2.7% w/w, followed by a slower rate of release (Figure 11A and B). Burst release is expected due to the hydrophilic nature of SB, where a rapid release of the hydrophilic drugs usually occurs upon contact with the release medium, followed by a slower release rate.31 A rapid release can be interpreted also on the basis of the presence of un-incorporated drug molecules on the surface of the microspheres. In addition to its hydrophilicity, SB is an acidic salt of a weak base (pKa=8.6), which ionized and solvated rapidly in 0.1N HCl (acidic medium), resulting in a high initial burst release.46 The consequent release will be based on the ability of SB to diffuse through the micro-voids in the complex matrix formed between the CN and KN which acts to hinder the drug diffusion through microspheres.13,14 Statistical analysis of in vitro release data revealed that the release of SB from microspheres was significantly (p>0.05) affected by the polymer concentration and the size of the microspheres. On the other hand, the duration of crosslinking and changing in dropping distance did not reflect a significant (p>0.05) change in the rate of release. The increase in polymer concentration with a larger size of microspheres results in more tortuosity in the hydrogel with an increase in crosslinking, which results in a longer diffusional pathway and consequently an increase in the hindrance of drug release and consequently a decrease in the rate of drug release. An inverse relationship between polymer concentration and the rate of drug release has also been reported by Yousry et al and Yassin et al.6,8 In addition, results show that crosslinking of microspheres in glutaraldehyde atmosphere for 30 minutes was sufficient to achieve a maximum crosslinking of CN, and the increase in the crosslinking duration to 60 minutes did not result in significant changes in the rate of drug release. F1, F2, F3, and F4 exhibited burst release, since about 75.1±2.3%, 72.2±3.1%, 73.5±1.9%, and 72.9±2.01% of SB was released in 30 minutes, respectively. Almost 100% of SB was released within the first two hours. So, F1, F2, F3, and F4 did not show the required sustained-release properties, whereas F5, F6, F7, and F8 microspheres released 60±3.3%, 56±1.7%, 58±3.0, and 55±2.5% of SB in 30 min, respectively. The increase in CN content leads to a significant reduction in the drug release rate (p˂0.5) owing to the formation of a denser mass, which acts as a barrier to drug diffusion.25 T50 (the time required to achieve 50% release of the drug) was 115±2.5, 125±3.3, 120±4.2, and 108±3.5 minutes for F9, F10, F11, and F12, respectively, and subsequently the initial burst release was decreased. Concerning F13, F14, F15, and F16 release profiles, it was observed that SB release rate was different; 50% of SB was released after 245±3.5, 238±4.2, 235±3.6, and 240±3.6 from FT13, F14, F15, and F16, respectively, which might be explained on the basis of CN content and the size of the microspheres (as discussed previously). Based on the %EE results and the release data, F13 was considered the optimal formula. It was selected for additional investigation in beagle dogs for its pharmacokinetic parameters. Table 3 expresses the similarity levels between release profiles of selected formulations. High similarity was observed between formulations with the same CN content, while lower similarity was observed for those with different content of CN.
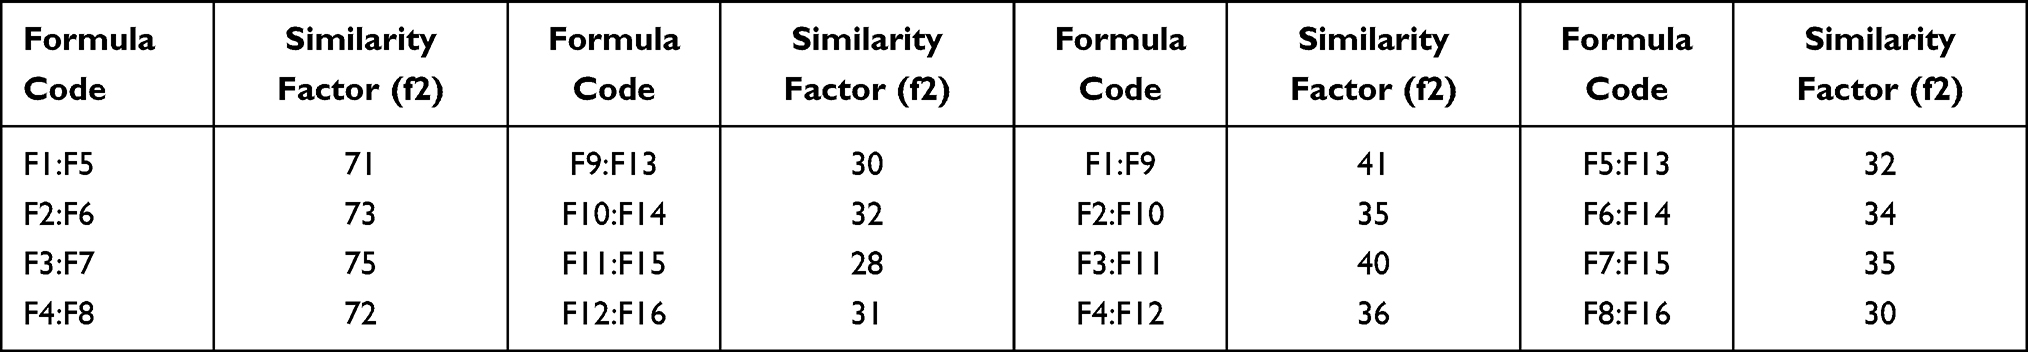 |
Table 3 Similarity Factors Between Different Formulations |
 |
Figure 11 (A) In vitro dissolution profiles of SB from SBTs for F1–F8 in 0.1N HCl for two hours followed by phosphate buffer up to 24 hours. (B) In vitro dissolution profiles of SB from SBTs for F9–F16 in 0.1N HCl for two hours followed by phosphate buffer up to 24 hours. |
Kinetic Studies of SB Release from SBTs
In order to study the release kinetics of SB from prepared tablets, the in vitro release data were fitted to zero-order, first-order, Higuchi model, Korsmeyer–Peppas model, and Hixson–Crowell mode. Criteria for deciding the most appropriate model was based on the highest value of coefficient of determination (R2). Results reported in Table 4 showed that the best fitting model with the highest determination coefficient (R2) for all formulae was the Higuchi diffusion model, followed by the Peppas equation, zero-order, then first-order equation. This revealed that the main factor affecting SB release from the CN/KN polymeric system was its diffusion through the gel layer.47
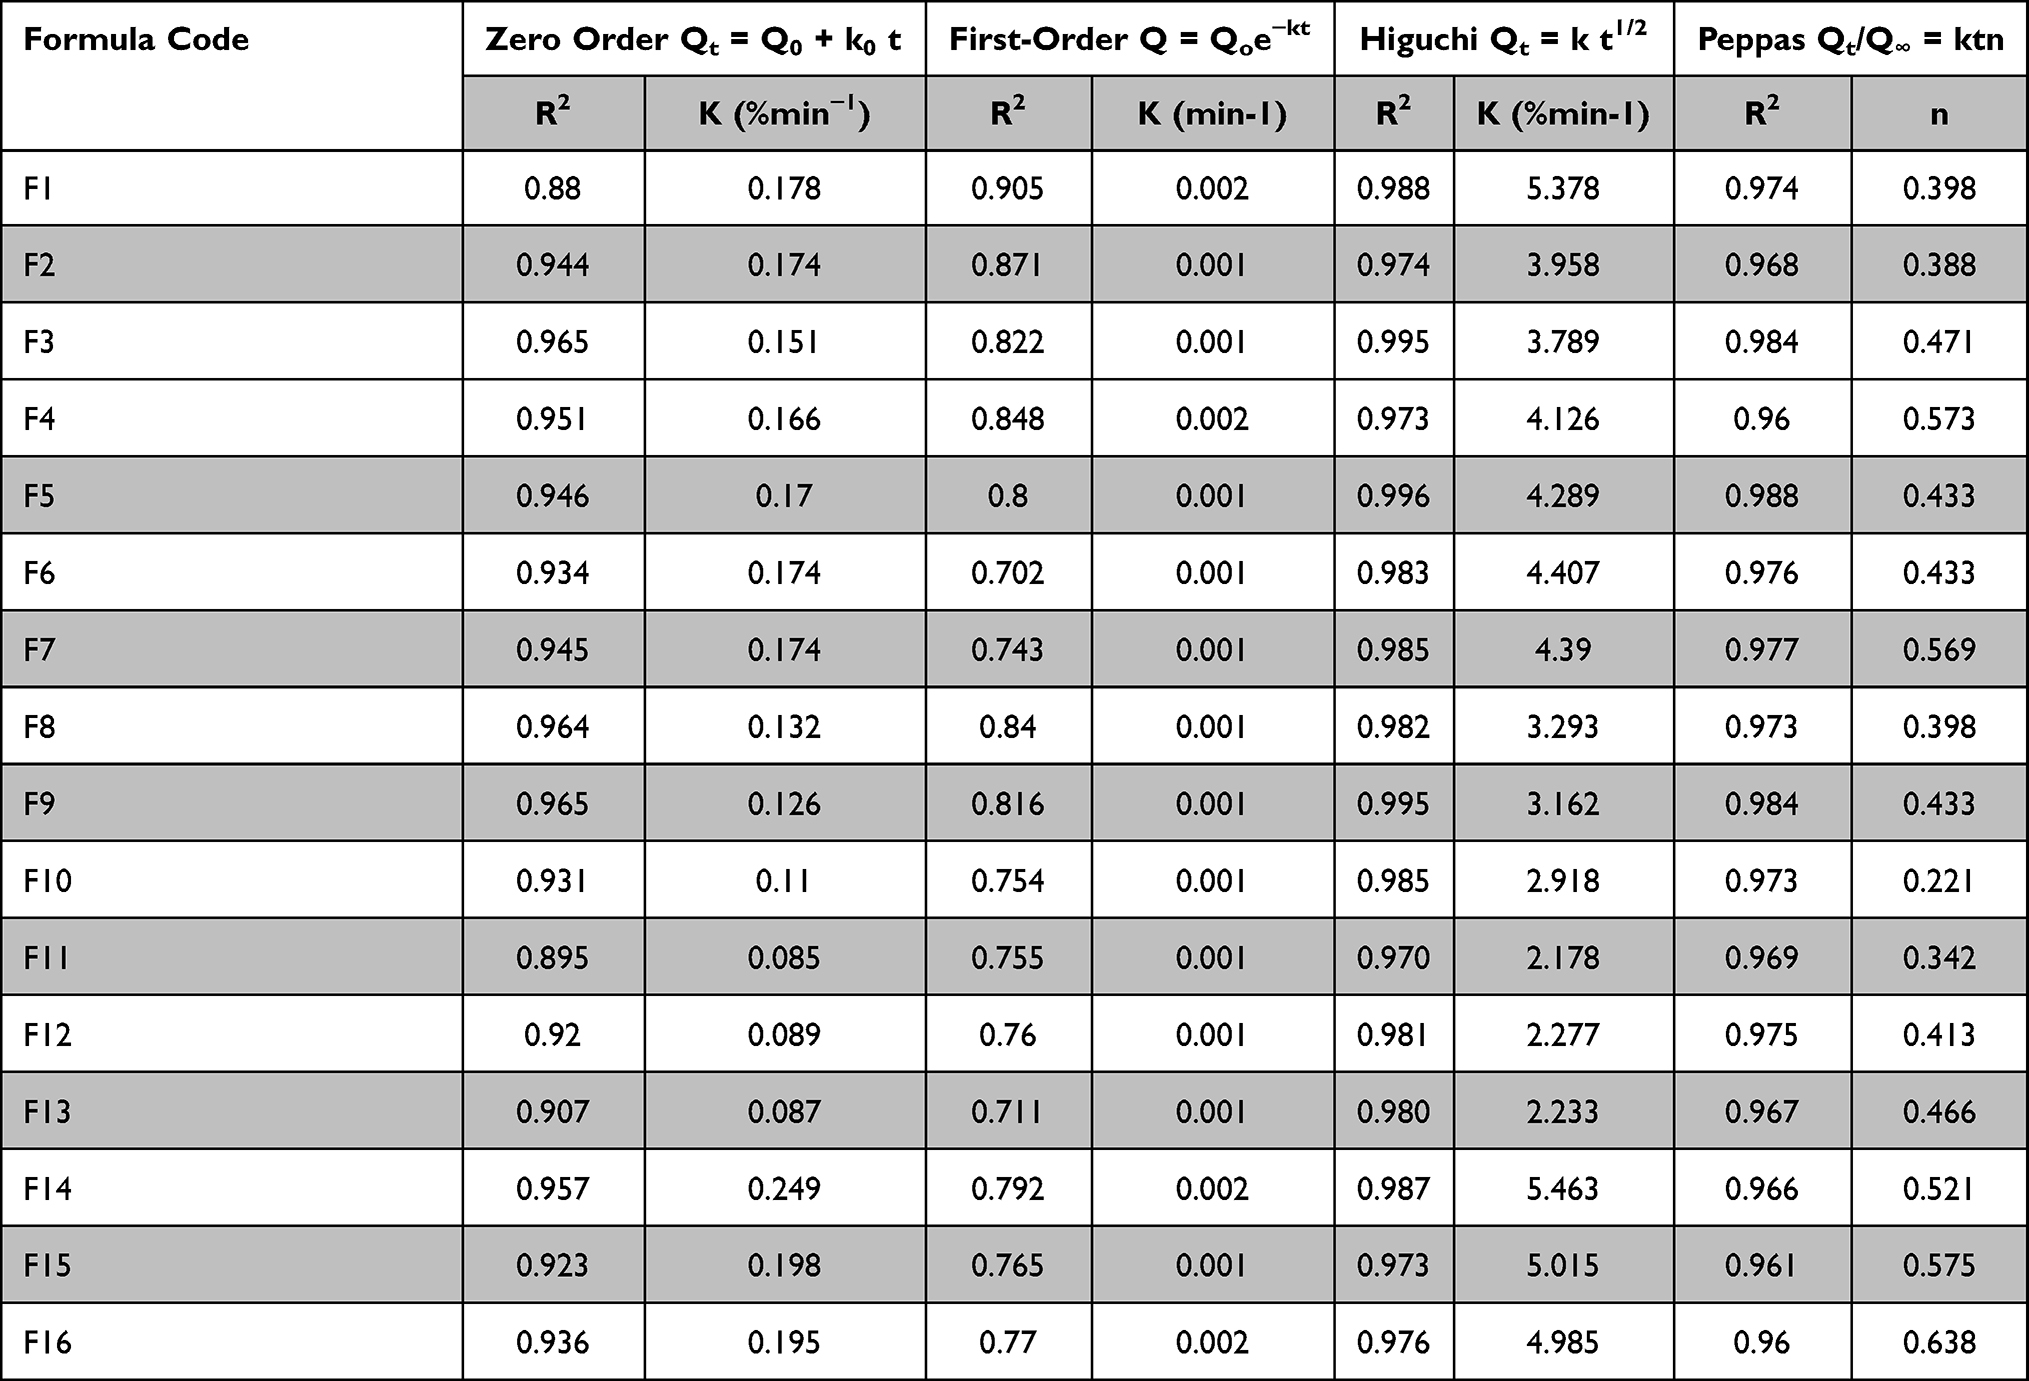 |
Table 4 Kinetics Study of in vitro Release Data of SB from Tablets |
In vivo Performance of SB in Selected Formula (F13) and Market Product
The pharmacokinetics of the optimized formula (F13) compared with the marketed SB product in oral administration was investigated in beagle dogs. The pharmacokinetic parameters are shown in Figure 12 and Table 5. Results revealed that, after oral administration of F13 and market product to beagle dogs, the drug appeared in plasma after 0.43±0.12 h and 0.41±0.10 h, respectively. Mean peak drug concentration (Cmax) of F13 (2.50±0.14 µg/mL) was higher than that of the market product Cmax (2.79±0.21 µg/mL). The mean time to achieve the peak concentration (tmax) was almost the same (1.0±0.2); no statistically significant difference (p>0.05) was recorded between the tmax values of the sample and the reference product. The AUC0–24 value was 55.80±6.36 and 89.92±10.12 (µg.h.mL−1) for market product and F13, respectively. The results suggest that there was a 1.61-fold enhancement of the extent of drug absorption of F13 as compared to market tablets. Results may be explained on the basis of rapid elimination and fast decline in drug concentration from the market product; on the other hand, the sustained-release system (F13) showed a slow elimination curve that was able to maintain SB plasma concentration for a longer period. In addition, results showed that the mean residence time (MRT) was 23.29±4.75 h and 10.18±2.29 h for F13 and commercial product, respectively. Results revealed that the formulated microspheres showed an accepted sustained-release behavior in vivo. Similar results were reported for diclofenac sodium, nonpareil, and rifampicin sustained-release beads.25,48
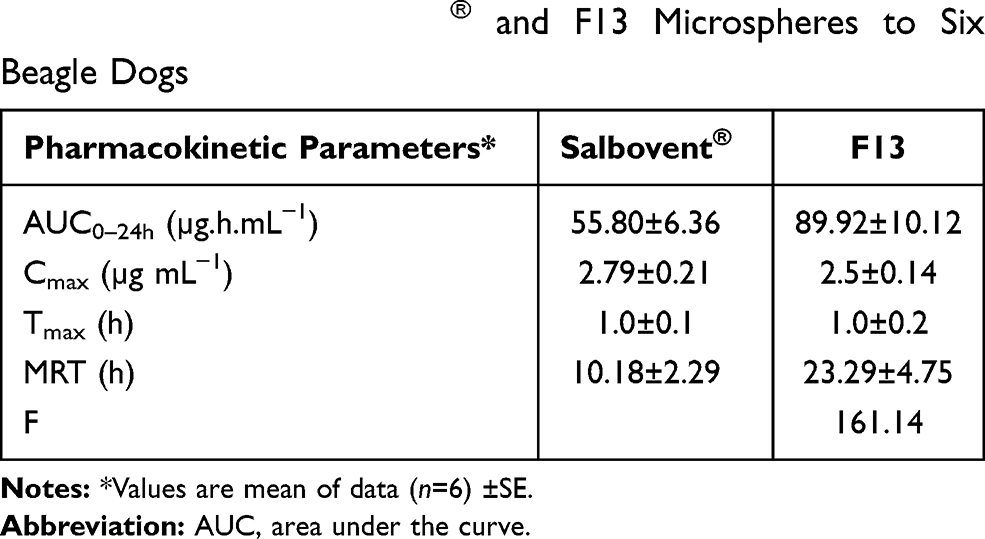 |
Table 5 Pharmacokinetic Parameters of SB Following Oral Administration of Salbovent® and F13 Microspheres to Six Beagle Dogs |
 |
Figure 12 Mean (±SE) plasma SB concentrations following oral administration of commercial tablets and F13 tablets to six beagle dogs. |
Conclusion
The study presented an easily modifiable delivery system with an accepted encapsulation efficiency of water-soluble drugs. The experiment proved that SB-loaded CN/KN microspheres prepared on superhydrophobic surfaces are a promising cost-effective system that could sustain the release of the drug and improved its duration of action in vivo. In addition the results showed that the optimized formula significantly enhanced the bioavailability compared to the reference product and showed a promising sustained-release effect in vivo with lower frequency.
Funding
This research received no external funding.
Disclosure
The authors declare no conflicts of interest for this work.
References
1. Nardi-Ricart A, Nofrerias-Roig I, Suñé-Pou M, et al. Formulation of sustained release hydrophilic matrix tablets of tolcapone with the application of sedem diagram: influence of tolcapone’s particle size on sustained release. Pharmaceutics. 2020;17(12):674–688. doi:10.3390/pharmaceutics12070674
2. Timmins P, Desai D, Chen W, Wray P, Brown J, Hanley S. Advances in mechanistic understanding of release rate control mechanisms of extended-release hydrophilic matrix tablets. Ther Deliv. 2006;7:553–572. doi:10.4155/tde-2016-0026
3. Ebube NK, Jones AB. Sustained release of acetaminophen from a heterogeneous mixture of two hydrophilic non-ionic cellulose ether polymers. Int J Pharm. 2004;272:19–27. doi:10.1016/j.ijpharm.2003.11.020
4. Mobarak DH, Salah S, Elkheshen SA. Elkheshen, formulation of ciprofloxacin hydrochloride loaded biodegradable nanoparticles: optimization of technique and process variables. Pharm Dev Technol. 2014;19:891–900. doi:10.3109/10837450.2013.836293
5. Moustafine RI, Margulis EB, Sibgatullina LF, Kemenova VA, Mooter GVD. Comparative evaluation of interpolyelectrolyte complexes of chitosan with eudragit® L100 and eudragit® L100-55 as potential carriers for oral controlled drug delivery. Eur J Pharm Biopharm. 2008;70:215–225. doi:10.1016/j.ejpb.2008.04.008
6. Yassin AEB, Alsarra IA, Al-Mohizea AM. Chitosan beads as a new gastroretentive system of verapamil. Sci Pharm. 2006;74:175–188. doi:10.3797/scipharm.2006.74.175
7. Sinha V, Singla A, Wadhawan S, et al. Chitosan microspheres as a potential carrier for drugs. Int J Pharm. 2004;274:1–33. doi:10.1016/j.ijpharm.2003.12.026
8. Yousry C, Ahmed IS, Amin MM, El Gazayerly ON. Superhydrophobic substrates for ultrahigh encapsulation of hydrophilic drug into controlled-release polyelectrolyte complex beads: statistical optimization and in vivo evaluation. Pharmaceutics. 2019;11:257–277. doi:10.3390/pharmaceutics11060257
9. Peng S, Deng W. A simple method to prepare superamphiphobic aluminum surface with excellent stability. Colloids Surf a Physicochem Eng Asp. 2015;481:143–150. doi:10.1016/j.colsurfa.2015.04.037
10. Cassie ABD, Baxter S. Wettability of porous surfaces. Trans Faraday Soc. 1944;40:546–551. doi:10.1039/tf9444000546
11. Yogesh S, Dayal A, Sandeep P, Amit M, Kumar S, Ragini J. Method development and validation of salbutamol sulphate and its related imputites by RP-HPLC. Int J Pharm Sci Res. 2011;3:15.
12. Zhang Y, Huo M, Zhou J, et al. DDSolver: an add-in program for modeling and comparison of drug dissolution profiles. AAPS J. 2010;12:263–271. doi:10.1208/s12248-010-9185-1
13. Binbin Z, Yuxiang Z, Jia W, Yuanyuan S, Jie Z, Yantao L. Superamphiphobic aluminum alloy with low sliding angles and acid-alkali liquids repellency. Mater Des. 2020;188:1264–1275.
14. Deng R, Hu Y, Wang L, et al. An easy and environmentally-friendly approach to superamphiphobicity of aluminum surfaces. Appl Surf Sci. 2017;402:301–307. doi:10.1016/j.apsusc.2017.01.091
15. Lima AC, Correia CR, Oliveira MB, Mano JF. Sequential ionic and thermogelation of chitosan spherical hydrogels prepared using superhydrophobic surfaces to immobilize cells and drugs. J Bioact Compat Polym. 2014;29:50–65. doi:10.1177/0883911513513660
16. Puga AM, Lima AC, Mano JF, Concheiro A, Alvarez-Lorenzo C. Pectin-coated chitosan microgels crosslinked on superhydrophobic surfaces for 5-fluorouracil encapsulation. Carbohydr Polym. 2013;98:331–340. doi:10.1016/j.carbpol.2013.05.091
17. Tomida H, Nakamura C, Kiryu S. A novel method for the preparation of controlled-release theophylline capsules coated with a polyelectrolyte complex of κ-carrageenan and chitosan. Chem Pharm Bull. 1994;42:979–981. doi:10.1248/cpb.42.979
18. Guo Z, Liu W, Su B-L. Superhydrophobic surfaces: from natural to biomimetic to functional. J Colloid Interface Sci. 2011;353:335–35520. doi:10.1016/j.jcis.2010.08.047
19. Karam F, Elabadawy A, Gamal M. Optimization of the entrapment efficiency and release of ambroxol hydrochloride alginate beads. J Appl Pharm Sci. 2015;5:013–019.
20. Meltem C, Yesim A, Imran V, et al. Preparation and in vitro evaluation of bFGF-loaded chitosan nanoparticles. Drug Deliv. 2007;14:525–529. doi:10.1080/10717540701606483
21. Takka S, Gürel A. Evaluation of chitosan/alginate beads using experimental design: formulation and in vitro characterization. AAPS PharmSciTech. 2010;11:460–466. doi:10.1208/s12249-010-9406-z
22. Mouez MA, Nasr M, Abdel-Mottaleb M, Geneidi AS, Mansour S. Composite chitosan-transfersomal vesicles for improved transnasal permeation and bioavailability of verapamil. Int J Boil Macromol. 2016;93:591–599. doi:10.1016/j.ijbiomac.2016.09.027
23. Tranquilan-Aranilla C, Nagasawa N, Bayquen A, Rosa AD. Synthesis and characterization of carboxymethyl derivatives of kappa-carrageenan. Carbohydr Polym. 2012;87:1810–1816. doi:10.1016/j.carbpol.2011.10.009
24. Tapia C, Escobar Z, Costa E, et al. Comparative studies on polyelectrolyte complexes and mixtures of chitosan–alginate and chitosan–carrageenan as prolonged diltiazem clorhydrate release systems. Eur J Pharm Biopharm. 2004;57:65–75. doi:10.1016/S0939-6411(03)00153-X
25. Piyakulawat P, Praphairaksit N, Chantarasiri N, Muangsin N. Preparation and evaluation of chitosan/carrageenan beads for controlled release of sodium diclofenac. AAPS PharmSciTech. 2007;8:120–130. doi:10.1208/pt0804097
26. Prasanth VV, Akashmoy C, Sam M, Rinku M, Kamalakkannan V. Formulation and evaluation of salbutamol sulphate microspheres by solvent evaporation method. J Appl Pharm Sci. 2011;01(05):133–137.
27. Murtaza G, Ahmad A, Waheed AA, Naeem AM. Salbutamol sulphate- ethylcellulose microparticles: formulation and in-vitro evaluation with emphasis on mathematical approaches. Daru. 2009;17:209–216.
28. Lalduhsanga P, Sushanta S, Bhaskar M. The study of the effects of surfactants on ethyl cellulose microspheres containing salbutamol sulphate. Der Pharm Lett. 2009;1:65–74.
29. Lima AC, Sher P, Mano JF. Production methodologies of polymeric and hydrogel particles for drug delivery applications. Expert Opin Drug Deliv. 2012;9:231–248. doi:10.1517/17425247.2012.652614
30. Yousry C, Fahmy RH, Essam T, El-Laithy HM, Elkheshen SA. Nanoparticles as tool for enhanced ophthalmic delivery of vancomycin: a multidistrict -based microbiological study, solid lipid nanoparticles formulation and evaluation. Drug Dev Ind Pharm. 2016;42:1–34. doi:10.3109/03639045.2016.1171335
31. Selvadurai M, Jayaraj K. High performance liquid chromatographic method development and its validation for salbutamol. Br J Pharm Res. 2010;4:228–237.
32. Al Remawia M, Al-akayleh F, Salem M, Al Shami M, Badwan A. Application of excipient made from chitosan-xanthan as a single component for the controlled release of ambroxol tablet. J Excip Food Chem. 2013;4:48–57.
33. Hadi MA, Babu VL, Pal N. Formulation and evaluation of sustained release matrix tablets of glimepiride based on combination of hydrophilic and hydrophobic polymers. J Appl Pharm Sci. 2012;2:101–107.
34. Rao N, Hadi MA, Pancha H, Reddy B. Formulation and evaluation of biphasic drug delivery system of montelukast sodium for chronotherapy. World J Pharm Res. 2012;1:757–775.
35. Mayur M, Avani F. Optimization and characterization of mebeverine hydrochloride loaded guar gum microspheres for irritable bowel syndrome. J Carbohydr Polym. 2011;86:536–545. doi:10.1016/j.carbpol.2011.04.068
36. Dash S, Murthy PN, Nath L, Chowdhury P. Kinetic modeling on drug release from controlled drug delivery systems. J Acta Pol Pharm. 2010;67:217–223.
37. Barakat N, Elbagory I, Almurshedi A. Formulation, release characteristics and bioavailability study of oral monolithic matrix tablets containing carbamazepine. J AAPS Pharm SciTech. 2009;9:931–938. doi:10.1208/s12249-008-9108-y
38. Jianli Z, Youxuan X, Xin D, Moutian W. Quantitation of salbutamol in human urine by liquid chromatography–electrospray ionization mass spectrometry. J Chromatogr B. 2006;831:328–332. doi:10.1016/j.jchromb.2005.11.041
39. Wagner J, Nelson E. Kinetic analysis of blood levels and urinary excretion in the absorptive phase after single dose of drug. J Pharm Sci. 1964;53:1392–1404. doi:10.1002/jps.2600531126
40. Reza MS, Quadir MA, Haider SS. Comparative evaluation of plastic, hydrophobic and hydrophilic polymers as matrices for controlled-release drug delivery. J Pharm Pharm Sci. 2003;6:282–291.
41. Maderuelo C, Zarzuelo A, Lanao JM. Critical factors in the release of drugs from sustained release hydrophilic matrices. J Control Release. 2011;154:2–19. doi:10.1016/j.jconrel.2011.04.002
42. Jayakumar R, Reis RL, Mano JF. Synthesis and characterization of pH-sensitive thiol-containing chitosan beads for controlled drug delivery applications. Drug Deliv. 2007;14:9–17. doi:10.1080/10717540600739872
43. Liu H, Du K, Li D. A high bioavailability and sustained-release nano-delivery system for nintedanib based on electrospray technology. Int J Nanomedicine. 2018;13:8379–8393. doi:10.2147/IJN.S181002
44. Kittur F, Prashanth K, Uday K, Tharanathan R. Characterization of chitin, chitosan and their carboxymethyl derivatives by differential scanning calorimetry. Carbohydr Polym. 2002;49:185–193. doi:10.1016/S0144-8617(01)00320-4
45. Manivannan R, Chakole V. Formulation and development of extended release floating tablet of atenolol. Int J Recent Adv Pharm Res. 2011;3:25–30.
46. Rao M, Shelar S. Controlled release ion sensitive floating oral in situ gel of a prokinetic drug using gellan gum. Ind J Pharm. 2015;49:158–167.
47. Siepmann J, Siepmann F. Mathematical modeling of drug dissolution. Int J Pharm. 2013;453:12–24. doi:10.1016/j.ijpharm.2013.04.044
48. Rao BS, Seshasayana A, Saradhi SP, Kumar NR, Narayan CP, Murthy KR. Correlation of “in vitro” release and “in vivo” absorption characteristics of rifampicin from ethylcellulose coated nonpareil beads. Int J Pharm. 2001;230:1–9. doi:10.1016/S0378-5173(01)00835-3
 © 2021 The Author(s). This work is published and licensed by Dove Medical Press Limited. The
full terms of this license are available at https://www.dovepress.com/terms
and incorporate the Creative Commons Attribution
- Non Commercial (unported, 3.0) License.
By accessing the work you hereby accept the Terms. Non-commercial uses of the work are permitted
without any further permission from Dove Medical Press Limited, provided the work is properly
attributed. For permission for commercial use of this work, please see paragraphs 4.2 and 5 of our Terms.
© 2021 The Author(s). This work is published and licensed by Dove Medical Press Limited. The
full terms of this license are available at https://www.dovepress.com/terms
and incorporate the Creative Commons Attribution
- Non Commercial (unported, 3.0) License.
By accessing the work you hereby accept the Terms. Non-commercial uses of the work are permitted
without any further permission from Dove Medical Press Limited, provided the work is properly
attributed. For permission for commercial use of this work, please see paragraphs 4.2 and 5 of our Terms.