Back to Journals » Nature and Science of Sleep » Volume 13
Subjective Poor Sleep Quality is Associated with Higher Blood Pressure and Prevalent Hypertension in General Population Independent of Sleep Disordered Breathing
Authors Yang Z, Heizhati M, Wang L, Li M, Pan F, Wang Z, Abudureyimu R, Hong J, Yao L, Yang W ![]() , Liu S, Li N
, Liu S, Li N ![]()
Received 15 July 2021
Accepted for publication 4 September 2021
Published 8 October 2021 Volume 2021:13 Pages 1759—1770
DOI https://doi.org/10.2147/NSS.S329024
Checked for plagiarism Yes
Review by Single anonymous peer review
Peer reviewer comments 2
Editor who approved publication: Prof. Dr. Ahmed BaHammam
Zhikang Yang,1– 3,* Mulalibieke Heizhati,1– 3,* Lin Wang,1– 3 Mei Li,1– 3 Fengyu Pan,1– 3 Zhongrong Wang,1– 3 Reyila Abudureyimu,1– 3 Jing Hong,1– 3 Ling Yao,1– 3 Wenbo Yang,1– 3 Shasha Liu,1– 3 Nanfang Li1– 3
1Hypertension Center, People’s Hospital of Xinjiang Uygur Autonomous Region, Urumqi, Xinjiang, People’s Republic of China; 2Xinjiang Hypertension Institute, Urumqi, Xinjiang, People’s Republic of China; 3National Health Committee Key Laboratory of Hypertension Clinical Research, Urumqi, Xinjiang, People’s Republic of China
*These authors contributed equally to this work
Correspondence: Nanfang Li Email [email protected]
Objective: To explore the relationship of subjective sleep quality with blood pressure (BP) and hypertension by considering the influence of sleep disordered breathing (SDB) and age in the general population.
Methods: We evaluated sleep quality using the Pittsburgh sleep quality index (PSQI) and SDB using NoSAS score and measured BP in randomly selected adults in China in 2019. Sleep quality is categorized into four groups as very good, fairly good, fairly bad and very bad. SDB is defined as NoSAS score ≥ 8. Hypertension is defined as systolic BP ≥ 140 mmHg and/or diastolic BP ≥ 90 mmHg, and/or use of antihypertensive medicine within previous 2 weeks. Multi-variable linear and logistic regression analyses were used to assess the association of global PSQI score and sleep quality with BP and prevalent hypertension.
Results: In the 33,341 participants (53.4% women, median age: 48 years), prevalence of hypertension significantly increased from very good to very bad sleepers in total (34.3 vs 42.6 vs 50.3 vs 58.5%), SDB (61.2 vs 68.3 vs 73.3 vs 75.5%) and non-SDB participants (26.8 vs 33.1 vs 40.1 vs 50.9%). In multiple linear regression, PSQI global score showed significant positive association with BP levels in total, SDB and non-SDB participants, consistent in sensitivity analysis by excluding participants who were taking antihypertensives, and in participants aged < 60 years in age-stratified analysis. In multivariable logistic regression, odds ratio for presence of hypertension significantly increased from very good to very bad sleepers in total (1 vs 1.08 vs 1.22 vs 1.48), SDB (1 vs 1.17 vs 1.35 vs 1.28) and non-SDB participants (1 vs 1.05 vs 1.14 vs 1.53), consistent in participants aged < 60 years.
Conclusion: Poor subjective sleep quality is significantly associated with higher BP and prevalent hypertension, independent of SDB in the young- and middle-aged general population, indicating potential of improving sleep quality to lower BP and optimize hypertension management at population level.
Keywords: sleep quality, sleep disordered breathing, blood pressure, prevalent hypertension
Introduction
Hypertension is the primary risk factor for morbidity and mortality including cardiovascular disease (CVD),1,2 and the number of hypertensives is estimated to be 1.56 billion by 2025;3 thus improved understanding of modifiable risk factors is critical for prevention.
Sleep is essential for optimal health and vitality. Existing evidence suggests that poor sleep quality, per se a public health issue with a prevalence of 31.8–60% in adults,1–4 is one of the modifiable risk factors for blood pressure (BP) elevation and hypertension development.
Based on existing literature, only a few studies examined the effects of objectively and subjectively measured sleep quality on BP and yielded inconsistent results. Objectively assessed lower sleep duration and/or efficiency, and poor subjective sleep quality, are associated with higher 24-hour and diurnal systolic BP (SBP) and higher nocturnal BP in various adult community dwellers;5–8 nonetheless other studies did not observe a significant association between subjective poor sleep quality and BP.9,10 In terms of hypertension, current evidence fails to provide conclusive results. Some previous studies report that poor subjective sleep quality is associated with prevalent hypertension,8,11–13 whereas others did not find such an association4,14–16 or results are not entirely consistent across various population groups.11,15 For instance, Bansil et al. failed to observe such an association among the American population in National Health and Nutrition Examination Survey data.15 Liu et al. reported in >9400 Northeastern Chinese that poor sleepers have higher prevalence and odds of hypertension,17 whereas Lu et al. in 5461 participants from the Kailuan community observed such an association in men of all ages, and only in women of young and middle age.11 Though, previous studies are not without limitations, which may contribute to some explanations for inconsistencies among studies. Some studies were conducted in smaller sample sizes,11 in selected populations,9,10 and failed to use well-accepted assessment questionnaires,15,16 and failed to collect data on established factors for parameters of interest such as lifestyle, physical activity, and mood or anxiety disorders.4,8,10,17
Importantly, the effects of sleep disordered breathing (SDB) on the association of poor sleep quality with BP and hypertension were not considered8–10 or not evaluated systematically in previous studies. Only a few excluded subjects with suspected SDB or obstructive sleep apnea (OSA), or performed sensitivity analysis, using self-determined standards,11 and self-reported diagnosis.15,16 SDB is an umbrella term, with a prevalence of 25.8–83.8%18–21 and with OSA as the most frequent type.22 OSA is the most common form of secondary causes of hypertension23 and a common risk factor for poor sleep quality. In an analysis of two distinctive cohorts, there is a considerable association between shorter sleep duration and higher 24-hour SBP, independent of OSA, in pre-hypertensive adults.6 Understanding whether the association between sleep quality with BP and hypertension is independent of SDB could have great relevance on disease prevention at population level, when considering cost-effectiveness of public sleep quality optimization programs.24
Therefore, this study aimed to explore the relationship of global score of Pittsburgh sleep quality index (PSQI) and subjective sleep quality with BP and hypertension in a sufficient sample from the general population by considering the influence of SDB and age, since many of the adverse health effects associated with sleep are suggested to be end organ effects of hypertension.6,25 Age should also be considered in this process, due to the fact that prevalence of poor sleep quality (33.8–62.4%) and SDB (as high as 80%) is higher in the elderly26,27 and association of the two is also inconsistent in this population.8,28
Methods
The ethics committee of People’s Hospital of Xinjiang Uygur Autonomous Region approved the study protocol, and all the participants signed informed consent. The study was conducted in accordance with the Declaration of Helsinki.
Site
Emin County, Xinjiang China, is home to a multi-ethnic population of >160,000, with a high prevalence of risk factors for cardiovascular disease such as hypertension.29,30
Study Population
In this cross-sectional study, we used a multi-stage stratified sampling method to enroll study participants aged ≥18 years. At the first stage, Emin county was divided into three settings as urban, agricultural and stock-raising areas.30 At the second stage, two corresponding streets or villages were randomly selected using sample random sampling (SRS) method. At the third stage, subjects aged ≥15 years were selected using SRS method. Inclusion criteria for the subjects encompassed: 1. Local inhabitants aged ≥15 years and residing at current address for ≥6 months; 2. Agreement to participate and to sign an informed consent form. Those unable to cooperate due to mental and/or cognitive problems, and night workers or pregnant women were excluded. In order to have a higher response rate, the survey was conducted together with the annual health check up program.
Data Collection
Standardized questionnaire were completed for each participant, by face-to-face interview with trained investigators including sociodemographic characteristics (age, gender, ethnicity, occupation, education, marital status), lifestyle (cigarette and alcohol consumption), global physical activity questionnaire (GPAQ), PSQI, No-SAS scale, Zung’s self rating anxiety and depression scale (SAS, SDS) questionnaires, and medical histories (hypertension, diabetes, coronary heart disease and stroke).
Data Collection and Measurements
Height, weight, abdominal circumference and BP were measured using standard protocols. Body mass index (BMI) was calculated as weight (kilograms) divided by square of height (meter). BP was measured three times with a Professional Portable Blood Pressure Monitor (OMRON HBP-1300, Kyoto, Japan) on the right arm positioned at heart level after the participant was sitting at rest for 5 minutes, with 30 seconds between each measurement. Participants were asked to avoid exercise, smoking, alcohol, coffee or tea for at least 30 min before BP measurement. Average of three values was used. Fasting venous blood samples were tested for concentrations of serum creatinine, fasting blood glucose (FBG), triglycerides (TG), total cholesterol (TC), low density lipoprotein cholesterol (LDL-C), and high-density lipoprotein cholesterol (HDL-C).
Definitions
Main variables: Hypertension is defined as SBP ≥140 mmHg, and/or diastolic BP (DBP) ≥90 mmHg, and/or use of anti-hypertensive medicine within 2 weeks.31 Sleep quality was inquired using the Chinese version of PSQI, widely used in the Chinese population,32 which captures subjective sleep quality, sleep latency, sleep duration, habitual sleep efficiency, sleep disturbances, use of sleeping medication, and daytime dysfunction. Each domain is given a score of 0 to 3 and then combined for a total score ranging from 0 to 21. Sleep quality is categorized into four groups as very good (PSQI score ≤4), fairly good (5–9), fairly bad (10–14) and very bad sleep (≥15). SDB is defined as a No-SAS score ≥8,33 which is validated in the Chinese population.34
Other variables: Alcohol consumption is defined as consuming an alcoholic beverage at least once per week in the past month.35 Cigarette consumption is defined as participants who have smoked at least 20 packets of cigarettes in their lifetime and currently smoke cigarettes.35 Overweight and obesity is defined as BMI ≥25 kg/m2.36 Abdominal obesity is defined as having an abdominal circumference ≥90 cm for men and ≥85 cm for women.36 Occupation was categorized as manual and mental work. Education attainment status was categorized into primary and lower, and junior high and higher. Anxiety and depressive status are defined as SAS score ≥45 (raw score = 36) and SDS score ≥ 50 (raw score = 40).37 Physical activity was assessed using the Chinese version of GPAQ,38 and divided into two categories using WHO recommendations on physical activity for health (≥600 Metabolic Equivalent, MET, minutes per week). Cardiovascular disease is defined as self-reported medical history of coronary heart disease and stroke. Diabetes mellitus is defined as FBG ≥7.0 mmol/L, and/or self-reported previous diagnosis by physicians and/or intake of hypoglycemic agents within past 2 weeks.39 Dyslipidemia is defined as TC ≥6.2 mmol/L and/or TG ≥2.3 mmol/L and/or HDL-C <1.0 mmol/L and/or LDL-C ≥4.2 mmol/L and/or having received treatment during past 2 weeks.40 Chronic kidney disease is defined as glomerular filtration rate <60 mL/min/1.73m2.41
Statistical Analysis
Baseline characteristics were compared between groups using Pearson χ2 tests for nominal variables. Prevalence of hypertension, SBP and DBP were compared among four sleep quality groups using rank sum test, and P value was adjusted by Bonferroni method. For the relationship between PSQI global score with BP, we performed multiple linear regression analysis to estimate the B-value and the corresponding 95% confidence intervals (95% CIs) and for the relationship of sleep quality with presence of hypertension, multivariable logistic regression to estimate the odds ratios (OR) and the 95% CIs. The minimal sufficient adjustment sets were obtained by directed acyclic graph (DAG) based on causal relationship,42 and a fully adjusted model was performed using variables which showed significant differences in baseline characteristics between hypertensive and normotensive participants SDB (present vs not) and age (≥60 vs <60 years) were analyzed as the stratification factors. Sensitivity analysis was conducted to assess the association of PSQI global scores with BP by excluding those under anti-hypertensive therapy.
Results
Population Characteristics
As shown in Table 1, a total of 33,341 participants (53.4% women, median age: 48 years) completed the survey and were grouped by presence of hypertension as hypertension and normotension groups. Significant differences were observed between the two groups in all variables except for anxiety status. Participants in the hypertension group were more likely to be men (52.8% vs 42.6%), show older age (55 vs 43 years), and higher BMI (27.0 vs 24.5 kg/m2) and abdominal circumference (92.1 vs 83.1 cm), compared with those in the normotension group (P for all <0.001). Prevalence of poor sleep quality was significantly higher in participants in the hypertension group than in those in the normotension group (very good: 51.7% vs 62.7%, fairly good: 33.0 vs 28.2%, fairly bad: 12.7% vs 7.9% and very bad: 2.7% vs 1.2%, P for all <0.05). In addition, prevalence of SDB was also significantly higher in participants in the hypertension group than in those from the normotension group (41.1% vs 13.8%, P<0.001).
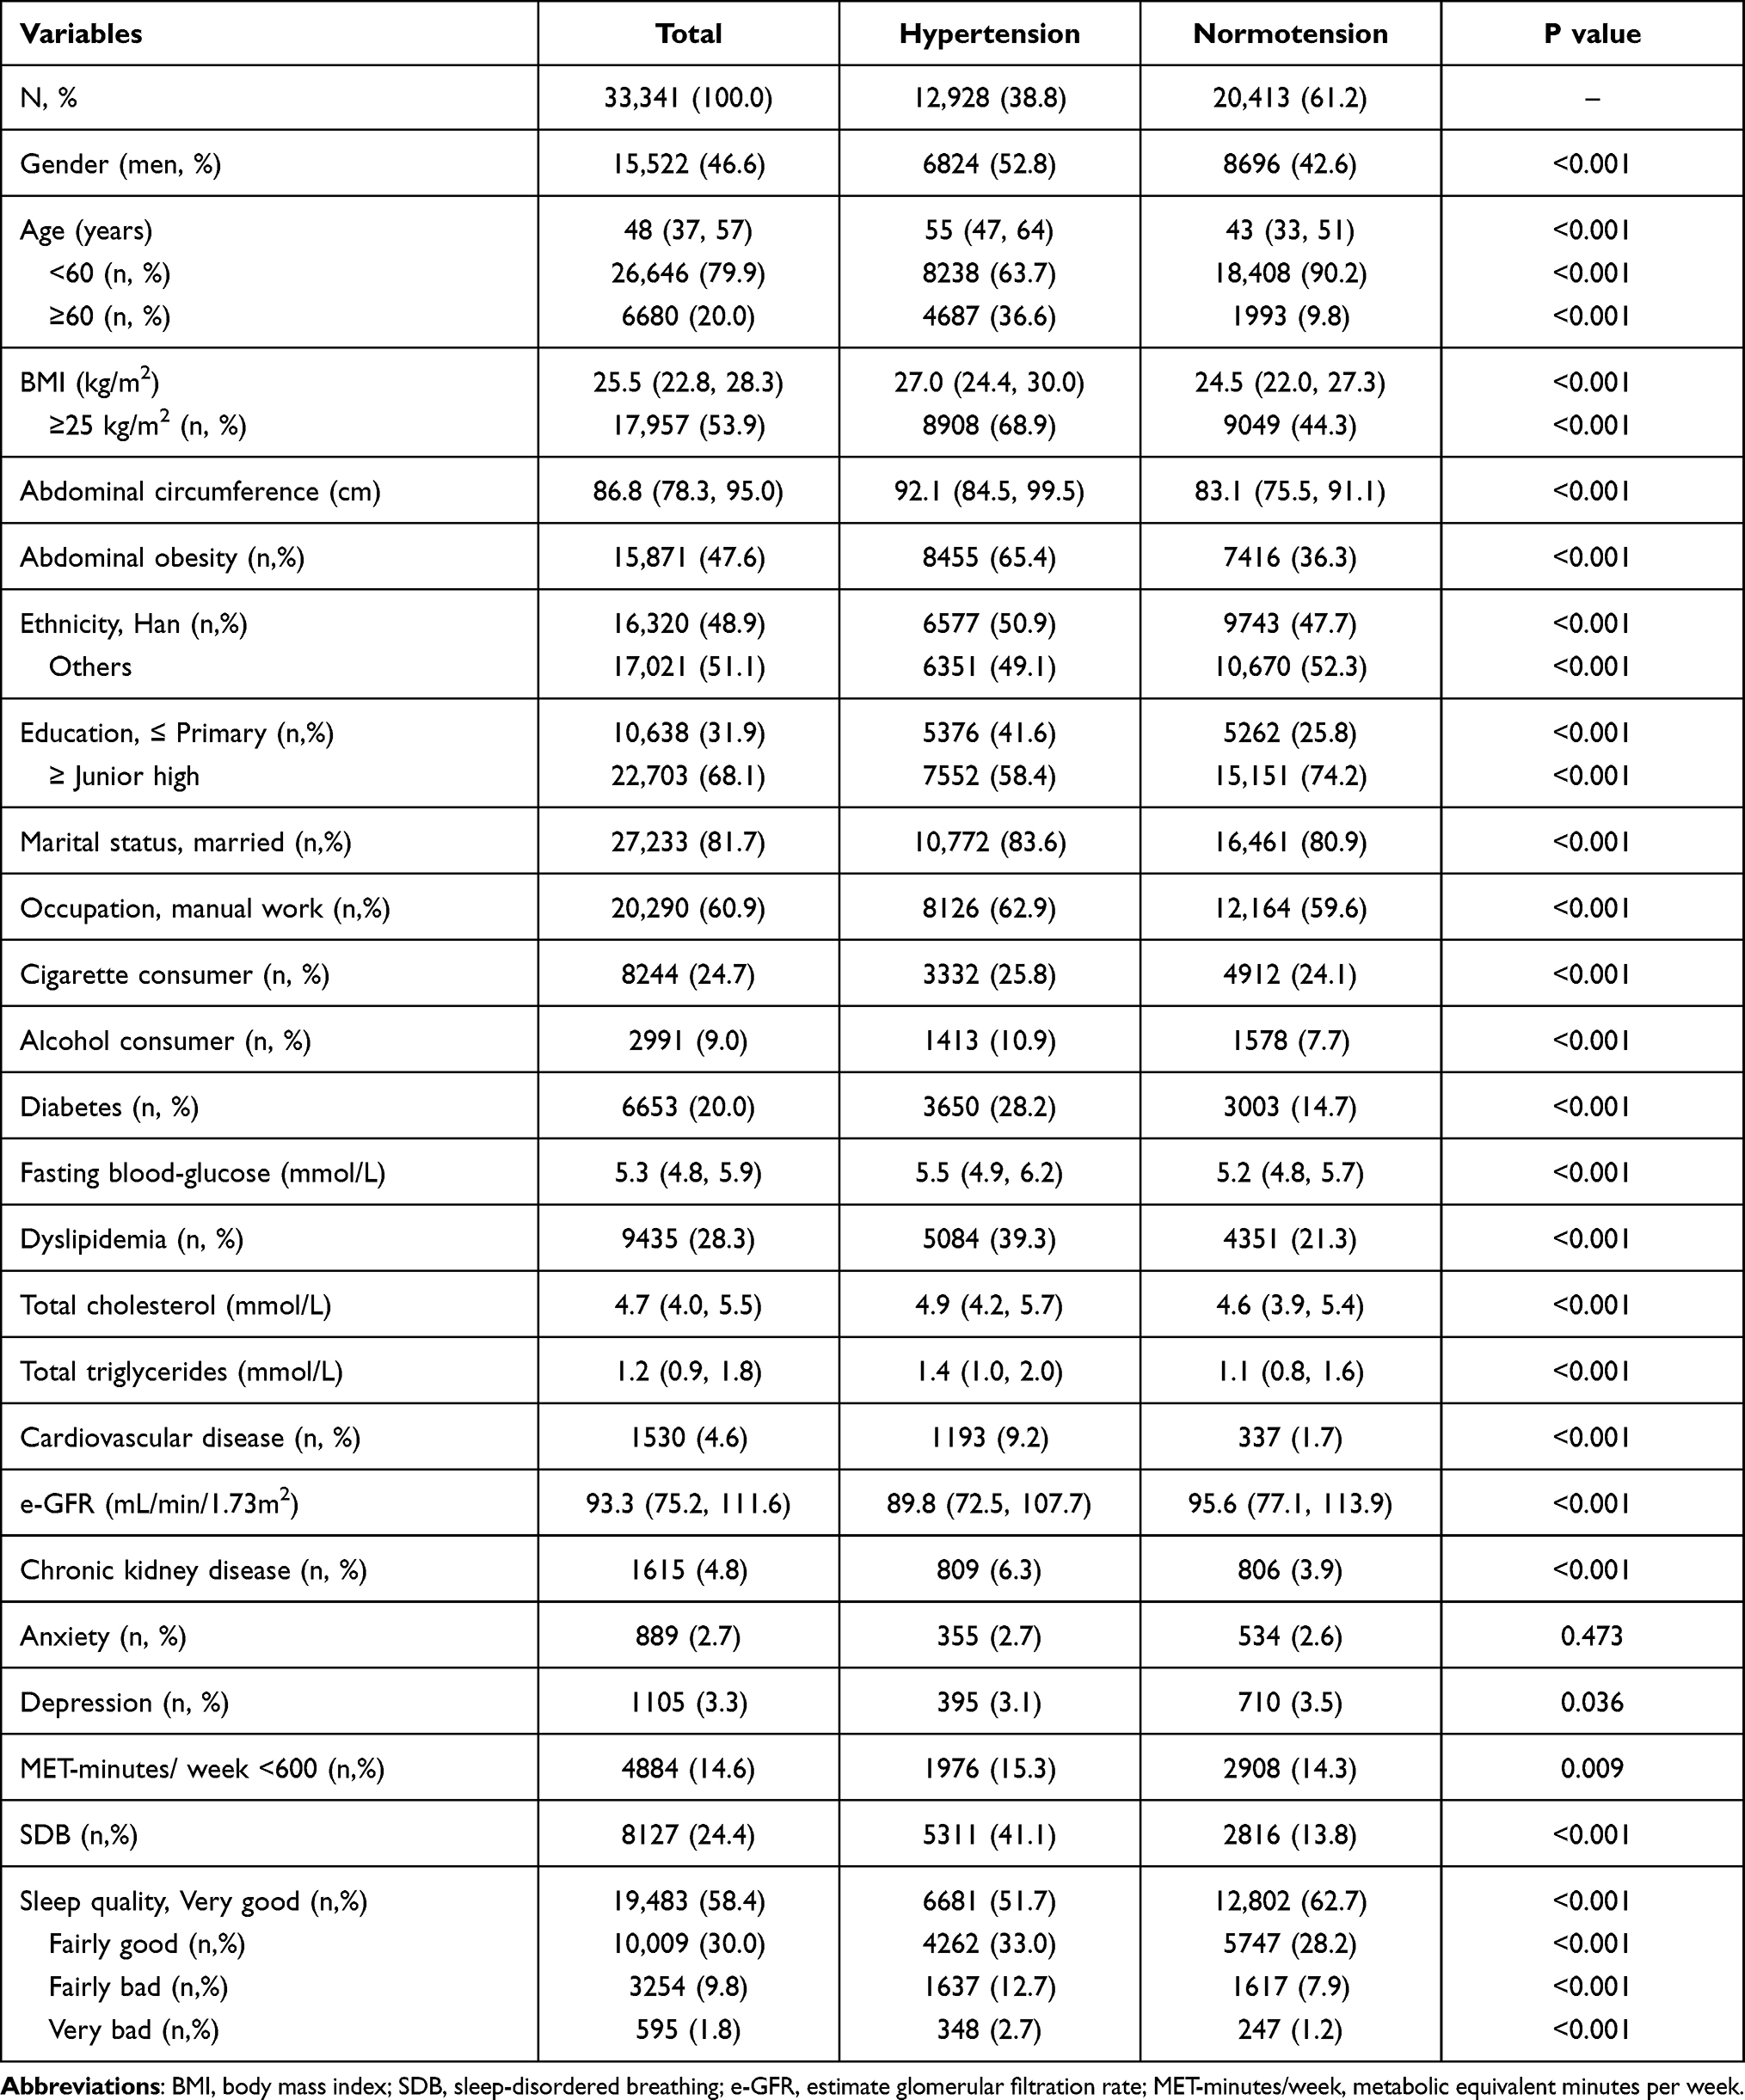 |
Table 1 Characteristics of Study Participants by Presence of Hypertension |
Prevalence of Hypertension and BP in Different Sleep Quality Groups
As shown in Table 2, prevalence of hypertension was 38.8%, and the median SBP and DBP was 123 mmHg and 79 mmHg in total population. Prevalence of hypertension increased significantly from very good to very bad sleep quality groups (very good vs fairly good vs fairly bad vs very bad: 34.3 vs 42.6 vs 50.3 vs 58.5%) in total, in SDB (61.2 vs 68.3 vs 73.3 vs 75.5%) and non-SDB (26.8 vs 33.1 vs 40.1 vs 50.9%) participants (P for all <0.001).
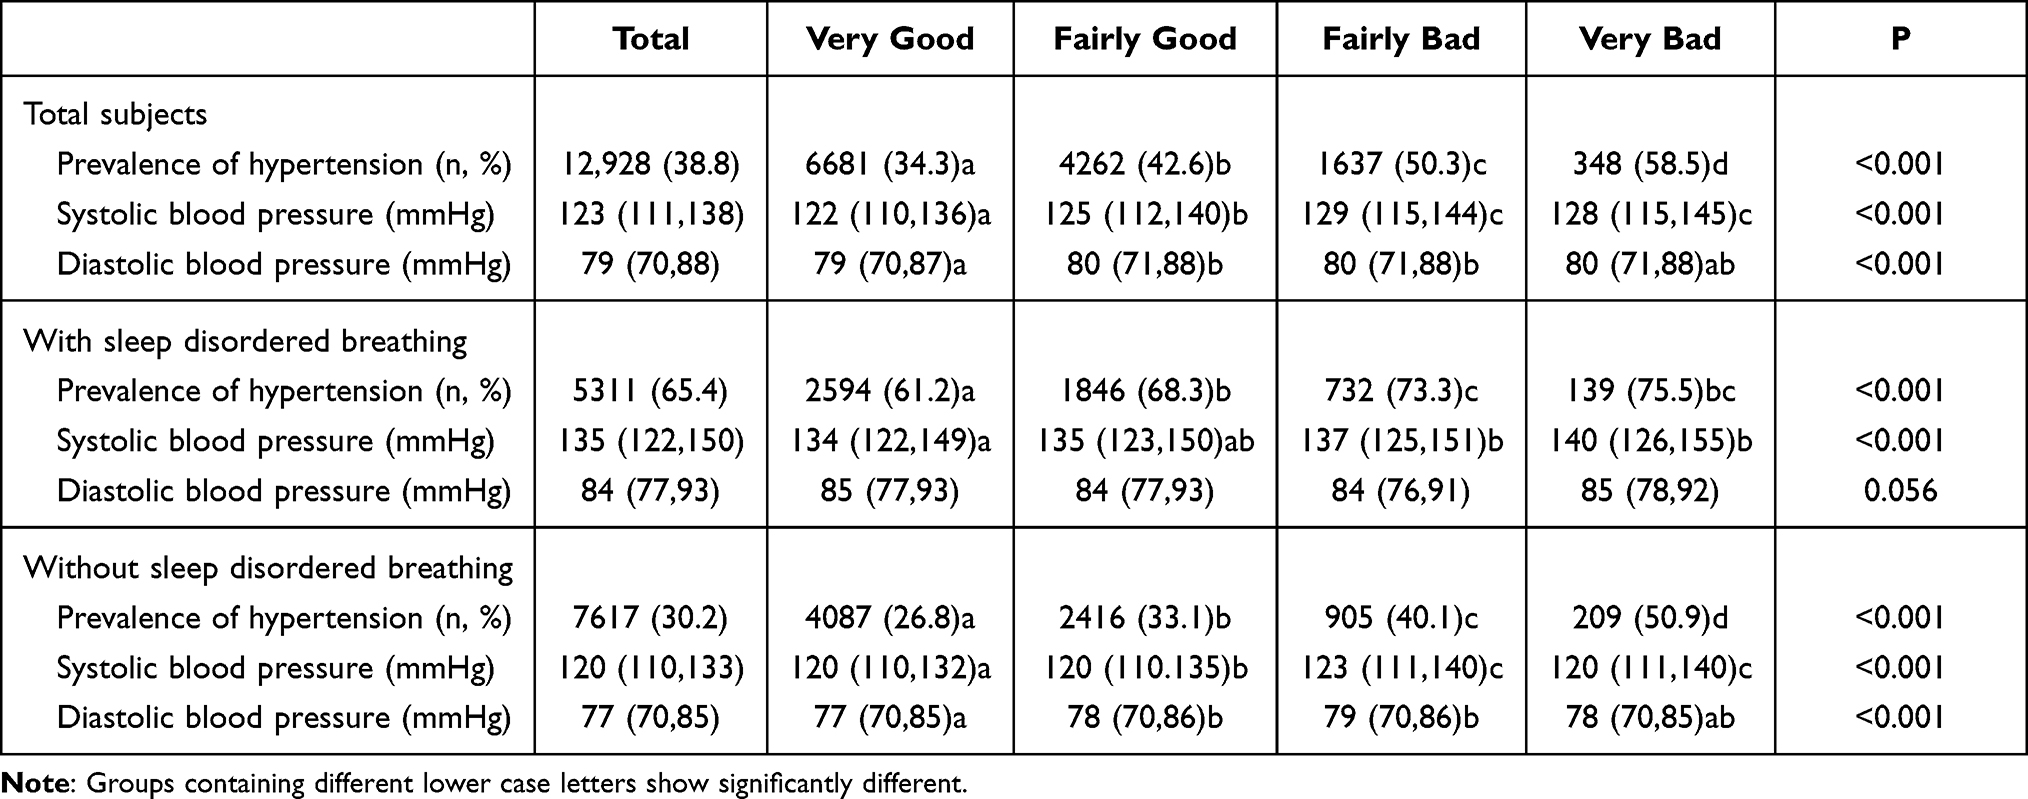 |
Table 2 Comparison of Prevalent Hypertension and Blood Pressure by Sleep Quality in Total and Stratified Population by Sleep Disordered Breathing |
Average SBP also showed an increasing trend from very good to very bad sleepers in total (122 vs 125 vs 129 vs 128 mmHg), and in SDB (134 vs 135/ vs 137 vs 140 mmHg) participants (P for all <0.001).
DAG Results
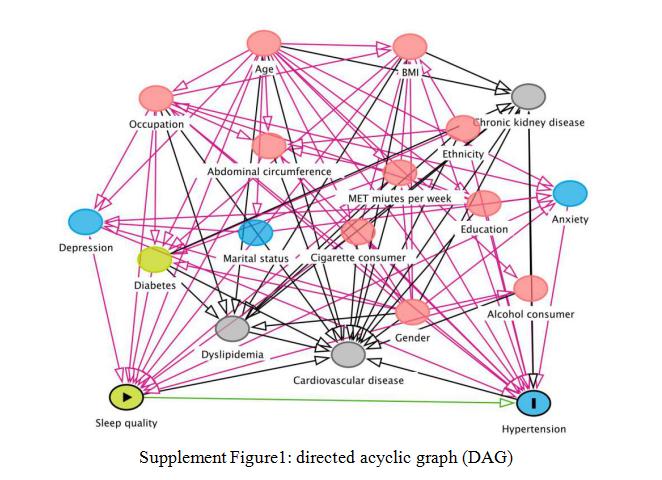
DAG analysis obtained the minimal sufficient adjustment sets, which included gender, BMI, abdominal circumference, alcohol intake, cigarette consumption, occupation, education, MET minutes per week, anxiety, depression, and diabetes (Supplemental Figure 1).
Relationship Between PSQI Global Score and BP
As shown in Table 3, PSQI global score showed a significant positive association with both SBP and DBP in total (SBP: B, 95% CI: 0.45, 0.38–0.51; DBP: B, 95% CI: 0.15, 0.11–0.18), and in non-SDB (SBP B, 95% CI: 0.40, 0.33–0.47; DBP: 0.15, 0.11–0.20) participants, even after adjusting for the minimal sufficient adjustment sets obtained by DAG (P for all <0.001, model 1) and showed a marginally positive association only in SDB participants (B, 95% CI: 0.14, 0.00–0.28, P = 0.051). Nonetheless, inclusion of age into the model diminished the association (model 2). In fully adjusted model (model 3) of variables with significant difference between hypertensive and non-hypertensive groups, PSQI global score was only associated with SBP marginally in total participants (SBP: B, 95% CI: −0.06, −0.12,0.00, P = 0.061) and significantly in non-SDB participants (SBP: B, 95% CI: −0.09, −0.07,0.01, P = 0.013).
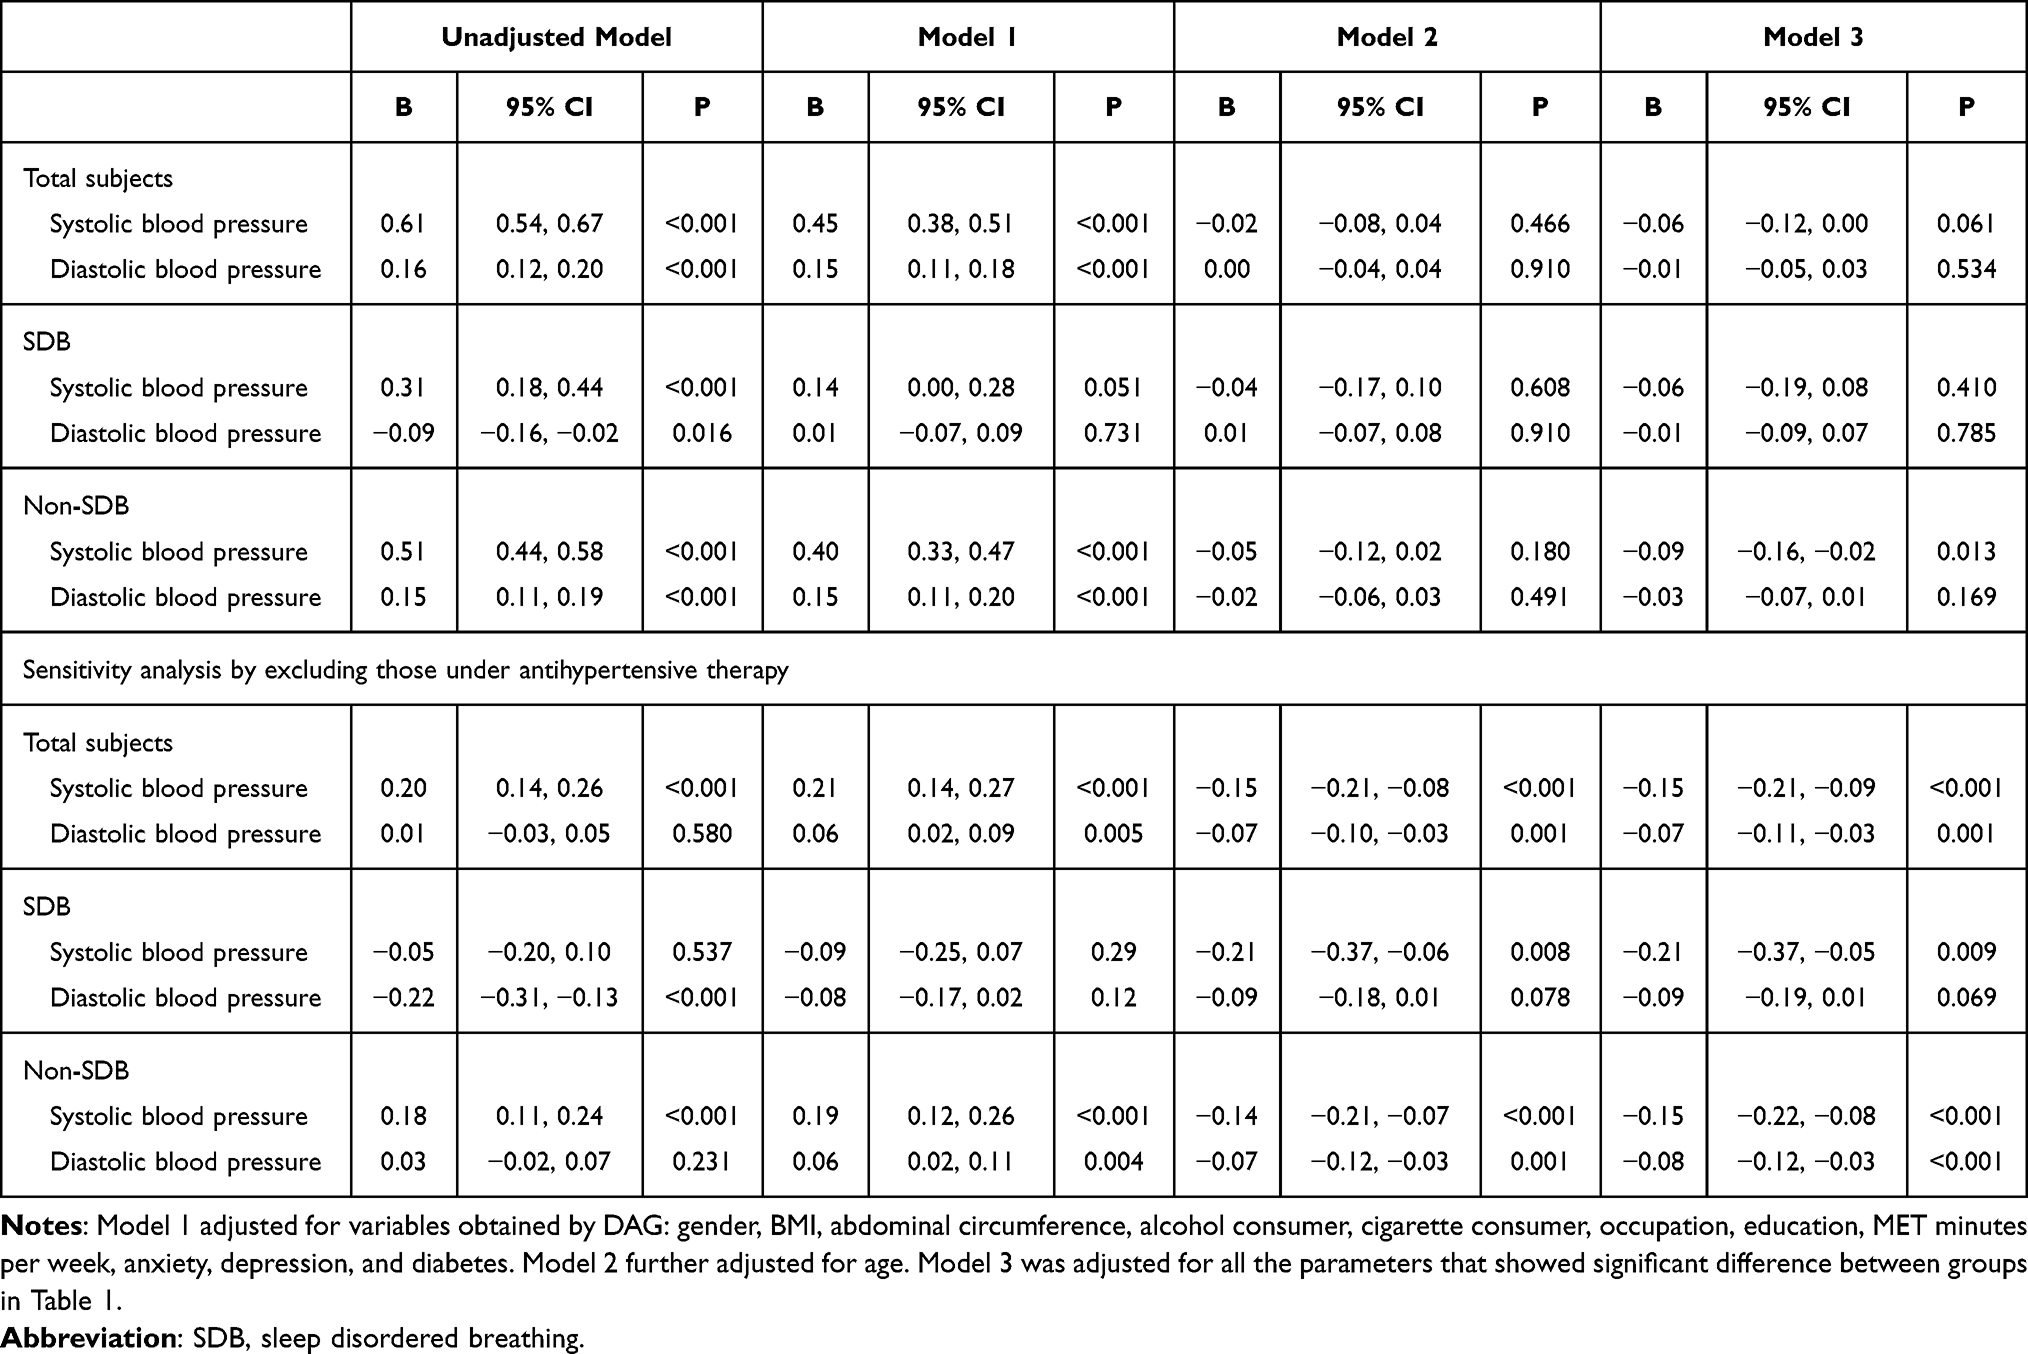 |
Table 3 Linear Regression Analysis for the Relation of PSQI Global Score and Blood Pressure in Total Participants and Stratification by Presence of SDB and Sensitivity Analysis by Excluding Participants taking Antihypertensives |
In sensitivity analysis by excluding those under antihypertensive therapy, PSQI global score had a significant positive association with SBP in total (model 1, 2 and 3), SDB (model 2 and 3) and non-SDB participants (model 1, 2 and 3) and with DBP in total (model 1, 2 and 3), and in non-SDB (model 1, 2 and 3) participants.
Given in Table 4, multiple linear regression was performed for further stratification by age. Model 1 was adjusted for variables obtained using DAG. Model 2 was adjusted for all the variables with significant differences between the two groups in Table 1. In the participants aged <60 years, PSQI global score was also in positive association with SBP in total (model 1 and 2), SDB (model 1) and in non SDB (model 1 and 2) participants, and with DBP in total (model 1 and 2), and in non-SDB participants (model 1 and 2), whereas not in the participants aged ≥60 years.
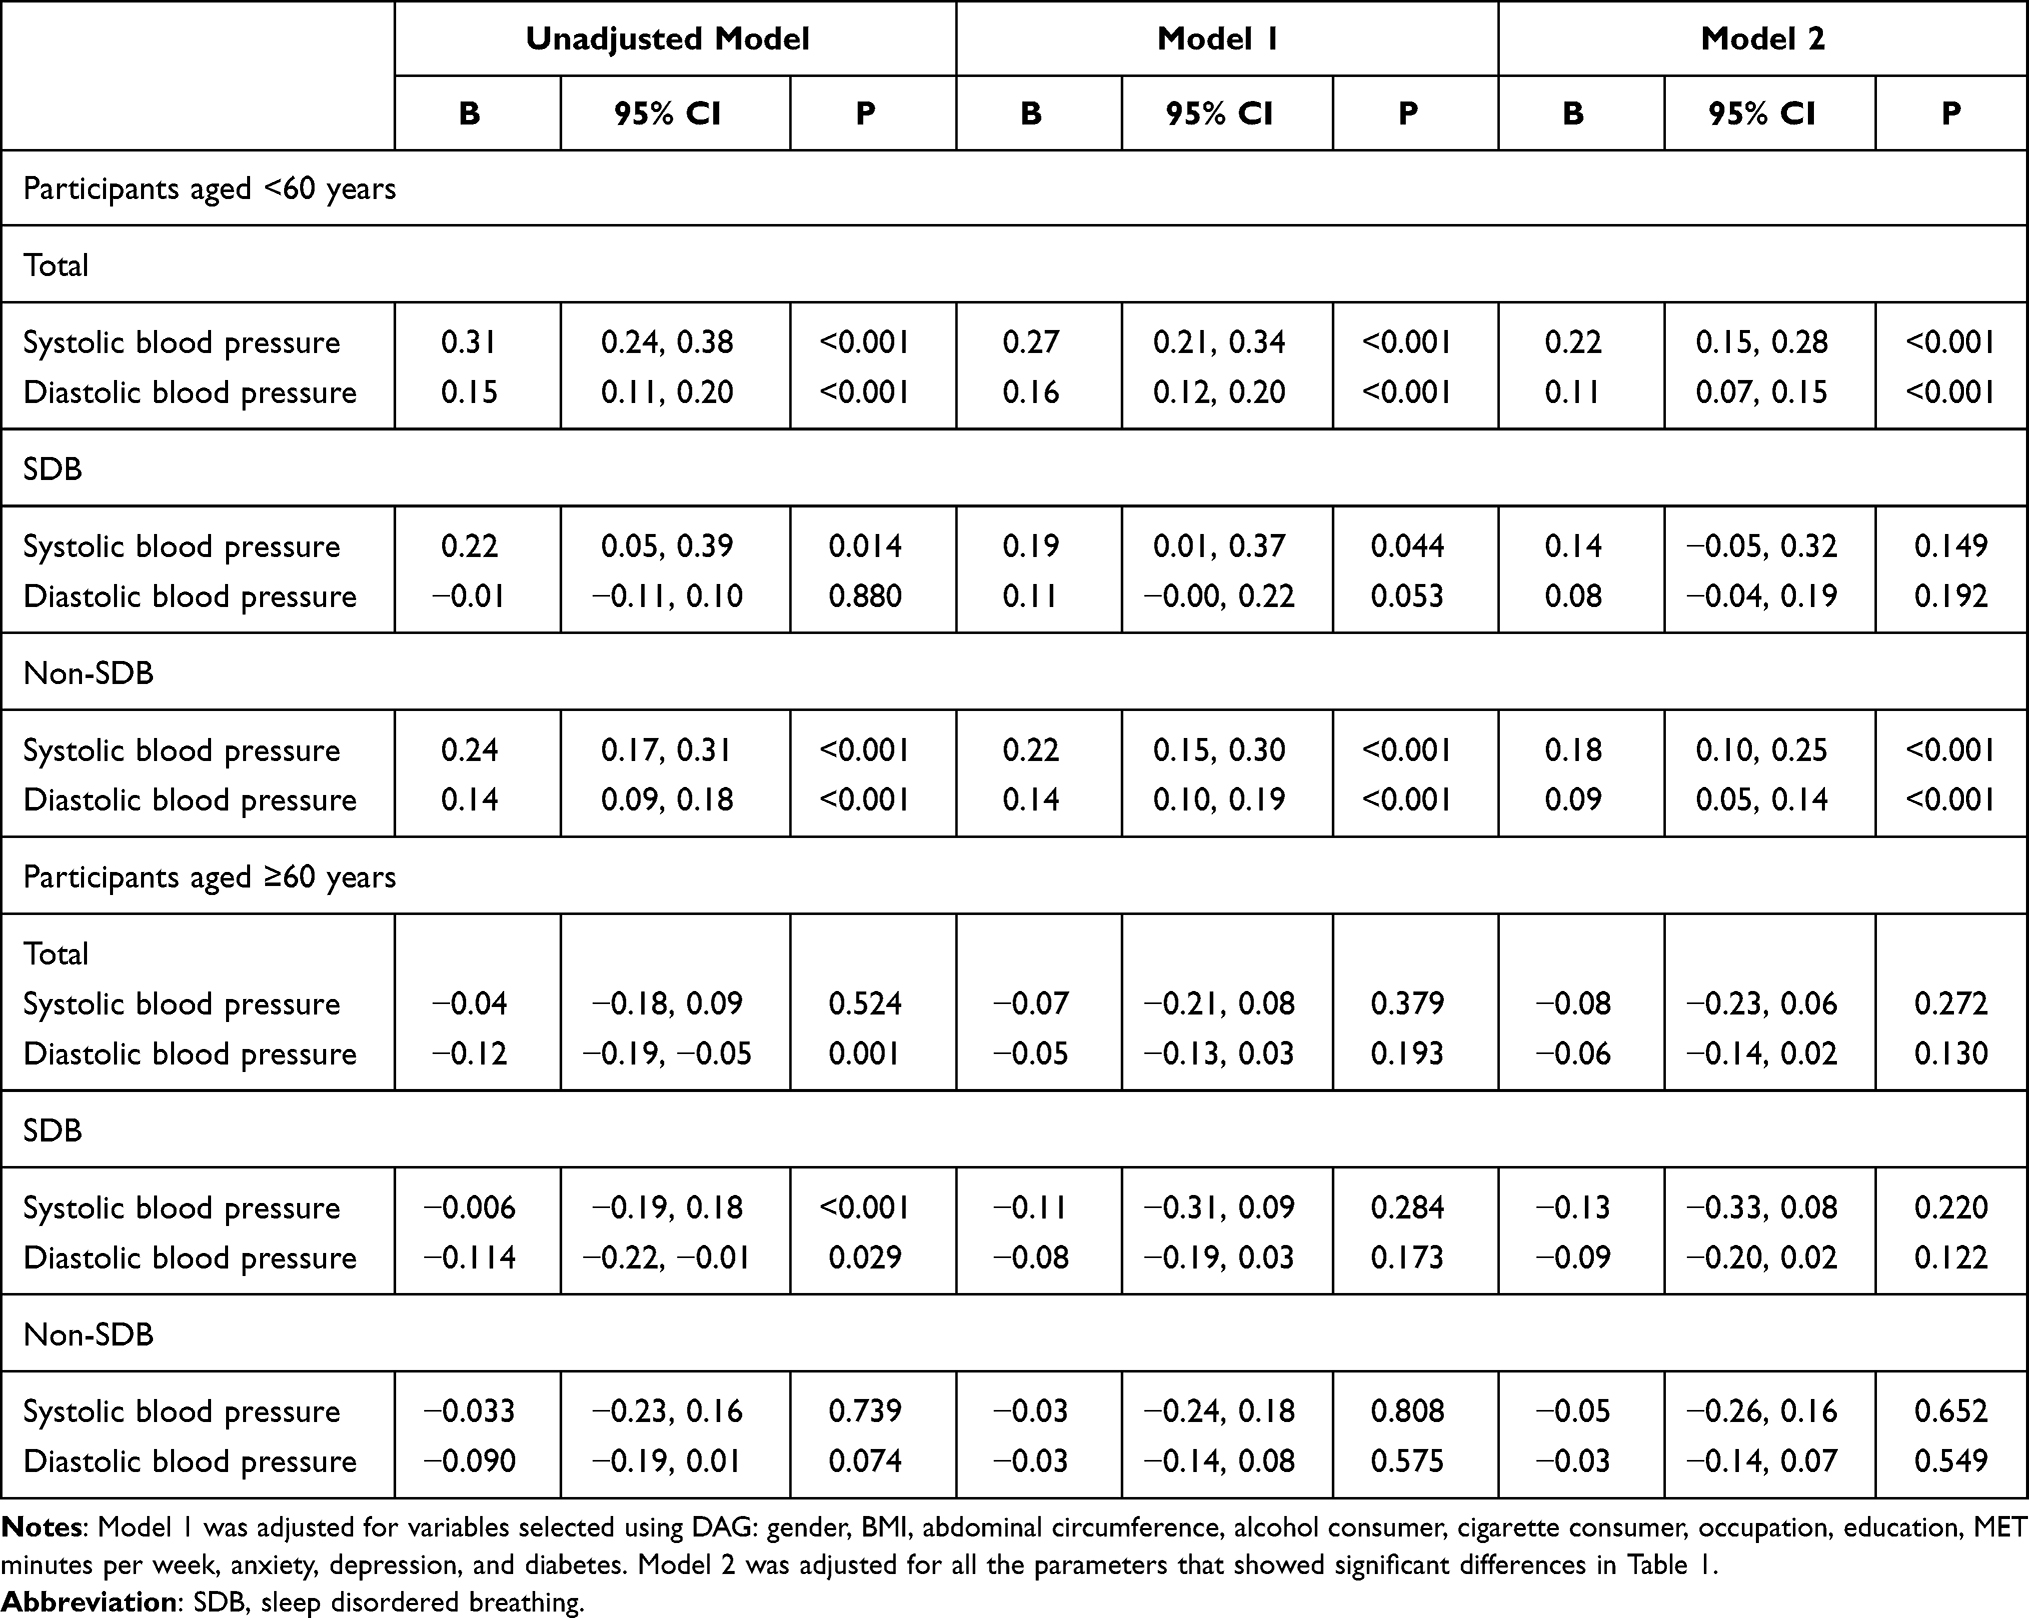 |
Table 4 Linear Regression Analysis for PSQI Score and Blood Pressure in Total and Stratified Participants by Age and by Presence of SDB |
Relationship Between Sleep Quality and Presence of Hypertension
As shown in Table 5, compared with very good sleepers, fairly good, fairly bad and very bad sleepers showed significantly increased ORs for presence of hypertension in model 1 (OR = 1.34, 1.80 and 2.34), in model 2 further adjusted for age (OR = 1.08, 1.22 and 1.48) and fully adjusted model 3 (OR = 1.05, 1.14 and 1.30) for total participants; in model 1 (OR = 1.30, 1.51 and 1.53), partly in model 2 (only in fairly good and fairly bad sleepers, OR = 1.17 and 1.35) and partly in model 3 (only in fairly good and fairly bad sleepers, OR = 1.12 and 1.27) for SDB participants; and in model 1 (OR = 1.28, 1.71 and 2.44), partly in model 2 (OR = 1.14 and 1.53) and partly in model 3 (only in very bad sleepers, OR = 1.36) for non-SDB participants. P for trend was significant in total, SDB and non-SDB participants.
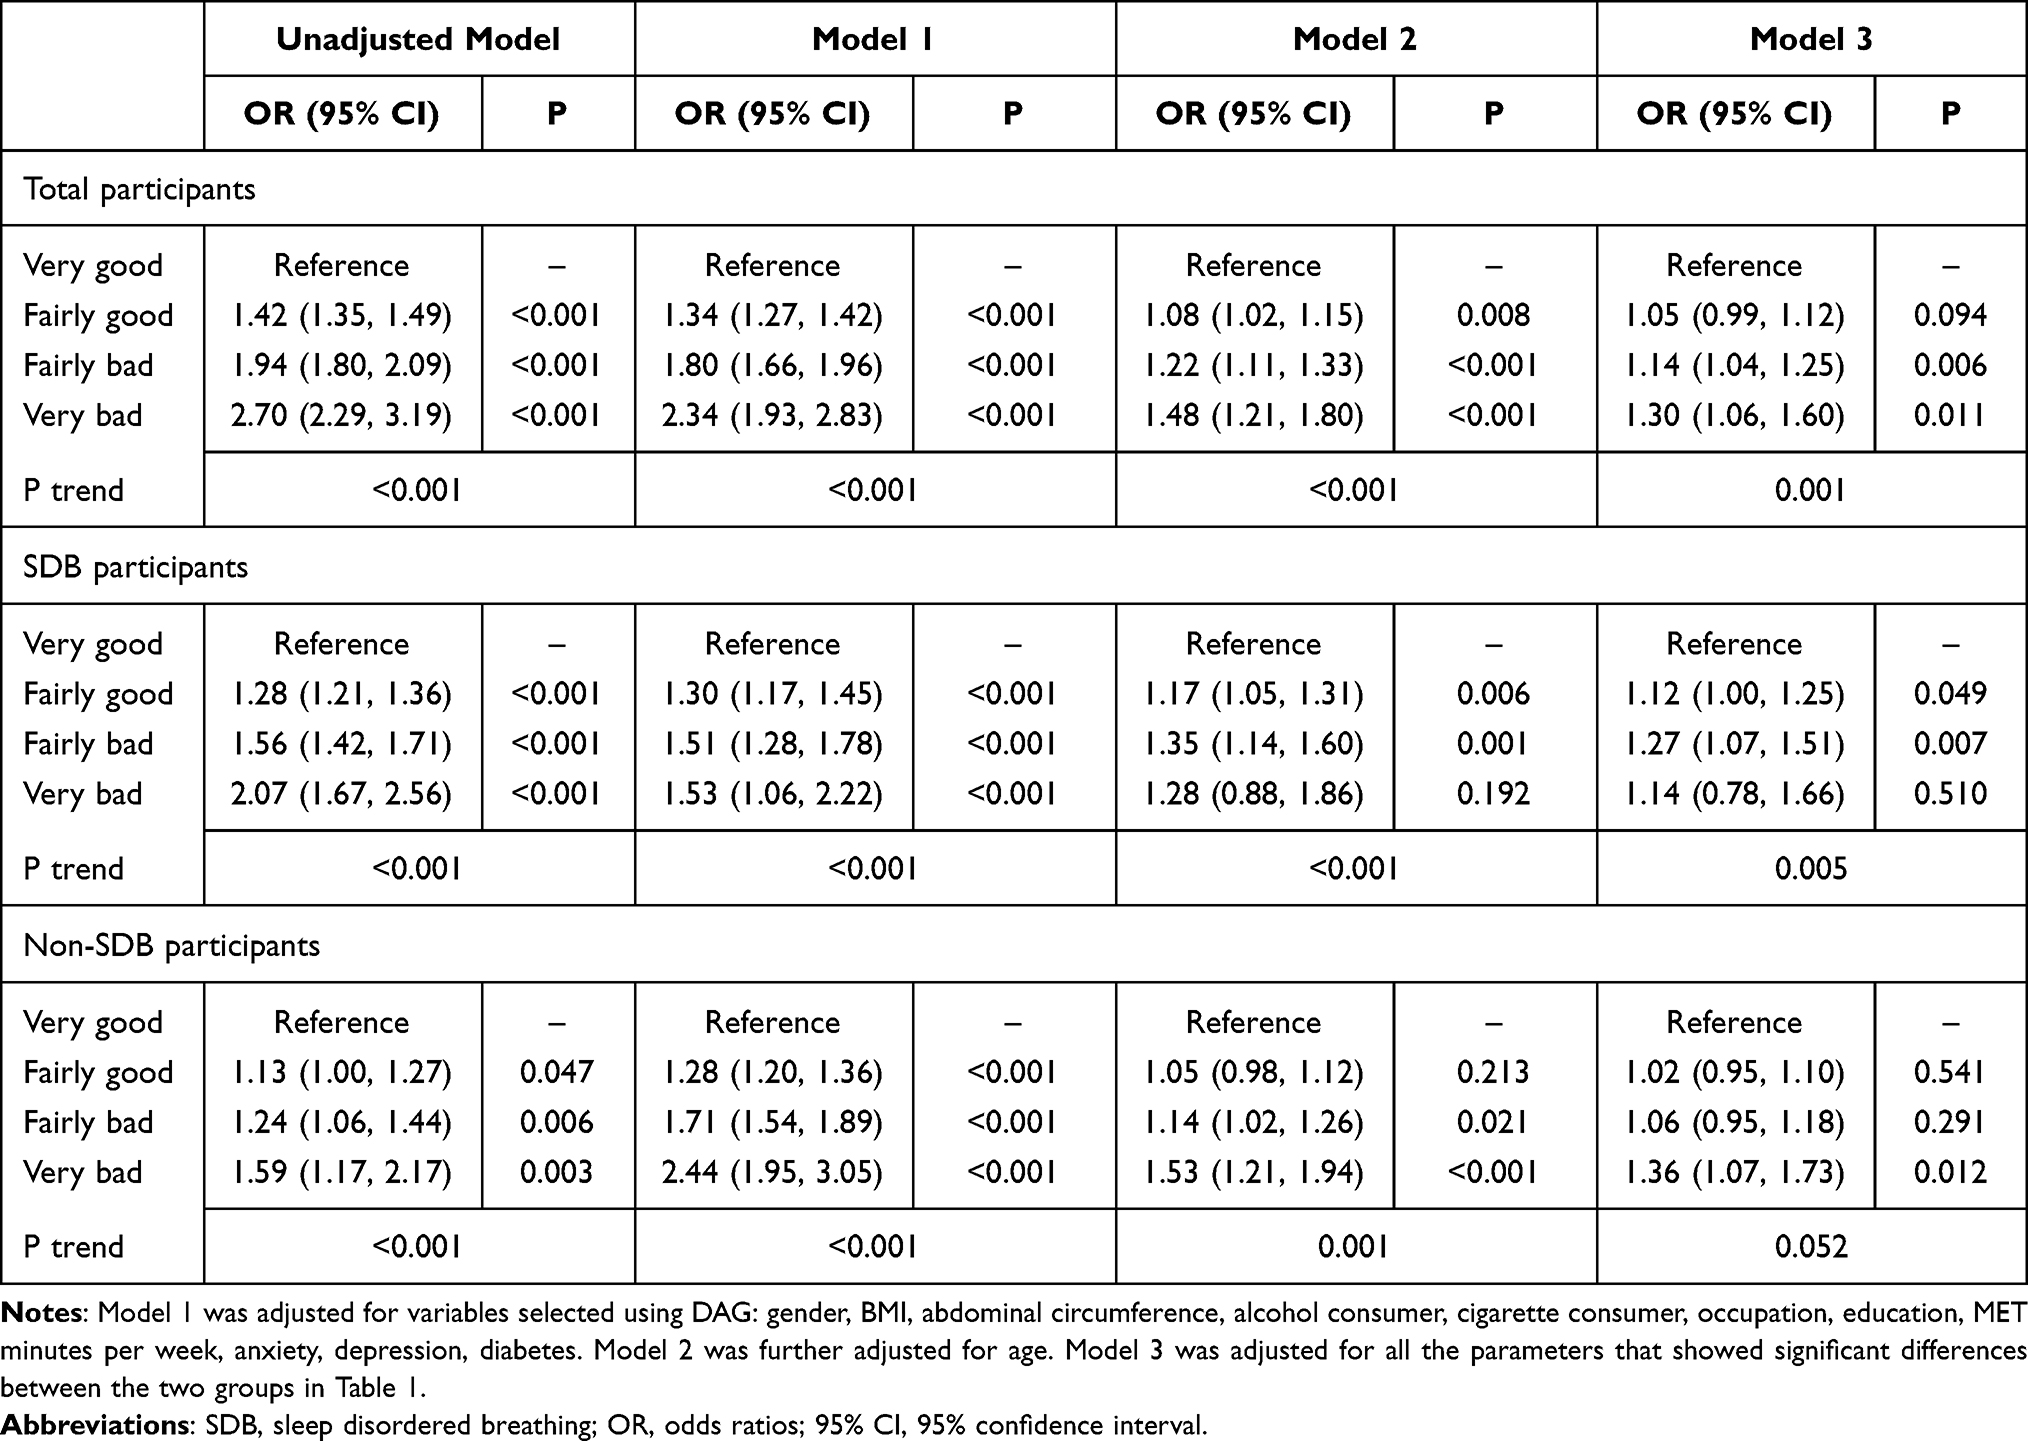 |
Table 5 Relationship of Subjective Sleep Quality with Presence of Hypertension in Total, SDB and Non-SDB Participants |
As shown in Table 6, we performed multivariable logistic regression in participants aged <60 years and ≥60 years respectively. Model 1 was adjusted for variables obtained using DAG. Model 2 was adjusted for all the variables with significant differences between hypertensive and normotensive participants in Table 1.
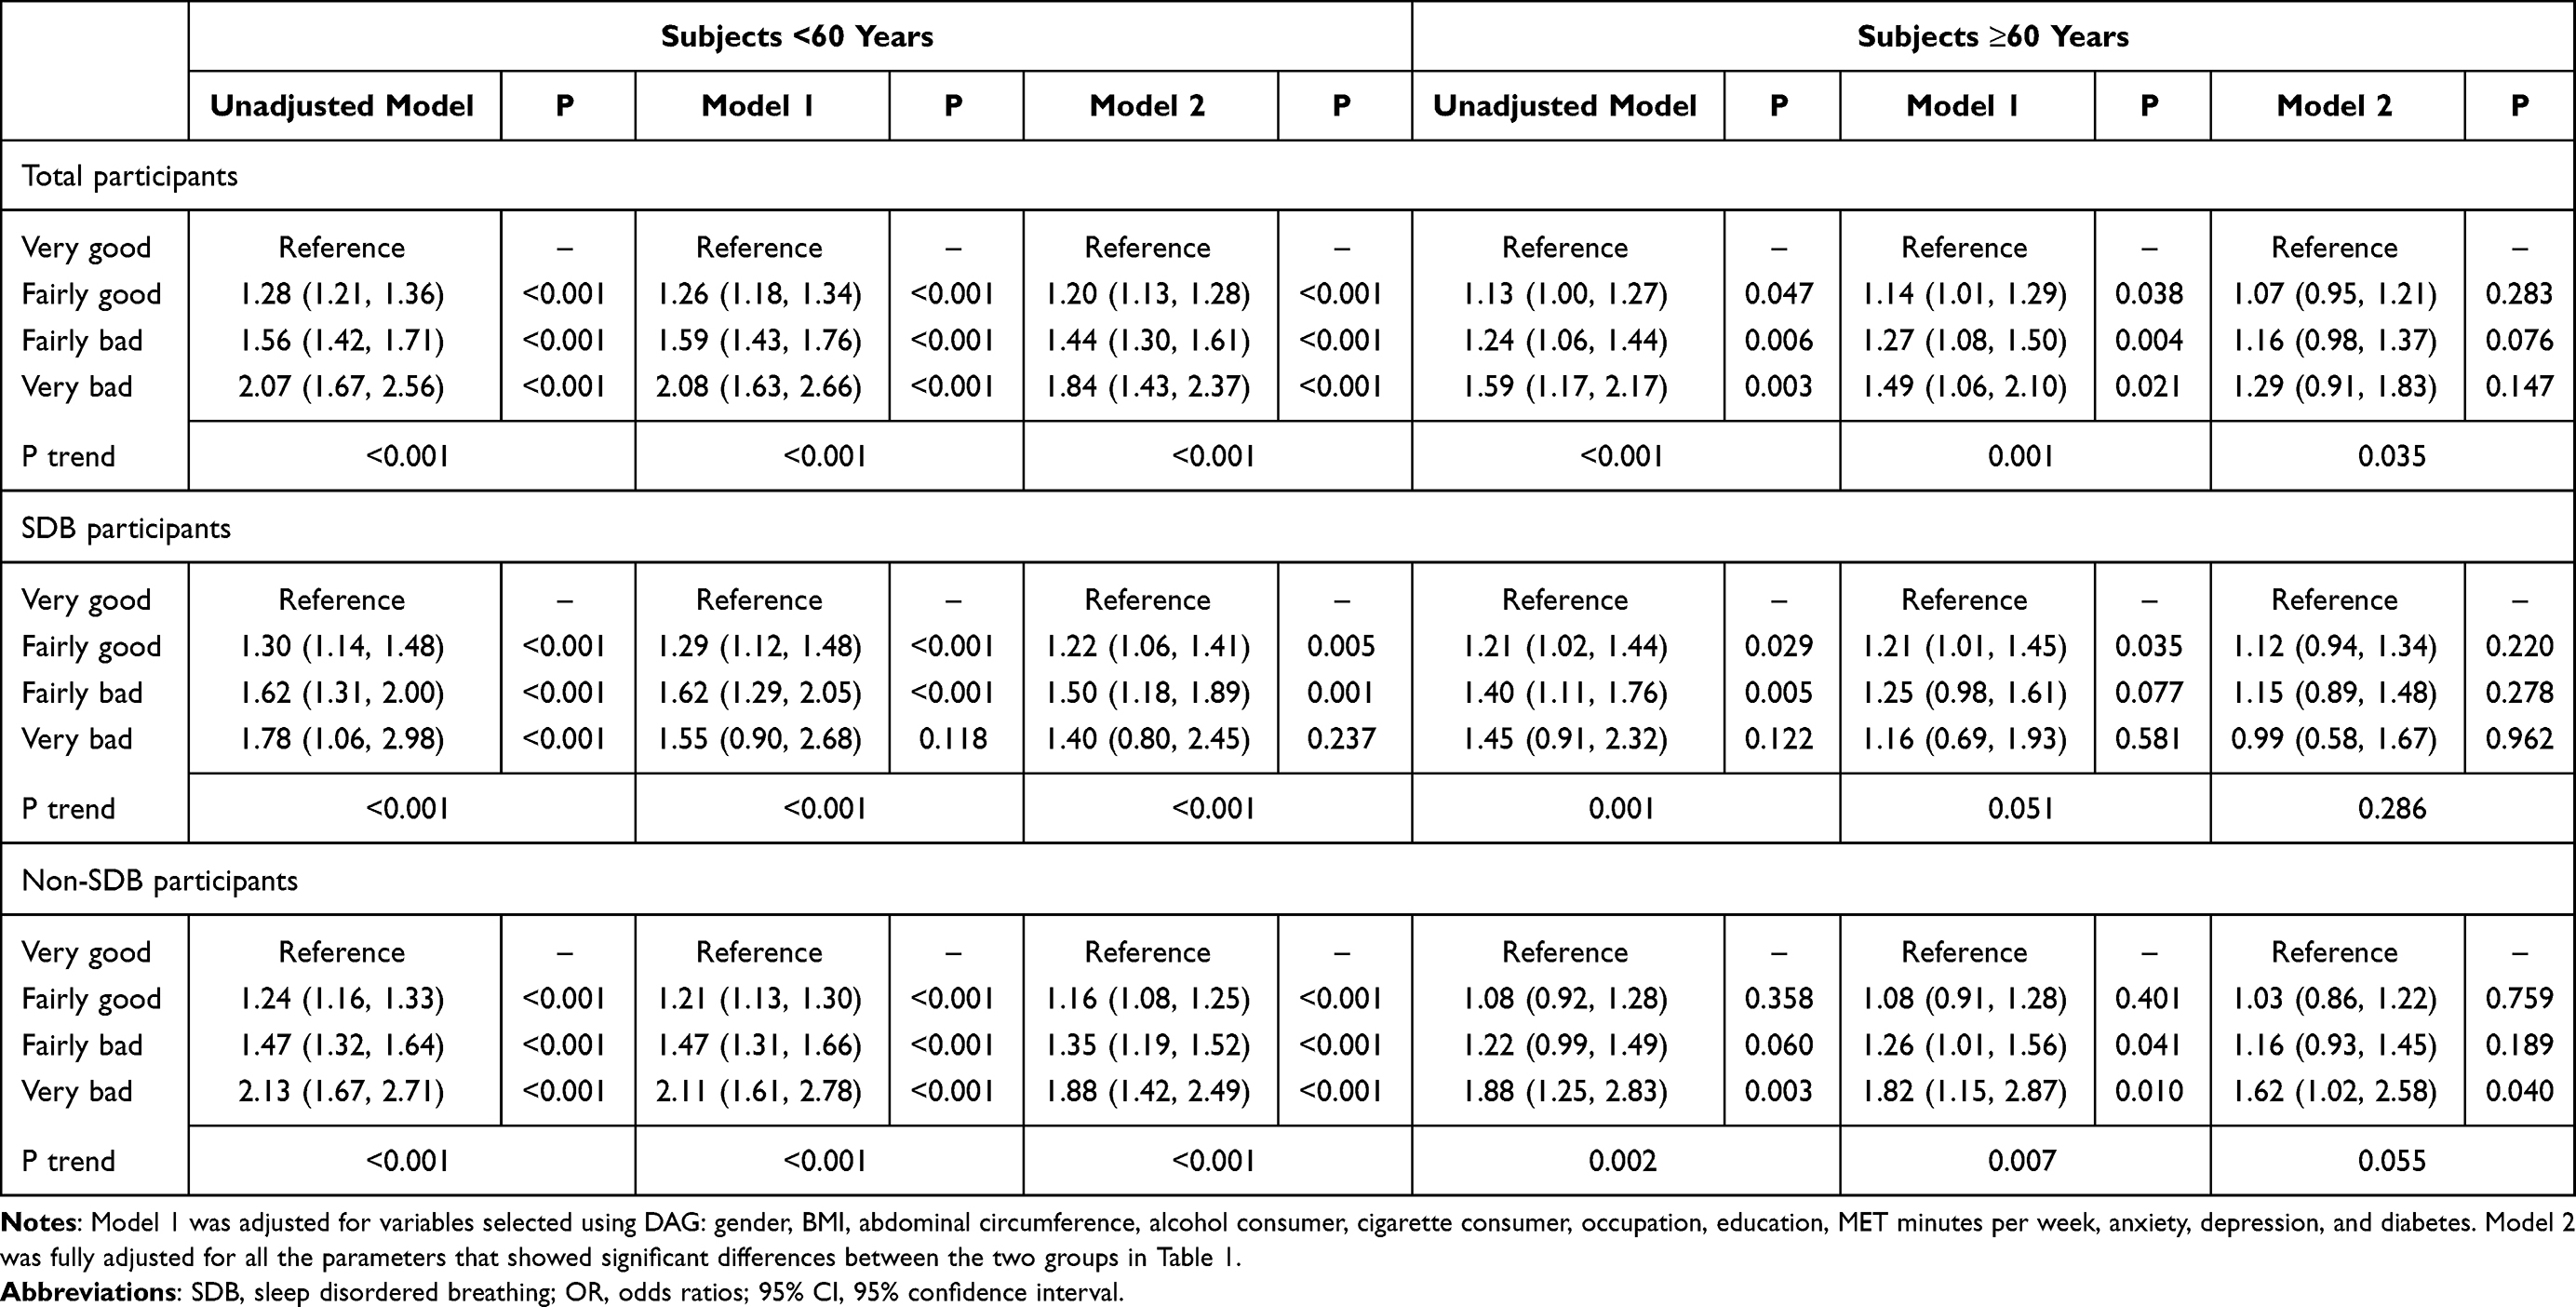 |
Table 6 Relationship of Subjective Sleep Quality with Presence of Hypertension in Total, SDB and Non-SDB Participants Stratified by Age (OR, 95% CI) |
In the participants aged <60 years, compared with very good sleepers, ORs for presence of hypertension increased from very good to very bad sleepers totally in model 1 and 2 for total participants, in model 1 and 2 for non-SDB participants and partly in model 1 and 2 for SDB participants (in fairly good and fairly bad sleepers). In those aged ≥60 years, compared with very good sleepers, ORs for presence of hypertension increased from very good to very bad sleepers only in model 1 for total participants and in fairly good sleepers in model 1 for SDB participants and and in fairly bad and very bad sleepers in non-SDB participants.
Discussion
We explored the association of subjective sleep quality with BP and prevalent hypertension considering SDB and age as confounders in a relatively large multi-ethnic population with a wide age range using a cross-sectional design.
Main observations encompass: First, prevalence of hypertension significantly increased from very good to very bad sleepers in total (very good vs fairly good vs fairly bad vs very bad: 34.3 vs 42.6 vs 50.3 vs 58.5%), SDB (61.2 vs 68.3 vs 73.3 vs 75.5%) and non-SDB participants (26.8 vs 33.1 vs 40.1 vs 50.9%). Second, in multiple linear regression, PSQI global score showed significant positive association with BP levels in total, SDB and non-SDB participants, which remained significant in sensitivity analysis by excluding those taking antihypertensives. In age-stratified multiple linear regression, positive relationship of PSQI global score with BP was significant in total, SDB and non-SDB participants among population aged <60 years but not in those aged ≥60 years. Third, in multivariable logistic regression, ORs for presence of hypertension significantly increased from very good to very bad sleepers in total (1 vs 1.08 vs 1.22 vs 1.48), SDB (1 vs 1.17 vs 1.35 vs 1.28) and non-SDB participants (1 vs 1.05 vs 1.14 vs 1.53), with consistency in those aged <60 years, but not in SDB participants although with a trend in the participants aged ≥60 years.
Observations from the current study may add some evidence on on-going uncertainty between subjective poor sleep quality and BP and hypertension. Supportive of the current results, a recent meta-analysis of cross-sectional, cohort, and case control studies reports a positive association between poor sleep quality and hypertension presence.4 Nonetheless, previous studies failed to consider the potential bias brought by SDB and age to the association of sleep quality and hypertension.8–16,28 In the current study, prevalence of hypertension and ORs for presence of hypertension significantly increased from very good to very bad sleepers in total participants, and in those with and without SDB. However, the independent association between sleep quality and hypertension presence diminishes the significance and directionality in subjects with SDB in those aged ≥60 years. Based on previous reports, prevalence of SDB in the older population reaches as high as 80%,26,27 which may outweigh poor sleep quality in terms of affecting hypertension development. However, further research is needed in this specific population.
Another important aspect of the current study is that we also assessed the association of subjective sleep quality and BP levels by considering the effects of SDB, age and anti-hypertensive intake. Average SBP, but not DBP, shows a significant increasing trend from very good to very bad sleep quality and when SDB is present or not. PSQI global score showed a positive correlation with both SBP and DBP in total participants aged <60 years independent of SDB presence in multiple linear regression and with overall consistency in sensitivity analysis by excluding those under antihypertensive treatment. In a meta-analysis of previous studies, the average SBP and DBP are higher for poor sleepers, whereas the difference does not reach statistical significance. Authors conclude only few studies assessed the association of sleep quality and BP and the smaller sample size might have been insufficient for the detection of statistically significant results.4 In addition, current existing data did not consider the potential effects of SDB on the relation of subjective poor sleep quality and BP,4,8–11 although there is an association between shorter sleep duration and higher 24-hour SBP, independent of OSA, in prehypertensive adults.6
One of the most important differences of the current study compared with previous ones is that we included SDB as a confounder. SDB is relatively highly prevalent and is one of the main risk factors for both poor sleep quality and hypertension. Studies reported that prevalence of poor sleep quality ranges from 31.85% to 39.4% in different adult populations.43 In addition, the treatment of sleep quality and SDB is obviously different. A study from the US showed brief and personalized online sleep education interventions can improve sleep behaviors, sleep quality, and depression scores.44 Therefore, the existence of an independent association between poor sleep quality and BP and hypertension presence in subjects aged <60 years independent of SDB presence and anti-hypertensive treatment in the current study may have broader implications that improvement of sleep quality at population level may lower BP and optimize hypertension management.
Several strengths merit this study as follow: First, this is one of the few large-scale population-based epidemiological studies to explore the association of subjective sleep quality with BP and hypertension involving SDB. Second, multiple confounders have been adjusted in the study such as SDB, depression, anxiety, renal function, and physical activity, which were previously proven to be associated with sleep quality and hypertension. In addition, DAG graph was used to select necessary variables to be adjusted in regression analysis. Furthermore, with a multistage proportional random sampling method, participants in this survey are in a wide age range of both genders from a multi-ethnic general population and the results can be applied to the general population. However, some limitations should also be considered, while explaining the data. First, the cross-sectional nature of the study limits causality of the association between sleep quality and hypertension. Nonetheless, most of the current results are consistent with existing evidence. Second, PSQI survey, rather than the golden standard of polysomnography, was used for sleep quality assessment. PSQI is a popular reliable and valid instrument because of its high internal consistency (α=0.83), test-retest reliability (r = 0.85), and moderate structural validity identifying poor sleepers in clinical and nonclinical populations.4 PSQI global score shows moderate associations with some objective sleep quality indexes.45 Third, we assessed SDB using the NoSAS scale, a subjective method, which may have brought some bias to the prevalence of SDB found in this study. However, it is not feasible to perform objective measurements such as polysomnography due to their expensive, time-consuming nature and high technical dependence. In addition, No-SAS scale has a sensitivity of 79% and specificity of 69% for SDB assessment and is validated in the Chinese population.33,34 Therefore, we consider the current results still have some reliability.
In conclusion, poor subjective sleep quality is significantly associated with higher BP and prevalent hypertension, independent of SDB in the young- and middle-aged general population, indicating the potential of improving sleep quality at population level to lower BP and optimize hypertension management.
Abbreviations
BP, blood pressure; BMI, body mass index; CIs, confidence intervals; DBP, diastolic blood pressure; DAG, directed acyclic graph; GPAQ, Global Physical Activity Questionnaire; MET, metabolic equivalent; OSA, obstructive sleep apnea; PSQI, Pittsburgh Sleep Quality Index; SDB, sleep disordered breathing; SAS, self-rating anxiety scale questionnaires; SDS, self rating depression scale questionnaires; SBP, systolic blood pressure; WHO, World Health Organization.
Data Sharing Statement
Data can be made available on reasonable request.
Ethics Approval and Informed Consent
Independent Ethics Committee of People’s Hospital of Xinjiang Uygur Autonomous Region approved the current study (2018.014). Signed informed consent was obtained from all of the eligible participants.
Acknowledgments
The authors thank the staff and all the participants involved in this study for their critical contributions. Zhikang Yang and Mulalibieke Heizhati are co-first authors for this study.
Funding
The study was funded by grants from Xinjiang Uygur Autonomous Region Regional Collaborative Innovation Project (SCO Science and Technology Partnership programme and International Science and technology Cooperation Programme) (2018E01014) and National Key Research and Development Program (Study on the appropriate techniques for hypertension prevention and control and the establishment and demonstration application of management platform) (2018YFC1311503).
Disclosure
The authors have declared that no conflict of interest exists.
References
1. World Health Organization. A global brief on hypertension. Geneva: World Health Organization; 2013.
2. Lackland DT, Weber MA. Global burden of cardiovascular disease and stroke: hypertension at the core. Can J Cardiol. 2015;31(5):569–571. doi:10.1016/j.cjca.2015.01.009
3. Kearney PM, Whelton M, Reynolds K, et al. Global burden of hypertension: analysis of worldwide data. Lancet. 2005;365(9455):217–223. doi:10.1016/S0140-6736(05)17741-1
4. Lo K, Woo B, Wong M, Tam W. Subjective sleep quality, blood pressure, and hypertension: a meta-analysis. J Clin Hypertens. 2018;20(3):592–605. doi:10.1111/jch.13220
5. Doyle CY, Ruiz JM, Taylor DJ, et al. Associations between objective sleep and ambulatory blood pressure in a community sample. Psychosom Med. 2019;81(6):545–556. doi:10.1097/PSY.0000000000000711
6. Shulman R, Cohen DL, Grandner MA, et al. Sleep duration and 24-hour ambulatory blood pressure in adults not on antihypertensive medications. J Clin Hypertens. 2018;20(12):1712–1720. doi:10.1111/jch.13416
7. Abdalla M, Schwartz JE, Cornelius T, Chang BP, Alcántara C, Shechter A. Objective short sleep duration and 24-hour blood pressure. Int J Cardiol Hypertens. 2020;7:100062. doi:10.1016/j.ijchy.2020.100062
8. Sforza E, Saint Martin M, Barthelemy JC, Roche F. Association of self reported sleep and hypertension in non- insomniac elderly subjects. J Clin Sleep Med. 2014;10(09):965–971. doi:10.5664/jcsm.4026
9. Zhang H, Li Y, Zhao X, et al. The association between PSQI score and hypertension in a Chinese rural population: the Henan Rural Cohort Study. Sleep Med. 2019;58:27–34. doi:10.1016/j.sleep.2019.03.001
10. Yue JR, Wang H, Huang CQ, Dong BR. Association between sleep quality and arterial blood pressure among Chinese nonagenarians/centenarians. Med Sci Monitor. 2012;18:36–42.
11. Lu K, Ding RJ, Tang Q, et al. Association between self- reported global sleep status and prevalence of hypertension in Chinese adults: data from the Kailuan community. Int J Environ Res Public Health. 2015;12(1):488–503. doi:10.3390/ijerph120100488
12. Bruno RM, Palagini L, Gemignani A, et al. Poor sleep quality and resistant hypertension. Sleep Med. 2013;14(11):1157–1163. doi:10.1016/j.sleep.2013.04.020
13. Kaya Z, Kayrak M, Demir K, et al. The relationship between white coat hypertension and sleep quality. Sleep Biol Rhythms. 2014;12(3):203–211. doi:10.1111/sbr.12070
14. Wu W, Wang W, Gu Y, et al. Sleep quality, sleep duration, and their association with hypertension prevalence among low-income oldest-old in a rural area of China: a population-based study. J Psychosom Res. 2019;127:109848. doi:10.1016/j.jpsychores.2019.109848
15. Bansil P, Kuklina EV, Merritt RK, Yoon PW. Associations between sleep disorders, sleep duration, quality of sleep, and hypertension: results from the National Health and Nutrition Examination Survey, 2005 to 2008. J Clin Hypertens. 2011;13(10):739–743. doi:10.1111/j.1751-7176.2011.00500.x
16. Alebiosu OC, Ogunsemi OO, Familoni OB, Adebayo PB, Ayodele OE. Original research: quality of sleep among hypertensive patients in a semi- urban Nigerian community: a prospective study. Postgrad Med. 2009;121(1):166–172. doi:10.3810/pgm.2009.01.1969
17. Liu RQ, Qian Z, Trevathan E, et al. Poor sleep quality associated with high risk of hypertension and elevated blood pressure in China: results from a large population-based study. Hypertens Res. 2016;39(1):54–59. doi:10.1038/hr.2015.98
18. Heinzer R, Vat S, Marques-Vidal P, et al. Prevalence of sleep-disordered breathing in the general population: the HypnoLaus study. Lancet Respir Med. 2015;3(4):310–318. doi:10.1016/S2213-2600(15)00043-0
19. Redline S, Sotres-Alvarez D, Loredo J, et al. Sleep-disordered breathing in Hispanic/Latino individuals of diverse backgrounds. The Hispanic Community Health Study/Study of Latinos. Am J Respir Crit Care Med. 2014;189(3):335–344. doi:10.1164/rccm.201309-1735OC
20. Pływaczewski R, Bednarek M, Jonczak L, Zieliński J. Sleep-disordered breathing in a middle-aged and older Polish urban population. J Sleep Res. 2008;17(1):73–81. doi:10.1111/j.1365-2869.2008.00632.x
21. Sateia MJ. International classification of sleep disorders-third edition: highlights and modifications. Chest. 2014;146(5):1387–1394. doi:10.1378/chest.14-0970
22. Gessner V, Bitter T, Horstkotte D, Oldenburg O, Fox H. Impact of sleep-disordered breathing in patients with acute myocardial infarction: a retrospective analysis. J Sleep Res. 2017;26(5):657–664. doi:10.1111/jsr.12540
23. Peppard PE, Young T, Palta M, Skatrud J. Prospective study of the association between sleep- disordered breathing and hypertension. New Engl J Med. 2000;342(19):1378–1384. doi:10.1056/NEJM200005113421901
24. Dietrich SK, Francis-Jimenez CM, Knibbs MD, Umali IL, Truglio-Londrigan M. Effectiveness of sleep education programs to improve sleep hygiene and/or sleep quality in college students: a systematic review. JBI Database Syst Rev Implement Rep. 2016;14(9):108–134. doi:10.11124/JBISRIR-2016-003088
25. Knutson KL, Van Cauter E, Rathouz PJ, et al. Association between sleep and blood pressure in midlife: the CARDIA sleep study. Arch Intern Med. 2009;169(11):1055–1061. doi:10.1001/archinternmed.2009.119
26. Peppard PE, Young T, Barnet JH, Palta M, Hagen EW, Hla KM. Increased prevalence of sleep-disordered breathing in adults. Am J Epidemiol. 2013;177(9):1006–1014. doi:10.1093/aje/kws342
27. Fietze I, Laharnar N, Obst A, et al. Prevalence and association analysis of obstructive sleep apnea with gender and age differences - Results of SHIP-trend. J Sleep Res. 2019;28(5):e12770. doi:10.1111/jsr.12770
28. Wang D, Zhou Y, Guo Y, et al. The effect of sleep duration and sleep quality on hypertension in middle-aged and older Chinese: the Dongfeng-Tongji Cohort Study. Sleep Med. 2017;40:78–83. doi:10.1016/j.sleep.2017.09.024
29. Wang L, Li N, Heizhati M, et al. Prevalence, awareness, treatment, and control and related factors of hypertension in multiethnic agriculture, stock-raising, and urban Xinjiang, Northwest China: a cross-sectional screening for 47000 adults. Int J Hypertens. 2019;2019:3576853. doi:10.1155/2019/3576853
30. Pan F, Heizhati M, Wang L, et al. Distribution characteristics of circulating homocysteine and folate and related factors in agriculture, stock-raising and urban populations: a cross-sectional survey. Public Health Nutr. 2020;2:1–8.
31. Williams B, Mancia G, Spiering W, et al. 2018 ESC/ESH Guidelines for the management of arterial hypertension. Kardiol Pol. 2019;77(2):71–159. doi:10.5603/KP.2019.0018
32. Li J, Yao YS, Dong Q, et al. Characterization and factors associated with sleep quality among rural elderly in China. Arch Gerontol Geriatr. 2013;56(1):237–243. doi:10.1016/j.archger.2012.08.002
33. Marti-Soler H, Hirotsu C, Marques-Vidal P, et al. The NoSAS score for screening of sleep-disordered breathing: a derivation and validation study. Lancet Respir Med. 2016;4(9):742–748. doi:10.1016/S2213-2600(16)30075-3
34. Hong C, Chen R, Qing S, et al. Validation of the NoSAS score for the screening of sleep-disordered breathing: a hospital-based retrospective study in China. J Clin Sleep Med. 2018;14(2):191–197. doi:10.5664/jcsm.6930
35. Wang Z, Chen Z, Zhang L, et al. Status of hypertension in China: results from the China hypertension survey, 2012–2015. Circulation. 2018;137(22):2344–2356. doi:10.1161/CIRCULATIONAHA.117.032380
36. Chen CM, Kong LZ; for China obesity problem working group. Chinese adults guidelines for the prevention and control of overweight and obesity. Beijing: People’s Medical Publishing House; 2006.
37. Zung WWK How normal is anxiety? Durham: Upjohn; 1980.
38. World Health Organization. Global recommendations on physical activity for health; 2010. Available from: http://whqlibdoc.who.int/publications/2010/9789241599979_eng.pdf.
39. Alberti KG, Zimmet PZ. Definition, diagnosis and classification of diabetes mellitus and its complications. Part 1: diagnosis and classification of diabetes mellitus. Provisional report of a WHO Consultation. Diabet Med. 1998;15(7):539–553. doi:10.1002/(SICI)1096-9136(199807)15:7<539::AID-DIA668>3.0.CO;2-S
40. Joint Committee for the Prevention and Treatment of Dyslipidemia in Chinese Adults. Guidelines for the prevention and treatment of dyslipidemia in Chinese adults (2016 Revised Edition). Chin J Cardiol. 2016;44:833–850.
41. Ambrosius WT, Sink KM, Foy CG; The SPRINT Study Research Group. The design and rationale of a multi-center clinical trial comparing two strategies for control of systolic blood pressure: the Systolic Blood Pressure Intervention Trial (SPRINT). Clin Trials. 2014;11(5):532–546. doi:10.1177/1740774514537404
42. Textor J, van der Zander B, Gilthorpe MS, Liskiewicz M, Ellison GT. Robust causal inference using directed acyclic graphs: the R package ‘dagitty’. Int J Epidemiol. 2016;45(6):1887–1894.
43. Wang Y, Li Y, Liu X, et al. Gender-specific prevalence of poor sleep quality and related factors in a Chinese rural population: the Henan Rural Cohort Study. Sleep Med. 2019;54:134–141. doi:10.1016/j.sleep.2018.10.031
44. Hershner S, O’Brien LM. The impact of a randomized sleep education intervention for college students. J Clin Sleep Med. 2018;14(3):337–347. doi:10.5664/jcsm.6974
45. Mollayeva T, Thurairajah P, Burton K, Mollayeva S, Shapiro CM, Colantonio A. The Pittsburgh sleep quality index as a screening tool for sleep dysfunction in clinical and non- clinical samples: a systematic review and meta- analysis. Sleep Med Rev. 2016;25:52–73. doi:10.1016/j.smrv.2015.01.009
 © 2021 The Author(s). This work is published and licensed by Dove Medical Press Limited. The
full terms of this license are available at https://www.dovepress.com/terms
and incorporate the Creative Commons Attribution
- Non Commercial (unported, 3.0) License.
By accessing the work you hereby accept the Terms. Non-commercial uses of the work are permitted
without any further permission from Dove Medical Press Limited, provided the work is properly
attributed. For permission for commercial use of this work, please see paragraphs 4.2 and 5 of our Terms.
© 2021 The Author(s). This work is published and licensed by Dove Medical Press Limited. The
full terms of this license are available at https://www.dovepress.com/terms
and incorporate the Creative Commons Attribution
- Non Commercial (unported, 3.0) License.
By accessing the work you hereby accept the Terms. Non-commercial uses of the work are permitted
without any further permission from Dove Medical Press Limited, provided the work is properly
attributed. For permission for commercial use of this work, please see paragraphs 4.2 and 5 of our Terms.