Back to Journals » Pediatric Health, Medicine and Therapeutics » Volume 13
Stunting and Underweight, but not Wasting are Associated with Delay in Child Development in Southwest Ethiopia
Authors Oumer A ![]() , Fikre Z, Girum T, Bedewi J
, Fikre Z, Girum T, Bedewi J ![]() , Nuriye K, Assefa K
, Nuriye K, Assefa K
Received 16 October 2021
Accepted for publication 16 December 2021
Published 11 January 2022 Volume 2022:13 Pages 1—12
DOI https://doi.org/10.2147/PHMT.S344715
Checked for plagiarism Yes
Review by Single anonymous peer review
Peer reviewer comments 4
Editor who approved publication: Professor Roosy Aulakh
Abdu Oumer,1 Zinash Fikre,1 Tadele Girum,1 Jemal Bedewi,1 Keyredin Nuriye,2 Kenzudin Assefa1
1Department of Public Health, College of Medicine and Health Sciences, Wolkite University, Wolkite, Ethiopia; 2Department of Midwifery, College of Medicine and Health Sciences, Wolkite University, Wolkite, Ethiopia
Correspondence: Abdu Oumer
Department of Public Health, College of Medicine and Health Sciences, Wolkite University, Wolkite, Ethiopia
Tel +251 966365785
Email [email protected]
Background: Stimulating care during childhood is the foundation for optimal health, learning, productivity, and social well-being throughout the life course. In addition, malnutrition is a major public health concern affecting up to half of children under-five years in Ethiopia. However, evidence on the causal contribution of malnutrition to delay in child development is poorly understood in Ethiopia.
Objective: To identify the relationship between different forms of malnutrition and delay in child development among children in Southwest Ethiopia.
Methods: A community-based survey was conducted among 507 randomly selected mother–child pairs in the Guraghe Zone, Southwest Ethiopia. A pretested tool and validated anthropometric measurements were used. Anthropometric indices (WFH, WFA, and HFA) were calculated in Anthros software. The data were summarized in mean, median, standard deviation, tables and charts. Bivariable and multivariable binary logistic regression (stepwise backward regression) models were fitted with nutritional status (wasting, stunting and underweight) and other potential factors associated with delay in child developmental. Adjusted odds ratios with 95% confidence intervals and p-values were reported.
Results: A total of 507 mother–child (12– 59 months) pairs were included in the survey (97% response rate). The mean ASQ-3 score was 150 (± 23.4), with a minimum and maximum score of 45 and 270, respectively. A total of 149 (29.4%; 95% CI: 25.4– 33.4) children had developmental delays, where 17.2%, 16.8%, 13.4%, 10.8%, and 10.1% had delays in gross motor, communication, problem-solving, personal-social, and fine motor skills, respectively. Children of working mothers (AOR=2.9; 1.8, 4.8), preterm births (AOR=3.2; 1.4, 7.0), early initiation of complementary feeding (AOR=2.5; 1.37, 4.6), stunting (AOR=3.0; 1.9, 4.7), underweight (AOR= 2.3; 1.1, 4.7) and low dietary diversity score (AOR=3.1; 1.3, 7.5), were predictors of developmental delay.
Conclusion: Child development delay is a public health concern and it is strongly associated with stunting, underweight, undiversified dietary consumption, and suboptimal infant and young child feeding practices.
Keywords: developmental delay, nutritional status, associated factors, stunting, children
Introduction
Childhood development refers to the multidimensional dynamic changes in a child’s physical growth, social, emotional, thinking, and communication skills, which mainly occur during childhood and continue into early adulthood.1,2 It is a key aspect of the holistic changes that occur in early childhood.3,4 Childhood development encompasses five different domains, namely gross motor, fine motor, speech, cognitive, and socio-emotional skills, which are age specific tasks that most healthy children can do at a certain age.1–4
The period from birth to a few years of age is a very critical period, where critical developmental processes usually happen.5 The majority of organ development, including the nervous system, happens up to five years of age. During the first five years of a child’s life, more than 90% of the size of a child’s brain has been reached,6 making early childhood the most sensitive period for the occurrence of major developmental delays that affect a child’s learning capability, emotional development, and negatively affect their future life.3,7,8
Situations where more than one in 200 children are displaced, one in five stunted children, and 40% do not have access to school, internally displaced and stunted, aggravate the problem of delayed developmental milestones and might be a serious problem.9,10 More than 250 million children (43%) in low-income and middle-income countries have some sort of developmental delay, where the burden is highest in Sub Saharan Africa.8 A recent estimate also showed 81.0 million children aged 3–4 years (49.2, 113.3) in low and middle income countries (LMICs), with the highest burden (29.5 million) in Sub-Saharan Africa, had low cognitive and/or socioemotional development.11 Furthermore, it is estimated that more than 25% of children worldwide have developmental delays.12 In Ethiopia, the prevailing poverty and food insecurity, hinder the children’s full developmental potential.13 Also, an estimated 59% of children are at risk of poor developmental delay in the country.14
In addition, food insecurity and malnutrition are prevailing across the globe, especially in Sub-Saharan Africa. In Ethiopia, more than 37% and 21% of children are victims of stunting and underweight,15 which is aggravated by the rising price of goods and population displacement. Malnutrition contributes to more than half (53%) of childhood morbidity and mortality, and costs an estimated 16.5% of the national gross domestic product.16 The consequences of malnutrition go beyond predisposing to short-term morbidity and mortality, increasing the risks of cognitive and emotional consequences.17–20
Yet, millions of children fall short of their full developmental potential due to improper care, nutrition, social care, poor care during pregnancy, and other important factors. Nurturing care for better childhood development is crucial for optimal health and development of children.10,21 However, among the potential causes, some are preventable or treatable, while the others are non-modifiable factors.22 Better comprehensive health care in the first three years of age is a crucial window opportunity where a significant number of children are affected by illness, malnutrition, and other major health problems.23,24
Evidence shows that developmental delay is a multifactorial and multifaceted problem.25 There is a lack of clear evidence quantifying the relative contribution of nutritional status to delay in child development.8 A study showed that stunting is not a significant factor associated with the risk of developmental delay (AOR=1.36; 0.85, 2.15) or low development (AOR=0.92; 0.48, 1.78).26 Other studies have found that cognitive stimulation,29 stunting,30 iodine deficiency,31 and iron-deficiency anemia are key risk factors for developmental delay and may play a role in preventing it.32–36 However, nutritional insults in the early childhood period significantly affect the cognitive potential of a child, as evidenced by the finding that for every 1 cm increase in the height of the child, improvement in child cognitive performance was observed (0.22–0.24 SD).37 Sudfeld also indicated that stunting is associated with poor communication, motor, and cognitive performance. However, the relationship with wasting (WFH Z score) was not linear and not direct.38
Despite previous literature showing that a high risk of developmental delay is associated with stunting and socioeconomic class,32,37,38 there is a paucity of literature linking malnutrition (both acute and chronic malnutrition) with milder forms of developmental delay in Ethiopia, which needs to be supported by concrete evidence. In addition, there is a scarcity of research in the country and the tool to assess developmental delay is not comprehensive enough to capture the full aspects of childhood development. Thus, this study is aimed at understanding the developmental status of children and quantifying the relative contributions of different forms of malnutrition on childhood development.
Materials and methods
Study setting and design
This community based cross sectional study was conducted in the Guraghe Zone, 155 km away from the capital city of Ethiopia, Addis Ababa. In the district, there are twenty-nine kebeles (twenty-six rural and three urban and kebele refers to fourth level administrative divisions in Ethiopia) under a district). It has a total population of 84,896 living within 4160 households. A total of 10,535 of them were expected to be children aged 12 to 59 months of age, of which 9169 (87%) of them reside in rural kebeles. The study was conducted in May, 2021 in Gregorian calendar.
Population and eligibility criteria
The result of this study is intended for all children aged 12–59 months in the Guraghe Zone, while those children aged 12–59 months from a randomly selected kebele were the study population of this study. Those children with blindness and hearing impairment were excluded from the study, where childhood developmental domain assessment is impractical and will bias our results.
Sample size determination
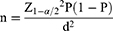
The sample size was estimated using both single proportion sample size estimation and sample size calculation for cross sectional to study for the first and second objectives of the study. For the first objective, we assumed a 95% confidence level, prevalence of delay in child development (19%) from previous study conducted in Ethiopia (28), and 5% significant value and a minimum of 236 samples were required.
With the following assumption:
n = sample size,
p= the prevalence estimate of developmental delay in childhood
 = the critical value at 95% confidence level (1.96)
α =significance level (0.05)
d= margin of error (5%)
While the sample size for the second objective was estimated using the sample size for a cross sectional study to compare the risk of developmental delay by nutritional status and other factors under Epi-info version 7 software. We assumed a 95% confidence level, 80% power, exposed to unexposed sample ration of 1, odds ratio, and incidence of disease among the unexposed from previous studies.
Considering the mother’s educational status, diversified dietary consumption, and wasting as factors related to developmental delay, the sample size estimated by diversified dietary consumption became 236. With a design effect of 2 (to account for multistage sampling) and a 10% non-response rate, the final sample became 519. Taking the larger sample size estimated based the above calculations, a total of 519 children were required to this research work.
Sampling procedure
A multi-stage sampling technique was employed to randomly select 509 child mother pairs from a randomly selected household. First, based on residence (urban and rural), the sample size was stratified using a proportional allocation. Then, from each residence, a pre-specified number of kebeles were selected, and the sample was further allocated proportionally to each randomly selected kebele. A total of one kebele from urban and five kebeles from rural residences were included to make the sample more representative.
The samples were allocated proportionally based on the probability proportional to size (PPS) allocation technique as  where Nj refers to the sample size for strata j and n is the total sample size.
Then, a systematic random sampling using a sampling interval calculated as ( ), is used to randomly select the allocated sample of mother–child pairs from each kebele. The sample frame including the full list of households with children aged 12–59 months was obtained from the family folder. At a time when households with two children less than five years of age were confronted, one was selected randomly by lottery method and/or the younger child was considered. When the respondent was not available during data collection, a three-time revisit was arranged.
Data collection methods
A pretested structured interviewer-administered questionnaire containing variables assessing socio-demographic factors, household economic status, maternal health status, child health related factors, nutritional variables, and food access was used to collect data from the mother or care giver of the child. The questionnaire is adapted from the Ethiopia Demographic and Health Survey (EDHS) 2019 and relevant previous literature and standardized tools by the Food and Agricultural Organization of the United Nation. The tool was prepared in English and administered in translated form to the local language. The wealth status assessment was based on the recent Ethiopian DHS questionnaire, including household assets for urban and rural settings.
The validated, third edition of the age and stage questionnaire (ASQ-3) was used to assess the child’s developmental assessment.39,40 The tool has five subscales: communication, gross motor, fine motor, problem solving, and personal-social domains. Some questions are specific for certain age groups, while other items are used for a wider age range and are repeated in different age categories.41 Most of the developmental questions were assessed by trained data collectors after a child performed or failed the activity asked for.
Each question was answered as “yes” scored as 10, “sometimes” scored as 5, and “not at all” scored as 0. A set of 30 questions (six questions assessing each domain of the ASQ-3 tool) were assessed for each child and scored out of 300.42 The tool is valid and tested in different settings for childhood developmental delay. It has a validity of 88%, reliability of 94%, with a sensitivity and specificity of 83% and 39% to 95%, respectively (39–42). The tool was also being used in developmental assessment in Ethiopia and outside the country.40,43,44
Anthropometric measurements for weight and height were collected in accordance with WHO guidelines and under the supervision of supervisors. A portable stadiometer was used to measure older children (above two years) and a calibrated length board was used for younger children (less than two years), whose body parts are in touch with the measuring board in proper anatomical position. The weight was measured with minimal clothing and without shoes to the nearest 0.1 kg. The child’s body at the occiput, shoulder blades, buttocks, and heels were in touch with the board and recorded to the nearest 0.1 cm. In addition, the 8-item minimum dietary diversity for children prepared and validated by the Food and Nutrition technical Assistant of the food and FANTA project was used. The consumption of foods from each food group was collected using the past 24-hour recall period under standard procedures for recalling food consumed. The seven food groups used for tabulation of this indicator are: grains, roots, and tubers; legumes and nuts; dairy products (milk, yogurt, and cheese); flesh foods (meat, fish, poultry, and liver/organ meats); eggs; vitamin A-rich fruits and vegetables; and other fruits and vegetables.45
Variables of the study
The outcome variable of this study is child development delay assessed using the ASQ-3 tool, classified as normal and delayed child development otherwise. While the sociodemographic characteristics (maternal age, residence, religion, marital status, educational status of the mother, occupation of mother, household wealth status, and family size), obstetric and maternal health related factors, child characteristics, diversified diet consumption, nutritional status ad infant and young child feeding practices were considered as predictor variables with childhood developmental delay.
Operational definitions
A child with delay in child development has an ASQ-3 score that is lower than the cut-off points for their age in any of the ASQ-3 domains: communication, gross motor, fine motor, problem solving, and personal and social. The detailed cutoff point for each domain is stated in Supplementary Table 1. The nutritional status indicators (WFA, WFH and HFA Z scores) were calculated in Anthro software. A Z score below −2 for WFA, WFH, and HFA Z scores was classified as underweight, wasted, and stunted, respectively. While a Z score below −3 for WFH and HFA Z-score is diagnosed as severely wasted and stunted, respectively. In addition, based on the minimum dietary diversity for children, consumption of at least four food groups out of seven (five out of eight food groups for breast feeding children) was classified as an adequately diversified diet (45).
Data quality control
The tool was pretested and administered in the local language by trained data collectors. Data collectors and supervisors were trained with a special focus on proper ASQ-3 assessment, anthropometric measurement, and dietary consumption. Close supervision was done by investigators and supervisors. The inter and intra-observer reliability (technical error of measurement) was assessed and data collectors with acceptable range were recruited for actual data collection.46 A daily check-up for completeness and consistency of the collected data was made by the supervisor and investigators.
Data processing and analysis
Data was entered into Epi data version 3.1 statistical software, then data was exported to SPSS version 21 for analysis. Descriptive analysis such as frequency, percent, mean, median, and standard deviation were reported, and the results were presented in statistical tables and figures. Principal component analysis was done using possessions of household assets to construct a wealth index as a proxy measure of household socio-economic status. Assumptions of principal component analysis were checked. Accordingly, households were categorized into five wealth quintiles for further analysis.
The anthropometric data was exported to Anthro software version 3.2.2 to calculate standardized Z scores. The weight-for-age (WFA), weight-for-height (WFH), and height-for-age (HFA) Z-score were generated the degree of underweight, wasting, and stunting, respectively. Similarly, the consumption food items from the seven food groups were coded as “1” (consumed) and “0” (not consumed)otherwise, the dietary diversity score was computed and categorized.
Each domain was classified into three (high risk for development, needs monitoring, and well-development) for each age category based on ASQ-3. The different age groups are computed to each developmental activity as delay and normal development. Then, based on the five developmental domains, the overall development status of children was calculated and categorized in to delayed and normal development.
A bivariable and multivariable binary logistic regression analysis was conducted to assess the factors associated with developmental delay. The variables were checked for normality, multicollinearity (using statistically significant correlations and a higher variance inflation factor above 10).47 Factors with a p-value below 0.25 48 and other pertinent predictors of developmental delay were considered for the final logistic regression model. The model was fitted was evaluated using Hosmer and Lemeshow’s test (p-value > 0.05 showed a better fit model). Crude and adjusted odd ratios (C/AOR) with 95% confidence intervals were reported. Statistical significance was declared at a P-value below 0.05.
Ethical considerations
Ethical clearance was obtained from the Institutional Health Research Ethical Review Committee, Wolkite University. A support letter was submitted to concerned bodies. Informed consent was obtained from the mother or care giver/legal guardian of the child after explaining the purpose and procedures of the study in detail. Mothers/legal guardians were under the age of 18 were unable to provide informed consent on their own behalf. Mothers/legal guardians aged above 18 years were interviewed during data collection. The data confidentiality was kept and all standard precautions for the prevention of COVID 19 pandemic transmission were maintained during the data collection.
Results
Socio-demographic characteristics
This survey was conducted among 507 mothers who have children aged 12–59 months in southwest Ethiopia, with a response rate of 97.6%. The respondents’ average age was 31.2 years (+ 5.2), and 47 (9%) were between the ages of 15 and 24.A total of 241 (48%), 482 (95%), 448 (88%), and 386 (76%) of the respondents were Muslim, married, from rural areas, and did not have formal education, respectively. About 364 (72%) of mothers were housewives, while 306 (60%) and 134 (17%) of children resided in extended family sizes > 5 and in poor socioeconomic levels, respectively (Table 1).
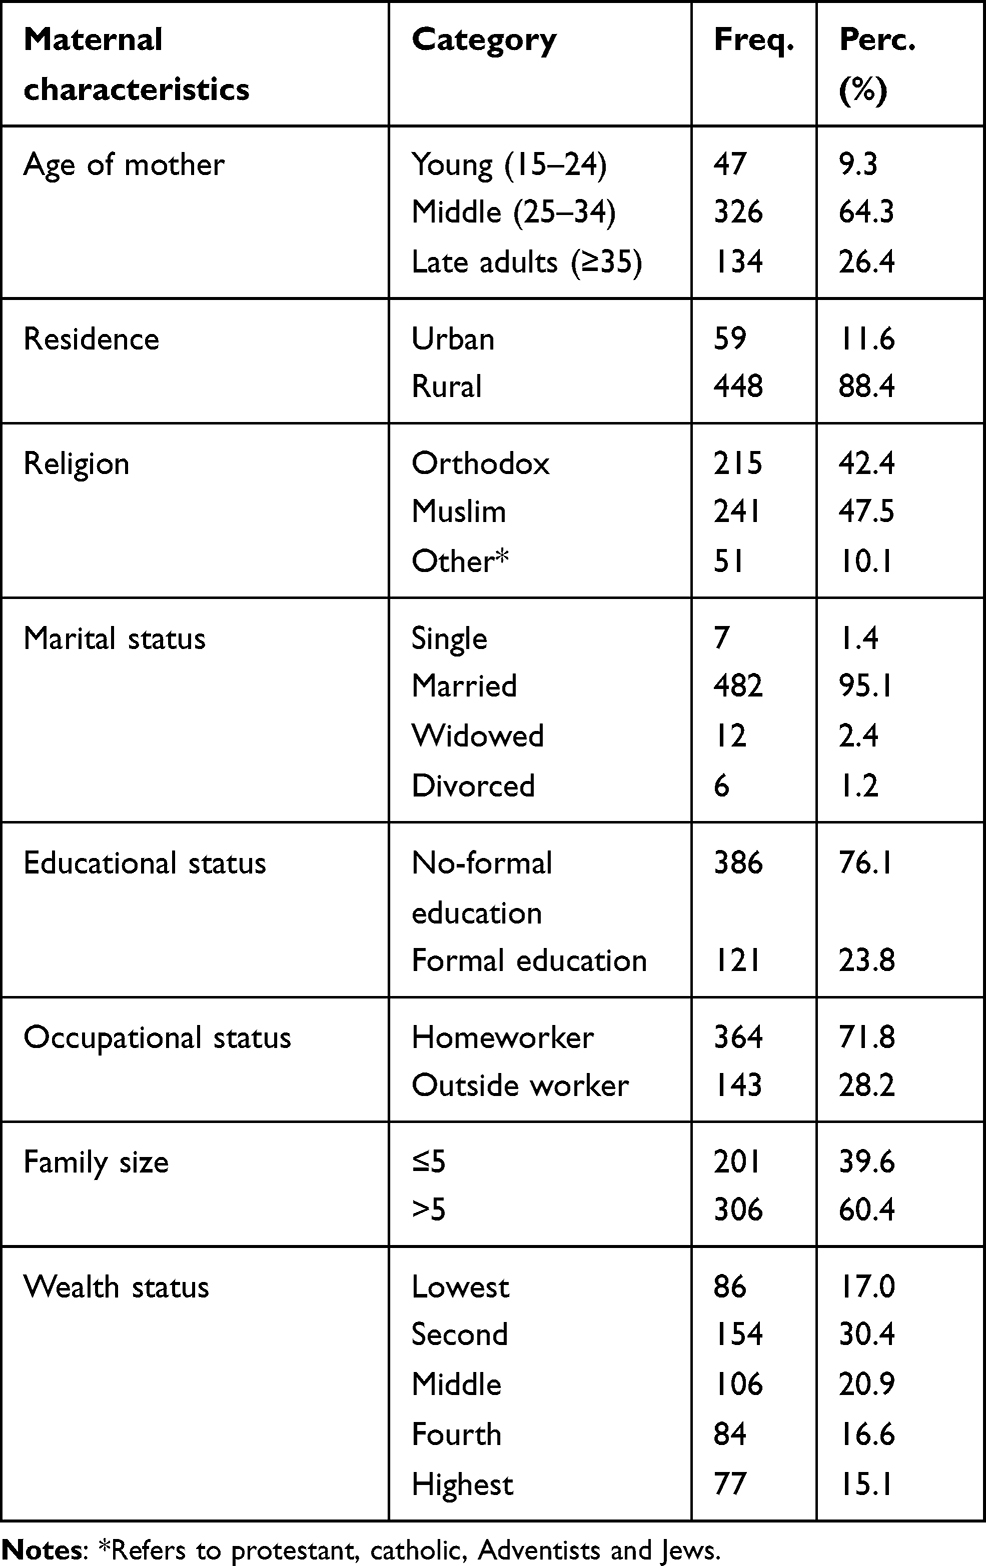 |
Table 1 Socio-demographic characteristics of the study participants in southwest Ethiopia (n=507) |
A total 279 (55%) children were females with a mean age of 32.1 months (±12). More than half (62.7%) and 95% of the children were toddlers (1–3 years) and delivered at health institutions, respectively. A total of 64.5% of children were born with normal birth weight. The majority of the children in the sample, 59.2%, were the fourth and fifth for their mother. Regarding child feeding, 223 (44%) started complementary feeding at six months (Table 2).
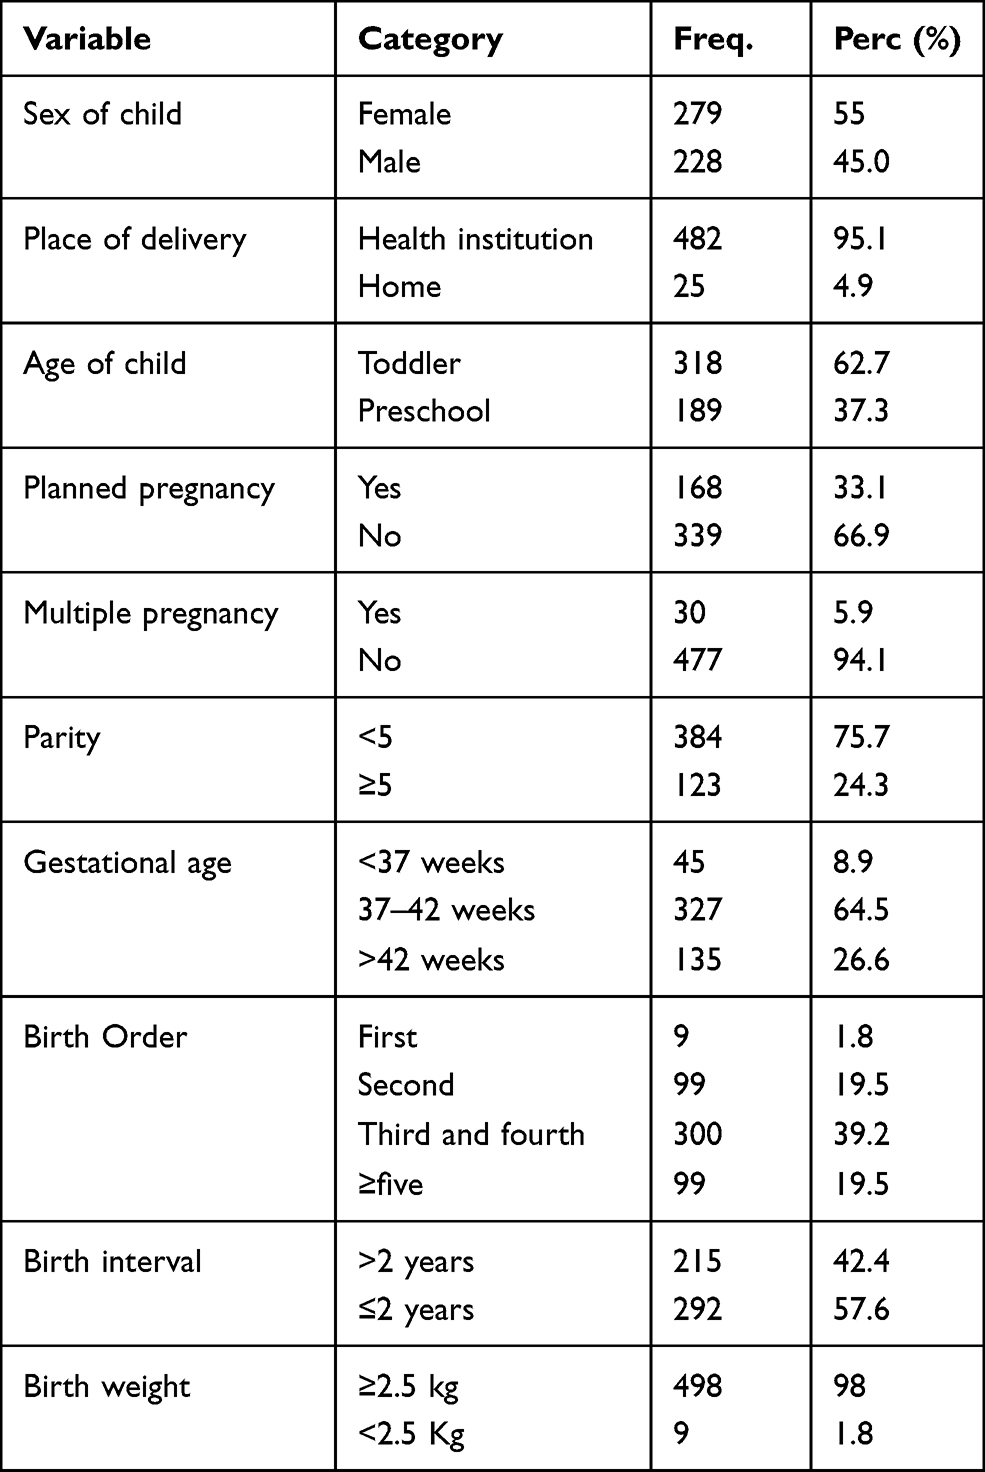 |
Table 2 Child Socio-demographic and obstetric related characteristics (n=507), in Southwest Ethiopia, 2021 |
Nutritional status and feeding practices of children
About 15% of children started complementary feeding before six months, and almost all (91%) have inadequately diversified diet consumption. Concerning the nutritional status of children, about 35.7% (95% CI: 31.5–40.0), 8.1% (95% CI: 5.9–10.8), and 8.3% (95% CI: 6.0–11) were stunted, underweight, and wasted, respectively (Figure 1).
 |
Figure 1 Prevalence of childhood malnutrition among children in Southwest Ethiopia, 2021. |
Burden of delay in child development
Using the age-specific ASQ-3 tool, the overall and developmental scores of children were calculated at each milestone. The mean ASQ-3 score was 150 (± 23.4), with a minimum and maximum score of 45 and 270, respectively. The mean ASQ-3 score was higher for gross motor (35.1±7), personal-social (31.3±6.8), and problem-solving (29.9±5.2) skills. About 149 (29.4%; 95% CI: 25.4–33.4) of children had some type of developmental delay, where 17.2%, 16.8%, and 13.4% had delays in gross motor, communication, and problem-solving skills (Table 3).
 |
Table 3 Magnitude and risks of delay in child development in each milestone in southwest Ethiopia, 2021 |
Factors associated with delay in child development
A step-wise backward binary logistic regression model was used to identify factors associated with childhood development delay. In addition, those variables with a p-value below 0.25 in bivariable logistic regression and other pertinent variables were considered for the multivariable logistic regression model.
In bivariable analysis, maternal education, maternal age, maternal occupation, gestational age, time of initiation of complementary feeding, multiple pregnancy, child age, stunting, wasting, underweight, parity, birth interval, dietary diversity, and wealth status were found to be associated with developmental delay.
Children of working mothers are 2.6 times more likely to have developmental delays (COR=2.6; 95% CI; 1.56, 5.48) than children of stay-at-home mothers. Also, children who were born prematurely (COR=6.0; 95% CI 3.0, 11.8) and began complementary feeding early (COR=2.9; 95% CI 1.7, 5.0) had six-and three-times more likely to have developmental delays, respectively. The odds of being stunted (COR=3.2; 95% CI; 2.1, 4.7) and underweight (COR = 3.0; 95% CI; 1.6, 5.9) were three times higher in the developmentally delayed group than in the control group (Table 4).
 |
Table 4 Logistic regression analysis of factors associated with child development delay in Southwest Ethiopia, 2021 |
In multivariable logistic regression, maternal occupation, preterm birth, early initiation of complementary feeding, stunting, underweight and undiversified diet were significant predictors of developmental delay (P-value < 0.05). Multicollinearity was checked and variables with VIF above 10 and significant correlation were excluded from the model. Multicollinearity and interaction effects were analyzed and we did not find a significant effect modification among factors in the final model. In addition, the model fitness was evaluated with Hosmer and Lemeshow’s goodness of fit test (0.82).
Children’s whose mothers work outside (AOR=3.0; 95% CI; 1.8, 4.8) were 3 times more likely to be predisposed to developmental delay as compared to children’s whose mothers work at home. Children born preterm (AOR=3.2: 95% CI; 1.4, 7.0) and put on complementary feeding early (AOR=2.5; 95% CI; 1.3, 4.6) were more likely to be developmentally delayed. Furthermore, stunted children (AOR=3.0; 95% CI; 1.9, 4.7) and underweight children (AOR=2.3; 95% CI; 1.1, 4.7) had a three- and two-fold increased risk of developmental delay, respectively. Furthermore, children with an undiversified diet (AOR=3: 95% CI; 1.3, 7.5) were 3 times more likely to be developmentally delayed as compared to children with an adequately diversified diet (Table 4).
Discussions
This paper quantified the burden of developmental delay and its predictors among children. A substantial proportion of children (29.4%; 95% CI: 25.4%, 33.4%) had some kind of developmental delay. Other survey reports from rural China (35.7%)49 and Nigeria (35.4%) also indicated that developmental delay is a common problem among children.50 These studies used the contextualized ASQ-3 tool, and the factors leading to poor developmental potential might be common in these countries. While the current estimate is far below the national estimate (59%),14 it was higher than reports from studies conducted in Wolaita Sodo, South Ethiopia (19%),51 Turkey (6.5%),52 India (16.2%),53 and Burdwan district, West Bengal (7.9%).54
In addition, the current estimate is below the regional estimate (43%) in low- and middle-income countries. Overall, the burden of developmental delay is a major public health concern in Ethiopia. This lower prevalence might be due to the fact that this study is community-based and was conducted among healthy children. While some other studies were conducted in hospital settings, where the problem is expected to rise among malnourished and ill children. The World Bank estimates that children of today have only reached 56% of their full growth potential, ultimately affecting economic productivity and health. In addition, in settings where more than 60% of children do not have proper nurturing child care,6 the burden of delayed developmental delay is of great public health concern. It should be a government concern and contribute in large proportion to maintaining the quality of life and productivity of a country.
In this study, we found that children from working mothers are at higher risk of developmental delay which might be related to various factors. Having a nurturing parental caring practice better predicts optimal developmental parameters.10,24,36 Other studies conducted in Bengal and India indicate similar results. It is also pointed out that children of working mothers (AOR=1.8, p-value < 0.05) had a two-fold increased risk of developmental delay.36 This is particularly evidenced by mothers who stay outside the home, usually deprive the time for nurturing child care. In addition, children may not get proper infant and young child feeding (breast feeding), which allows adequate nourishment, which is critical to maintain optimum nutritional status and emotional developments.35,55 Increasing the time spent with children improves the emotional and psychological relationship between mother and child for better developmental milestones. Furthermore, developmental delays have become more prevalent among children of mothers with low socioeconomic status and education levels. A study showed that poor economic status (OR=2.8; 1.4–5.7) and lower education level (OR=2.5, 1.3–4.9) significantly increase the risk of developmental delay among children.36 In addition, it should be noted that environmental exposure to toxins in contaminated could potentially affect the nutritional status of children and could result in delayed child development.56 A study also showed that the rate of aflatoxin exposure was higher among stunted than non-stunted (51% vs 41%).57
Preterm birth is one of the most important causes of poor developmental milestones. Any environmental exposure to poor nutrition and other adverse exposures leads to preterm birth and intrauterine growth retardation. This ultimately limits the newborn’s neuronal development, brain size, and nerve myelination. A prospective study showed that preterm births had worse cognitive (MD=−5.3; −8.2, −2.4), language (MD=−11.4; −15.3, −7.5), and motor development (MD=−7.3; −10.6 to −3.9) at the age of 2 years. In addition, the risk of developmental delay was also significantly higher among those born preterm.58
Furthermore, the dietary practices (dietary diversity and complementary feeding) and nutritional status of children were major predictors of developmental delay. The whole continuum of malnutrition, starting from poor nutrition in intrauterine life, poor infant feeding practice and inadequate dietary intakes, results in poor growth, development, and its long-term consequences.59 However, the proportion of children getting a diversified diet and the minimum acceptable diet is quite low.60,61 Furthermore, stunting is common, affecting 37% of under-five children,15 with serious consequences for individuals, communities, and the country.62 One study showed that stunted children scored 16.1% and 48% less on vocabulary tests and quantitative assessment tests.34 However, it should be noted that developmental delay be a sign of social disadvantage and may not be totally attributable to malnutrition (stunting).27,28 Evidence showed that stunting is not a significant factor associated with the risk of developmental delay (AOR=1.36; 0.85, 2.15) or low development (AOR=0.92; 0.48, 1.78).26 This might opt to search for potential underlying causes of developmental delay related to aflatoxin exposure, social disadvantage and other potentially interacting factors hindering children development.27,28
Multipronged stunting prevention strategies, such as ensuring food security, improving caregiver knowledge and understanding, and providing proper health care, should be strengthened to ensure long-term achievement of optimal child development. Hence, holistic nurturing care covering the nutritional, social, and psychological aspects of children’s lives is critical to halting the bad cycle of poverty, malnutrition, and economic development.4 The first 1000 days of life are a golden opportunity, and all proper feeding practices should be strengthened.33
This study pointed out that the burden of developmental delay can be surveyed using the ASQ-3 tool, which considers age specific activities that a child should do. The tool is an exhaustive measure, measuring the five major dimensions of childhood developmental milestones.39,40,42 Our study, the national estimate,14 and evidence from southwest Ethiopia,51 indicate that developmental delays are a major concern in Ethiopia. It should be noticed that the problem is multifaceted, despite the fact that poverty, malnutrition, and poor dietary practices have a great contribution to poor childhood development. Context specific interventional studies testing effective and feasible interventions to address these multifaceted causes will be of paramount importance in Ethiopia.
Conclusion and recommendations
The risk of delay in child development is a major concern. Maternal occupation, dietary diversity, infant feeding practices, stunting, and underweight were significant predictors of the risk of childhood developmental delay. Nutritional care, and ultimately maintaining children’s nutritional status, is the foundation for preventing developmental delay. Multipronged nutrition-specific and nutrition-sensitive interventions should be strengthened, particularly in rural poor communities. Creating a comfortable work environment for mothers who have children at work is crucial to promoting IYCF and nurturing care for optimal development.
Abbreviations
A/COR, adjusted/crude odds ratio; ASQ, Age Stage Questionnaire; CI, confidence interval; EDHS, Ethiopian Demographic and Health Survey; HFA, height for age; IYCF, Infant and Young Child Feeding; ; MD, mean difference; VIF, variance inflation factor; WFA, weight for Age; WFH/L, weight for height/length; WHO, World Health Organization.
Data Sharing Statement
All data generated or analyzed during this study are included in the manuscript and supplementary file.
Ethics Approval and Consent to Participate
The research was reviewed and ethically adopted by Wolkite University Institutional Health Research Ethical Review committee. A written informed consent was obtained to collect data from caregivers of children after explaining the purpose and procedures of the study. The study was conducted in accordance with the Declaration of Helsinki.
Acknowledgments
The authors would like to acknowledge the zone and district administrative, data collectors, and supervisor for their kind cooperation and help for the implementation of this study.
Author Contributions
All authors contributed to data analysis, drafting or revising the article, have agreed on the journal to which the article was submitted, gave final approval of the version to be published, and agree to be accountable for all aspects of the work.
Funding
No specific funding was collected for this study. There were no funders and no funders had no role in study design, data collection and analysis, decision to publish, or preparation of the manuscript.
Disclosure
The authors declare that they have no conflicts of interest for this work.
References
1. Black MM, Walker SP, Fernald LC, et al. Advancing early childhood development: from science to scale 1: early childhood development coming of age: science through the life course. Lancet. 2017;389(10064):77. doi:10.1016/S0140-6736(16)31389-7
2. Moore RC. Childhood’s Domain: Play and Place in Child Development. 6. Routledge; 2017.
3. McDevitt TM, Ormrod JE, Cupit G, Chandler M, Aloa V. Child Development and Education. Merrill Upper Saddle River, NJ:Merrill; 2010.
4. Britto PR, Lye SJ, Proulx K, et al. Nurturing care: promoting early childhood development. Lancet. 2017;389(10064):91–102. doi:10.1016/S0140-6736(16)31390-3
5. Bukatko D, Daehler MW. Child Development: A Thematic Approach. Cengage Learning; 2012.
6. The World Bank. Early Years: the Foundation for Human Capital. Programs 2020. [cited 2021 October 14]; Available from: https://www.worldbank.org/en/programs/earlyyears.
7. Felfe C, Lalive R. Early Child Care and Child Development: For Whom It Works and Why. SSRN Electronic J. 2013. doi:10.2139/ssrn.2214874
8. Lu C, Black MM, Richter LM. Risk of poor development in young children in low-income and middle-income countries: an estimation and analysis at the global, regional, and country level. lancet Global Health. 2016;4(12):e916–e922. doi:10.1016/S2214-109X(16)30266-2
9. The world Bank. Early Childhood Development. Understanding poverty 2021; 2021; Available from: https://www.worldbank.org/en/topic/earlychildhooddevelopment#1.
10. Group WB. 2017. Promising Approaches in Early Childhood Development: Early Childhood Development Interventions from Around the World. Washington, DC: World Bank, License: CC BY 3.0 IGO.
11. McCoy DC, Peet ED, Ezzati M, et al. Correction: early childhood developmental status in low-and middle-income countries: national, regional, and global prevalence estimates using predictive modelling. PLoS Med. 2017;14(1):e1002233. doi:10.1371/journal.pmed.1002233
12. Gil JD, Ewerling F, Ferreira LZ, Barros AJ. Early childhood suspected developmental delay in 63 low-and middle-income countries: large within-and between-country inequalities documented using national health surveys. J Glob Health. 2020;10(1). doi:10.7189/jogh.10.010427
13. Ayenew MM. The Dynamics of Food Insecurity in Ethiopia, in Natural Resources Management: Concepts, Methodologies, Tools, and Applications. IGI Global; 2017:1177–1195.
14. Ministry of Health (MOH) Ethiopia. Directorate MACH. Status of Implementation for Early Childhood Development Interventions in Ethiopia Findings of the Situational Analysis Maternal and Child Health Directorate Ministry of Health, Ethiopia. Addis Ababa: Federal Ministry of Health; 2019:1–44
15. Central Statistical Agency of Ethiopia (CSA). Mini Ethiopia Demographic and Health Survey. ICF, editor Ethiopia Demographic and Health Survey. Addis Ababa, Ethiopia: Central Statistical Agency; 2019.
16. Ethiopian Federal Ministry of Health. The Cost of HUNGER in Ethiopia: Implications for the Growth and Transformation of Ethiopia, the Social and Economic Impact of Child Undernutrition in Ethiopia Child Undernutrition in Ethiopia: Summary Report. Addis Ababa;2012:3–8
17. Rajkumar AS, Gaukler C, Tilahun J. Combating Malnutrition in Ethiopia: An Evidence-Based Approach for Sustained Results. World Bank Publications; 2011.
18. Yirga AA, Mwambi HG, Ayele DG, Melesse SF. Factors affecting child malnutrition in Ethiopia. Afr Health Sci. 2019;19(2):1897–1909. doi:10.4314/ahs.v19i2.13
19. Chastre C, Duffield A, Kindness H, LeJeune S, Taylor A. The Minimum Cost of a Healthy Diet: Findings from Piloting a New Methodology in Four Study Locations. London: Save the Children UK; 2007.
20. Saunders J, Smith T. Malnutrition: causes and consequences. Clin Med (Northfield Il). 2010;10(6):624. doi:10.7861/clinmedicine.10-6-624
21. Anderson LM, Shinn C, Fullilove MT, et al. The effectiveness of early childhood development programs: a systematic review. Am J Prev Med. 2003;24(3):32–46. doi:10.1016/S0749-3797(02)00655-4
22. Moeschler JB, Shevell M. Comprehensive evaluation of the child with intellectual disability or global developmental delays. Pediatrics. 2014;134(3):e903–e918. doi:10.1542/peds.2014-1839
23. Shute RH, Slee PT. Child Development: Theories and Critical Perspectives. Routledge; 2015.
24. Organization, W.H. Care for Child Development: Improving the Care of Young Children; 2012.
25. Kalil A. Effects of the great recession on child development. Ann Am Acad Pol Soc Sci. 2013;650(1):232–250. doi:10.1177/0002716213500453
26. Miller AC, Garchitorena A, Rabemananjara F, et al. Factors associated with risk of developmental delay in preschool children in a setting with high rates of malnutrition: a cross-sectional analysis of data from the IHOPE study, Madagascar. BMC Pediatr. 2020;20(1):1–11. doi:10.1186/s12887-020-1985-6
27. Scheffler C, Hermanussen M, Bogin B, et al. Stunting is not a synonym of malnutrition. Eur J Clin Nutr. 2020;74(3):377–386. doi:10.1038/s41430-019-0439-4
28. Scheffler C, Hermanussen M, Soegianto SDP, et al. Stunting as a synonym of social disadvantage and poor parental education. Int J Environ Res Public Health. 2021;18(3):1350. doi:10.3390/ijerph18031350
29. Votruba‐Drzal E. Income changes and cognitive stimulation in young children’s home learning environments. J Marriage Family. 2003;65(2):341–355. doi:10.1111/j.1741-3737.2003.00341.x
30. Perkins JM, Kim R, Krishna A, et al. Understanding the association between stunting and child development in low-and middle-income countries: next steps for research and intervention. Soc Sci Med. 2017;193:101–109. doi:10.1016/j.socscimed.2017.09.039
31. Engle PL, Black MM, Behrman JR, et al. Strategies to avoid the loss of developmental potential in more than 200 million children in the developing world. lancet. 2007;369(9557):229–242. doi:10.1016/S0140-6736(07)60112-3
32. Walker SP, Wachs TD, Grantham-McGregor S, et al. Inequality in early childhood: risk and protective factors for early child development. Lancet. 2011;378(9799):1325–1338. doi:10.1016/S0140-6736(11)60555-2
33. Cusick SE, Georgieff MK. The role of nutrition in brain development: the golden opportunity of the “first 1000 days”. J Pediatr. 2016;175:16–21. doi:10.1016/j.jpeds.2016.05.013
34. Woldehanna T, Behrman JR, Araya MW. The effect of early childhood stunting on children’s cognitive achievements: evidence from young lives Ethiopia. Ethiopian J Health Dev. 2017;31(2):75–84.
35. Beasley A, Amir LH. Infant Feeding, Poverty and Human Development. Springer; 2007.
36. Sitaresmi MN, Ismail D, Wahab A. Risk factors of developmental delay: a community-based study. Paediatr Indones. 2008;48(3):161–165. doi:10.14238/pi48.3.2008.161-5
37. Fink G, Peet E, Danaei G, et al. Schooling and wage income losses due to early-childhood growth faltering in developing countries: national, regional, and global estimates. Am J Clin Nutr. 2016;104(1):104–112. doi:10.3945/ajcn.115.123968
38. Sudfeld CR, McCoy DC, Fink G, et al. Malnutrition and its determinants are associated with suboptimal cognitive, communication, and motor development in Tanzanian children. J Nutr. 2015;145(12):2705–2714. doi:10.3945/jn.115.215996
39. Limbos MM, Joyce DP. Comparison of the ASQ and PEDS in screening for developmental delay in children presenting for primary care. J Dev Behav Pediatrics. 2011;32(7):499–511. doi:10.1097/DBP.0b013e31822552e9
40. Alvarez-Nuñez L, González M, Rudnitzky F, Vásquez-Echeverría A. Psychometric properties of the ASQ–3 in a nationally representative sample of Uruguay. Early Hum Dev. 2021;157:105367. doi:10.1016/j.earlhumdev.2021.105367
41. Vitrikas K, Savard D, Bucaj M. Developmental delay: when and how to screen. Am Fam Physician. 2017;96(1):36–43.
42. Agarwal PK, Xie H, Rema ASS, et al. Evaluation of the Ages and Stages Questionnaire (ASQ 3) as a developmental screener at 9, 18, and 24 months. Early Hum Dev. 2020;147:105081. doi:10.1016/j.earlhumdev.2020.105081
43. Steenis LJ, Verhoeven M, Hessen DJ, Van Baar AL. Parental and professional assessment of early child development: the ASQ-3 and the Bayley-III-NL. Early Hum Dev. 2015;91(3):217–225. doi:10.1016/j.earlhumdev.2015.01.008
44. Otalvaro AR, Grañana N, Gaeto N, et al. ASQ-3: validation of the Ages and Stages Questionnaire for the detection of neurodevelopmental disorders in Argentine children. Arch Argent Pediatr. 2018;116(1):7–13. doi:10.5546/aap.2018.eng.7
45. Steyn NP, Nel J, Labadarios D, Maunder EMW, Kruger HS. Which dietary diversity indicator is best to assess micronutrient adequacy in children 1 to 9 y? Nutrition. 2014;30(1):55–60. doi:10.1016/j.nut.2013.06.002
46. Stomfai S, Ahrens W, Bammann K, et al. Intra-and inter-observer reliability in anthropometric measurements in children. Int J Obes. 2011;35(1):S45–S51. doi:10.1038/ijo.2011.34
47. Vtcheva KP, Lee M, McCormick JB, Rahbar MH. Multicollinearity in Regression Analyses Conducted in Epidemiologic studies. Epidemiology. 2016;6(2):2–8.
48. Lemeshow DW, Sturdivant RX. Applied Logistic Regression. Vol. 398. John Wiley & Sons; 2013.
49. Zhang J, Guo S, Li Y, et al. Factors influencing developmental delay among young children in poor rural China: a latent variable approach. BMJ Open. 2018;8(8):e021628. doi:10.1136/bmjopen-2018-021628
50. Jimoh AO, Anyiam JO, Yakubu AM. Relationship between child development and nutritional status of under-five Nigerian children. South African J Clin Nutrition. 2018;31(3):50–54. doi:10.1080/16070658.2017.1387434
51. Workie SB, Mekonen T, Mekonen TC, Fekadu W. Child development and nutritional status in 12–59 months of age in resource limited setting of Ethiopia. J Health Popul Nutr. 2020;39(1):1–9. doi:10.1186/s41043-020-00214-x
52. Demirci A, Kartal M. The prevalence of developmental delay among children aged 3–60 months in Izmir, Turkey. Child: care. Health Dev. 2016;42(2):213–219. doi:10.1111/cch.12289
53. Sharma N, Masood J, Singh S, et al. Assessment of risk factors for developmental delays among children in a rural community of North India: a cross-sectional study. J Educ Health Promot. 2019;8:8. doi:10.4103/jehp.jehp_189_18
54. Bhattacharya T, Ray S, Das DK. Developmental delay among children below two years of age: a cross-sectional study in a community development block of Burdwan district, West Bengal. Int J Commun Med Public Health. 2017;4(5):1762–1767. doi:10.18203/2394-6040.ijcmph20171798
55. Stewart CP, Iannotti L, Dewey KG, Michaelsen KF, Onyango AW. Contextualising complementary feeding in a broader framework for stunting prevention. Matern Child Nutr. 2013;9:27–45. doi:10.1111/mcn.12088
56. Frazzoli C, Mantovani A. Toxicological risk factors in the burden of malnutrition: the case of nutrition (and risk) transition in sub-Saharan Africa. Food Chem Toxicol. 2020;146:111789. doi:10.1016/j.fct.2020.111789
57. Tessema M, De Groote H, Brouwer ID, et al. Exposure to aflatoxins and fumonisins and linear growth of children in rural Ethiopia: a longitudinal study. Public Health Nutr. 2021;1:1–12.
58. Cheong JL, Doyle LW, Burnett AC, et al. Association between moderate and late preterm birth and neurodevelopment and social-emotional development at age 2 years. JAMA Pediatr. 2017;171(4):e164805–e164805. doi:10.1001/jamapediatrics.2016.4805
59. Benson T, Bellete S, Chanyalew D, Belachew T. An assessment of the causes of malnutrition in Ethiopia. In: International Food Policy Research Institute Washington DC. International Food Policy Research Institute; 2005:1–213.
60. Ethiopian Public Health Institute, E., F. Federal Ministry of Health and ICF. Ethiopia Mini Demographic and Health Survey 2019. Addis Ababa, Ethiopia: EPHI/FMoH/ICF; 2021.
61. Abdu AO, Mekonnen BA. Determinants of Dietary Adequacy Among School Age Children in Guraghe Zone, Southern Ethiopia. Int J Public Health Sci. 2019;8(2):211–218.
62. Tasic H, Akseer N, Gebreyesus SH, et al. Drivers of stunting reduction in Ethiopia: a country case study. Am J Clin Nutr. 2020;112(Supplement_2):875S–893S. doi:10.1093/ajcn/nqaa163
 © 2022 The Author(s). This work is published and licensed by Dove Medical Press Limited. The
full terms of this license are available at https://www.dovepress.com/terms
and incorporate the Creative Commons Attribution
- Non Commercial (unported, 3.0) License.
By accessing the work you hereby accept the Terms. Non-commercial uses of the work are permitted
without any further permission from Dove Medical Press Limited, provided the work is properly
attributed. For permission for commercial use of this work, please see paragraphs 4.2 and 5 of our Terms.
© 2022 The Author(s). This work is published and licensed by Dove Medical Press Limited. The
full terms of this license are available at https://www.dovepress.com/terms
and incorporate the Creative Commons Attribution
- Non Commercial (unported, 3.0) License.
By accessing the work you hereby accept the Terms. Non-commercial uses of the work are permitted
without any further permission from Dove Medical Press Limited, provided the work is properly
attributed. For permission for commercial use of this work, please see paragraphs 4.2 and 5 of our Terms.