Back to Journals » Risk Management and Healthcare Policy » Volume 14
Study to Alter the Nuisance Effect of Non-Response Using Scrambled Mechanism
Authors Singh C ![]() , Kamal M, Singh GN, Kim JM
, Kamal M, Singh GN, Kim JM
Received 14 December 2020
Accepted for publication 22 March 2021
Published 16 April 2021 Volume 2021:14 Pages 1595—1613
DOI https://doi.org/10.2147/RMHP.S294731
Checked for plagiarism Yes
Review by Single anonymous peer review
Peer reviewer comments 2
Editor who approved publication: Professor Marco Carotenuto
Chandraketu Singh,1 Mustafa Kamal,2 Garib Nath Singh,1 Jong-Min Kim3
1Department of Mathematics & Computing, Indian Institute of Technology (Indian School of Mines), Dhanbad, 826004, India; 2Department of Basic Sciences, College of Science and Theoretical Studies, Saudi Electronic University, Dammam, Kingdom of Saudi Arabia; 3Statistics Discipline, Division of Sciences and Mathematics, University of Minnesota-Morris, Morris, MN, 56267-2134, USA
Correspondence: Chandraketu Singh
Department of Mathematics & Computing, Indian Institute of Technology (Indian School of Mines), Dhanbad, 826004, India
Email [email protected]
Introduction: In biometric sample surveys, our objective is to get ready-made information for future planning and policy implementations related to the subject matters of highly sensitive issues. In such situations, we apply randomized response/scrambled response techniques. There are many highly sensitive issues which need to be examined over time as they may have a tendency to change. To get rid of these types of practical cases we need a scrambled response technique on successive occasions.
Methods: Using an additive and multiplicative technique, we proposed new effective scrambled response models to estimate the population mean of quantitative sensitive characteristics. Degree of privacy protection and unified measure approaches are used to examine the efficacy of the proposed models. Efficiency of the proposed models has been checked using MATLAB software. The utility of the proposed models under two occasions of successive sampling has been also explored using exponential-type estimators. Empirical and simulation studies are carried out to justify the proposition of the proposed estimators using MATLAB software.
Results: The percent relative efficiencies of the proposed models are always greater than 100 with respect to the well-known Bar-Lev et al model. In terms of degree of privacy protection, most of the values are greater than 0.5 and closer to 1. Similarly, the values of the proposed models are smaller with respect to the Bar-Lev et al model in terms of a unified measure approach. When the proposed scrambled response models are used on successive occasions, the percent relative efficiency is always found greater than 100 for all cases over its competitors.
Discussion: In this study, after deeply examining the properties of the proposed models, we found that the proposed models performed better over the well-known existing model. The proposed models may be used in human survey when we deal with highly sensitive issues. The proposed models also performed better when we utilized them in successive sampling. Hence, if sensitive characteristics change with time, the proposed estimators may be the best alternative to deal with these types of situations.
Mathematics Subject Classification: 62D05.
Keywords: scrambled response model, privacy protection, successive sampling, mean square error, Monte Carlo simulation
Background
In social surveys, obtaining reliable data through direct questioning may be difficult when potentially sensitive questions like sexual indulgence during teenage years, voluntary prostitution, negligence of government rules, drug intake etc. are included in the survey. To avoid these situations, Warner24 introduced the data collection technique that protects anonymity of the respondent known as the randomized response technique (RRT). Whereas, estimation of the mean of quantitative sensitive variables utilizing randomized response models was initiated by Greenberg et al.7 Later, Pollock and Bek15 introduced an additive technique for mean estimation of quantitative sensitive variables. Eichhorn and Hayre6 investigated the Pollock and Bek15 models in depth and introduced the scrambled response method for estimating the population parameters of quantitative sensitive characteristics. Some other developments for different practical situations to estimate the population mean of positive quantitative sensitive characteristics are by Bar-Lev et al.,3 Singh and Tarray,23 Kim and Elam,10 Diana and Perri,5 Diana and Perri,4 Son and Kim,17 among others.
In real-life problems, there are well-documented situations where sensitive studies need to be monitored over time to understand the problem in a better way. To handle such situations, Jessen,9 Priyanka et al.14 and Singh and Sharma18 among others used successive sampling. Arnab and Singh1 and Priyanka and Trisandhya12 among others used a scrambled response technique to handle sensitive issues on successive occasions.
Motivated by the above cited works, in the present article an attempt has been made to propose efficient scrambled response models. The degree of privacy protection and unified measures for the proposed models have been discussed. Efficacy of the proposed strategy has been justified.
Application of the proposed models under successive sampling has also been discussed. To estimate the population mean of sensitive variables, exponential types of estimators have been proposed. Properties of the proposed estimators have been discussed under the proposed scrambled response models. Empirical studies using a real data set and Monte Carlo simulation studies have been performed under the proposed scrambled response models. Empirical and simulation results indicate the dominance of the proposed estimators over some well-known estimators.
Proposed Technique
The scrambling technique has been used in many randomization devices, with the goal of increasing the respondent’s cooperation. Pollock and Bek15 have considered the additive model in which the respondent is asked to sum his sensitive attribute by a random value from a known distribution.
Eichhorn and Hayre6 have considered another survey model involving a quantitative response variable and proposed an RR technique for it. Such models are very useful in studies involving a measured response variable which is highly sensitive in its nature. The model considered by Eichhorn and Hayre6 is known as a multiplicative model in which the respondent multiplies his answers to the sensitive question by a random number from a known distribution. Motivated by Pollock and Bek15 and Eichhorn and Hayre6 we have proposed these models. The proposed scrambled response models are very useful to deal with highly sensitive issues. For example, studies addressing issues such as: i) not only whether or not a woman had an abortion, but in addition, how many abortions she underwent; ii) not only whether the subject used illicit drugs, but also the number of occasions on which drugs were taken; iii) not only if an individual cheated on his income tax report, but also the amount of under-reporting etc. The proposed models will encourage researchers to think more on these lines. The key issue when choosing a model is to find the right trade-off between privacy protection and efficiency in the estimates. In Measure of Privacy Protection we have tested the privacy level of our models, in Efficiency Comparison the efficiency of the models and in Unified Measure of Models Quality we use a unified measure of model quality. The proposed models protect the privacy of the respondents and perform better in terms of unified measure of model quality. Any researcher may think on this line and produce another model by using additive and multiplicative models but they have to test their efficiency level, privacy level and unified measure of model quality. In many cases, it may be possible that a model may be efficient but it is not necessary that the model also protects the respondent's privacy and performs better in terms of unified measure.
Suppose  be the finite population and
  be a quantitative sensitive variable of interest with unknown mean and variance
  respectively. Let W1, W2, S, and U be the scrambling variables independent of Y with means
  and variances
 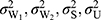 respectively. A random sample of size n respondents was drawn from the population under a simple random sampling with replacement scheme. Each selected respondent in the sample was provided with a random device having three types of cards bearing statements: i) green cards with the statement: report sensitive variable Y; ii) red cards with the statement: report the scrambled response YW1+W2; iii) yellow card: report scramble value Z=YS (for model 1) and Z=W3(Y+U) (for model 2) with probabilities P1, P2 and P3 respectively, such that
  .
.
Model 1
In our models, the hypothesis is to develop whether our models are effective or not for estimating the population mean of quantitative sensitive characteristics and in protecting the privacy of respondents.
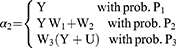
Let the response be  whose distribution is as follows:
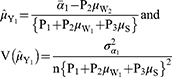
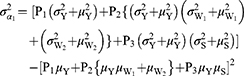
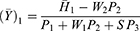
Hence, for the observed reported response  , the mean and variance of quantitative sensitive variable Y are as follows:
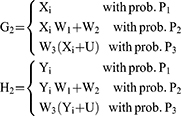
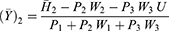
Model 2
Let the response be  whose distribution is as follows:
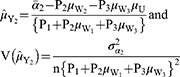
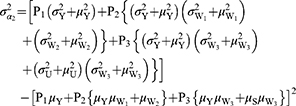
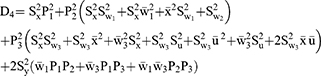
Hence, for the observed reported response  , the mean and variance of quantitative sensitive variable Y are given by
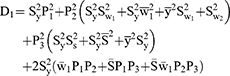
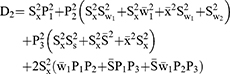
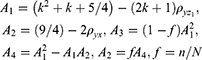
where
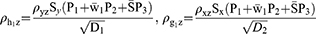
Measure of Privacy Protection
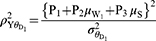
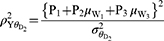
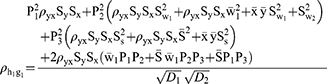
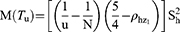
Following the work of Diana and Perri5 the square of correlation coefficient between observed response and quantitative sensitive variables from models 1 and 2 are denoted by  and given as
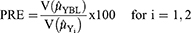
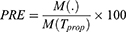
Efficiency Comparison
To show the performances of the proposed models, we have compared with the Bar-Lev et al3 model in terms of percent relative efficiencies (PREs) using the formula:
We have considered that scrambling variables follow a Poisson distribution. The data sets used for empirical comparison are given in Table 1.
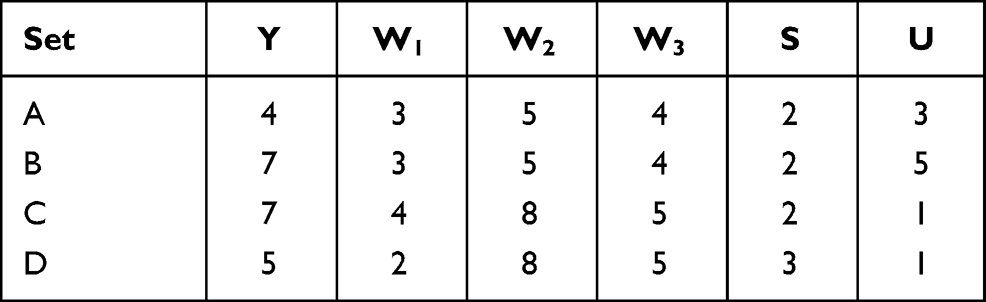 |
Table 1 Data Set Used for Efficiency Comparison |
From Tables 2 and 3, it may be seen that when we decrease the value of P1 (probability of reporting the sensitive variable), the values of percent relative efficiencies increase. The values of percent relative efficiencies are high when the probability of selecting the third statement is also high (probability of reporting scrambled value). The level of privacy protection is closer to 1 in maximum cases. Hence, our proposed models perform better to deal with highly sensitive issues than the competitor when the probability of reporting scrambling variables is high.
 |
Table 2 PRE of the Suggested Models 1, 2 for Data Set A with Respect to the Bar Lev et al3 Model Along with PP and |

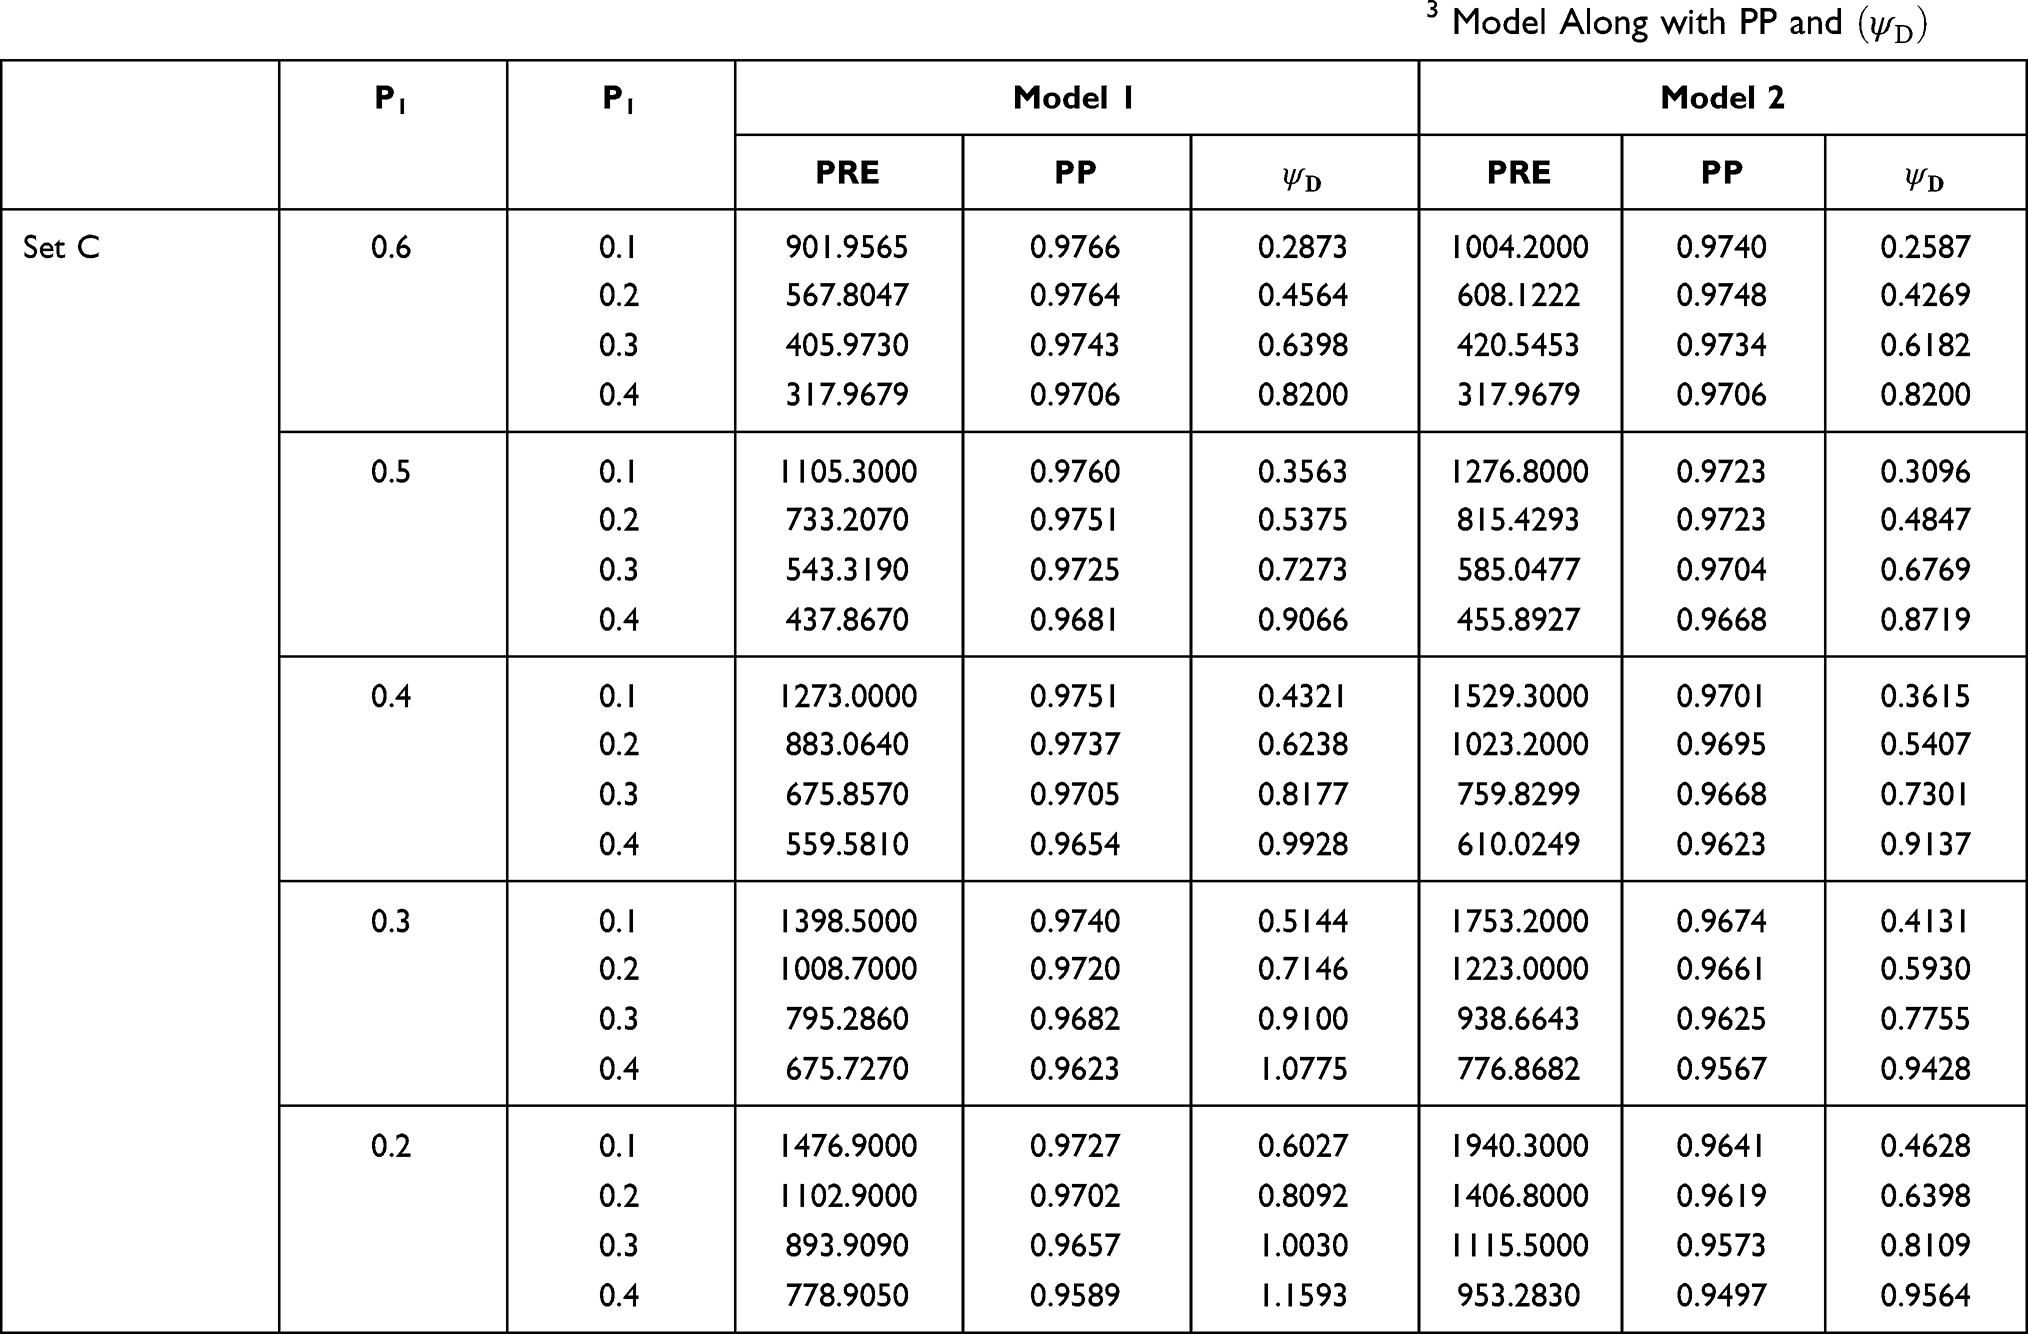 |
Table 3 PRE of the Suggested Models 1, 2 for Data Set C with Respect to the Bar Lev et al3 Model Along with PP and |

In Table 4, for model 1, the values of percent relative efficiencies increase for decreasing values of P1 (probability of reporting sensitive variable). The values of percent relative efficiencies are high when the probability of selecting the third statement is also high (probability of reporting scrambled value). For model 2, the values of PREs follow the same trend except for the point P1=0.2. We get the highest value of percent relative efficiency when the probability of selecting the first statement is 0.3 and the probability of selecting the third statement is 0.6. In almost all cases the privacy level is high for both models. Hence, both of our scrambled response models may be useful when dealing with sensitive issues.
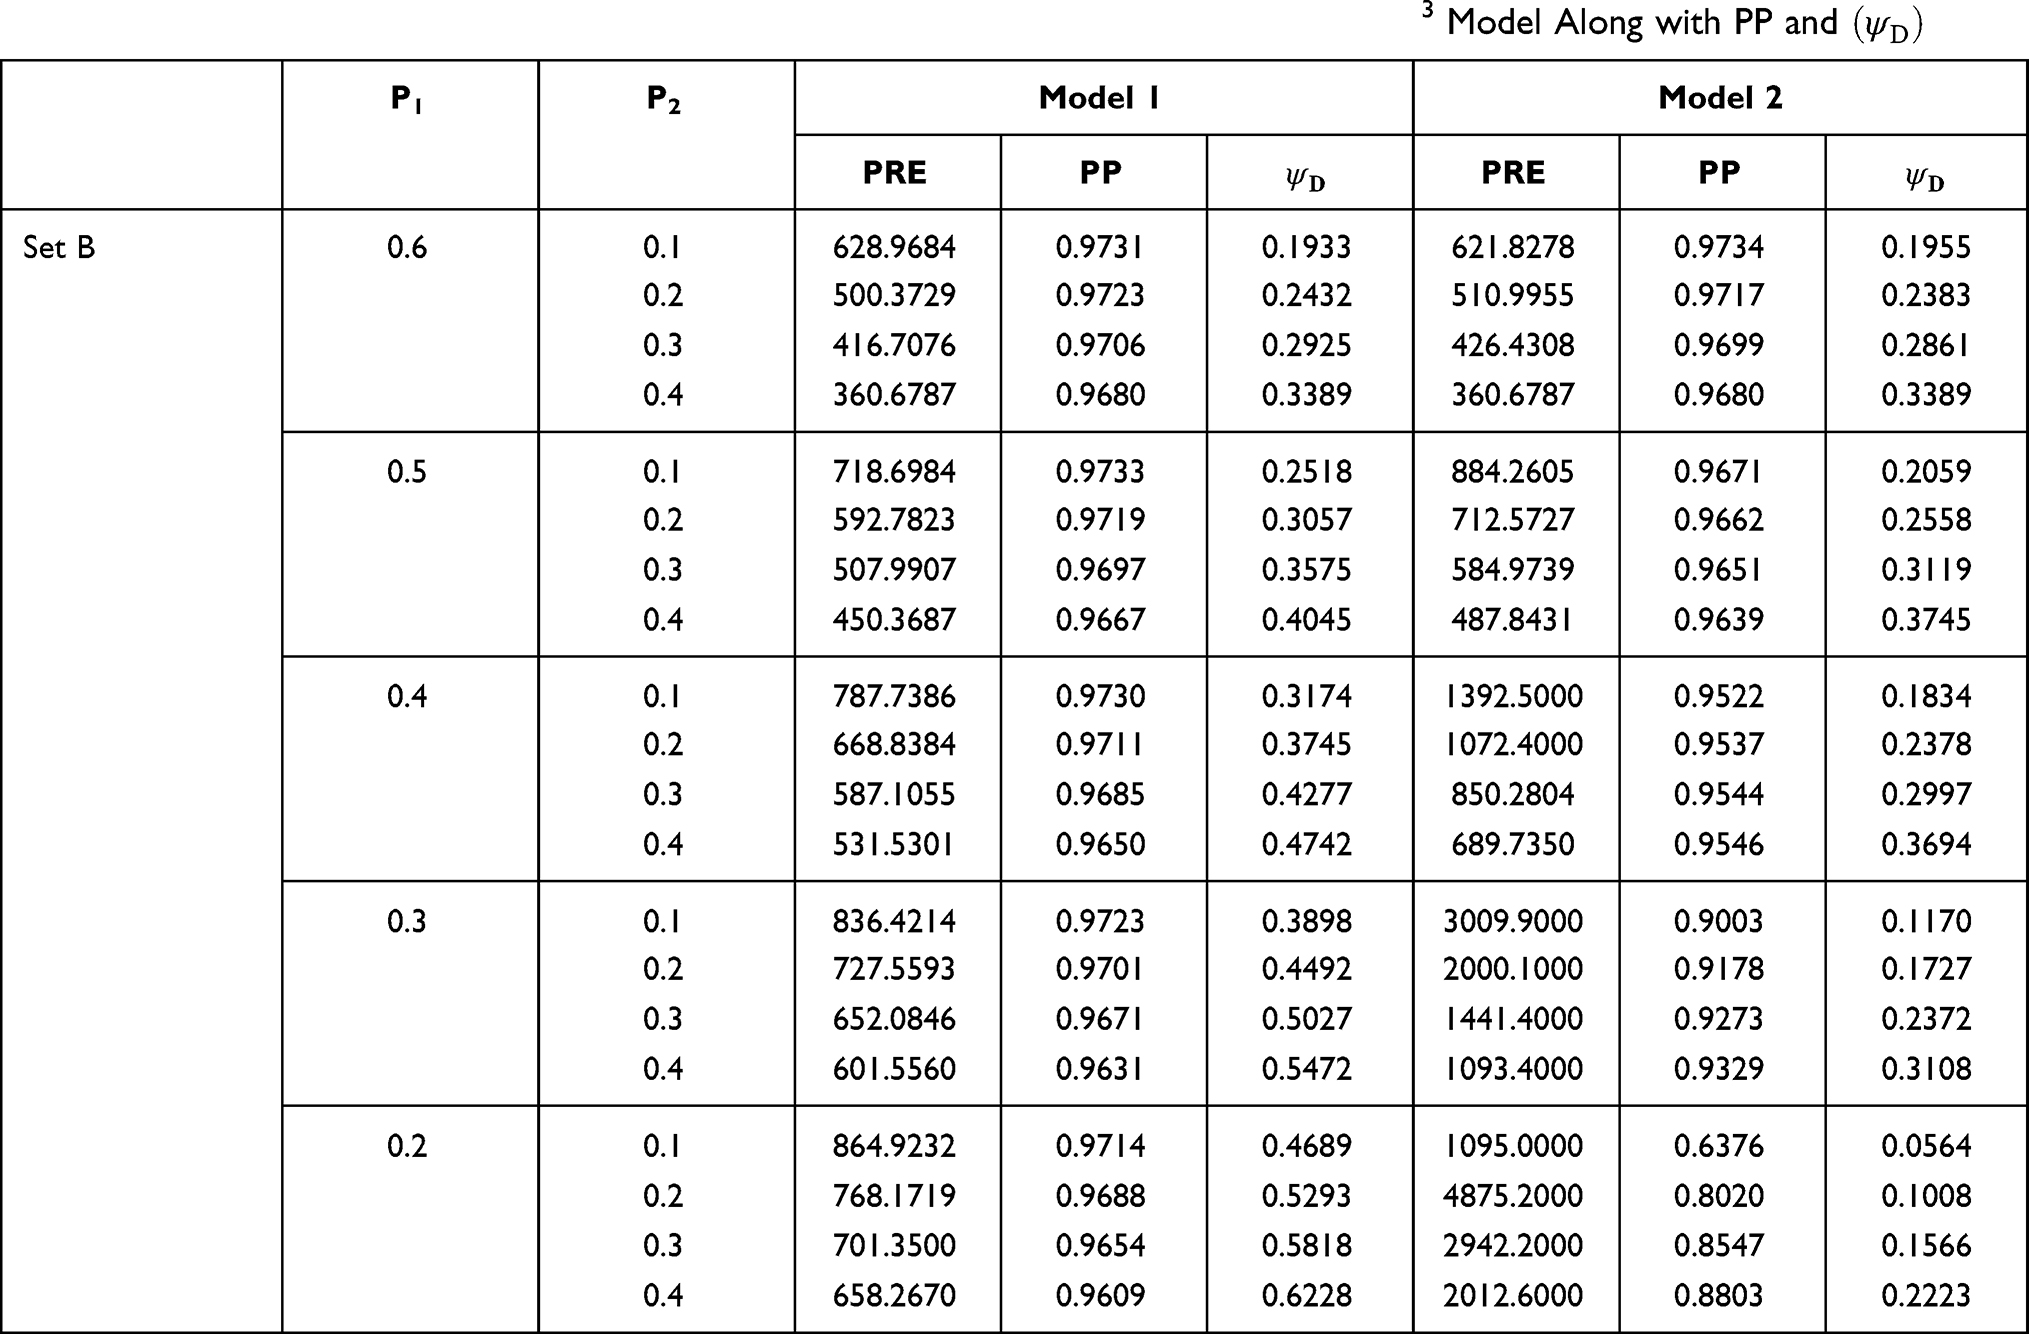 |
Table 4 PRE of the Suggested Models 1, 2 for Data Set B with Respect to the Bar Lev et al3 Model Along with PP and |

In Table 5, for model 2, the values of percent relative efficiencies increase for decreasing values of P1 (probability of reporting sensitive variables). The values of percent relative efficiencies are high when the probability of selecting the third statement is also high (probability reporting scrambled value). For model 1, the values of PREs follow the same trend as in model 2 except for the probabilities P1=0.3 and 0.2. We get the highest value of percent relative efficiency when the probability of selecting the first statement is 0.4 and the probability of selecting third statement is 0.5. In almost all cases the privacy level is high for both models.
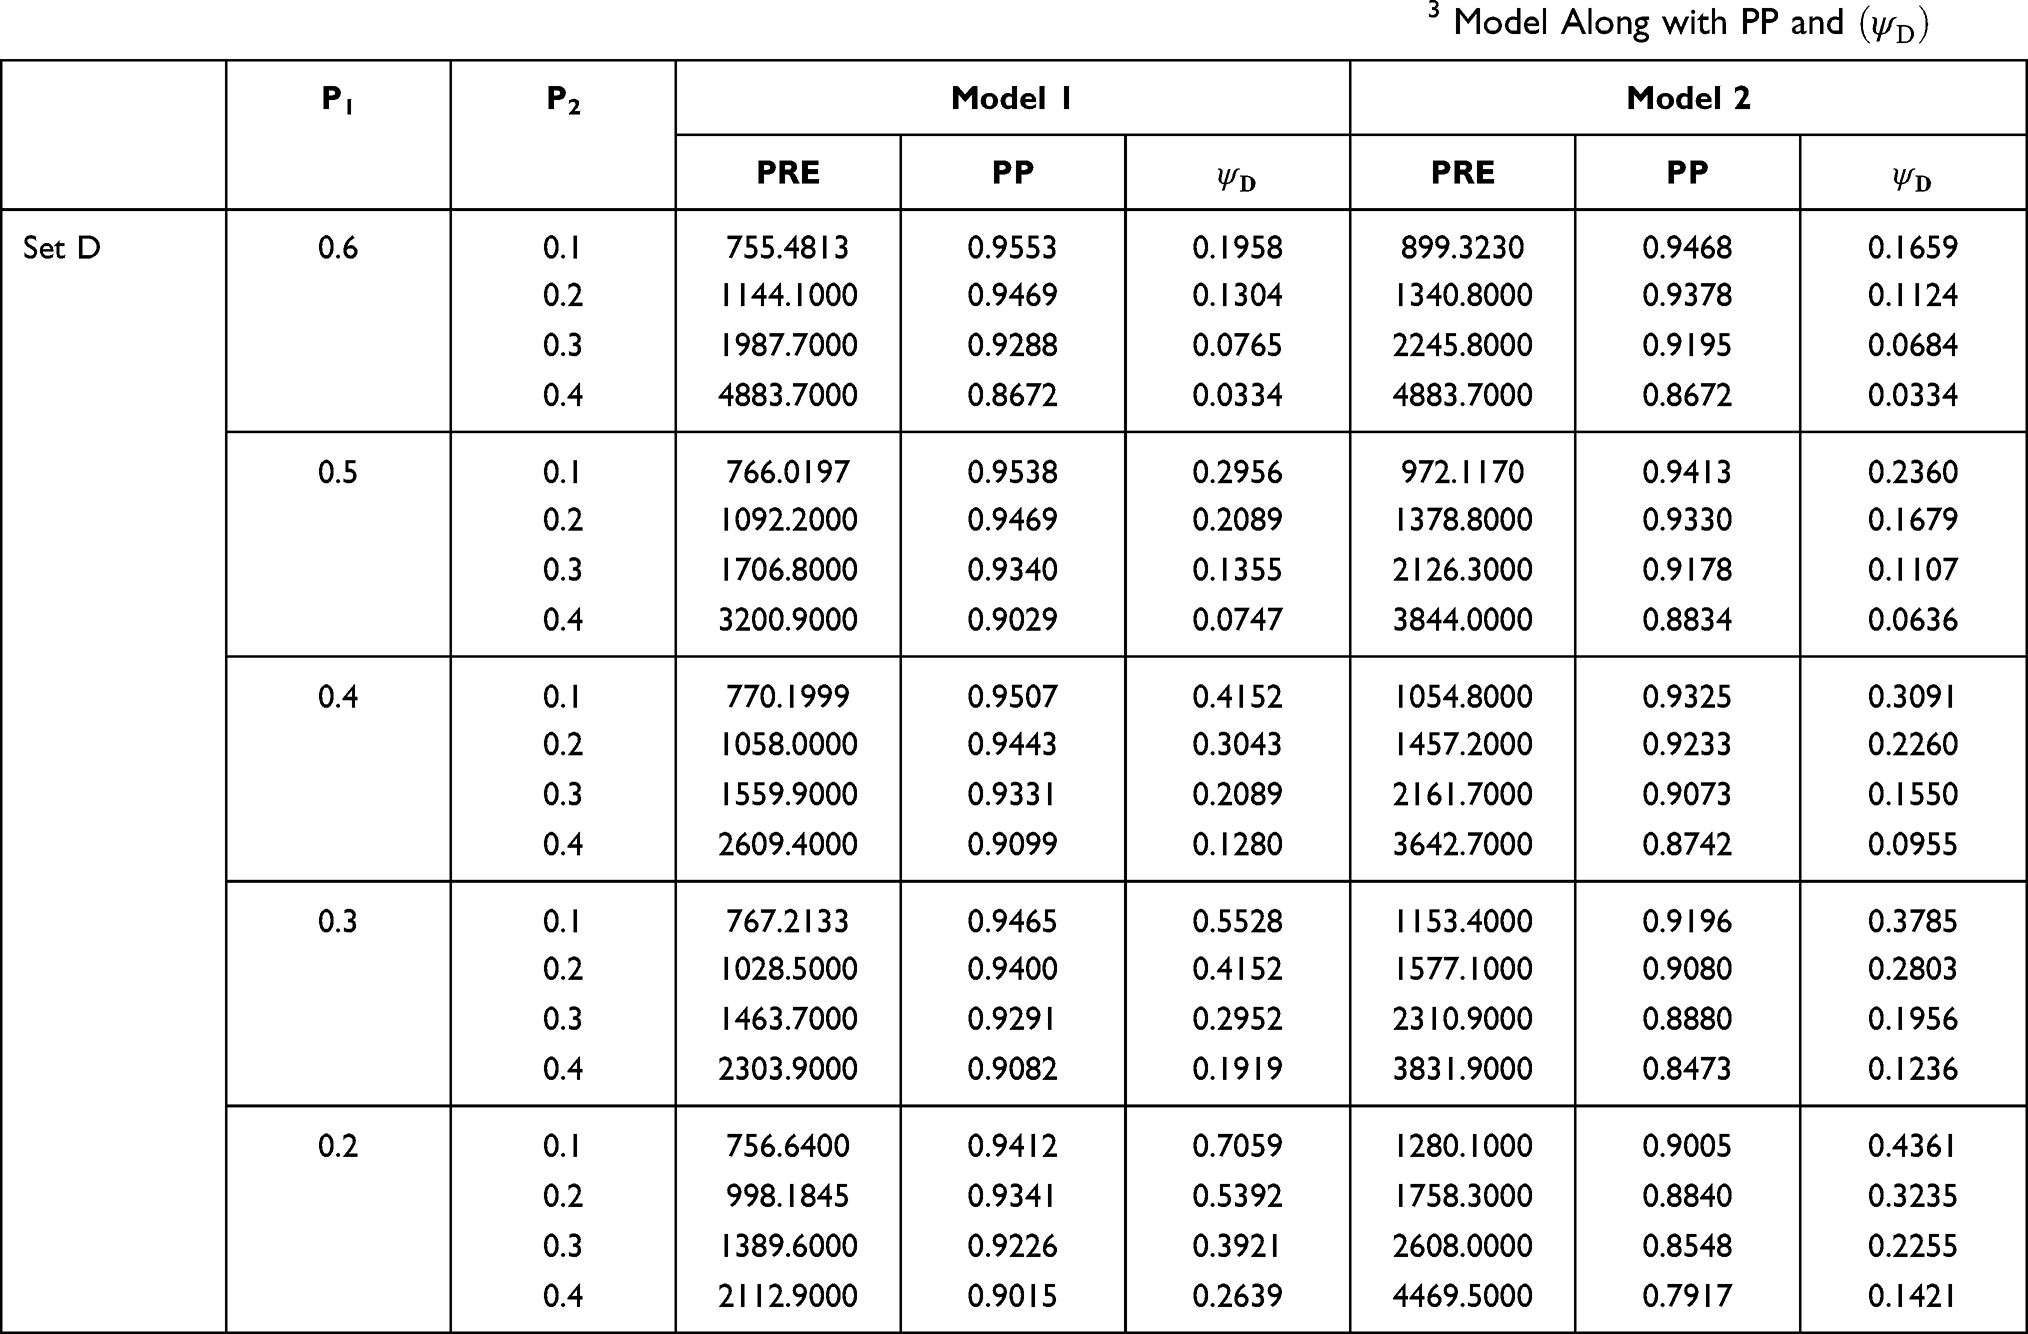 |
Table 5 PRE of the Suggested Models 1, 2 for Data Set D with Respect to the Bar Lev et al3 Model Along with PP and |

Unified Measure of Models Quality
Following the work of Gupta et al8 unified measures are calculated for the proposed models and Bar-Lev et al3 models using the formula
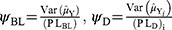
where  and
and  are the variance and privacy level of the Bar-Lev et al3 model and
  and
and  are the variance and privacy level of the proposed models respectively.
The graphical representations of the proposed models with respect to the Bar–Lev et al3 model are shown in Figures 1–8.
 |
Figure 1 Unified measure for Model 1 (Set A). |
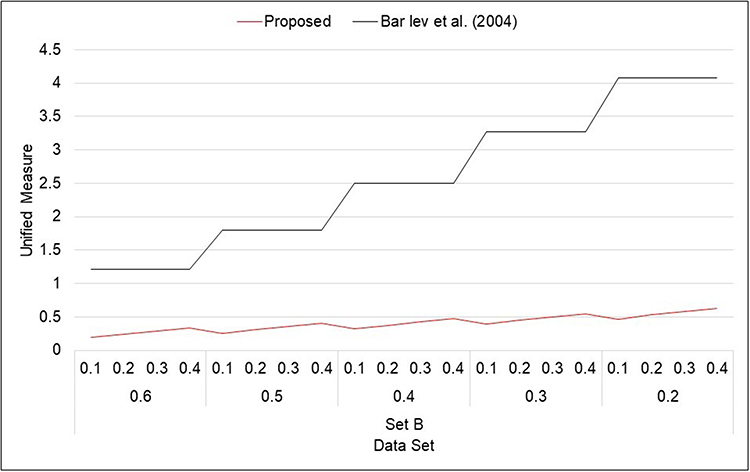 |
Figure 2 Unified measure for Model 1 (Set B). |
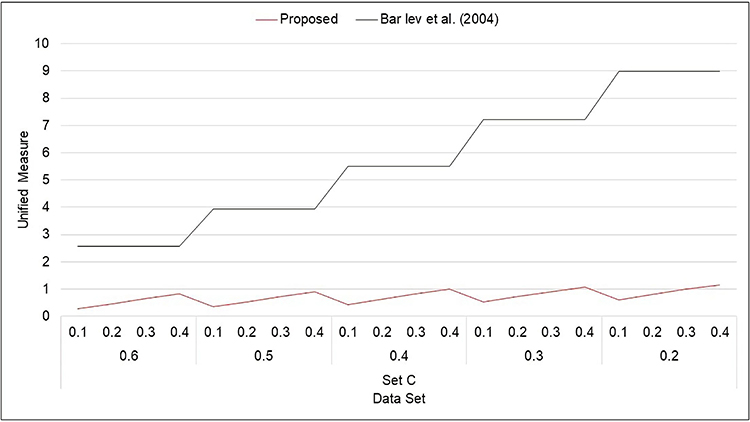 |
Figure 3 Unified measure for Model 1 (Set C). |
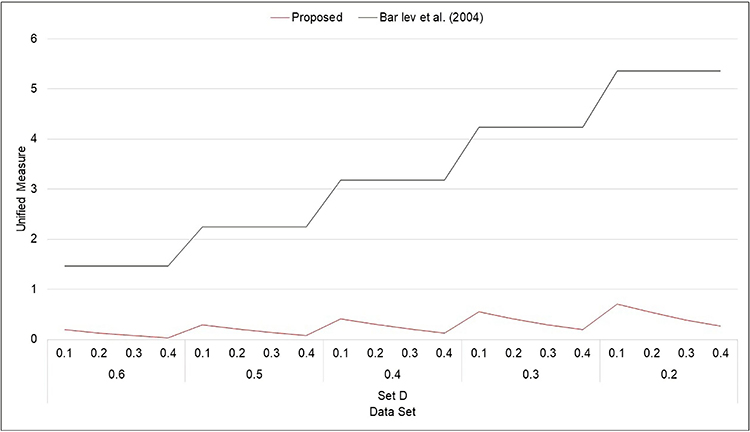 |
Figure 4 Unified measure for Model 1 (Set D). |
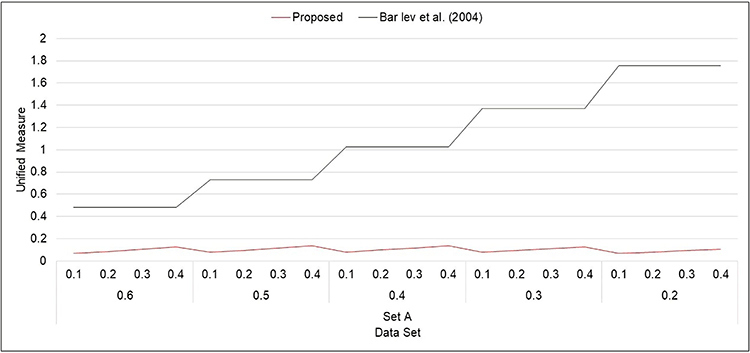 |
Figure 5 Unified measure for Model 2 (Set A). |
 |
Figure 6 Unified measure for Model 2 (Set B). |
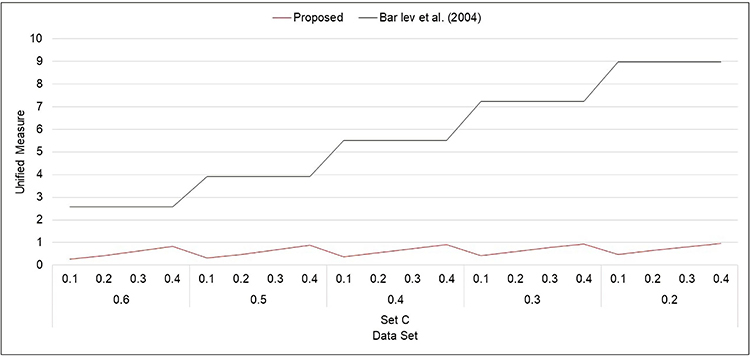 |
Figure 7 Unified measure for Model 2 (Set C). |
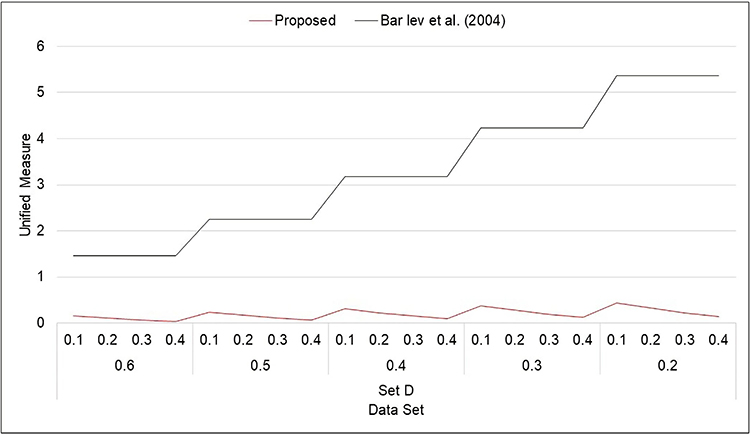 |
Figure 8 Unified measure for Model 2 (Set D). |
Successive Sampling Scheme
Let 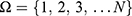 be a finite population of size N, which has been sampled over two occasions. The character under study is a sensitive variable denoted by x(y) on the first (second) occasion and z is a non-sensitive auxiliary variable available at both occasions. On the first (second) occasion the sensitive variables x(y) are coded to g (h) with the aid of scrambling variables. The scrambling variable may follow a probability distribution.
The following notations have been considered for further use:
 : population means of the variables
  .
.
 : sample means of the respective variables based on sample sizes shown in suffices.
 : sample means of the non-sensitive auxiliary variable based on the sample sizes shown in suffices.
 : correlation coefficients between the variables shown in suffices.
 : population variance of the variables
  .
.
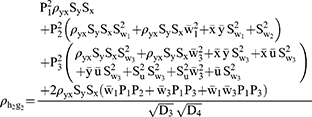
Proposed Scrambled Response Models Under Successive Sampling
In this section our hypothesis is to determine whether our models are effective or not for estimating the quantitative sensitive characteristics and for estimating the sensitive population mean when it changes frequently with the passage of time according to its nature.
The proposed randomized devices under the first and second occasions for the ith respondent scrambled response is given as
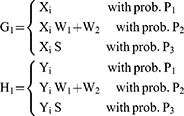
For estimating the sensitive population mean on two occasions, successive sampling for the sensitive variables x(y) which are coded as g (h) and given as
The sensitive variables x(y) are coded as g (h) and are given by


Proposed Estimators
Exponential-type estimators play a vital role in increasing the precision of the estimates and are more stable over the sampling fluctuations. Bahl and Tuteja2 were the first who proposed the exponential estimators and discussed certain regularity conditions under which their proposed estimators were better in comparison with mean per unit and ratio and product estimators. Further, they have reduced the sampling variance/MSE of their proposed estimators to the level of regression estimators. Thus, the exponential estimator given by Bahl and Tuteja2 may be treated as an alternative of regression estimators. Thereafter, following the lines of Bahl and Tuteja,2 various notable authors such as Singh and Homa,19 Priyanka and Mittal,13 Singh et al.,20 Singh and Pal,21 Singh et al22 among others have proposed efficient estimators using an exponential function with effective results which are published in reputed journals. Since, exponential-type estimators are the better alternative for increasing the precision of the estimates. Encouraged by these works and motivated to put forward our idea to sample survey audiences, we have proposed exponential-type estimators and used the proposed scrambled response models in this under successive sampling. The proposed estimators found better in terms of percent relative efficiency and may be used when we deal with quantitative sensitive characteristics and for estimating the sensitive population mean when it changes frequently with the passage of time according to its nature.
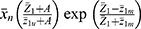
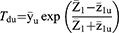
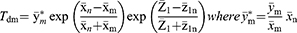
For estimating the population mean of sensitive variables on the current (second) occasion, two independent estimators are proposed as follows:
The estimators defined in Equations (7 and 8) are further reproduced in the functional form as

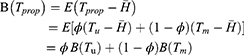
The final estimator is a convex linear combination of two estimators  and
and  shown as
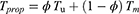
where  is a constant to be determined under some criteria such that
  is more precise.
Properties of the Proposed Estimator
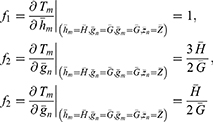
To obtain the bias and mean square error of the proposed estimators  , we consider the following transformation.
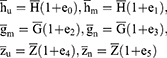
Such that 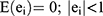 , where i= 0, 1, 2, 3, 4, 5.
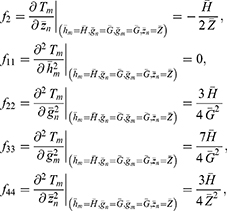
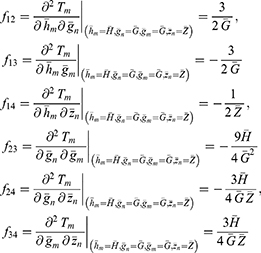
Thus, we have the following expressions
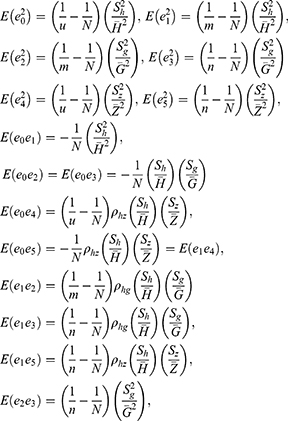
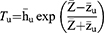
Using Taylor series expansions up to the first order, we expand the functional form of the estimator

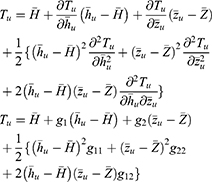
The bias and mean square error of the estimator Tu aregiven as
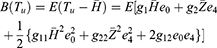

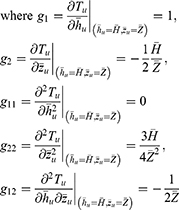
Remark: s g and h are two coded response variables over two successive moves and z is a stable non-sensitive auxiliary variable. Hence, following Murthy11 and Reddy,16 we assume that the coefficient of variations g, h and z are almost equal 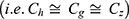 .
.
Substituting the values of g1, g2, g11, g22 and g12 in Equations (13 and 14), we get the bias and mean square of the estimator Tu as

The function  is based on statistics
  and satisfies the following regularity conditions:
 assumes the value in the closed convex subset
  of two-dimensional space containing the point
  .
. is continuous and bounded in
  .
. and
and  where
where  is the first-order derivative of g with respect to
  .
. exists and is continuous and bounded in
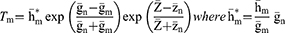
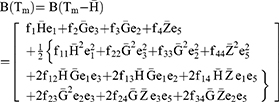
Similarly, the bias and mean square error of the estimator Tm are derived using the following steps
Following Taylor series expressions, we have
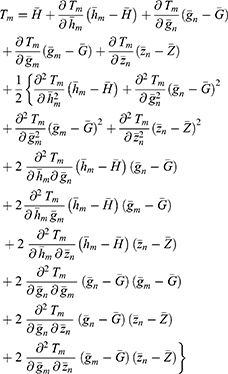
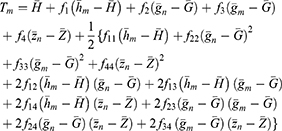
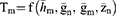
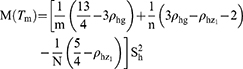
The bias and mean square error of the estimator Tm are given as
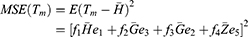
Substituting the values of  in Equations (19 and 20), we get the bias and mean square of the estimator Tm as

The function 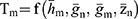 is based on statistics
 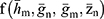 and satisfies the similar regularity conditions as Equation (11).
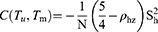
From Equations (12 and 18) we get the covariance between 
Theorem 1: The bias of the estimator  to be the first order of approximations is obtained as
where  and
and  are given in Equations (15 and 21) respectively.
Theorem 2: Mean square error of the estimator  to the first order of approximations is derived as
where  ,
,  and
and  are given in Equations (16, 22 and 23) respectively.
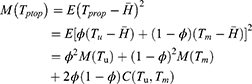
Minimum Mean Square Error of the Estimator 
The MSE of the estimator  given in Equation (25) is a function of unknown constant
  , therefore, to obtain the optimum choice of
  , we minimize Equation (25) with respect to
  as
as
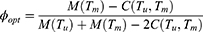
Putting the value of  in Equation (25), we have optimum MSE of the estimator
  as
as
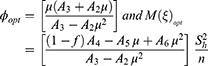
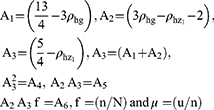
Further, substituting the expressions of  in Equations (26 and 27), the simplified values of
  and
and  are obtained as
Optimum Replacement Strategy
To determine the optimum value of µ (fraction of sample to be drawn afresh on the current occasion) so that  be estimated with maximum precision and minimum cost, we minimize
  µ which results in a quadratic equation in µ given as
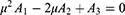
Solving Equation (29), the solutions of  are given as

The real value of  lies only if
  . So, using Equation (30) and putting the admissible value of
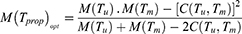
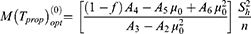
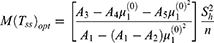
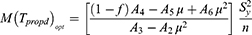
  in Equation (28), the optimum value for the mean square error of the estimator Tprop is written as
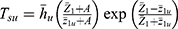
Estimators for Sensitive Population Mean at Current Occasion Under Proposed Scrambled Response Models
To obtain the estimator of the sensitive population mean at current occasion estimators  the coded response variable
  on the current move in Equations 1 and 2 is replaced by its estimators respectively and presented in Table 6.
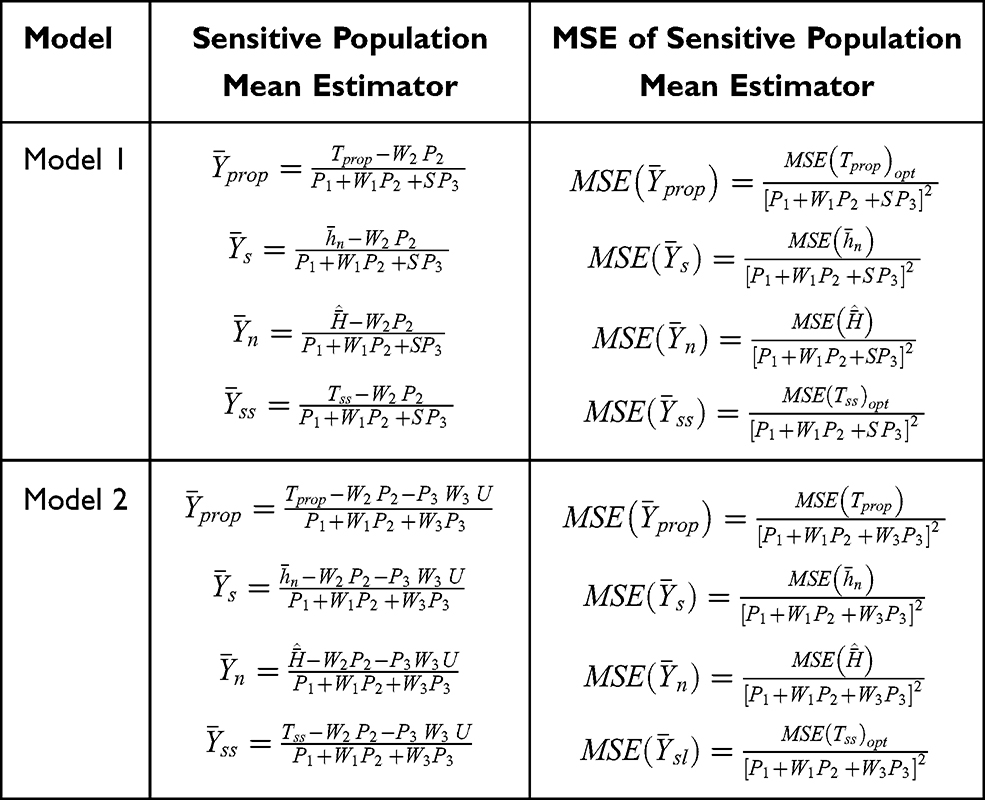 |
Table 6 Sensitive Population Mean Estimators and Their Mean Square Errors Under the Proposed Scrambled Response Models |
Monte Carlo Simulation Study
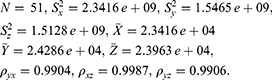
The simulation study has been carried out by considering 5000 different samples using Monte Carlo simulation for Population-I. The simulated PRE of the proposed estimator with respect to the sample mean estimator, natural successive sampling estimator and Singh and Sharma18 estimators have been computed using the data set  .
.
The following steps summarize the simulation study as follows:
Step 1. Consider a real population of size N=51 (Population-I), from which 5000 SRSWOR different samples of size n=20 have been selected.
Step 2. From each of the selected samples, m=16 units were retained as a matched portion from sample n.
Step 3. To draw a SRSWOR of size u=4 (fresh) from the remaining part of the population of size N-n=31 as an unmatched portion.
Step 4. Calculate the value of  from new unmatched units, u on the current occasion and Tm from the m units retained units.
Step 5. Calculate the value of the estimator  based on the value of
  and
and  .
.
Step 6. Repeat step (2), (3), (4) and (5), 5000 times. Thus, we obtain 5000 values for the suggested estimator  .
.
Step 7. The MSE of  is obtained by
  .
.
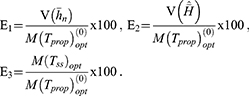
The efficiency of the estimator  with respect to the considered estimator is defined by:
From Table 7, we deal with quantitative sensitive characteristics and for estimating the population mean when it changes frequently with the passing of time according to its nature. The values of percent relative efficiencies are always greater than 100 for all cases but do not follow any specific pattern for decreasing values of P1 and increasing values of P2. Therefore, the proposed estimators may be used when we want to monitor sensitive issues which change according to time.
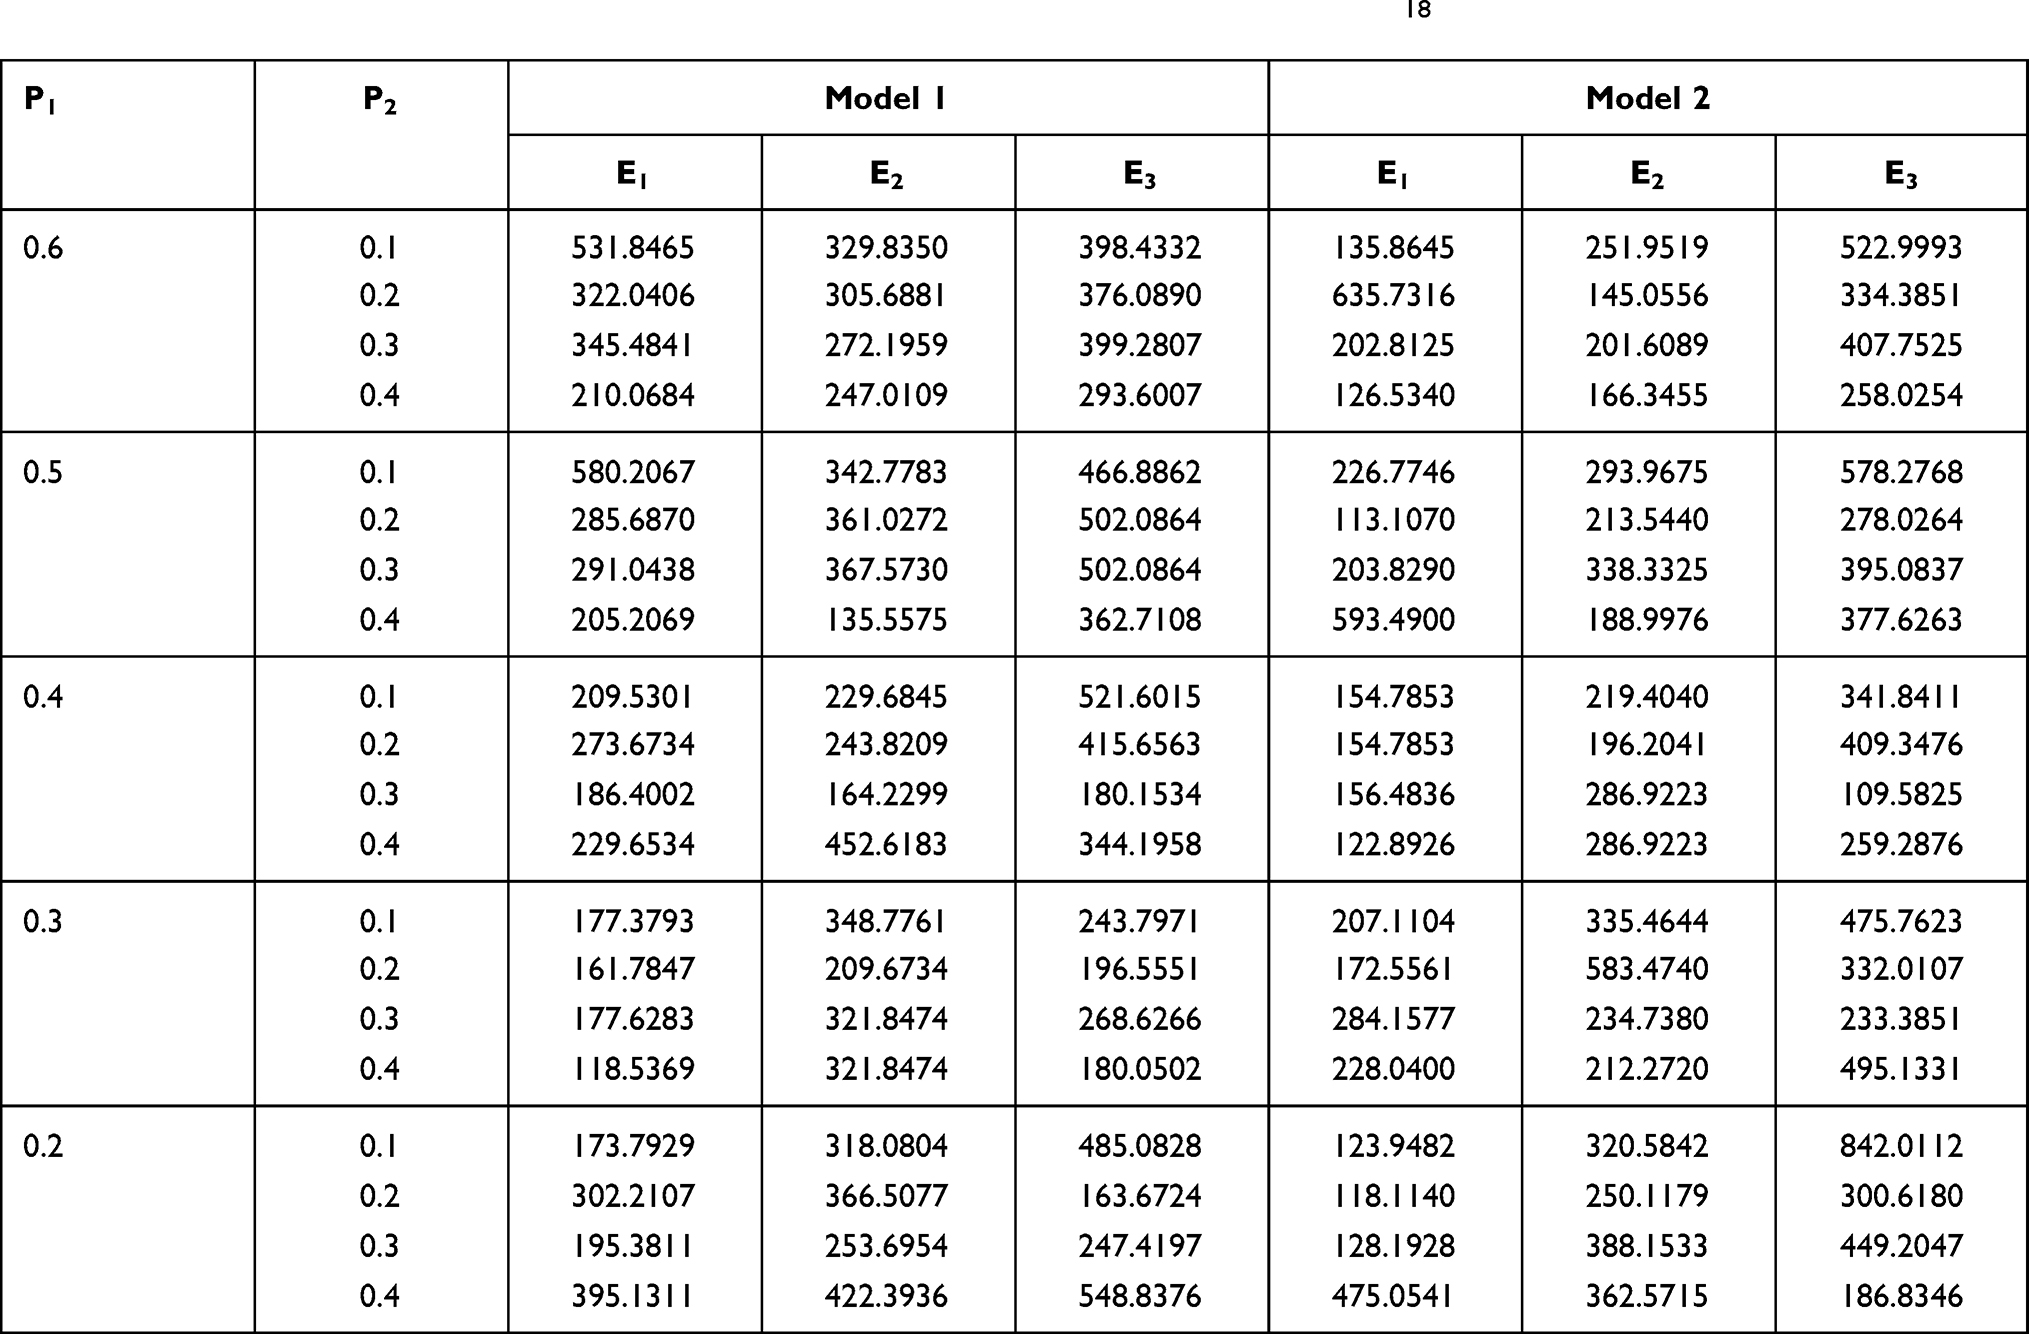 |
Table 7 Percent Relative Efficiencies of |


Empirical Study
To show the performances of the proposed estimator  , we compare with sample mean estimator
  (when there is no matching), natural successive sampling estimator
 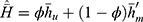 where
where 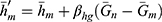 and the Singh and Sharma18 estimator
  . The estimator suggested by Singh and Sharma18 is as follows


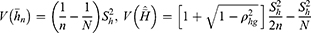
The variance of  , optimum variance of
  and the optimum mean square error of Singh and Sharma18 estimators are as follows
Population-I: source Statistical Abstracts of United States.
Let y, x and z be the number of abortions reported in the states of the US during the year 2007, 2005 and 2004 respectively. We consider a real data of N=51 units with the following parameters:
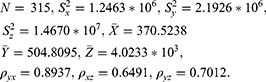
Population–II: source Priyanka and Trisandhya.12
Utilizing the above data, the percent relative efficiencies of the proposed estimator  with respect to
  ,
,  and the Singh and Sharma18 estimators are computed using the formula given below and presented in Tables 7 and 8.
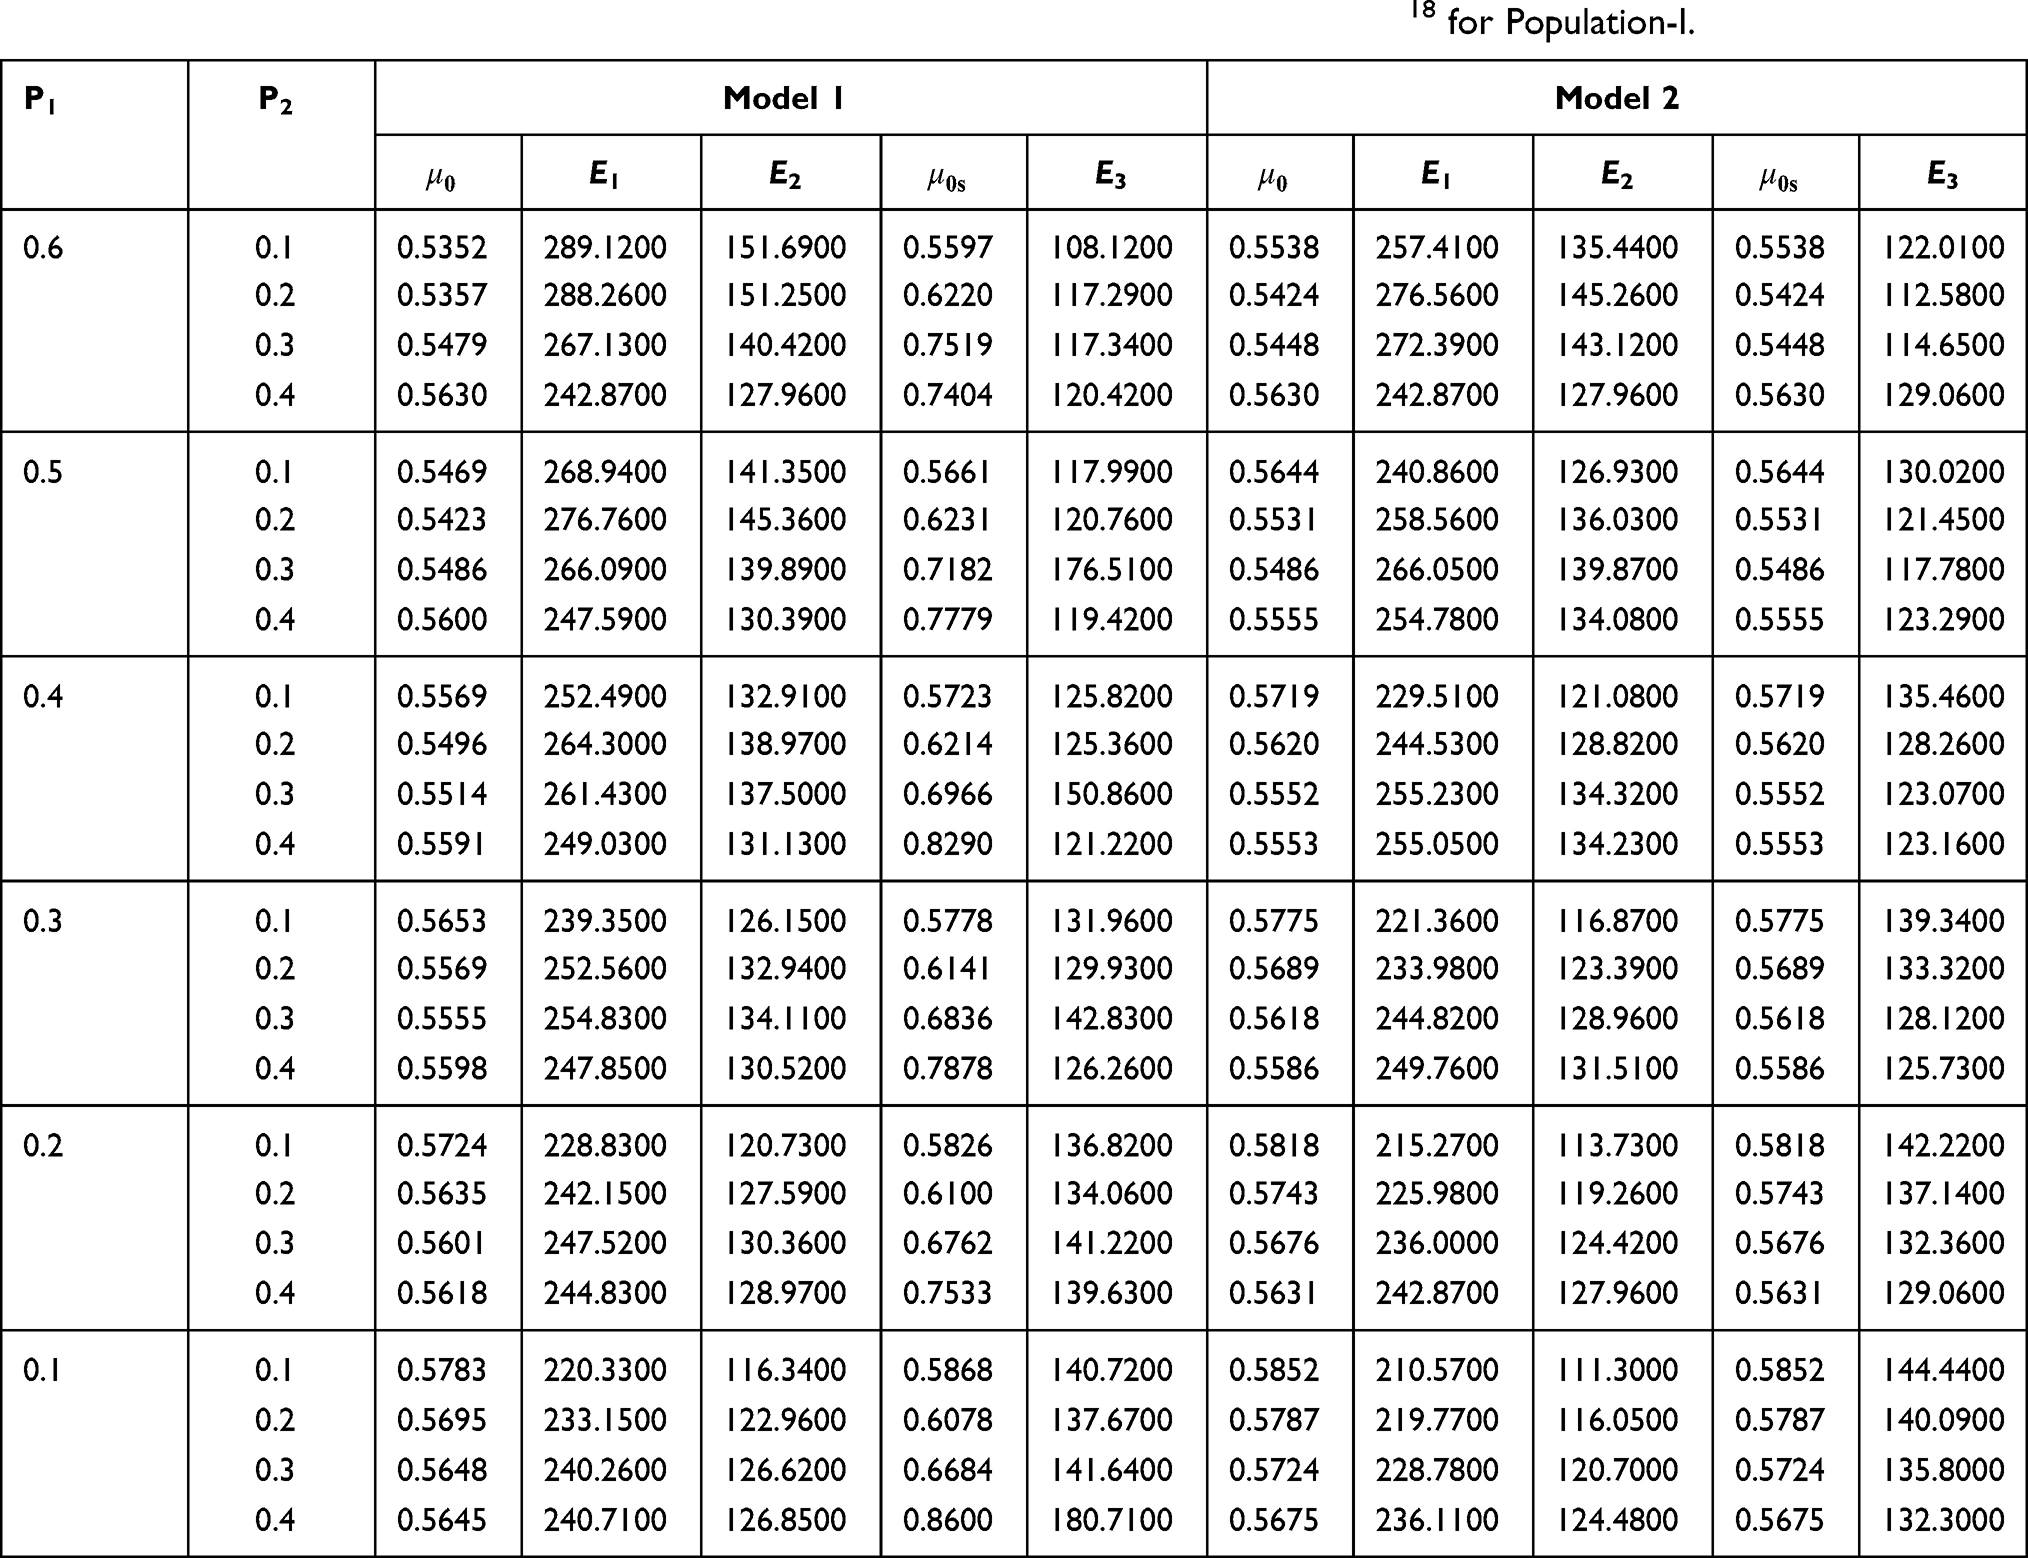 |
Table 8 Optimum Values |


From Table 8, for models 1 and 2, it may be read that the percent relative efficiencies of the proposed estimator are decreasing with decreasing values of P1 with respect to the sample mean estimator and natural successive estimator. The minimum value of  is 0.5352 which indicates that the fraction of fresh sample to be replaced at the current occasion is as low as about 53% of the total sample size, which reduces the cost of the survey. The values of percent relative efficiencies increase with the decreasing values of P1 with respect to the Singh and Sharma18 estimator.
From Table 9, for models 1 and 2, it may be read that the percent relative efficiencies of the proposed estimator decrease with the decreasing values of P1 with respect to the sample mean estimator and natural successive estimator. The minimum value of  is 0.5112, which indicates that the fraction of fresh sample to be replaced at the current occasion is as low as about 51% of the total sample size, which reduces the cost of the survey. The values of percent relative efficiencies increase with decreasing value of P1 with respect to the Singh and Sharma18 estimator.
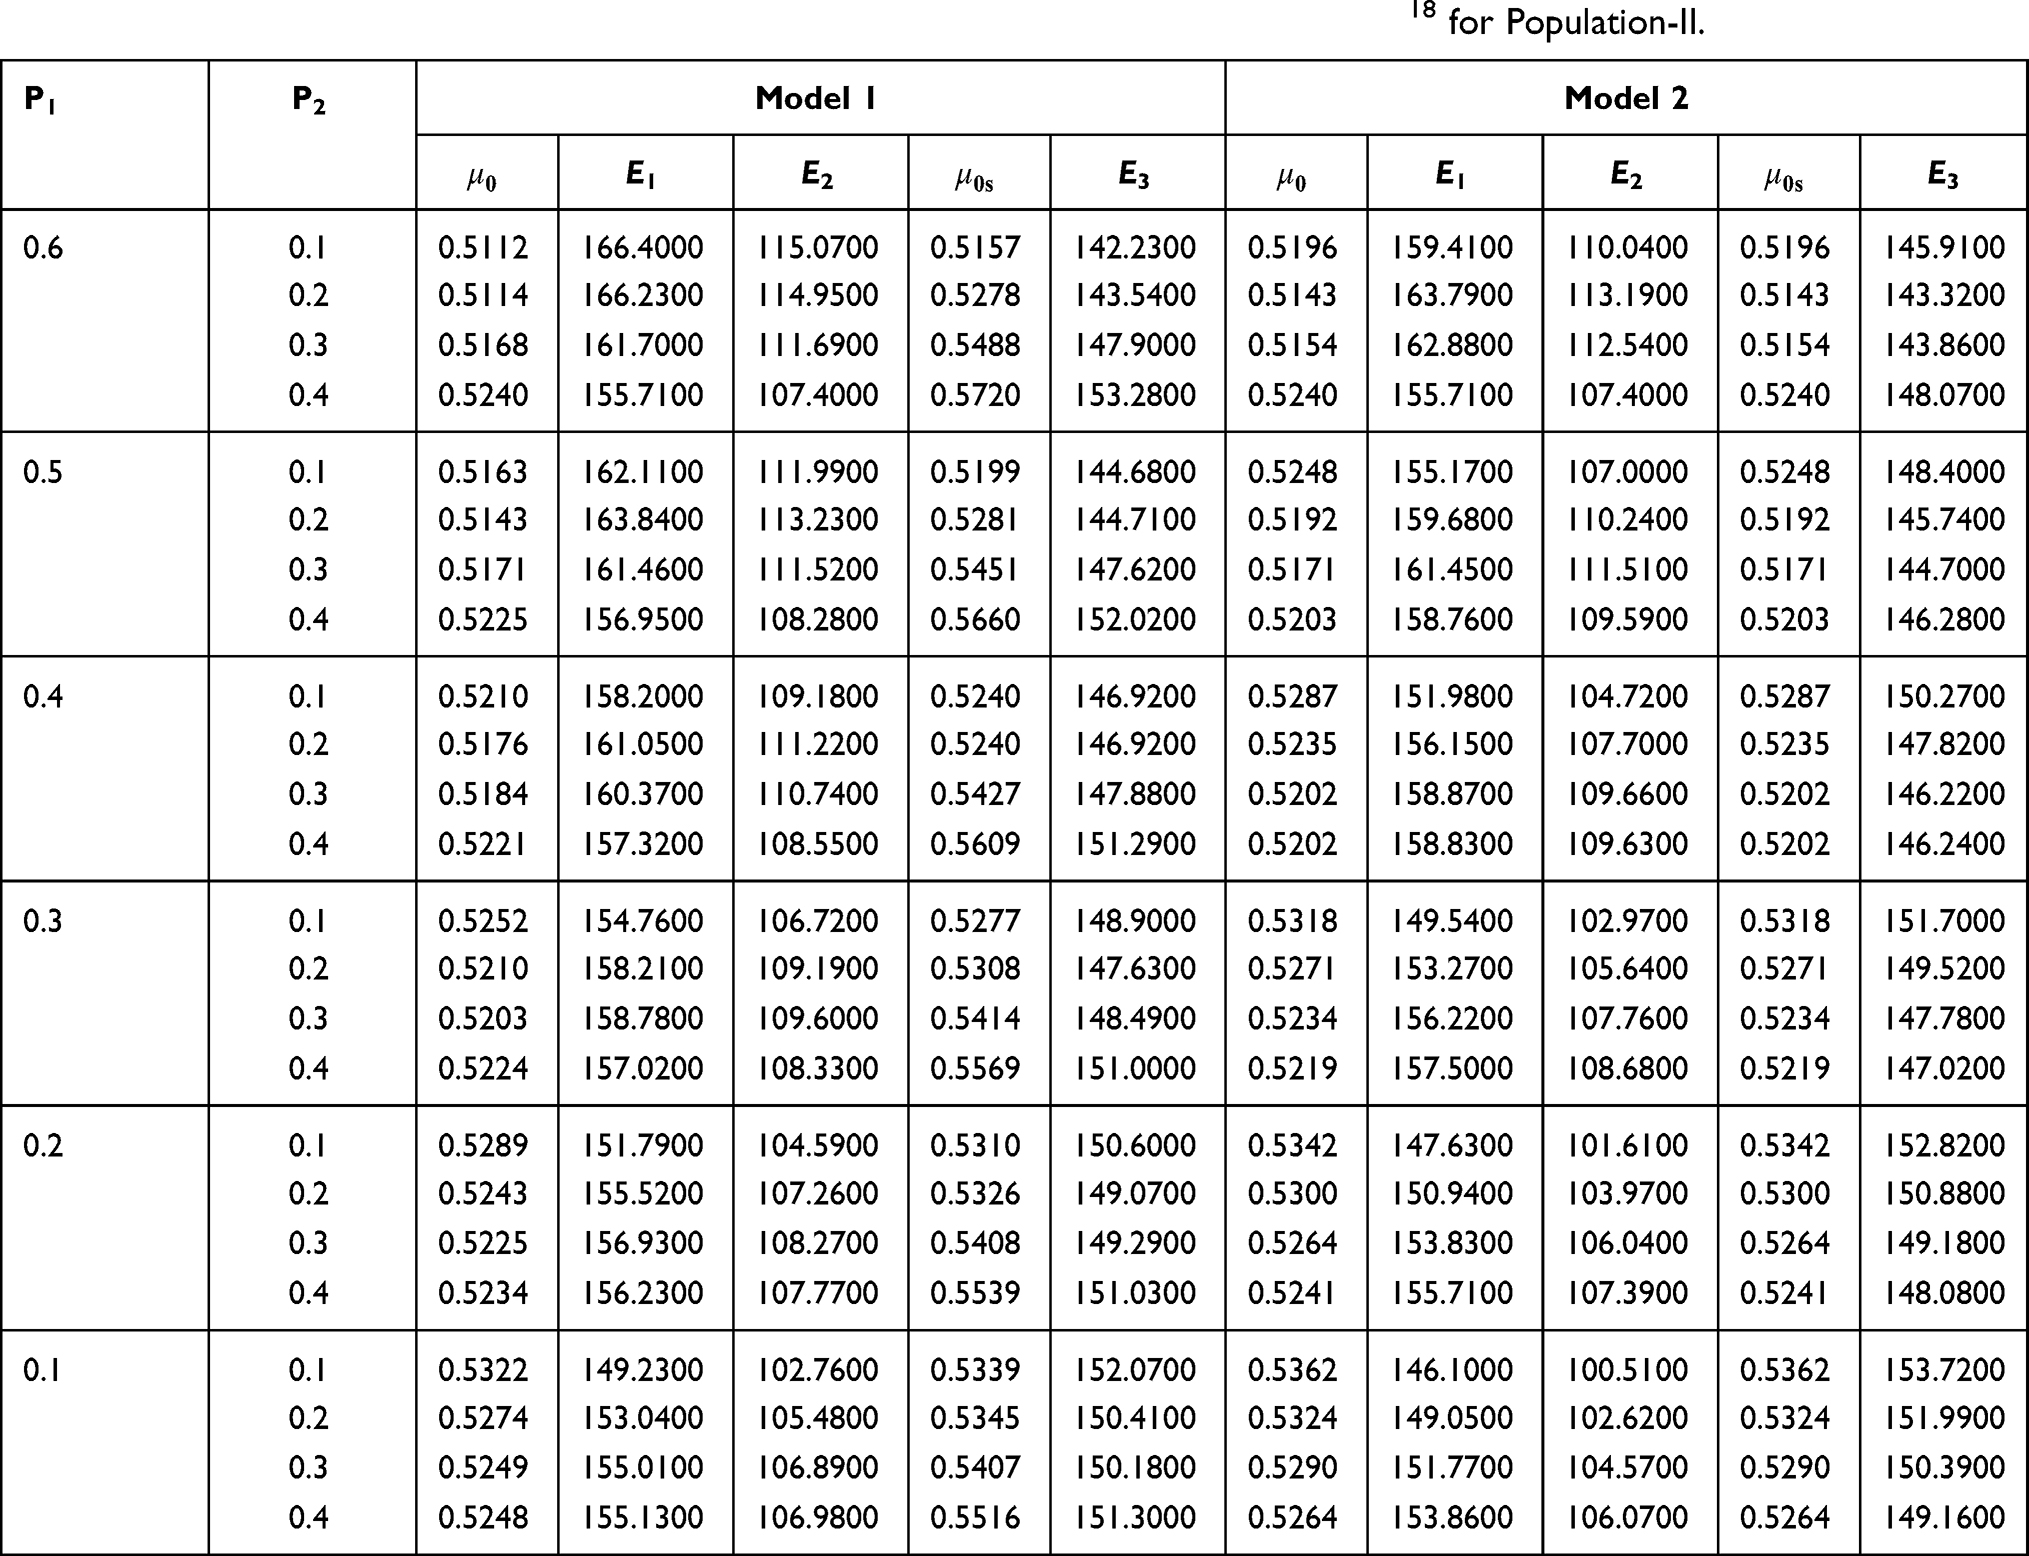 |
Table 9 Optimum Values |


Scrambling Mechanism versus Direct Questioning
If no scrambled response technique has been used, then the estimator under the direct method is given as
Another estimator based on a sample of size m common to both occasions is a modified exponential-type estimator and structured as
The final estimator is a convex linear combination of two estimators  and
and  shown as

The minimum mean square error of the estimator up to first-order approximations is given as
The percent relative efficiencies have been computed using data in Estimators for Sensitive Population Mean at Current Occasion Under Proposed Scrambled Response Models for different choices of probabilities and are graphically presented in Figures 9 and 10.
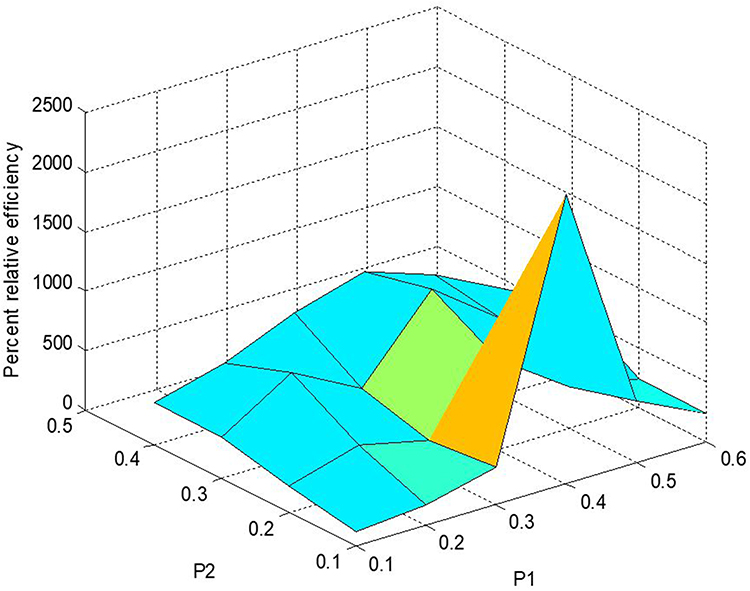 |
Figure 9 Percent relative efficiency E1d for Model 1. |
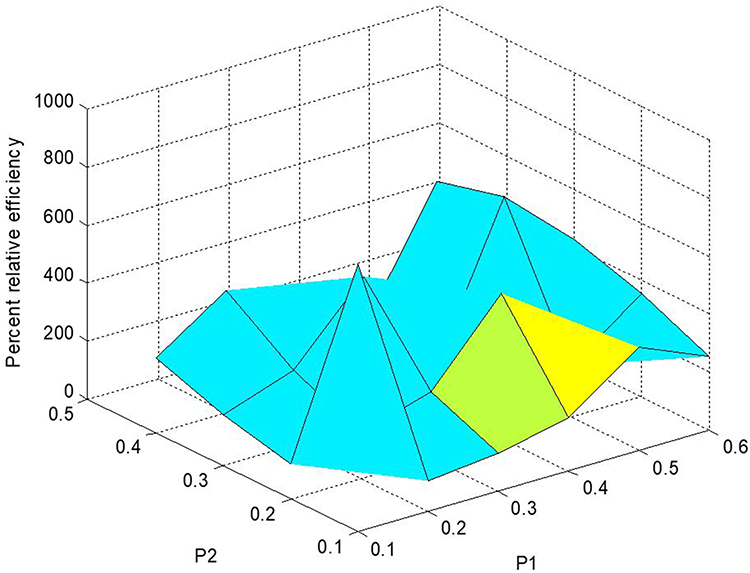 |
Figure 10 Percent relative efficiency E1d for Model 2. |
Interpretation of Results
The following interpretations may be read from Tables 2–9 and Figures 1–10.
- From Tables 2–5, it may be seen that the PREs of the proposed randomized response models with respect to the Bar-Lev et al3 model are always greater than 100, which indicates the dominating behaviors of the proposed models over the Bar–Lev et al3 model.
- From Tables 2–5, it is clear that all the values of τ are greater than 0.5 and closer to 1. Hence, more privacy is protected and greater cooporation may be expected for the proposed models.
- From Figures 1–8, it is visible that the values of unified measure of model quality for the proposed models are smaller than for the Bar-Lev et al3 model. Hence, the proposed models are better than the contemporary randomized response models given by Bar-Lev et al.3
- From Tables 7–9, it may be seen that the suggested estimator under the proposed scrambled response models performs better than sample mean estimator, natural successive sampling estimator and Singh and Sharma18 estimators.
- From Figures 9 and 10, it is visible that the proposed estimator under the scrambled response models when compared with the direct method performs better in terms of percent relative efficiency.
Conclusions and Recommendations
From the above results and interpretations we may conclude that the proposed models are uniformly dominating over the Bar-Lev et al3 model in terms of enhanced precision of estimates. It has been found that to deal with extremely sensitive questions, the proposed models are suitable with a high degree of privacy protection. The suggested estimator accomplishes good percent relative efficiency. Thus, the proposed randomized response models and proposed estimators may be recommended to survey practitioners encouragingly for use in the real life problems, whenever they intend to deal with the quantitative sensitive characteristics and for estimating the sensitive population mean when it changes frequently with the passage of time according to its nature.
Acknowledgments
The authors are thankful to the Indian Institute of Technology (Indian School of Mines), Dhanbad and College of Science and Theoretical Studies, Saudi Electronic University, KSA for providing financial and necessary infrastructural support to carry out the present research work. Authors are also thankful to the honorable reviewers, honorable editor and honorable editorial board for their valuable suggestions which improved the quality of the manuscript.
Disclosure
The authors reported no conflicts of interest for this work.
References
1. Arnab R, Singh S. Estimation of mean of sensitive characteristics for successive sampling. Commun Stat Theory Methods. 2013;42(14):2499–2524. doi:10.1080/03610926.2011.605233
2. Bahl S, Tuteja RK. Ratio and product type exponential estimators. J Inf Optim Sci. 1991;12(1):159–164. doi:10.1080/02522667.1991.10699058
3. Bar-Lev SK, Bobovitch E, Boukai B. A note on randomized response models for quantitative data. Metrika. 2004;60(3):255–260. doi:10.1007/s001840300308
4. Diana G, Perri PF. New scrambled response models for estimating the mean of a sensitive quantitative character. J Appl Stat. 2010;37(11):1875–1890. doi:10.1080/02664760903186031
5. Diana G, Perri PF. A class of estimators for quantitative sensitive data. Stat Pap. 2011;52(3):633–650. doi:10.1007/s00362-009-0273-1
6. Eichhorn BH, Hayre LS. Scrambled randomized response methods for obtaining sensitive quantitative data. J Stat Plan Inference. 1983;7(4):307–316. doi:10.1016/0378-3758(83)90002-2
7. Greenberg BG, Kuebler RR, Abernathy JR, Horvitz DG. Application of the randomized response technique in obtaining quantitative data. J Am Stat Assoc. 1971;66(334):243–250. doi:10.1080/01621459.1971.10482248
8. Gupta S, Mehta S, Shabbir J, Khalil S. A unified measure of respondent privacy and model efficiency in quantitative RRT models. J Stat Theory Pract. 2018;12(3):506–511. doi:10.1080/15598608.2017.1415175
9. Jessen RJ. Statistical investigation of a sample survey for obtaining farm facts. Iowa Agric Home Econ Exp Station Res Bull. 1942;26(304):1–104.
10. Kim JM, Elam ME. A stratified unrelated question randomized response model. Stat Pap. 2007;48(2):215–233. doi:10.1007/s00362-006-0327-6
11. Murthy MN. Sampling Theory and Methods. Calcutta: Statistical Publication Society; 1967.
12. Priyanka K, Trisandhya P. Item sum techniques for quantitative sensitive estimation on successive occasions. Commun Stat Appl Methods. 2019;26(2):175–189. doi:10.29220/CSAM.2019.26.2.175
13. Priyanka K, Mittal R. New approaches using exponential type estimator with cost modelling for population mean on successive waves. Stat Trans New Series. 2017;18(4):569–587. doi:10.21307/stattrans-2017-001
14. Priyanka K, Mittal R, Kim JM. Multivariate rotation design for population mean in sampling on successive occasions. Commun Stat Appl Methods. 2015;22(5):445–462. doi:10.5351/CSAM.2015.22.5.445
15. Pollock KH, Bek Y. A comparison of three randomized response models for quantitative data. J Am Stat Assoc. 1976;71(356):884–886. doi:10.1080/01621459.1976.10480963
16. Reddy VN. A study on the use of prior knowledge on certain population parameters in estimation. Sankhya C. 1978;40:29–37.
17. Son CK, Kim JM. Calibration estimation of adjusted Kuk’s randomized response model for sensitive attribute. Braz J Prob Stat. 2017;31(1):160–178. doi:10.1214/16-BJPS307
18. Singh GN, Sharma AK. An alternative rotation patterns in two occasion successive sampling. Int J Math Stat. 2014;15(3):9–22.
19. Singh GN, Homa F. Effective rotation patterns in successive sampling over two occasions. J Stat Theory Pract. 2013;7(1):146–155. doi:10.1080/15598608.2012.755484
20. Singh GN, Singh C, Pandey AK, Suman S. An improved exponential method of estimation for current population mean in two-occasion successive sampling. J Stat Appl Prob. 2017;6(3):587–595. doi:10.18576/jsap/060314
21. Singh HP, Pal SK. Improved estimation of current population mean over two occasions. Sri Lankan J Appl Stat. 2015;16(1):1–19. doi:10.4038/sljastats.v16i1.7804
22. Singh GN, Homa F, Maurya S. Exponential method of estimation in two-occasion successive sampling. Int J Stat Econ. 2013;12(3):26–39.
23. Singh HP, Tarray T. An improved randomized response additive model. Sri Lankan J Appl Stat. 2014;15(2):131–138. doi:10.4038/sljastats.v15i2.7412
24. Warner SL. Randomized response: a survey technique for eliminating evasive answer bias. J Am Stat Assoc. 1965;60(309):63–69. doi:10.1080/01621459.1965.10480775
 © 2021 The Author(s). This work is published and licensed by Dove Medical Press Limited. The
full terms of this license are available at https://www.dovepress.com/terms
and incorporate the Creative Commons Attribution
- Non Commercial (unported, 3.0) License.
By accessing the work you hereby accept the Terms. Non-commercial uses of the work are permitted
without any further permission from Dove Medical Press Limited, provided the work is properly
attributed. For permission for commercial use of this work, please see paragraphs 4.2 and 5 of our Terms.
© 2021 The Author(s). This work is published and licensed by Dove Medical Press Limited. The
full terms of this license are available at https://www.dovepress.com/terms
and incorporate the Creative Commons Attribution
- Non Commercial (unported, 3.0) License.
By accessing the work you hereby accept the Terms. Non-commercial uses of the work are permitted
without any further permission from Dove Medical Press Limited, provided the work is properly
attributed. For permission for commercial use of this work, please see paragraphs 4.2 and 5 of our Terms.