Back to Journals » Risk Management and Healthcare Policy » Volume 13
Study on the Risk Factors for Hyperuricaemia and Related Vascular Complications in Patients with Type 2 Diabetes Mellitus
Authors Shi R, Niu Z ![]() , Wu B
, Wu B ![]() , Hu F
, Hu F ![]()
Received 22 March 2020
Accepted for publication 17 August 2020
Published 21 September 2020 Volume 2020:13 Pages 1661—1675
DOI https://doi.org/10.2147/RMHP.S255042
Checked for plagiarism Yes
Review by Single anonymous peer review
Peer reviewer comments 2
Editor who approved publication: Dr Kent Rondeau
Rong Shi, Zheyun Niu, Birong Wu, Fan Hu
School of Public Health, Shanghai University of Traditional Chinese Medicine, Shanghai, People’s Republic of China
Correspondence: Fan Hu Tel/Fax +86 2151322466
Email [email protected]
Purpose: The study aimed to identify diseases that exhibit significant differences between hyperuricaemia (HUA) and non-hyperuricaemia (NHUA) groups and analyse the risk factors for HUA based on the related diseases in type 2 diabetes mellitus (T2DM).
Methods: A total of 3264 T2DM patients were investigated from 2013 to 2017 in the Jinyang and Sanlin communities by obtaining basic data from the electronic medical record system (EMRS). From September 2018 to July 2019, 3000 patients (264 patients were missing during follow-up) were investigated with questionnaires, physical examinations and biochemical index tests. After removing missing values, 2899 patients were divided into HUA and NHUA groups. The chi-square test was used to identify diseases with differences. Using Lasso analysis and logistic regression analysis, risk factors for HUA based on the related diseases were obtained. The C-index, receiver operating characteristic (ROC) curve and calibration plot were used to validate the discrimination and accuracy of the factors.
Results: The chi-square test showed that there were significant differences in coronary heart disease (CHD) and diabetic nephropathy (DN) between the HUA group and the NHUA group. Through Lasso regression, glycosylated haemoglobin A1c (HbA1c), triglyceride (TG), blood urea nitrogen (BUN) and serum creatinine (SCR) were screened in the CHD group. Body mass index (BMI), HbA1c, total cholesterol (TC), TG, BUN, SCR and urine microalbumin (UMA) were screened in the DN group. The P-value of all the variables was less than 0.05. Through the C-index, calibration, and ROC curve analyses, these risk factors had medium accuracy.
Conclusion: HUA was significantly related to CHD and DN. The level of UA was correlated with HbA1c, TG, BUN, and SCR based on CHD. The level of UA was associated with BMI, HbA1c, TC, TG, BUN, SCR, and UMA based on DN.
Keywords: hyperuricaemia, complications, risk factors, type 2 diabetes mellitus
Introduction
In recent years, with the acceleration of life rhythm and changes in eating habits, diabetes mellitus (DM) has gradually become a global health problem. DM is a group of metabolic diseases characterized by hyperglycaemia. It has recently become a major public health problem worldwide. According to the International Diabetes Federation (IDF) report, the age-standardized prevalence rate of diabetes in 2019 is 8.3%, which is expected to reach 9.6% in 2045.1 In China, type 2 diabetes has brought a heavy economic burden to patients and society. Among employed patients, the average annual cost associated with lost productivity was approximately $723.2 If patients with type 2 diabetes mellitus (T2DM) do not take an active role in effectively controlling and treating their disease, they are prone to a variety of diabetes-related complications, such as binocular blindness and renal failure leading to uraemia. In addition, severe type 2 diabetes can also lead to limb disability, affecting the mobility and daily life of patients. In 2019, approximately 4.2 million people (20–79 years old) died of diabetes or its complications, equivalent to 1 person dying of diabetes every 8 seconds.1
Coronary heart disease (CHD) is a cardiovascular complication of diabetes.3 In China, Xiao et al investigated 3469 patients with type 2 diabetes to analyse the prevalence of and risk factors for chronic complications in inpatients with type 2 diabetes in Central China. The results showed that 25.8% of patients had CHD.4 In a systematic evaluation of 4,549,481 patients with type 2 diabetes, the total incidence of macrovascular complications was 32.2%, and CHD was the most common cardiovascular disease (21.2%).5
Diabetic nephropathy (DN) is a type of progressive renal failure characterized by persistent proteinuria and hypertension.3,6 It is one of the most common complications of diabetes and the main pathogenesis of end-stage renal disease (ESRD) in developed countries.7 It is predicted that ESRD caused by DN in European countries will increase by 3.2% every year from 2012 to 2025.8 In China, the incidence rate of DN in type 2 diabetes is 20% to 40%.6 In Malaysia, the prevalence of early DN in outpatients was 25.4%.9 The Diss project found that 25% of T2DM patients developed DN during 17 years of follow-up in Sweden.10 In addition, DN increases the death risk among T2DM patients. According to the third National Health and Nutrition Examination Survey in the United States, the standard case fatality rate of diabetic patients without nephropathy is 11.5%, and that of diabetic patients with nephropathy is 31.1%.11
Diabetic retinopathy (DR) is a kind of microvascular damage that threatens vision and seriously affects the life of diabetic patients. The global incidence rate of DR is close to 30%.12 In 2010, the number of DR patients in the world was 126.6 million, which is expected to increase by approximately 50.87% in 20 years.13
Stroke, one of the major vascular complications related to diabetes mellitus, results in extracranial carotid artery disease and intracranial large and small vascular disease, including asymptomatic carotid occlusion or cerebrovascular disease, transient ischaemic attack, haemorrhage and ischaemic stroke and other clinical characteristics.14 Almost all types of stroke are affected by diabetes, including major artery stroke, lacunar stroke, cerebral haemorrhage and embolic stroke.15 A considerable number of prospective studies have shown that diabetic patients are at a higher risk of stroke in the Western population than non-diabetic people.16,17 A study of 2532 first-time stroke inpatients in Chinese hospitals showed that the incidence of stroke in diabetic patients was significantly higher than that in non-diabetic patients.18 The risk of stroke in diabetic patients was 2.5- to 3.6-fold higher than that in nondiabetic patients.19
Uric acid (UA) is a product of purine metabolism and is generally considered a predictor of gout quality.20 Hyperuricaemia (HUA) refers to a condition in which the concentration of UA in human serum is higher than the upper limit of normal reference under the condition of a normal purine diet: higher than 420 mmol/L in men and 360 mmol/L in women. With changes in population, dietary habits, lifestyle and drug use, the incidence rate of HUA has been increasing worldwide. The prevalence of HUA was higher in T2DM patients. In the study of Ogbera et al, the prevalence of HUA in patients with type 2 diabetes in Nigeria was 25%.21 In China, the incidence rate of HUA has increased by 9% in the 20 years since the early 80s.22 In a cross-sectional study in Tianjin, the incidence rate of hyperuricaemia was 12.6% in male T2DM patients and 19.5% in female patients.23 In the past 50 years, many studies have reported the relationship between HUA and a variety of cardiovascular diseases, including stroke, hypertension, heart failure, CHD, and metabolic syndrome.24 Studies have shown that HUA is also a risk factor for proteinuria and may play a role in the pathogenesis of diabetic microvascular diseases.25 In T2DM patients with preserved renal function, hyperuricaemia is an independent risk factor for chronic kidney disease (CKD).26 Therefore, it is necessary to control and prevent the occurrence of HUA at an early stage for patients with T2DM.
The purpose of this study was to identify diseases that exhibit significant differences between the HUA and non-hyperuricaemia (NHUA) groups. Through the data analysis and verification, the risk factors for HUA based on the diseases that show significant differences between HUA and NHUA groups were identified, which helps improve clinical control of HUA among T2DM patients.
Patients and Methods
Acquisition of Indicators
Community Health Center Hospitals in Shanghai have established an electronic medical record system (EMRS) covering all community residents. With the authorization of the Community Health Center Hospital of Jingyang and Sanlin, our team reviewed the EMRS of 3264 patients with T2DM who were diagnosed from 2013 to 2017. From September 2018 to July 2019, we cooperated with the affiliated community health center hospitals of Shanghai University of Traditional Chinese Medicine to investigate above these patients, among them, 264 patients were missing during follow-up (Figure 1). The investigation combines a questionnaire survey, physical examination and biochemical index test. The content of the questionnaire mainly included age, sex, course of the disease, medical history and other basic information. Patients’ systolic blood pressure (SBP) and diastolic blood pressure (DBP) were measured twice within 5 minutes, took the average value of the two results and recorded it as the final SBP value and DBP value. The height and weight of patients were measured by standard electronic equipment and recorded. According to the regulations of World Health Organization (WHO), body mass index (BMI) was calculated as weight (kg) divided by height squared (m2). Before the biochemical index test, all participants were required to fast for at least 10 hours to measure fasting blood glucose (FBG), glycosylated haemoglobin A1c (HbA1c), total cholesterol (TC), total triglyceride (TG), high-density lipoprotein (HDL-C), low-density lipoprotein (LDL-C), blood urea nitrogen (BUN), UA and serum creatinine (SCR). After providing blood samples, participants were asked to empty their bladders and collect urine for detection of urine creatinine (UCR) and urine microalbumin (UMA) content. All blood samples were centrifuged in situ within 30 minutes after collection. All samples were sent to Ruijin Hospital Affiliated with Shanghai Jiaotong University for inspection on the same day of collection. Urine biochemical indexes were analysed by urine test 500B (RIT, China). Before the study, informed consent was obtained from all participants, and informed consent was signed.
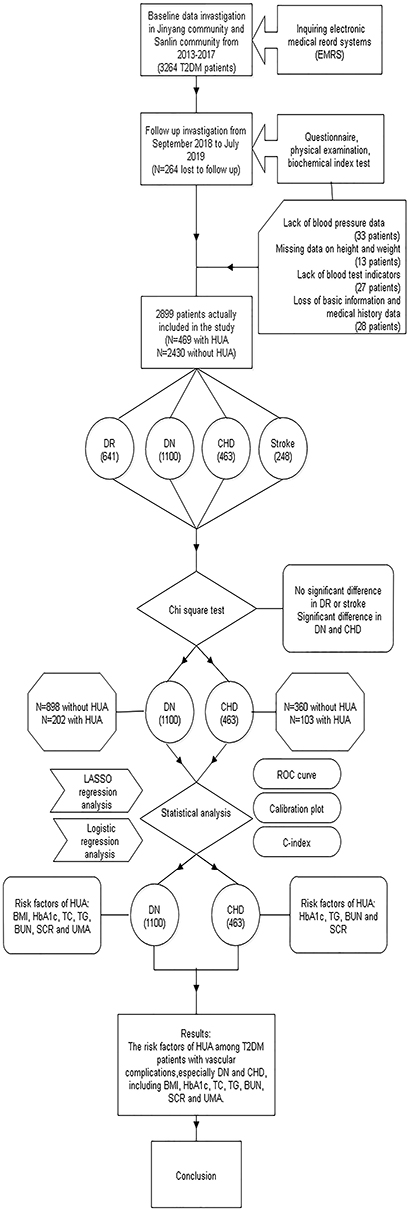 |
Figure 1 The flow chart shows the whole process of data collection, processing and analysis in this study. |
Diagnostic Criteria of Patients
The inclusion criteria for hyperuricaemia were a UA level ≥ 420 μmol/L for men and a UA level ≥ 360 μmol/L for women.27 According to the 2017 Chinese guidelines for type 2 diabetes, T2DM patients with SBP ≥ 130 mmHg and/or DBP ≥ 80 mmHg are patients with hypertension (HTN). In this study, information on CHD, DN, stroke and DR was obtained through EMRS. After the clinicians diagnose the patients, they upload the diagnostic information to the electronic medical record system. Patients diagnosed with DR in Sanlin and Jinyang communities were examined with a non-aqueous fundus camera (cr-2af, Canon, Tokyo, Japan) at a specialist outpatient clinic. According to the classification and definition of severity of early treatment diabetic retinopathy (ETDRS), if any characteristic lesion, including micromaterial aneurysm, hard exudate, flocculent spots, haemorrhage, new retinal vessels, proliferative vitreoretinopathy (PVR), photocoagulation scar, and retinal detachment vitreoretinopathy, is found, the patient will be diagnosed with DR.28,29 The minimum standard for the diagnosis of DR is to have at least one confirmed microadenoma in any imaging area.28 The patients who were diagnosed with DN received the urinary microalbumin-to-creatinine ratio (ACR) test at the specialist clinic. The diagnosis of DN was divided into three stages according to ACR. ACR less than 30 mg/g was defined as nonalbuminuria (NAU), 30 mg/g < ACR < 300 mg/g was defined as microalbuminuria (MAU), and ACR greater than or equal to300 mg/g was defined as clinical albuminuria (CAU).30 Both MAU and CAU indicated DN in this study. The patients who were diagnosed with CHD underwent electrocardiographic (ECG) examination and angiography at the specialist clinic. Patients with abnormal ECG, angina pectoris, myocardial infarction or myocardial ischaemia were diagnosed with CHD. All patients diagnosed with stroke underwent computed tomography (CT) and magnetic resonance imaging (MRI) at the specialist clinic, and those with cerebral haemorrhage, cerebral embolism or subarachnoid haemorrhage were diagnosed with stroke.
Statistical Analysis
Before data analysis, we first reviewed the data and checked the missing items. The team obtained 3264 patients as baseline data through the medical record system. In cases of a lack of relevant biochemical index test and physical examination data or the absence of a follow-up visit, the corresponding patients were not included in the final data set of this study. Additionally, if any measurement was an outlier, the individual was excluded from the study. Ultimately, 264 patients were lost to visits, and the rate of lost visits was 8%. A total of 101 patients were excluded from the study due to a partial lack of data, and 2899 patients were included in the subsequent statistical analysis. A total of 2899 patients were divided into the HUA and NHUA groups according to whether they had HUA.
All data analysis for this study was conducted using R software (version 3.6.3; https://www.R-project.org). First, the author used descriptive statistics, t-test and chi-square test to describe the differences in indicators between the HUA group and the NHUA group. In the normality test, some indexes showed a non-normal distribution, and their descriptive characteristics are the median and inter-quartile range. Then, a chi-square test was performed for four complications (CHD, stroke, DN and DR found from the baseline EMRS) in the HUA and NHUA groups to identify the different complications between the groups. The patients diagnosed with those complications with significant differences were screened out from the total samples, and the risk factors were screened by lead absolute shrinkage and selection operator (Lasso) regression. Type metrics are used to specify the target covariates that are minimized when the selected model is cross-validated. The results of the regression analysis were reported as lambda.1se. Lasso regression analysis is a method to simplify high-dimensional data and is used to analyse the best predictive risk factors for disease.31 After obtaining the non-zero coefficient characteristics in the Lasso regression model, logistic regression was used for further analysis, and the characteristics were evaluated by calculating the odds ratio (OR) of the 95% confidence interval (CI), and the corresponding P-value was obtained. Then, the team selected the risk factor indicators with P-values less than 0.05 and tested them with C-index, receiver operating characteristic (ROC) curve and calibration plot, respectively, finally confirming the relationship between HUA and complications in T2DM population-related risk factors.
Results
After handling the missing and abnormal values, a total of 2899 patients with T2DM were finally obtained. There were 469 T2DM patients with HUA, 213 males and 256 females. The average age of the patients was 66.00 (60.00, 70.00) years old. There were 2430 type 2 diabetic patients with normal uric acid levels, 1202 males and 1228 females. The average age of the patients was 65.0 (60.00, 68.00) years old. The prevalence of hyperuricaemia in this study was 16.18%. According to strict diagnostic criteria, there were 103 patients with CHD (21.96%), 41 patients with stroke (8.74%), 95 patients with DR (20.26%) and 202 patients with DN (43.07%) in the HUA group. There were 360 patients with CHD (14.81%), 207 patients with stroke (8.52%), 546 patients with DR (22.47%) and 898 patients with DN (36.95%) in the NHUA group. The specific demographic indicators and clinical characteristics of the HUA and NHUA groups are given in Table 1. The prevalence of CHD and DN in the HUA group was higher than that in the NHUA group. The chi-square test revealed that there were significant differences in CHD and DN between the HUA group and NHUA group, but no significant differences were found in stroke or DR, the specific values are shown in Table 2.
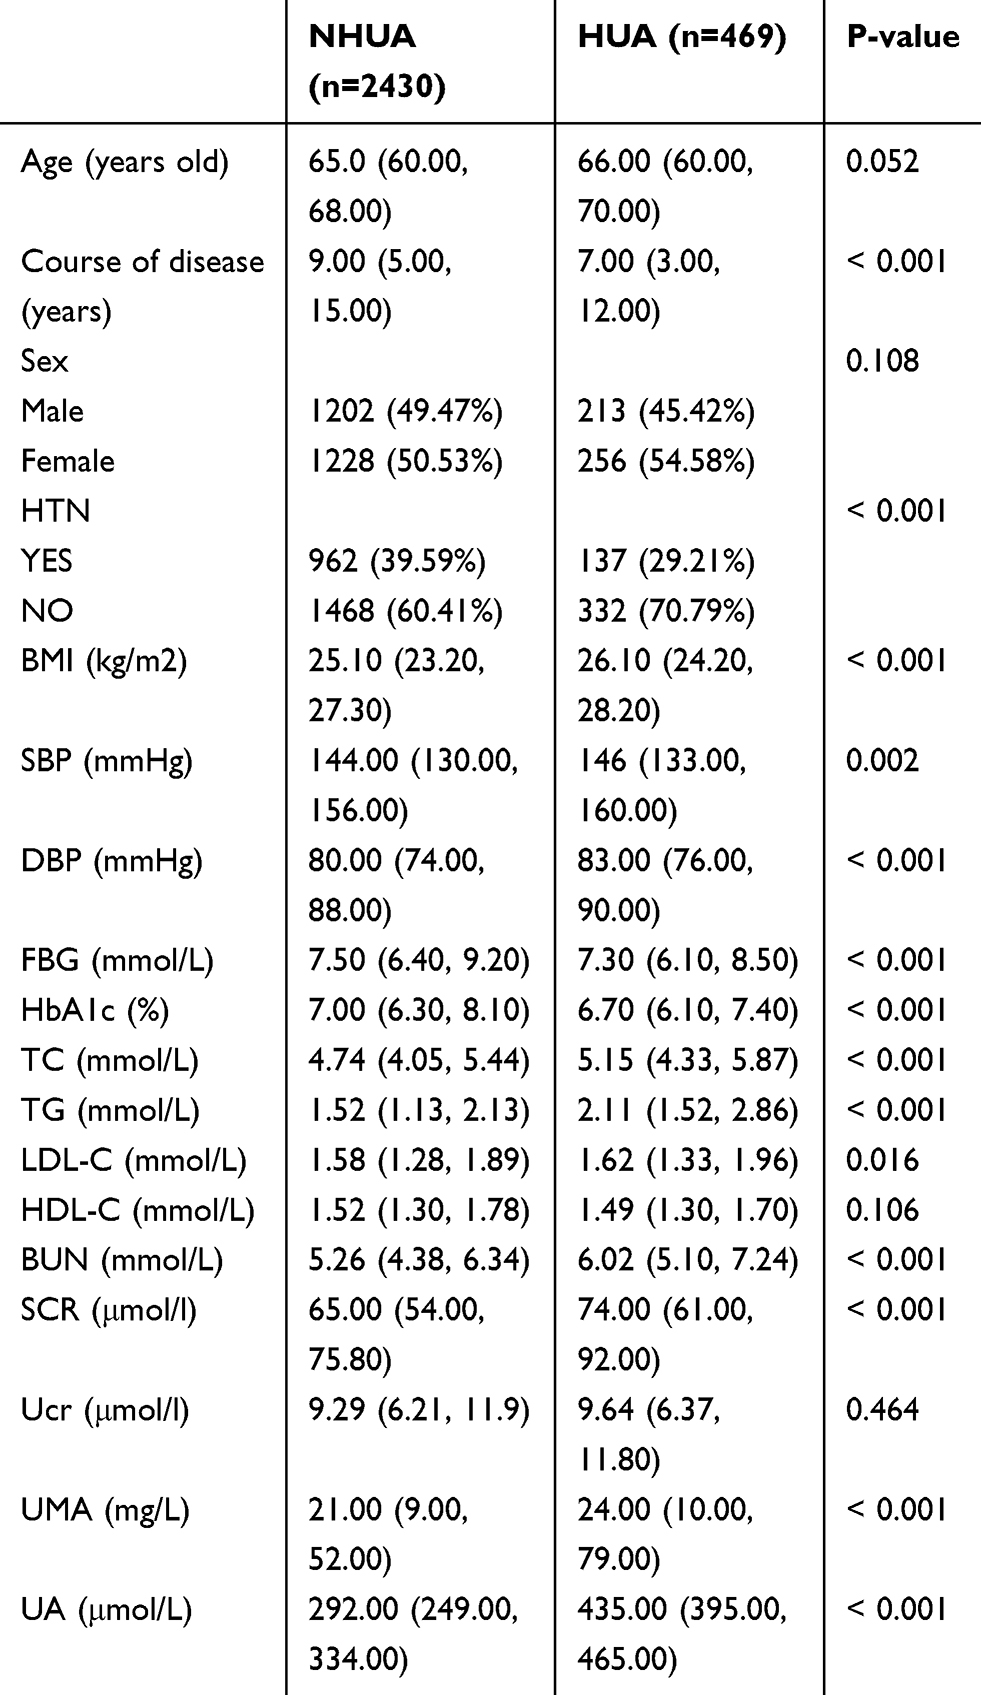 |
Table 1 Demographic and Clinical Characteristics of the Participants in the HUA and NHUA Groups |
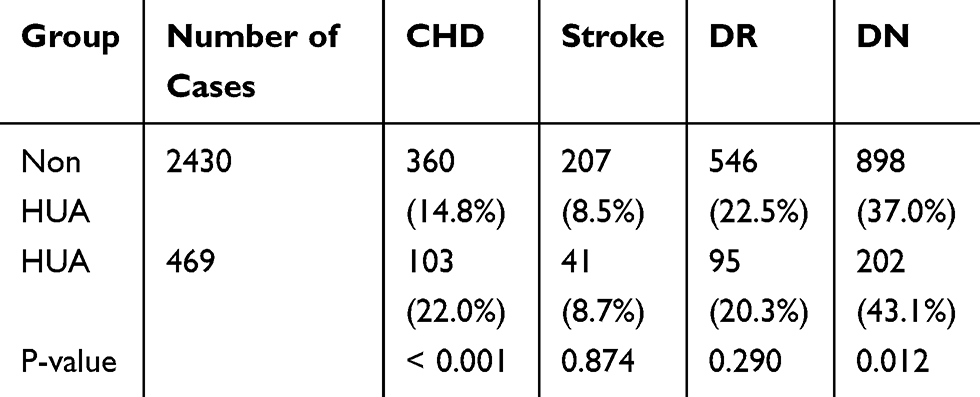 |
Table 2 Comparison of the Morbidity of Four Complications (CHD, Stroke, DR and DN) Between the Two Groups |
The data in CHD and DN were screened out from the total samples and analyzed by Lasso regression analysis. Four factors, including HbA1c, TG, BUN and SCR, were screened in the CHD group (Figure 2A and B). Seven factors, including BMI, HbA1c, TC, TG, BUN, SCR and UMA, were screened out in the DN group (Figure 3A and B). Table 3 shows the specific coefficients corresponding to the variables of different measurement data sets and lambda.1se. Based on two different complications, the selected risk factors from the Lasso regression analysis were included in the logistic regression analysis (Figure 4A and B). The P-value of all characteristic variables was less than 0.05 (Tables 4 and 5).
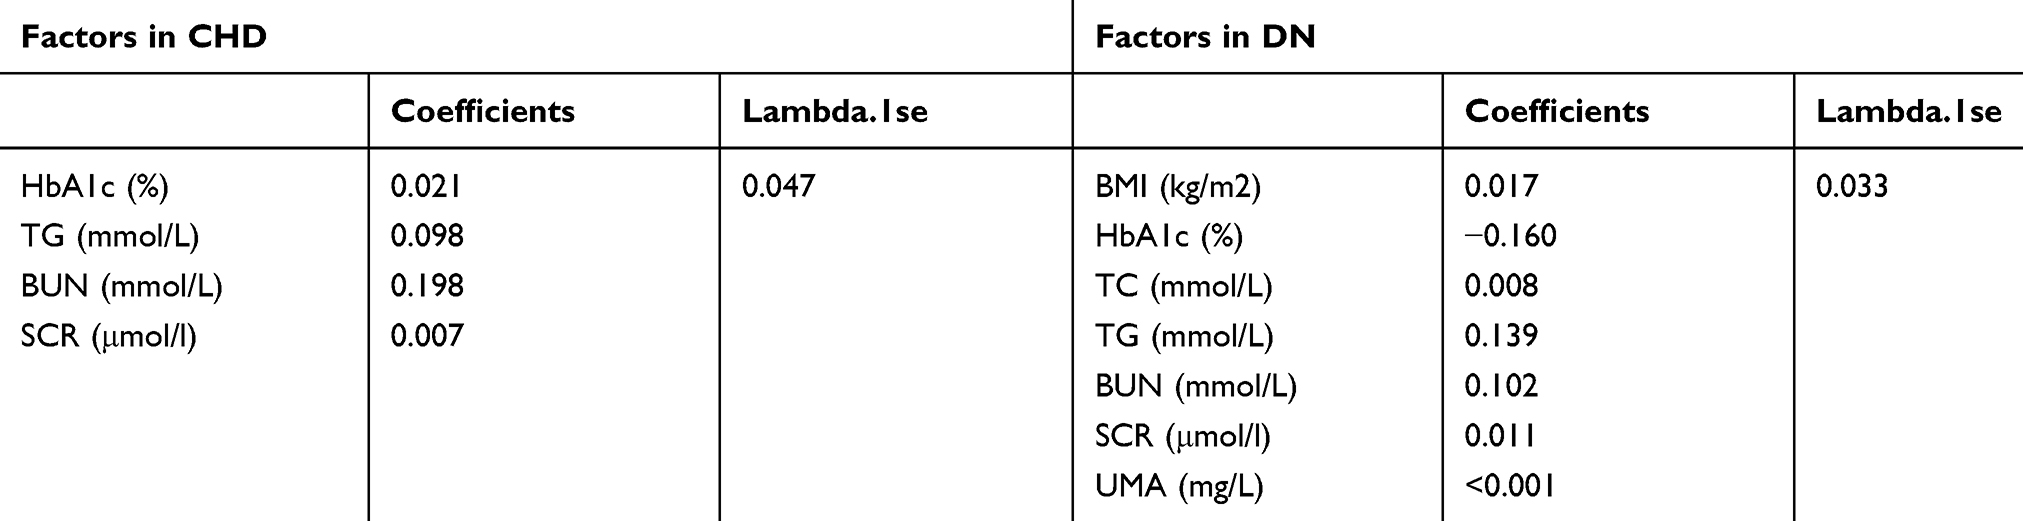 |
Table 3 Coefficients and Lambda.1se Values of LASSO in CHD and DN |
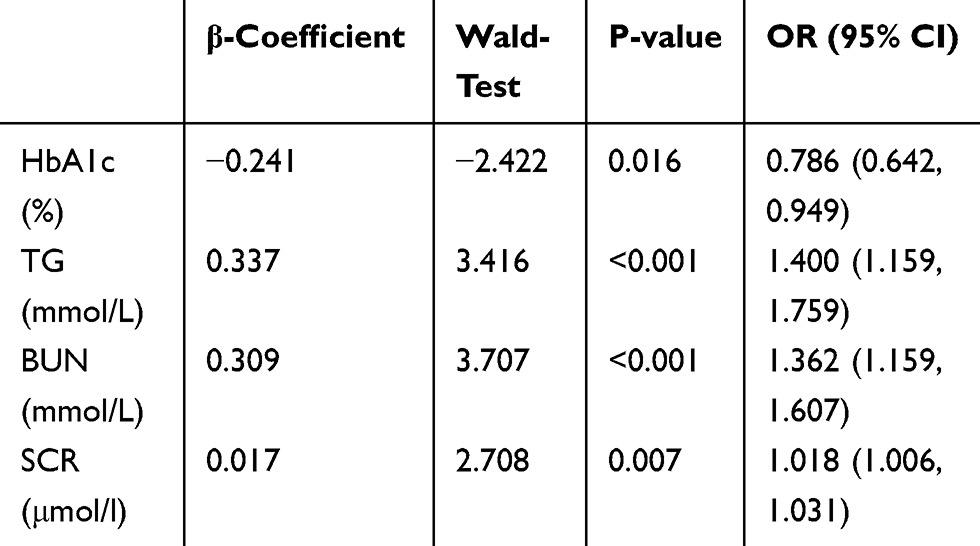 |
Table 4 Logistic Regression Analysis Based on CHD |
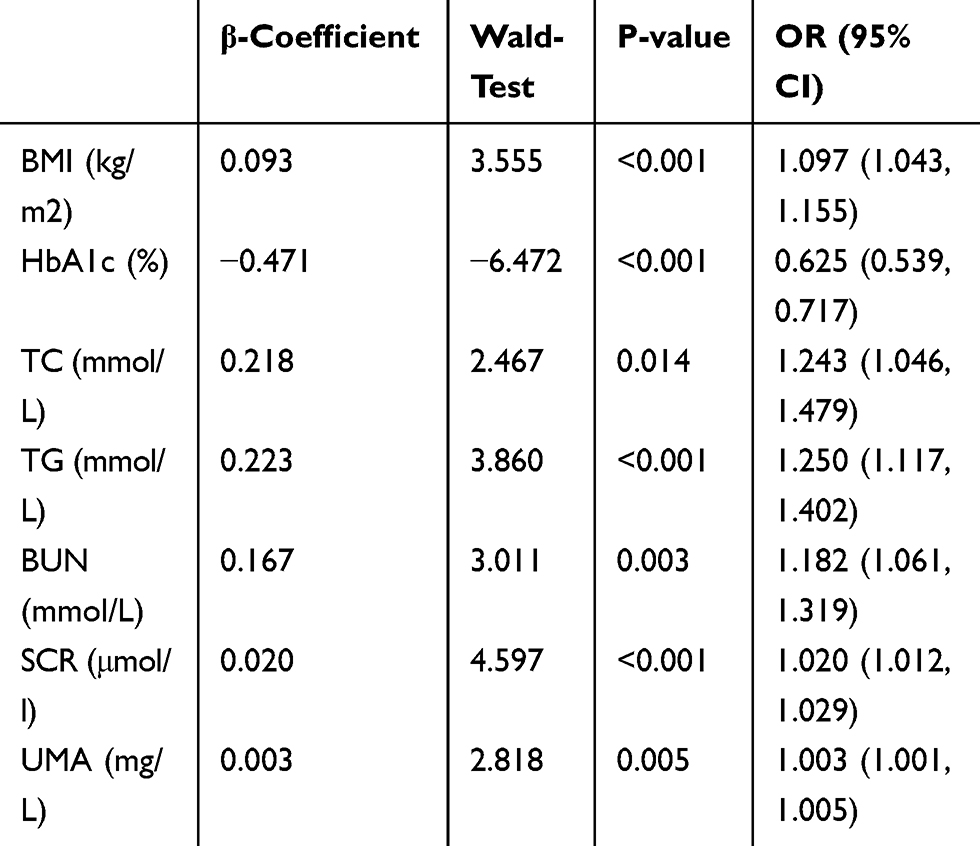 |
Table 5 Logistic Regression Analysis Based on DN |
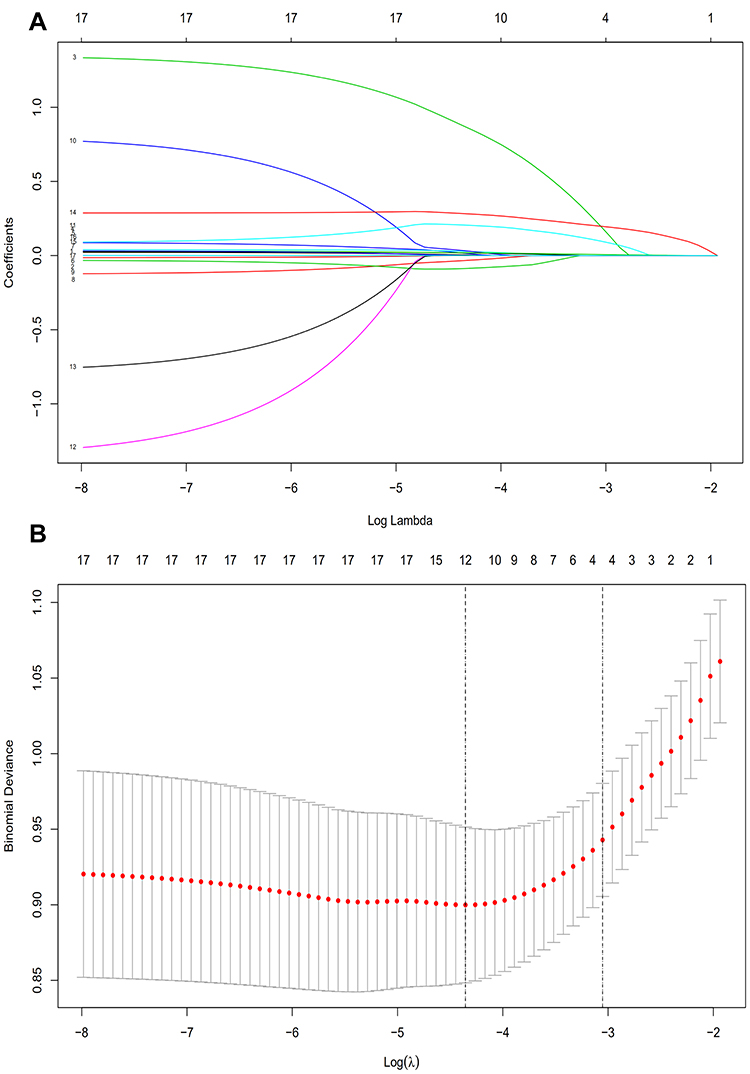 |
Figure 2 Demographic and clinical feature selection using the LASSO binary logistic regression model in T2DM patients with CHD. (A) Optimal parameter (lambda) selection in the LASSO model used fivefold cross-validation based on minimum criteria. The partial likelihood deviance (binomial deviance) curve was plotted versus log(lambda). Dotted vertical lines were drawn at the optimal values by using the minimum criteria and the 1 SE of the minimum criteria (the 1-SE criteria). LASSO coefficient profiles of the 4 features. (B) A coefficient profile plot was produced against the log(lambda) sequence. A vertical line was drawn at the value selected using fivefold cross-validation, where optimal lambda resulted in 4features with nonzero coefficients. |
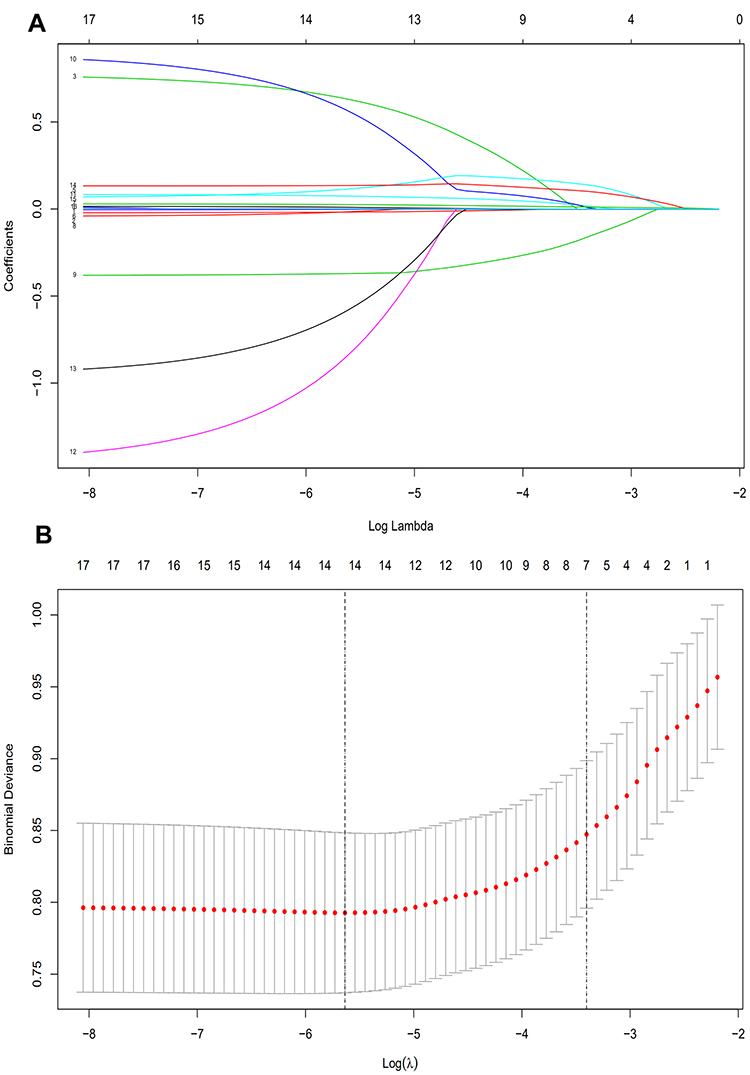 |
Figure 3 Demographic and clinical feature selection using the LASSO binary logistic regression model in T2DM patients with DN. (A) Optimal parameter (lambda) selection in the LASSO model used fivefold cross-validation based on minimum criteria. The partial likelihood deviance (binomial deviance) curve was plotted versus log(lambda). Dotted vertical lines were drawn at the optimal values by using the minimum criteria and the 1 SE of the minimum criteria (the 1-SE criteria). LASSO coefficient profiles of the 7 features. (B) A coefficient profile plot was produced against the log(lambda) sequence. A vertical line was drawn at the value selected using fivefold cross-validation, where optimal lambda resulted in 7 features with nonzero coefficients. |
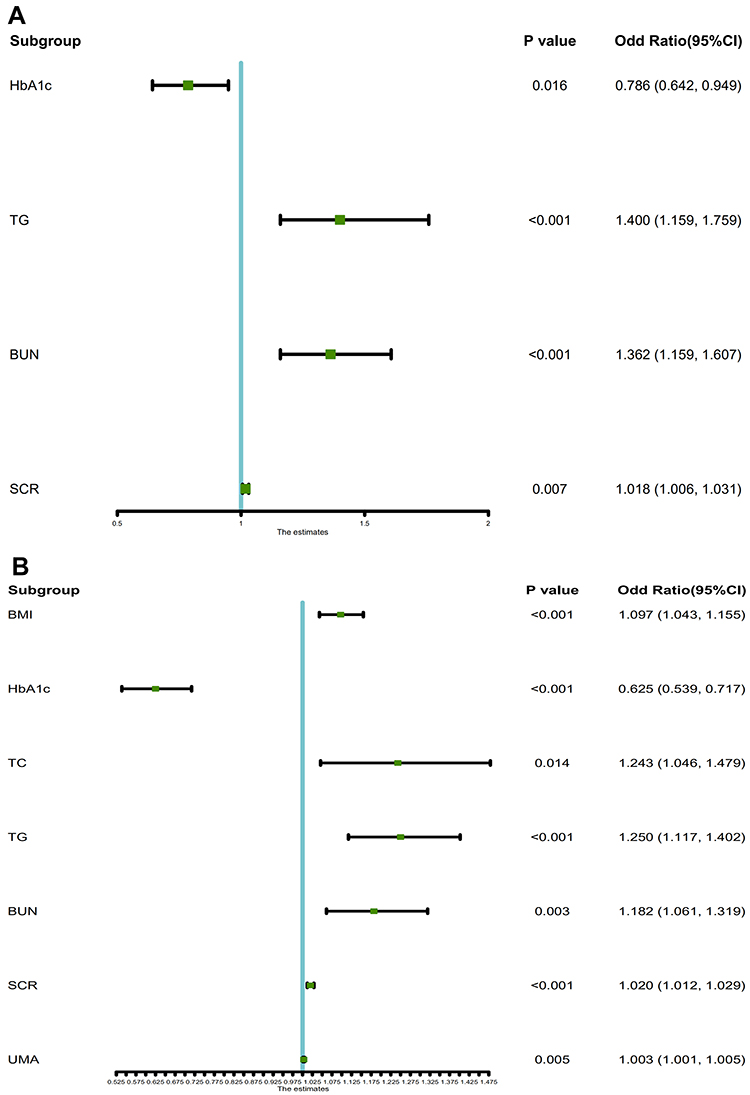 |
Figure 4 Forest plot of the OR of the selected feature. Use of forest plot for outcome of logistic regression analysis. In the plane rectangular coordinate system, the forest plot takes a vertical invalid line (scale of abscissa is 1) as the center, describes the effect quantity and confidence interval of each study by using multiple line segments parallel to the horizontal axis, and describes the effect quantity and confidence interval of multiple studies by using a rectangle. (A) T2DM patients with CHD: The horizontal lines corresponding to 95% CI of HbA1c, TG, BUN and SCR do not intersect the centerline. 95% CI of HbA1c falls to the left of the centerline, indicating HbA1c was the protective factor of HUA in T2DM patients with CHD. Other factors were the risk factors of HUA. (B) T2DM patients with DN: The horizontal lines corresponding to 95% CI of BMI, HbA1c, TC, TG, BUN, SCR and UMA do not intersect the centerline. 95% CI of HbA1c falls to the left of the centerline, indicating HbA1c was the protective factor of HUA in T2DM patients with DN. Other factors were the risk factors of HUA. |
The C-index of the characteristic factor in the CHD group was 0.777 (0.726, 0.828), and the C-index of the characteristic factor in the DN group was 0.796 (0.763, 0.829), as shown in Table 6, which indicated that these factors had moderate prediction accuracy. The ROC curve of the characteristic factors in the CHD group was 0.183 (0.642, 0.816) (Figure 5A), and the AUC was 0.777. The ROC curve of the feature factors in the DN group was 0.184 (0.732, 0.738), and the AUC was 0.796 (Figure 5B). Through the calibration test, S:P values produced for CHD and DN were 0.969 (Figure 6A) and 0.881 (Figure 6B), respectively.
 |
Table 6 C-Index in the Array |
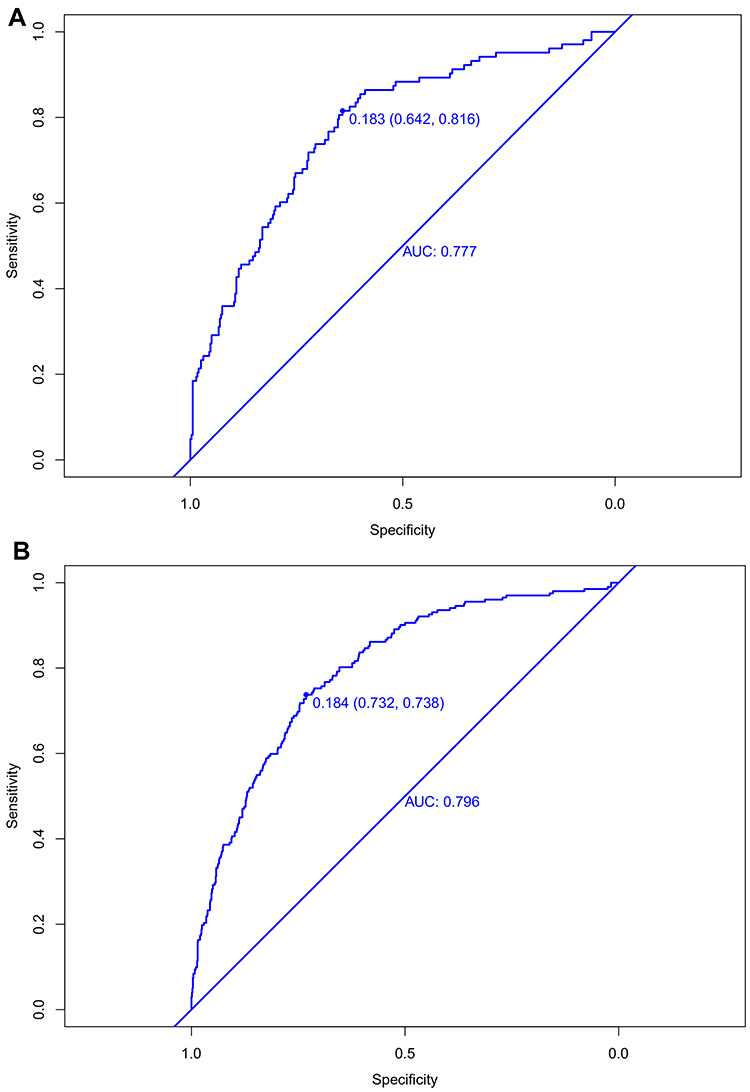 |
Figure 5 The pooled AUC of the ROC curve. (A) T2DM patients with CHD & (B) T2DM patients with DN: The y-axis indicates the true positive rate of the risk prediction. The x-axis indicates the false positive rate of the risk prediction. The blue line represents the performance of the nomogram. |
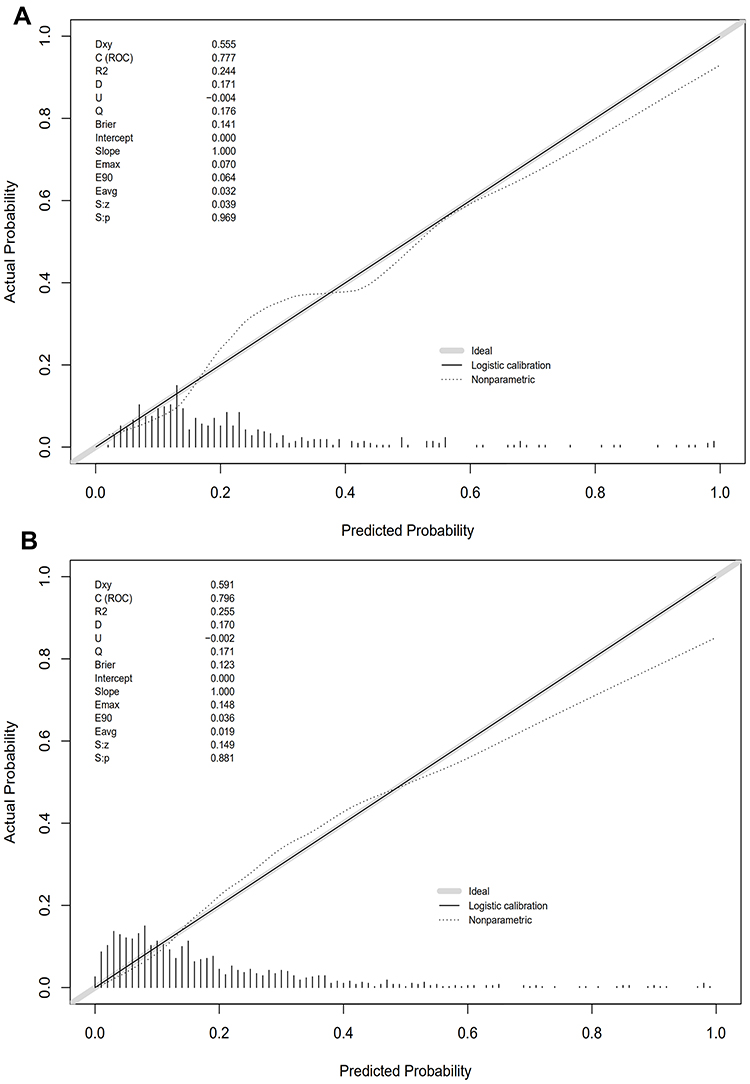 |
Figure 6 Calibration curves of the HUA incidence risk prediction in the array. (A) T2DM patients with CHD & (B) T2DM patients with DN: The x-axis represents the predicted incidence risk. The y-axis represents the actual diagnosedHUA. The diagonal dotted line represents a perfect prediction by an ideal model. The solid line represents the performance of the nomogram; a closer fit to the diagonal dotted line represents a better prediction. |
Discussion
The results of our study showed that CHD and DN were complications with significant differences between the HUA group and the NHUA group. The risk factors for HUA among T2DM patients with CHD were HbA1c, TG, BUN and SCR. The risk factors for HUA among T2DM patients with DN were BMI, HbA1c, TC, TG, BUN, SCR and UMA. In T2DM patients with any one of the complications of CHD and DN, the independent risk factors for HUA included HbA1c, TG, BUN and SCR.
Risk Factors for HUA Based on CHD and DN
Body Mass Index (BMI)
In this study, BMI was a risk factor for HUA among T2DM patients with DN, that is, the risk of HUA was higher when BMI increased. This conclusion was consistent with many other studies. A cross-sectional study of cardiovascular metabolic risk factors in HUA diabetic patients showed that serum uric acid levels were closely related to BMI and were in direct proportion.32,33 In a study by Cuiling Zhu et al, high serum levels were found to be related to severe metabolic abnormalities, including increased BMI.34 The relationship between UA and BMI mainly showed that the higher the BMI of diabetic patients was, the higher the production of leptin and the more serious the insulin resistance (IR), which would reduce the excretion rate of uric acid, to increase the level of UA.35 Additionally, we found that BMI was also an influential factor of DN through the literature review. In our study, BMI, one of the risk factors for HUA, was selected from patients with DN. A multivariate model analysis showed that morbid obesity might be an influential risk factor for CKD in females.36
Glycosylated Haemoglobin A1c (HbA1c)
HbA1c has been recommended by the American Diabetes Association as a detection method for the diagnosis of T2DM or the identification of high-risk groups in T2DM.37 The results of this study showed that the risk of HUA was negatively correlated with haemoglobin in T2DM patients. The same finding was found in a study on the role of dynamic binding of UA and HbA1c in the pathogenesis of T2DM. They found that UA levels were negatively correlated with HbA1c in diabetic patients and positively correlated with HbA1c in normal subjects.37 Although our study population was all T2DM patients and there was no study on the normal population, the result of our study had been verified in other related studies. In another study on UA level, a negative correlation between UA level and HbA1c in T2DM patients was also obtained.37 HbA1c is a key parameter in diabetes control because it is associated with the risk of diabetic complications.38 A study in Taiwan found that HbA1c was an indicator of UMA in T2DM patients,39 and UMA was an important basis for DN diagnosis. Garg et al used the SYNTAX score to assess the severity of CHD, and it was concluded that there was a significant increase in HbA1c levels in patients with increased severity of CHD.40
Triglycerides and Total Cholesterol (TG and TC)
TG and TC were both independent risk factors for HUA in this study. A retrospective study of urban residents using the Cox expression model to analyse the relationship between TG and HUA reached the same conclusion. The risk of HUA increases with increasing TG levels.41 The mechanism of elevated TG levels and HUA has not been elucidated. Some scholars have proposed that the increase in TG might lead to the production of a large number of free fatty acids in the body, and free fatty acids would accelerate the decomposition of adenosine triphosphate, increasing UA levels.42 Some studies have shown that the synthesis of fatty acids in the liver is related to the synthesis of de novo purine and accelerates the production of urea.43 For a long time, although some studies had confirmed that the pathogenesis of HUA was related to dyslipidaemia, there were many controversies about the specific relationship between HUA and lipidaemia. A cross-sectional study of 3093 subjects aged 18–85 years in Sichuan Province, China, showed that high TG and high TC were positively correlated with HUA in men but not in women.44 In Suzhou, China, 9580 subjects over 45 years old were studied in a cross-sectional community study. In men, the increase in TG and TC was significantly related to HUA, but in women, only high TG was significantly related to HUA, while TC was not related to HUA.45 TG and TC were both independent risk factors for DN.46,47 A network Mendelian randomization study showed a positive correlation between TG and CHD.48
Serum Creatinine (SCR)
The data analysis results of this study showed that SCR was an independent risk factor for HUA in T2DM patients, and the risk of HUA increased with increasing SCR levels. The risk factors for HUA in 129 patients with T2DM (25.2% of them were HUA) were analyzed, and the results of univariate analysis showed that serum creatinine ≤ 110 mol/L, BUN ≤ 7.0 mmol/l, microalbuminuria: 11.2 mg/l, and TG: 1.70 mmol/l, which were the risk factors for T2DM patients with HUA. According to the same data and binary logistic regression analysis, serum creatinine, BMI and TC were independent risk factors for T2DM patients with HUA.49 In addition, in a meta-study of 38,855 people, SCR was identified as a risk factor for HUA by multivariate logistic regression analysis.50 At the same time, SCR as a risk factor for HUA could be screened out in the DN population and CHD population in this study. At present, SCR and eGFR are often used to evaluate renal function in the clinic.51 Kidney disease is common in the CHD population, but people’s awareness of prevention is insufficient.52 Petrovic et al estimated the prevalence of CKD in CHD patients based on the calculation of eGFR by SCR.53
Blood Urea Nitrogen (BUN)
The results of this study showed that BUN was an independent risk factor for HUA in T2DM patients and was related to DN and CHD. A cross-sectional study on the risk factors for HUA based on sex differences found that BUN was an independent risk factor for HUA in both male and female groups.54 In another study, univariate analysis and multivariate analysis were used successively, and the results showed that BUN was an independent risk factor for the occurrence of HUA.55 BUN was filtered out of the body from the glomerulus. When renal insufficiency was decompensated, BUN increased. Therefore, it has been used as an indicator of glomerular filtration function. The results of the study on the potential risk factors for sudden cardiac death showed that there was a significant correlation between CHD and BUN.56 This was consistent with the results of our study.
Urinary Microalbuminuria (UMA)
UMA is a good marker of renal damage and the clinical manifestation of early DN in diabetic patients. In this study, we found that UMA was a risk factor for HUA in T2DM patients, especially those in the DN population. A prospective cohort study in Taiwan examined whether HUA was an independent risk factor for UMA in a middle-aged and elderly population. The results showed that the UA level was an independent predictor of UMA for the middle-aged and elderly population living in the community.57 A study in a Korean population showed that UA levels were closely related to UMA in people with prehypertension symptoms.58 These studies were different from our study’s purpose. These studies explored the relationship between UA level and UMA, but our study found that UMA was a risk factor for HUA. In summary, it could be concluded that there was a certain correlation between the two factors, such as UA, UMA, and HUA.
DR and Stroke Based on HUA
The incidence of CHD, carotid atherosclerosis, cerebral infarction, DN and DR in patients with HUA was significantly higher than that in patients with normal UA.49 Through the above analysis, we know that BMI, HbA1c, TC, TG, BUN and UMA were independent risk factors for HUA, and a substantial amount of literature has shown that these factors are also related to DR. A cross-sectional study of 518 diabetic patients revealed a negative correlation between DR and BMI in adult diabetic patients.59 In a cross-sectional study based on multiple hospitals, higher BUN was used as the characteristic variable of DR.60 The results of this study showed that there was no significant difference in the incidence of stroke and DR in the HUA group and normal UA group. Considering the small number of cases in this study, the correlation between HUA, stroke and DR needs further study. At present, the relationship between the level of UA and stroke is not clear. There were two opposing views about UA and stroke. One suggested that UA was an important risk factor for stroke. The study of Lehto and Seghieri found that HUA was an important variable for predicting the occurrence of stroke in T2DM patients.61,62 Another view was that the increase in UA was a protective factor against cerebral infarction.63
Limitation
Objectively, this study was somewhat limited. First, the data we collected mainly focused on T2DM patients in Shanghai communities, which could not represent all T2DM patients in China. Second, patients were required to participate in the data collection process on-site, but patients with severe T2DM who were treated in the hospital or at home could not participate in this study. Moreover, this study did not dynamically detect the indicators of the patients. It is more convincing to use dynamic data to study the risk factors for some vascular complications in T2DM patients with HUA. Finally, there was no significant difference in DR and stroke between HUA group and NHUA group in this study, which might be due to the limitation of the number of patients, biological indicators and other demographic characteristics. This point is also one of the problems to be solved by the author in the next step. At the same time, there are many vascular complications in T2DM. In the further study, the authors will try to include more patients with T2DM complications related to UA, and more biological and demographic indicators, so as to eliminate the limitations of these factors and solve the problem of deviation of study results.
Conclusions
In general, significant differences were found in CHD and DN between the HUA group and the NHUA group. The level of UA was correlated with HbA1c, TG, BUN and SCR based on CHD, while the level of UA was associated with BMI, HbA1c, TC, TG, BUN, SCR and UMA based on DN. Through the C-index, calibration plot and ROC curve, these factors showed moderately good accuracy. To reduce the level of UA, a healthy lifestyle is a requirement and includes a healthy diet, restrictions on alcohol, enough exercise and weight control. According to research by others, long sleep periods could also play a protective role against HUA.64
Abbreviations
DM, diabetes mellitus; IDF, International Diabetes Federation; T2DM, type 2 diabetes mellitus; CHD, coronary heart disease; DN, diabetic nephropathy; ESRD, end-stage renal disease; DR, diabetic retinopathy; UA, uric acid; HUA, hyperuricaemia; CKD, chronic kidney disease; NHUA, non-hyperuricaemia; EMRS, electronic medical record systems; SBP, systolic blood pressure; DBP, diastolic blood pressure; WHO, World Health Organization; BMI, body mass index; FBG, fasting blood glucose; HbA1c, glycosylated haemoglobin A1c; TC, total cholesterol; TG, triglyceride; HDL-C, high-density lipoprotein; LDL-C, low-density lipoprotein; BUN, blood urea nitrogen; SCR, serum creatinine; UCR, uric creatinine; UMA, urine microalbumin; HTN, hypertension; ETDRS, severity classification definition of early treatment diabetic retinopathy; PVR, proliferative vitreoretinopathy; ACR, urinary microalbumin-to-creatinine ratio; NAU, nonalbuminuria; MAU¸ microalbuminuria; CAU, clinical albuminuria; ECG, electrocardiogram; CT, computed tomography; MRI, magnetic resonance imaging; Lasso, lead absolute shrinkage and selection operator; OR, odds ratio; CI, confidence interval; ROC, receiver operating characteristic; IR, insulin resistance.
Ethics Statement
All participants were carefully informed about the protocol and provided written informed consent before inclusion in the study. The study was approved by the Shanghai Medical Ethics Committee and performed in accordance with the principles of the Declaration of Helsinki.
Acknowledgments
The authors thank all the participating community health centres that helped recruit the participants, including Jinyang Community and Sanlin Community, and all participants who volunteered to be studied.
Disclosure
The authors declare no conflicts of interest in this work.
References
1. IDF. Available from: http://www.idf.org/.
2. Huang YY, Fan WJ, Zhu JJ, Zhan L, Chen W. DB1 epidemiology, treatment and economic burden of type 2 diabetes mellitus with nephropathy complications in China. Value Health. 2012;15(7):A603–A603. doi:10.1016/j.jval.2012.08.013
3. Dal Canto E, Ceriello A, Ryden L, et al. Diabetes as a cardiovascular risk factor: an overview of global trends of macro and micro vascular complications. Eur J Prev Cardiol. 2019;26(2_SUPPL):25–32. doi:10.1177/2047487319878371
4. Xiao H, Du AM, Yun P, Zhang HF, Tian Y, Xiao FX. Prevalence and risk factors of chronic complications of type 2 diabetic inpatients in Hubei Province of central China: results from a multiple-hospital study. Int J Diabetes Dev Ctries. 2016;36(2):242–247. doi:10.1007/s13410-015-0452-7
5. Einarson TR, Acs A, Ludwig C, Panton UH. Prevalence of cardiovascular disease in type 2 diabetes: a systematic literature review of scientific evidence from across the world in 2007–2017. Cardiovasc Diabetol. 2018;17:19. doi:10.1186/s12933-018-0728-6
6. Aldemir O, Turgut F, Gokce C. The association between methylation levels of targeted genes and albuminuria in patients with early diabetic kidney disease. Ren Fail. 2017;39(1):597–601. doi:10.1080/0886022X.2017.1358180
7. Kute VB, Godara SM, Shah PR, et al. Outcome of deceased donor renal transplantation in diabetic nephropathy: a single-center experience from a developing country. Int Urol Nephrol. 2012;44(1):269–274. doi:10.1007/s11255-011-0040-9
8. Kainz A, Hronsky M, Stel VS, et al. Prediction of prevalence of chronic kidney disease in diabetic patients in countries of the European Union up to 2025. Nephrol Dial Transplant. 2015;30:113–118. doi:10.1093/ndt/gfv073
9. Abougalambou SSI, Abougalambou AS. Prevalence and risk factors of microalbuminuria in type 2 diabetes mellitus outpatients at University Sains Malaysia Hospital. Diabetes Metab Syndr. 2013;7(2):64–67. doi:10.1016/j.dsx.2013.02.034
10. Svensson MK, Tyrberg M, Nystrom L, et al. The risk for diabetic nephropathy is low in young adults in a 17-year follow-up from the Diabetes Incidence Study in Sweden (DISS). Older age and higher BMI at diabetes onset can be important risk factors. Diabetes Metab Res Rev. 2015;31(2):138–146. doi:10.1002/dmrr.2574
11. Afkarian M, Sachs MC, Kestenbaum B, et al. Kidney disease and increased mortality risk in type 2 diabetes. J Am Soc Nephrol. 2013;24(2):302–308. doi:10.1681/ASN.2012070718
12. Rostamkhani H, Mellati AA, Tabaei BS, Alavi M, Mousavi SN. Association of serum zinc and vitamin A levels with severity of retinopathy in type 2 diabetic patients: a cross-sectional study. Biol Trace Elem Res. 2019;192(2):123–128. doi:10.1007/s12011-019-01664-z
13. Zhang J, Wang Y, Li L, et al. Diabetic retinopathy may predict the renal outcomes of patients with diabetic nephropathy. Ren Fail. 2018;40(1):243–251. doi:10.1080/0886022X.2018.1456453
14. Li W, Xie B, Qiu S, et al. Non-lab and semi-lab algorithms for screening undiagnosed diabetes: a cross-sectional study. Ebiomedicine. 2018;35:307–316. doi:10.1016/j.ebiom.2018.08.009
15. Arboix A, Rivas A, Garcia-Eroles L, de Marcos L, Massons J, Oliveres M. Cerebral infarction in diabetes: clinical pattern, stroke subtypes, and predictors of in-hospital mortality. BMC Neurol. 2005;5:9. doi:10.1186/1471-2377-5-9
16. Almdal T, Scharling H, Jensen JS, Vestergaard H. The independent effect of type 2 diabetes mellitus on ischemic heart disease, stroke, and death - a population-based study of 13000 men and women with 20 years of follow-up. Arch Intern Med. 2004;164(13):1422–1426. doi:10.1001/archinte.164.13.1422
17. Janghorbani M, Hu FB, Willett WC, et al. Prospective study of type 1 and type 2 diabetes and risk of stroke subtypes - the nurses’ health study. Diabetes Care. 2007;30(7):1730–1735. doi:10.2337/dc06-2363
18. Zhang XD, Chen YR, Ge L, Ge ZM, Zhang YH. Features of stroke in Chinese diabetes patients: a hospital-based study. J Int Med Res. 2007;35(4):540–546. doi:10.1177/147323000703500414
19. Gujjar AR. Diabetes and Stroke: more than just accelerated atherosclerosis? Sultan Qaboos Univ Med J. 2018;18(3):e261–e263. doi:10.18295/squmj.2018.18.03.001
20. Murea M. Advanced kidney failure and hyperuricemia. Adv Chronic Kidney Dis. 2012;19(6):419–424. doi:10.1053/j.ackd.2012.07.008
21. Ogbera AO, Azenabor AO. Hyperuricaemia and the metabolic syndrome in type 2 DM. Diabetol Metab Syndr. 2010;2. doi:10.1186/1758-5996-2-24
22. Lai SW, Tan CK, Ng KC. Epidemiology of hyperglycemia in elderly persons. J Gerontol Ser a Biol Sci Med Sci. 2000;55(5):M257–M259. doi:10.1093/gerona/55.5.M257
23. Li Y, Fan X, Li C, et al. The relationships among hyperuricemia, body mass index and impaired renal function in type 2 diabetic patients. Endocr J. 2018;65(3):281–290.
24. Kanbay M, Segal M, Afsar B, Kang D-H, Rodriguez-Iturbe B, Johnson RJ. The role of uric acid in the pathogenesis of human cardiovascular disease. Heart. 2013;99(11):759–766. doi:10.1136/heartjnl-2012-302535
25. Liang -C-C, Lin P-C, Lee M-Y, et al. Association of serum uric acid concentration with diabetic retinopathy and albuminuria in taiwanese patients with type 2 diabetes mellitus. Int J Mol Sci. 2016;17(8):1248. doi:10.3390/ijms17081248
26. Zoppini G, Targher G, Chonchol M, et al. Serum uric acid levels and incident chronic kidney disease in patients with type 2 diabetes and preserved kidney function. Diabetes Care. 2012;35(1):99–104. doi:10.2337/dc11-1346
27. Bartakova V, Kuricova K, Pacal L, et al. Hyperuricemia contributes to the faster progression of diabetic kidney disease in type 2 diabetes mellitus. J Diabetes Complications. 2016;30(7):1300–1307. doi:10.1016/j.jdiacomp.2016.06.002
28. Yan Z-P, Ma J-X. Risk factors for diabetic retinopathy in northern Chinese patients with type 2 diabetes mellitus. Int J Ophthalmol. 2016;9(8):1194–1199. doi:10.18240/ijo.2016.08.17
29. Early Treatment Diabetic Retinopathy Study Research Group. Classification of diabetic retinopathy from fluorescein angiograms. ETDRS report number 11. Ophthalmology. 1991;98(5):807–822. doi:10.1016/S0161-6420(13)38013-0
30. American Diabetes Association. Diabetic nephropathy. Diabetes Care. 2000; 23 Suppl 1: S69-72.PMID: 12017684.
31. Wang H, Zhang L, Liu Z, et al. Predicting medication nonadherence risk in a Chinese inflammatory rheumatic disease population: development and assessment of a new predictive nomogram. Patient Prefer Adherence. 2018;12:1757–1765. doi:10.2147/PPA.S159293
32. Gaita L, Timar R, Lupascu N, et al. The impact of hyperuricemia on cardiometabolic risk factors in patients with diabetes mellitus: a cross-sectional study. Diabetes Metab Syndr Obes. 2019;12:2003–2010. doi:10.2147/DMSO.S222570
33. Cibickova L, Langova K, Vaverkova H, Kubickova V, Karasek D. Correlation of uric acid levels and parameters of metabolic syndrome. Physiol Res. 2017;66(3):481–487. doi:10.33549/physiolres.933410
34. Zhu C, Cui R, Gao M, et al. The associations of serum uric acid with obesity-related acanthosis nigricans and related metabolic indices. Int J Endocrinol. 2017;2017:1–9. doi:10.1155/2017/5438157
35. de Oliveira EP, Burini RC. High plasma uric acid concentration: causes and consequences. Diabetol Metab Syndr. 2012;4. doi:10.1186/1758-5996-4-12
36. Cohen E, Fraser A, Goldberg E, Milo G, Garty M, Krause I. Association between the body mass index and chronic kidney disease in men and women. A population-based study from Israel. Nephrol Dial Transplant. 2013;28:130–135. doi:10.1093/ndt/gft072
37. Wei F, Chang B, Yang X, Wang Y, Chen L, Li W-D. Serum uric acid levels were dynamically coupled with hemoglobin A1c in the development of type 2 diabetes. Sci Rep. 2016;6:1–9.
38. Nalysnyk L, Hernandez-Medina M, Krishnarajah G. Glycaemic variability and complications in patients with diabetes mellitus: evidence from a systematic review of the literature. Diabetes Obes Metab. 2010;12(4):288–298. doi:10.1111/j.1463-1326.2009.01160.x
39. Chen W-Z, Hung -C-C, Wen Y-W, Ning H-C, Gau B-R, Huang -Y-Y. Effect of glycemic control on microalbuminuria development among type 2 diabetes with high-normal albuminuria. Ren Fail. 2014;36(2):171–175. doi:10.3109/0886022X.2013.832312
40. Garg N, Moorthy N, Kapoor A, et al. Hemoglobin A(1c) in nondiabetic patients: an independent predictor of coronary artery disease and its severity. Mayo Clin Proc. 2014;89(7):908–916. doi:10.1016/j.mayocp.2014.03.017
41. Hou Y-L, Yang X-L, Wang C-X, Zhi L-X, Yang M-J, You C-G. Hypertriglyceridemia and hyperuricemia: a retrospective study of urban residents. Lipids Health Dis. 2019;18. doi:10.1186/s12944-019-1031-6
42. Cui N, Cui J, Sun J, et al. Triglycerides and total cholesterol concentrations in association with hyperuricemia in Chinese adults in Qingdao, China. Risk Manag Healthc Policy. 2020;13:165–173. doi:10.2147/RMHP.S243381
43. Matsuura F, Yamashita S, Nakamura T, et al. Effect of visceral fat accumulation on uric acid metabolism in male obese subjects: visceral fat obesity is linked more closely to overproduction of uric acid than subcutaneous fat obesity. Metabol Clin Exp. 1998;47(8):929–933. doi:10.1016/S0026-0495(98)90346-8
44. Zhang X, Meng Q, Feng J, et al. The prevalence of hyperuricemia and its correlates in Ganzi Tibetan Autonomous Prefecture, Sichuan Province, China. Lipids Health Dis. 2018;17. doi:10.1186/s12944-018-0882-6
45. Xu J, Peng H, Ma Q, et al. Associations of non-high density lipoprotein cholesterol and traditional blood lipid profiles with hyperuricemia among middle-aged and elderly Chinese people: a community-based cross-sectional study. Lipids Health Dis. 2014;13(1):117. doi:10.1186/1476-511X-13-117
46. Mahwish UN, Ponnaluri KC, Heera B, et al. Link between ACE I/D gene polymorphism and dyslipidemia in diabetic nephropathy: a case-control study from Hyderabad, India. Indian J Nephrol. 2020;30(2):77–84. doi:10.4103/ijn.IJN_244_18
47. Song Y, Liu W, Tang K, Zang J, Li D, Gao H. Mangiferin alleviates renal interstitial fibrosis in streptozotocin-induced diabetic mice through regulating the PTEN/PI3K/Akt signaling pathway. J Diabetes Res. 2020;2020.
48. Hu X, Zhuang X-D, Mei W-Y, et al. Exploring the causal pathway from body mass index to coronary heart disease: a network Mendelian randomization study. Ther Adv Chronic Dis. 2020;11:204062232090904. doi:10.1177/2040622320909040
49. Wu D, Liu H, Li S-H. Association of elevated uric acid with metabolic disorders and analysis of the risk factors of hyperuricemia in type 2 diabetes mellitus. Nan Fang Yi Ke Da Xue Xue Bao. 2011;31(3):544–547.
50. Dong X, Zhang H, Wang F, et al. Epidemiology and prevalence of hyperuricemia among men and women in Chinese rural population: the Henan rural cohort study. Mod Rheumatol. 2019;1–11. doi:10.1080/14397595.2019.1660048
51. Crass RL, Pai MP. Estimating renal function in drug development: time to take the fork in the road. J Clin Pharmacol. 2019;59(2):159–167. doi:10.1002/jcph.1314
52. Wagner M, Wanner C, Schich M, et al. Patient’s and physician’s awareness of kidney disease in coronary heart disease patients - a cross-sectional analysis of the German subset of the EUROASPIRE IV survey. BMC Nephrol. 2017;18. doi:10.1186/s12882-017-0730-3
53. Petrovic S, Bogavac-Stanojevic N, Lakic D, et al. Cost-effectiveness analysis of acute kidney injury biomarkers in pediatric cardiac surgery. Biochemi Medica. 2015;25(2):262–271. doi:10.11613/BM.2015.027
54. Qi D, Liu J, Wang C, et al. Sex-specific differences in the prevalence of and risk factors for hyperuricemia among a low-income population in China: a cross-sectional study. Postgrad Med. 2020;1–9. doi:10.1080/00325481.2020.1761133
55. Ni Q, Lu X, Chen C, Du H, Zhang R. Risk factors for the development of hyperuricemia A STROBE-compliant cross-sectional and longitudinal study. Medicine. 2019;98(42):e17597. doi:10.1097/MD.0000000000017597
56. Maeda H, Michiue T, Zhu B-L, et al. Potential risk factors for sudden cardiac death: an analysis of medicolegal autopsy cases. Leg Med (Tokyo). 2009;11(Suppl 1):S263–265. doi:10.1016/j.legalmed.2009.01.004
57. Chang H-Y, Lee P-H, Lei -C-C, et al. Hyperuricemia is an independent risk factor for new onset micro-albuminuria in a middle-aged and elderly population: a prospective cohort study in Taiwan. PLoS One. 2013;8(4):e61450.
58. Lee JE, Kim YG, Choi YH, Huh W, Kim DJ, Oh HY. Serum uric acid is associated with microalbuminuria in prehypertension. Hypertension. 2006;47(5):962–967. doi:10.1161/01.HYP.0000210550.97398.c2
59. Sarrafan-Chaharsoughi Z, Manaviat MR, Namiranian N, Yazdian-Anari P, Rahmanian M. Is there a relationship between body mass index and diabetic retinopathy in type II diabetic patients? A cross sectional study. J Diabetes Metab Disord. 2018;17(1):63–69. doi:10.1007/s40200-018-0339-5
60. Zhang GH, Chen HY, Chen WQ, Zhang MZ. Prevalence and risk factors for diabetic retinopathy in China: a multi-hospital-based cross-sectional study. Br J Ophthalmol. 2017;101(12):1591–1595. doi:10.1136/bjophthalmol-2017-310316
61. Lehto S, Niskanen L, Ronnemaa T, Laakso M. Serum uric acid is a strong predictor of stroke in patients with non-insulin-dependent diabetes mellitus. Stroke. 1998;29(3):635–639. doi:10.1161/01.STR.29.3.635
62. Seghieri G, Moruzzo D, Fascerti S, et al. Increase in serum uric acid is selectively associated with stroke in type 2 diabetes. Diabetes Care. 2002;25(6):1095. doi:10.2337/diacare.25.6.1095
63. Chamorro A, Obach V, Cervera A, Revilla M, Deulofeu R, Aponte JH. Prognostic significance of uric acid serum concentration in patients with acute ischemic stroke. Stroke. 2002;33(4):1048–1052. doi:10.1161/hs0402.105927
64. Cui L, Meng L, Wang G, et al. Prevalence and risk factors of hyperuricemia: results of the Kailuan cohort study. Mod Rheumatol. 2017;27(6):1066–1071. doi:10.1080/14397595.2017.1300117
 © 2020 The Author(s). This work is published and licensed by Dove Medical Press Limited. The
full terms of this license are available at https://www.dovepress.com/terms
and incorporate the Creative Commons Attribution
- Non Commercial (unported, 3.0) License.
By accessing the work you hereby accept the Terms. Non-commercial uses of the work are permitted
without any further permission from Dove Medical Press Limited, provided the work is properly
attributed. For permission for commercial use of this work, please see paragraphs 4.2 and 5 of our Terms.
© 2020 The Author(s). This work is published and licensed by Dove Medical Press Limited. The
full terms of this license are available at https://www.dovepress.com/terms
and incorporate the Creative Commons Attribution
- Non Commercial (unported, 3.0) License.
By accessing the work you hereby accept the Terms. Non-commercial uses of the work are permitted
without any further permission from Dove Medical Press Limited, provided the work is properly
attributed. For permission for commercial use of this work, please see paragraphs 4.2 and 5 of our Terms.