
Back to Journals » International Journal of General Medicine » Volume 18
Study on the Evaluation of Hip Dysplasia by Measuring the Lateral Center-Edge Angle of Hip Joint on X-Ray Using Deep Learning Algorithm

Received 13 May 2025
Accepted for publication 5 August 2025
Published 20 August 2025 Volume 2025:18 Pages 4563—4569
DOI https://doi.org/10.2147/IJGM.S533748
Checked for plagiarism Yes
Review by Single anonymous peer review
Peer reviewer comments 2
Editor who approved publication: Dr Gauri Agarwal
Xiao Wang, Zisheng Ai
School of Medicine, Tongji University, Shanghai, 200092, People’s Republic of China
Correspondence: Zisheng Ai, Email [email protected]
Objective: To study the effectiveness and value of using a deep learning algorithm to measure the lateral center-edge angle (LCEA) of the hip joint on X-ray images for the evaluation of hip dysplasia.
Methods: This retrospective study included 231 patients (462 hips) undergoing bilateral hip X-rays from February 2023 to February 2024. Two radiologists annotated key acetabular landmarks and femoral contours for model training. A deep learning model performed automatic LCEA measurements, which were compared to manual measurements by radiologists. Consistency was assessed using intraclass correlation coefficient (ICC), and diagnostic performance was evaluated with ROC analysis.
Results: A total of 462 hips were measured. There was no statistically significant difference between manual and automated measurements of left and right LCEA (P> 0.05). The ICC measurements for manual and automated LCEA for the left and right hips were 0.936 and 0.902, respectively, with r-values of 0.929 and 0.913 (P< 0.05). A total of 44 hips were diagnosed with hip dysplasia and 56 with borderline hip dysplasia. The sensitivity of automated measurements for diagnosing hip dysplasia was 88.64% (39/44), with an accuracy of 95.67% (442/462); the sensitivity for diagnosing borderline dysplasia was 66.07% (37/56), with an accuracy of 91.56% (423/462). The area under the curve (AUC) for diagnosing hip dysplasia using automated LCEA measurements (threshold of 25.24°) was 0.917 (P< 0.05).
Conclusion: The deep learning algorithm for measuring bilateral hip LCEA on X-rays has good efficacy in diagnosing hip dysplasia, with an AUC of up to 0.917.
Keywords: deep learning algorithm, X-ray, hip joint, lateral center-edge angle, hip dysplasia
Introduction
Hip dysplasia is a disease characterized by abnormal hip joint structure, with features such as underdeveloped acetabulum and reduced contact area between the femoral head and acetabulum, which can lead to decreased hip joint stability. Early diagnosis and intervention are recommended in clinical practice.1,2 The early diagnosis of hip dysplasia typically relies on clinical signs and imaging examinations, with X-ray measurements being one of the important tools.3 The lateral center-edge angle (LCEA) is a critical indicator for assessing acetabular coverage, as its value directly reflects the extent of acetabular coverage of the femoral head, with values below normal indicating acetabular dysplasia.4 Although the method for measuring LCEA is not complex, manual measurement is susceptible to subjective factors of the operator, leading to errors and variability in results.5 In recent years, deep learning algorithms have rapidly developed and can achieve automated analysis of medical images.6 Therefore, this study attempts to evaluate the effectiveness and value of deep learning algorithms in the automated measurement of hip LCEA on X-rays, exploring its potential application in diagnosing hip dysplasia. We hope that this study can provide an efficient and reliable automated measurement method for the imaging evaluation of hip dysplasia, promoting early diagnosis and intervention of the condition.
Materials and Methods
Participants
This retrospective study included adult patients who underwent bilateral anteroposterior (AP) hip radiographs at our institution between February 2023 and February 2024. A total of 287 patients (574 hips) were initially screened. Patients were included if they were aged 18 years or older with closed epiphyseal plates, had normal cognitive and communication abilities, and were willing to participate in the study. Complete clinical data and high-quality, analyzable bilateral AP hip radiographs were required.
Exclusion criteria were as follows: a history of hip or pelvic surgery (n = 10), hip dislocation or fracture (n = 5), femoral head necrosis or hip osteoarthritis with Kellgren-Lawrence grade > 2 (n = 9), and other hip-related structural disorders, including rheumatoid arthritis (n = 9), Paget’s disease (n = 5), and ankylosing spondylitis (n = 3).
After applying these criteria, 254 patients remained eligible. Subsequently, 23 patients (46 hips) were excluded due to poor image quality, as determined by quality control assessment (see Section 1.2). The final dataset consisted of 231 patients (462 hips), including 75 males and 156 females. The participants’ ages ranged from 21 to 74 years, with a mean age of 47.95 ± 10.13 years.
Imaging Acquisition and Quality Control
All radiographs were obtained using a Siemens Axiom Aristos MX digital radiography system. Patients were positioned supine with legs extended and parallel, and feet internally rotated by approximately 15°. The source-to-image distance was set at 100 cm. Exposure parameters included a tube voltage of 70–100 kV and a tube current of 160–200 mA. The central X-ray beam was directed perpendicular to the midpoint between the anterior superior iliac spine (ASIS) line and the upper margin of the pubic symphysis. The exposure field extended from the ASIS (superior border) to the level of the lesser trochanters (inferior border).
To ensure image quality, two senior musculoskeletal radiologists (with 10 and 15 years of experience, respectively) independently reviewed all AP hip radiographs. Images were excluded if they showed pelvic rotation (defined as a deviation of the pubic symphysis from the sacral midline greater than 1 cm; n = 15), poorly defined anatomical landmarks such as the acetabular roof or teardrop (n = 6), or inadequate exposure leading to unclear bony structures (n = 2). In total, 23 patients (46 hips) were excluded due to suboptimal image quality.
Image Annotation and Ground Truth Definition
Image annotations were performed using ITK-SNAP software by two senior musculoskeletal radiologists with 10 and 15 years of experience, respectively. The annotation process included labeling the proximal femoral contour and key acetabular landmarks (the lateral edge of the acetabulum and the inferior margin of the teardrop). Before the formal annotation, both radiologists underwent a 2-hour standardized training session to ensure consistency.
To assess inter-rater reliability, a random subset of 50 radiographs was selected. The intraclass correlation coefficient (ICC) was 0.92 for femoral head center coordinates and 0.89 for acetabular landmarks. Annotations with differences exceeding 2 mm were reviewed and resolved by consensus. The final set of annotations was saved in NIfTI format and used as the ground truth for model training.
Model Development
All images were preprocessed by zero-padding or cropping to a uniform size of 2560×3072 pixels, followed by downsampling to 640×768 pixels. Data augmentation techniques were applied to the training set, including horizontal flipping (50% probability), random rotation (±10°), brightness adjustment (±15%), and random cropping (to 512×512 pixels).
A Dense U-Net architecture was employed for segmentation and key point detection. The encoder consisted of five dense blocks, with output channel sizes of 32, 64, 128, 256, and 512, respectively. Each block included 3×3 convolutions followed by batch normalization and ReLU activation. The decoder path utilized upsampling operations combined with skip connections that fused low-level features from the encoder. The output layer used a sigmoid activation to generate heatmaps for key point detection and segmentation masks for bone contour delineation. The total number of trainable parameters was approximately 2.7 million.
Model training was conducted using Python 3.8, Keras 2.4, and TensorFlow 2.2 on an NVIDIA RTX A6000 GPU (48 GB VRAM) with 128 GB of RAM. The model architecture and implementation adhered to the MINIMAR (Minimum Information for Medical AI Reporting) guideline standards.
Cross-Validation and Testing
To validate the model, a stratified 10-fold cross-validation was performed based on IHDI classification. The full dataset of 462 hips was randomly divided into 10 approximately equal subsets (each containing 46–47 hips). In each fold, 9 subsets were used for training and 1 for validation, ensuring that every sample was used once for validation.
Additionally, an independent test set comprising 93 hips (20% of the total dataset) was set aside before training and was not exposed to the model during training or validation. This test set was used exclusively for final performance evaluation.
LCEA Measurement and Diagnostic Criteria
The model automatically calculated the lateral center-edge angle (LCEA) using the coordinates of the femoral head center and the lateral edge of the acetabulum based on the geometric relationship:

Manual LCEA measurements were independently performed by two radiologists who were blinded to the AI results. Each radiologist measured LCEA twice (with a minimum interval of 30 days), and the average of the two readings was used as the final reference value.
Diagnostic thresholds were defined as follows: Developmental dysplasia of the hip (DDH): LCEA ≤ 20°; Borderline dysplasia: 20° < LCEA ≤ 25°; Normal hip: LCEA > 25°.7
Statistical Analysis
Agreement between AI and manual LCEA measurements was assessed using Bland–Altman plots and intraclass correlation coefficients (ICC) with 95% confidence intervals (CI). Prediction error was evaluated using root mean square error (RMSE) and mean absolute error (MAE).
Diagnostic performance was evaluated using receiver operating characteristic (ROC) curve analysis, with manual measurement as the reference standard. The area under the ROC curve (AUC) was used to assess the model’s ability to detect DDH.
All statistical analyses were performed using SPSS version 20.0 (Wilcoxon rank-sum test for group comparison, Pearson correlation analysis), and Python with the scikit-learn package for AI performance metrics.
Results
Angle Comparison
A total of 462 hips were measured, and the consistency of the measurement results between observers (ICC 0.875~0.924) and within observers (ICC 0.902~0.953) was good. There was no statistically significant difference between the manual and automatic measurements of left LCEA and right LCEA (P>0.05), as shown in Table 1. The ICC values for the manual and automatic measurements of left LCEA and right LCEA were 0.936 and 0.902, respectively, and the r values were 0.929 and 0.913, respectively (P<0.05), as shown in Figure 1. The median RMSE for left and right LCEA were 2.27° and 3.29°, and the median MAE were 1.53° and 1.68°, respectively.
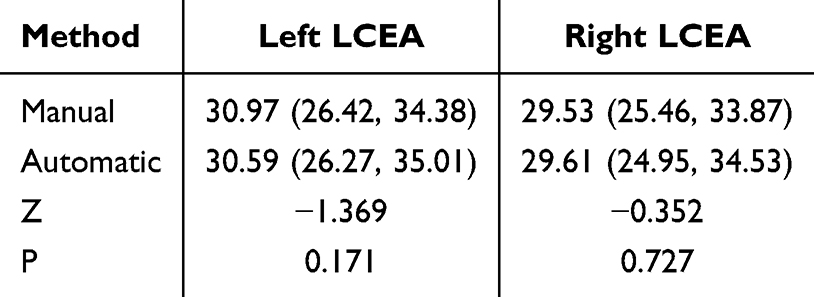 |
Table 1 Comparison of Manual and Automatic Measurements of Bilateral Hip LCEA (n=462, °) |
 |
Figure 1 Correlation Scatter Plot of Manual and Automatic Measurements of Hip LCEA. |
Hip Development
A total of 44 hips were diagnosed with hip dysplasia, and 56 hips were diagnosed with borderline hip dysplasia. The sensitivity of the automatic measurement for diagnosing hip dysplasia was 88.64% (39/44), with an accuracy of 95.67% (442/462); the sensitivity for diagnosing borderline dysplasia was 66.07% (37/56), with an accuracy of 91.56% (423/462). The results of the ROC curve analysis showed that the automatic measurement of the LCE angle, using a threshold of 25.24°, achieved an AUC of 0.917 (P < 0.05) for the diagnosis of hip dysplasia, as shown in Figure 2.
 |
Figure 2 ROC Curve for Diagnosing Hip Dysplasia Using Automatic LCEA Measurement. |
Discussion
Developmental dysplasia of the hip (DDH) is a common orthopedic condition that can lead to chronic pain and early osteoarthritis if not diagnosed and treated early. Accurate measurement of the lateral center-edge angle (LCEA) on anteroposterior (AP) pelvic radiographs is essential for the diagnosis of DDH, borderline dysplasia, and normal hip morphology. Manual measurement, although widely used, is time-consuming and subject to inter- and intra-observer variability, especially when anatomical landmarks are not clearly defined. In recent years, artificial intelligence (AI)-based tools, particularly deep learning algorithms, have shown promise in automating radiological assessments with high accuracy and reproducibility.8–11
In this study, we validated a deep learning model based on a Dense U-Net architecture to automatically measure the LCEA from bilateral AP hip radiographs. Our model demonstrated high agreement with manual measurements, showing intraclass correlation coefficients (ICCs) of 0.936 and 0.902 for the left and right hips, respectively. These values indicate excellent consistency and are comparable to the interobserver and intraobserver ICCs of manual measurement (range: 0.875–0.953), supporting the reliability of the AI approach. Additionally, the root mean square error (RMSE) and mean absolute error (MAE) for automatic measurements were relatively low (RMSE: 2.27°–3.29°, MAE: 1.53°–1.68°), further confirming the precision of the model.
Compared with previous studies, our findings demonstrate superior or comparable performance. Weinstein et al12 developed a CNN-based model for automated DDH diagnosis and reported an AUC of 0.89 for LCEA classification, which is slightly lower than the AUC of 0.917 achieved in our model. Similarly, Kamenaga et al13 reported ICCs between 0.85 and 0.90 for LCEA measurements using a ResNet architecture, while our model achieved higher ICCs on both sides. This performance improvement may be attributed to the Dense U-Net’s multi-scale feature fusion and skip connections, which enhanced anatomical landmark localization. These comparisons reinforce the effectiveness of our model design and the robustness of our dataset.
Interestingly, the automatic measurements did not significantly differ from manual measurements (P > 0.05), suggesting that the model not only approximates human-level performance but does so consistently across different hip sides. This is especially relevant considering the variability in pelvic positioning and anatomical landmark visibility that often complicates manual assessments. The high correlation coefficients (r = 0.929 and 0.913) also reflect strong linear agreement between AI and manual methods, as visualized in the correlation scatter plots.
Beyond measurement accuracy, the diagnostic utility of the automated LCEA was also evaluated. Our model achieved excellent performance in detecting hip dysplasia, with an area under the ROC curve (AUC) of 0.917 and an accuracy of 95.67%. These results are consistent with previously reported deep learning methods used for similar tasks,14–17 and further support the potential of AI-assisted tools in improving diagnostic efficiency. Although the sensitivity for borderline dysplasia detection was lower (66.07%), this is not uncommon, as borderline cases often present with subtle anatomical variations and diagnostic ambiguity.18–21 Future integration of clinical data or multimodal imaging such as MRI may help improve model performance in this subgroup.
Several methodological strengths support the robustness of our findings. First, all radiographs were acquired under standardized imaging protocols and reviewed by experienced musculoskeletal radiologists, ensuring high-quality inputs. Second, landmark annotation was performed by trained experts with good inter-rater reliability, and discrepancies were resolved through consensus, ensuring the reliability of ground truth. Third, the study followed the MINIMAR (Minimum Information for Medical AI Reporting) standards,22–24 used stratified 10-fold cross-validation, and reserved an independent test set for unbiased evaluation, enhancing the generalizability and credibility of the results.
Nevertheless, this study has several limitations. First, it was a retrospective single-center study, and the model’s generalizability to radiographs obtained from other institutions, or with different imaging protocols, requires further validation. Second, although the model showed high diagnostic accuracy for DDH, its performance in borderline dysplasia cases remains suboptimal and warrants future improvement. Third, all manual measurements used for model validation were based on radiologist consensus and lacked surgical or long-term follow-up confirmation as an objective standard. Fourth, this study did not perform stratified analysis based on patient characteristics such as age, sex, or body mass index (BMI), which may influence hip morphology and LCEA measurement.25,26 Future research should consider incorporating stratified sub-group analysis to evaluate whether the model maintains consistent performance across different demographic and anatomical groups.
Future directions include multi-center prospective validation, real-world integration with PACS systems, and interface development for clinical use. It may also be valuable to explore the model’s application in longitudinal follow-up of hip development or postoperative outcomes, and to investigate whether incorporating 3D imaging or clinical context improves performance.
In conclusion, we developed a deep learning-based model capable of automatically measuring the LCEA from standard AP hip radiographs with high accuracy and diagnostic utility. The model showed excellent agreement with expert manual measurements and demonstrated strong performance in detecting DDH. These findings support the potential of AI to enhance the efficiency, reproducibility, and objectivity of radiographic assessments in clinical orthopedics, particularly in the early diagnosis and management of hip dysplasia.
Disclosure
The authors report no conflicts of interest in this work.
References
1. Gaffney BMM, Van Dillen LR, Foody JN, et al. Multi-joint biomechanics during sloped walking in patients with developmental dysplasia of the Hip. Clin Biomech. 2021;84:105335. doi:10.1016/j.clinbiomech.2021.105335
2. Diaz-Lopez RA, Alonso-Rasgado MT, Jimenez-Cruz D, et al. Impact of femoroacetabular impingement and dysplasia of the Hip on hip joint sphericity. Hip Int. 2020;30(2):195–203. doi:10.1177/1120700019834295
3. Ellsworth BK, Sink EL, Doyle SM. Adolescent Hip dysplasia: what are the symptoms and how to diagnose it. Curr Opin Pediatr. 2021;33(1):65–73. doi:10.1097/MOP.0000000000000969
4. Kraeutler MJ, Safran MR, Scillia AJ, et al. A Contemporary Look at the Evaluation and Treatment of Adult Borderline and Frank Hip Dysplasia. Am J Sports Med. 2020;48(9):2314–2323. doi:10.1177/0363546519881411
5. Megerian MF, Strony JT, Mengers SR, et al. Use of Anatomic Radiographic Horizons for the Lateral Center-Edge Angle in the Classification of Hip Dysplasia. Am J Sports Med. 2022;50(13):3610–3616. doi:10.1177/03635465221125784
6. Bini SA. Artificial Intelligence, Machine Learning, Deep Learning, and Cognitive Computing: what Do These Terms Mean and How Will They Impact Health Care. J Arthroplasty. 2018;33(8):2358–2361. doi:10.1016/j.arth.2018.02.067
7. Hoorntje A, Pronk Y, Brinkman JM, et al. High tibial osteotomy versus unicompartmental knee arthroplasty for Kellgren-Lawrence grade 3-4 knee osteoarthritis in younger patients: comparable improvements in patient-reported outcomes, adjusted for osteoarthritis grade and sex. Knee Surg Sports Traumatol Arthrosc. 2023;31(11):4861–4870. doi:10.1007/s00167-023-07526-5
8. Yang G, Jiang Y, Liu T, Zhao X, Chang X, Qiu Z. A Semi-automatic Diagnosis of Hip Dysplasia on X-Ray Films. Front Mol Biosci. 2020;7:613878. doi:10.3389/fmolb.2020.613878
9. Muddaluru V, Boughton O, Donnelly T, et al. Developmental dysplasia of the Hip is common in patients undergoing total hip arthroplasty under 50 years of age. Sicot J. 2023;9:25. doi:10.1051/sicotj/2023020
10. Kizawa F, Suzuki D, Nagoya S, et al. Joint instability in patients with borderline developmental dysplasia of the Hip. Clin Biomech. 2024;111:106136. doi:10.1016/j.clinbiomech.2023.106136
11. Kitamura K, Fujii M, Utsunomiya T, et al. Effect of sagittal pelvic tilt on joint stress distribution in Hip dysplasia: a finite element analysis. Clin Biomech. 2020;74:34–41. doi:10.1016/j.clinbiomech.2020.02.011
12. Weinstein SL, Casteñada PG, Sankar WN, et al. Developmental Dysplasia of the Hip From Birth to Adolescence: clear Indications and New Controversies. Instr Course Lect. 2023;72:659–672.
13. Kamenaga T, Hashimoto S, Hayashi S, et al. Larger Acetabular Labrum Is Associated With Hip Dysplasia, Joint Incongruence and Clinical Symptoms. Arthroscopy. 2020;36(9):2446–2453. doi:10.1016/j.arthro.2020.05.023
14. Frysz M, Faber BG, Ebsim R, et al. Machine Learning-Derived Acetabular Dysplasia and Cam Morphology Are Features of Severe Hip Osteoarthritis: findings From UK Biobank. J Bone Miner Res. 2022;37(9):1720–1732. doi:10.1002/jbmr.4649
15. Yang F, Huang H-J, Zhang X, et al. Does capsular repair make a difference in the integrity and thickness of anterior capsule in the setting of borderline Hip dysplasia. BMC Musculoskelet Disord. 2023;24(1):187. doi:10.1186/s12891-023-06307-y
16. Wang X, Song G, Zhang J. Arthroscopic Treatment of Labral Tears in Patients with Borderline Developmental Dysplasia of the Hip: a Retrospective Study with Mean 5.8 Years Follow-Up. Orthop Surg. 2021;13(6):1835–1842. doi:10.1111/os.13042
17. Gupta R, et al. Artificial intelligence to deep learning: machine intelligence approach for drug discovery. Mol Divers. 2021;25(3):1315–1360.
18. Danilovic A. Deep learning is a promising technology and seems to be the future of the CT stone evaluation. Int Braz J Urol. 2022;48(5):840–841. doi:10.1590/s1677-5538.ibju.2022.0132.1
19. Shen T, Huang F, Zhang X. CT medical image segmentation algorithm based on deep learning technology. Math Biosci Eng. 2023;20(6):10954–10976. doi:10.3934/mbe.2023485
20. Al-Bashir AK, Al-Abed M, Abu Sharkh FM, Kordeya MN, Rousan FM. Algorithm for automatic angles measurement and screening for Developmental Dysplasia of the Hip (DDH). Annu Int Conf IEEE Eng Med Biol Soc. 2015;2015:6386–6389. doi:10.1109/EMBC.2015.7319854
21. Yang W, Ye Q, Ming S, et al. Feasibility of automatic measurements of Hip joints based on pelvic radiography and a deep learning algorithm. Eur J Radiol. 2020;132:109303. doi:10.1016/j.ejrad.2020.109303
22. Kuroda Y, Hashimoto S, Saito M, et al. Femoro-Epiphyseal Acetabular Roof (FEAR) Index and Anterior Acetabular Coverage Correlate With Labral Length in Developmental Dysplasia of the Hip. Arthroscopy. 2022;38(2):374–381. doi:10.1016/j.arthro.2021.04.051
23. Lee YK, Chung CY, Koo KH, Lee KM, Kwon DG, Park MS. Measuring acetabular dysplasia in plain radiographs. Arch Orthop Trauma Surg. 2011;131(9):1219–1226. doi:10.1007/s00402-011-1279-4
24. Chung CY, Park MS, Lee KM, et al. Hip osteoarthritis and risk factors in elderly Korean population. Osteoarthritis Cartilage. 2010;18(3):312–316. doi:10.1016/j.joca.2009.11.004
25. Todd JN, Maak TG, Anderson AE, et al. How Does Chondrolabral Damage and Labral Repair Influence the Mechanics of the Hip in the Setting of Cam Morphology? A Finite-Element Modeling Study. Clin Orthop Relat Res. 2022;480(3):602–615. doi:10.1097/CORR.0000000000002000
26. Huang YY, Chen I-J, Wu C-T, et al. The posterior capsule is distended in dysplastic hips, but the anterior capsule is not. Knee Surg Sports Traumatol Arthrosc. 2023;31(1):79–85. doi:10.1007/s00167-022-07207-9
 © 2025 The Author(s). This work is published and licensed by Dove Medical Press Limited. The
full terms of this license are available at https://www.dovepress.com/terms
and incorporate the Creative Commons Attribution
- Non Commercial (unported, 4.0) License.
By accessing the work you hereby accept the Terms. Non-commercial uses of the work are permitted
without any further permission from Dove Medical Press Limited, provided the work is properly
attributed. For permission for commercial use of this work, please see paragraphs 4.2 and 5 of our Terms.
© 2025 The Author(s). This work is published and licensed by Dove Medical Press Limited. The
full terms of this license are available at https://www.dovepress.com/terms
and incorporate the Creative Commons Attribution
- Non Commercial (unported, 4.0) License.
By accessing the work you hereby accept the Terms. Non-commercial uses of the work are permitted
without any further permission from Dove Medical Press Limited, provided the work is properly
attributed. For permission for commercial use of this work, please see paragraphs 4.2 and 5 of our Terms.