Back to Journals » Cancer Management and Research » Volume 13
Study on the Appropriate Timing of Postoperative Adaptive Radiotherapy for High-Grade Glioma
Authors Cao Y, Tang D, Xiang Y, Men L, Liu C, Zhou Q, Wu J, Huo L, Song T, Wang Y, Li Z, Wei R, Shen L, Yang Z, Hong J ![]()
Received 7 January 2021
Accepted for publication 2 April 2021
Published 28 April 2021 Volume 2021:13 Pages 3561—3572
DOI https://doi.org/10.2147/CMAR.S300094
Checked for plagiarism Yes
Review by Single anonymous peer review
Peer reviewer comments 2
Editor who approved publication: Dr Xueqiong Zhu
Ying Cao,1,* Du Tang,1,* Yining Xiang,1 Li Men,2 Chao Liu,1 Qin Zhou,1 Jun Wu,3 Lei Huo,3 Tao Song,3 Ying Wang,4 Zhanzhan Li,1 Rui Wei,1 Liangfang Shen,1 Zhen Yang,1 Jidong Hong1
1Department of Oncology, Xiangya Hospital, Central South University, Changsha, Hunan, People’s Republic of China; 2Department of Radiology, Xiangya Hospital, Central South University, Changsha, Hunan, People’s Republic of China; 3Department of Neurosurgery, Xiangya Hospital, Central South University, Changsha, Hunan, People’s Republic of China; 4Department of Pathology, Xiangya Hospital, Central South University, Changsha, Hunan, People’s Republic of China
*These authors contributed equally to this work
Correspondence: Jidong Hong
Department of Oncology, Xiangya Hospital, Central South University, No. 87, Xiangya Road, Changsha, Hunan, 410008, People’s Republic of China
Tel +86 731 8975 3733
Fax +86 731 8975 3336
Email [email protected]
Purpose: To investigate the appropriate timing of adaptive radiotherapy (ART) for high-grade glioma.
Methods: Ten patients with high-grade gliomas were selected and underwent CT/MRI (CT1/MRI1, CT2/MRI2, CT3/MRI3, and CT4/MRI4) scans before RT and during 10-, 20- and 30-fraction RT, and the corresponding RT plans (plan1, plan2, plan3 and plan4) were made. The dose of the initial plan (plan1) was projected to CT2 and CT3 using the image registration technique to obtain the projection plans (plan1– 2 and plan1– 3) and by superimposing the doses to obtain the ART plans (plan10+20 and plan20+10), respectively. The dosimetric differences in the target volume and organs at risk (OARs) were compared between the projection and adaptive plans. The tumor control probability (TCP) for the planning target volume (PTV) and normal tissue complication probability (NTCP) for the OARs were compared between the two adaptive plans.
Results: Compared with the projection plan, the D2 to the PTV of ART decreased, the conformity index (CI) to the PTV increased, and the D2/Dmean to the brainstem, optic chiasm and pituitary, as well as the V20, V30, V40 and V50 to the normal brain decreased. The D2 to the pituitary and optic chiasm as well as the V20, V30, V40 and V50 to the normal brain in plan10+20 were lower than those in plan20+10, while the CI to the PTV was higher than that in plan20+10. The TCP of the PTV in plan10+20 was higher than that in plan20+10.
Conclusion: ART can improve the precision of target volume irradiation and reduce the irradiation dose to the OARs in high-grade glioma. The time point after 10 fractions of RT is appropriate for ART.
Keywords: adaptive radiotherapy, high-grade glioma, dosimetry, biophysical model
Introduction
The standard treatments for high-grade gliomas include surgery, postoperative radiotherapy (RT), and synchronous and adjuvant chemotherapy with temozolomide (TMZ). Previous studies have shown that the anatomical structure of normal tissues in the target volume and its surroundings is nonstatic during RT for gliomas. With changes in volume, location and morphology, the dose distribution of RT to the target volume can change to varying degrees.1–5 If the initial RT planning scheme has been used for the entire irradiation plan, regardless of changes in the size, location and morphology of the target volume and organs at risk (OARs), the tumor segment that needs to be irradiated may be removed from the high-dose area, and the actual dose to the target volume may be reduced. At the same time, normal tissues may enter the high-dose area, and the radiation dose to normal tissue may even exceed its limited dose, thus aggravating the side effects of RT. Late delayed effects of radiation on the brain mainly included cerebral radiation necrosis and cognitive impairment. Ruben et al6 performed follow-ups on the 426 patients with gliomas experiencing radiochemotherapy, and 21 cases exhibited radionecrosis (4.9%). The actuarial incidence of brain radiation necrosis stabilized by 13.3% after three years, and the risk factors in the high-risk group were total dose, fraction size, and biologically effective dose (BED). The combined radiochemotherapy obviously enhanced the risk of radiation-induced cerebral necrosis. Keime-Guibert et al7 evaluated the cognitive function in glioblastoma in the elderly and found 42 cases in the supportive care group and 39 cases in the supportive care plus radiotherapy group. The scores of the mini mental state examination (MMSE) decreased over time in both groups (P<0.007), while the Mattis Dementia Rating Scale (MDRS) score did not change obviously over time, except for progressive deterioration and initiation (P=0.03) and construction (P=0.05). Yan et al8 first proposed the concept of adaptive radiotherapy (ART). ART refers to a type of RT with improved precision during which CT/MR images and other images are reacquired; anatomical, physiological and other conditions (eg, changes in tumor size, morphology and location) are observed and evaluated; differences between the subsequent RT plan and the original plan are analyzed (upon which the RT plan is redesigned); and the doses after variation in the volume, location and morphology of the target volume as well as normal tissues and organs are modified. This can not only increase the irradiated dose to the tumor but also minimize the irradiated dose to surrounding normal tissues, thus reducing the incidence of radiation complications and improving the long-term quality of life of patients. To date, ART has not been widely used in the study of tumors in the central nervous system. Among such studies, there are few on the use of ART for glioma. Our preliminary work showed that the gross tumor volume (GTV) of gliomas decreased during intensity-modulated radiotherapy (IMRT), which resulted in increased doses to the OARs and normal brain over the course of IMRT;9 thus, it is necessary that the RT plan be modified to decrease the dose to normal organs during RT. Therefore, we performed a study of ART for malignant glioma to identify the appropriate timing of ART in fixed-field IMRT/helical tomotherapy (TOMO).
Methods
Patient Enrollment
This study was approved by the Medical Ethics Committee of Xiangya Hospital, Central South University, and performed in accordance with the Declaration of Helsinki. Written informed consent was obtained from patients prior to the commencement of the study. The inclusion criteria were as follows: patients 18–65 years old with a Karnofsky Performance Status (KPS) score of >80 points, with supratentorial lesions, and who underwent tumor resection by craniotomy and were diagnosed with high-grade glioma based on the 2016 World Health Organization (WHO) pathological classification of central nervous system tumors.10 All patients were treated with IMRT (Varian 23EX and Varian Trilogy, Varian Medical Systems) or TOMO (TomoTherapy HD System, Accuray, Inc.) and synchronous chemotherapy. The simultaneous chemotherapy regimen was as follows: from the first day to the last day of RT, TMZ was administered daily at an oral dose of 75 mg/m2.
Head Immobilization and CT/MRI Scanning
All the patients lied in the supine position with their head fixed with a thermoplastic mask and received enhanced CT simulation (SOMATOM Definition AS, SIEMENS AG) at a thickness of 0.3 cm and a scanning range from the vertex to 10 cm below the foramen magnum. MRI simulation (Discovery MR750w, GE Healthcare) was also performed with contrast-enhanced T1, T2 and fluid-attenuated inversion recovery (FLAIR) scans at a thickness of 0.4 cm. Each patient underwent the abovementioned simulated CT/MRI scans four times, namely, before RT (CT1/MRI1) and during 10-fraction RT (CT2/MRI2), 20-fraction RT (CT3/MRI3) and 30-fraction RT (CT4/MRI4).
Target Volume Contouring and RT Planning
The target volume and OARs were outlined according to the European Organization for Research and Treatment of Cancer (EORTC) guidelines.11 The simulated enhanced CT image was fused with the simulated enhanced MRI T1 image. The gross tumor volume (GTV) included the gross tumor volume of the tumor bed or surgical cavity (GTVtb) and the gross tumor volume of the residual tumor (GTVr). The GTVr was outlined according to the MRI contrast-enhanced T1 image. The vascular infarction and damaged brain areas after the operation, if not considered as part of the original tumor volume, were excluded from the GTVr. The clinical target volume (CTV) was the GTV with an extended edge of 2 cm, the edge of which may have been shrunken due to the effects of natural barriers that hinder tumor growth, such as the skull, ventricle wall and cerebral falx; however, the “fixed” barriers, such as the skull and cerebral falx, could be reduced to 0 mm, and the “nonrigid” barriers, such as the brain stem and ventricle wall, could be reduced to as low as 5 mm. The planning target volume (PTV) was the CTV with an extended edge of 0.5 cm. The Radiation Therapy Oncology Group (RTOG) protocol was referred to when determining the dose limits of the OARs.12 The maximum dose (Dmax) to the brain stem, lens, optic chiasm, optic nerve and pituitary was ≤54 Gy, ≤7 Gy, ≤56 Gy, ≤55 Gy and ≤50 Gy, respectively. For IMRT and TOMO, treatment plans were designed on two treatment planning systems: Varian Eclipse and Accuray TomoTherapy. The target volume was outlined on the CT1/MRI1 image, and the initial RT plan (plan1) was designed. The prescribed dose to the PTV was given at 60 Gy for 30 fractions, 2 Gy each fraction.
The dose of the initial RT plan (plan1) was projected to CT2/CT3 to obtain the projection plans (plan1–2 and plan1–3), which indicated that if the RT plan was not modified, the radiation dose distribution would be developed to 30 fractions of irradiation according to the initial plan in CT2/CT3. Then, ART plan10+20 was obtained by superimposing the 10-fraction RT doses of plan1 and the 20-fraction RT doses of plan2, while ART plan20+10 was obtained by superimposing the 20-fraction RT dose of plan1 and the 10-fraction RT dose of plan3, which indicated the cumulative dose distribution obtained by modifying the RT plans after 10 and 20 fractions of RT, respectively.
Biophysical Parameter Calculation
We compared the tumor control probability (TCP) of the PTV and normal tissue complication probability (NTCP) of the OARs between adaptive plan10+20 and adaptive plan20+10. An in-house MATLAB code was developed to calculate the TCP and NTCP values. To calculate the TCP of the PTV, the modified linear quadratic-Poisson model was used.13 The concept of the equivalent uniform dose (EUD) was adopted to estimate the quantitative biophysical measure of tumor dose.14 The following parameters were used to calculate the TCP: α/β=10 Gy, SF2=0.5, Dref=2 Gy, n=30, and D=EUD. The Clongen cell density (CCD), which refers to millions of tumor cells per cubic centimeter of the PTV, was assumed to be 0.5 M/cm3. The NTCP of the OARs was calculated using the Lyman–Kutcher–Burman model.15,16 The tissue tolerance dose parameters and OAR endpoints were employed from the data of Burman et al17 as shown in Table 1.
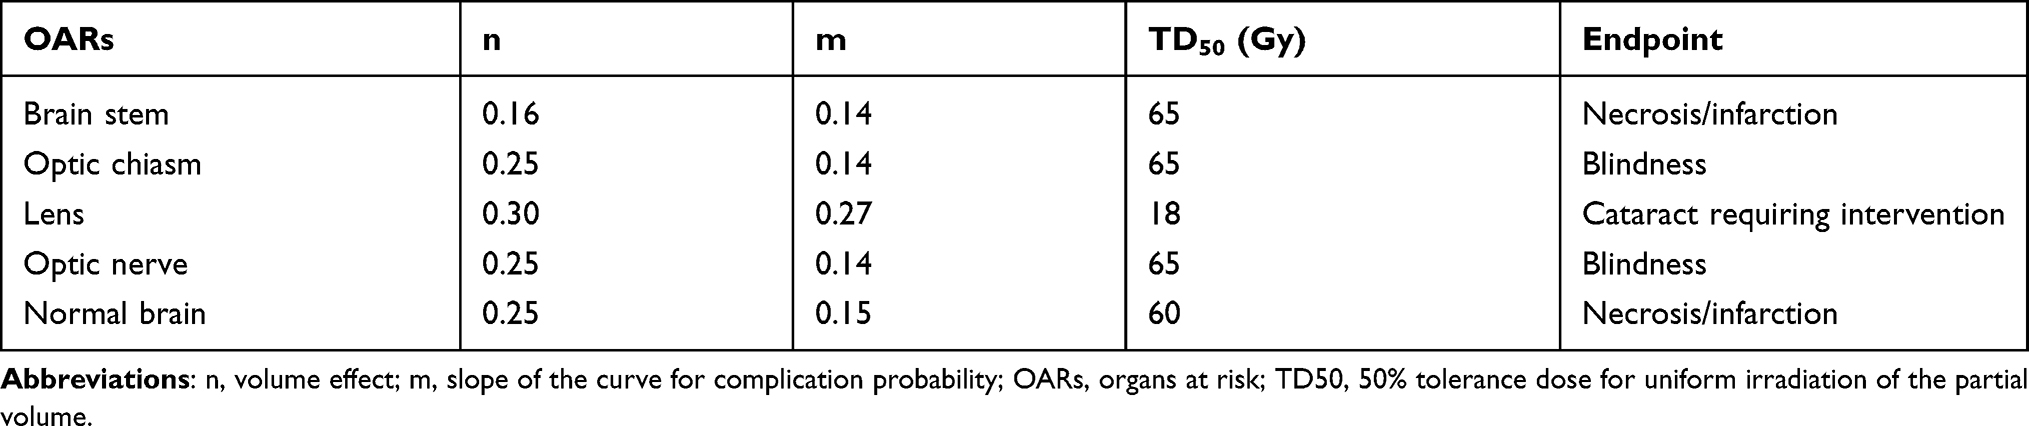 |
Table 1 OAR Endpoints and Tolerance Dose Parameters |
Statistical Methods
Statistical analyses were performed using the IBM SPSS Statistics 22 software package (SPSS, Inc.; Chicago, IL, USA). The target volume and dosimetric data of the target volume and OARs are expressed as the mean ± standard deviation (X±s). The TCP and NTCP are also expressed as the mean ± standard deviation (X±s). A two-sided paired t-test was used for comparisons. Statistical significance was defined as P<0.05.
Results
Clinical Data
From February 2018 to July 2018, ten patients with high-grade gliomas in the Department of Oncology, Xiangya Hospital, Central South University (nine males and one female, with a mean age of 41.8 years (age range, 18~55 years), were enrolled in this study. Of these patients, 6 received TOMO and 4 received IMRT. The clinical data are shown in Table 2.
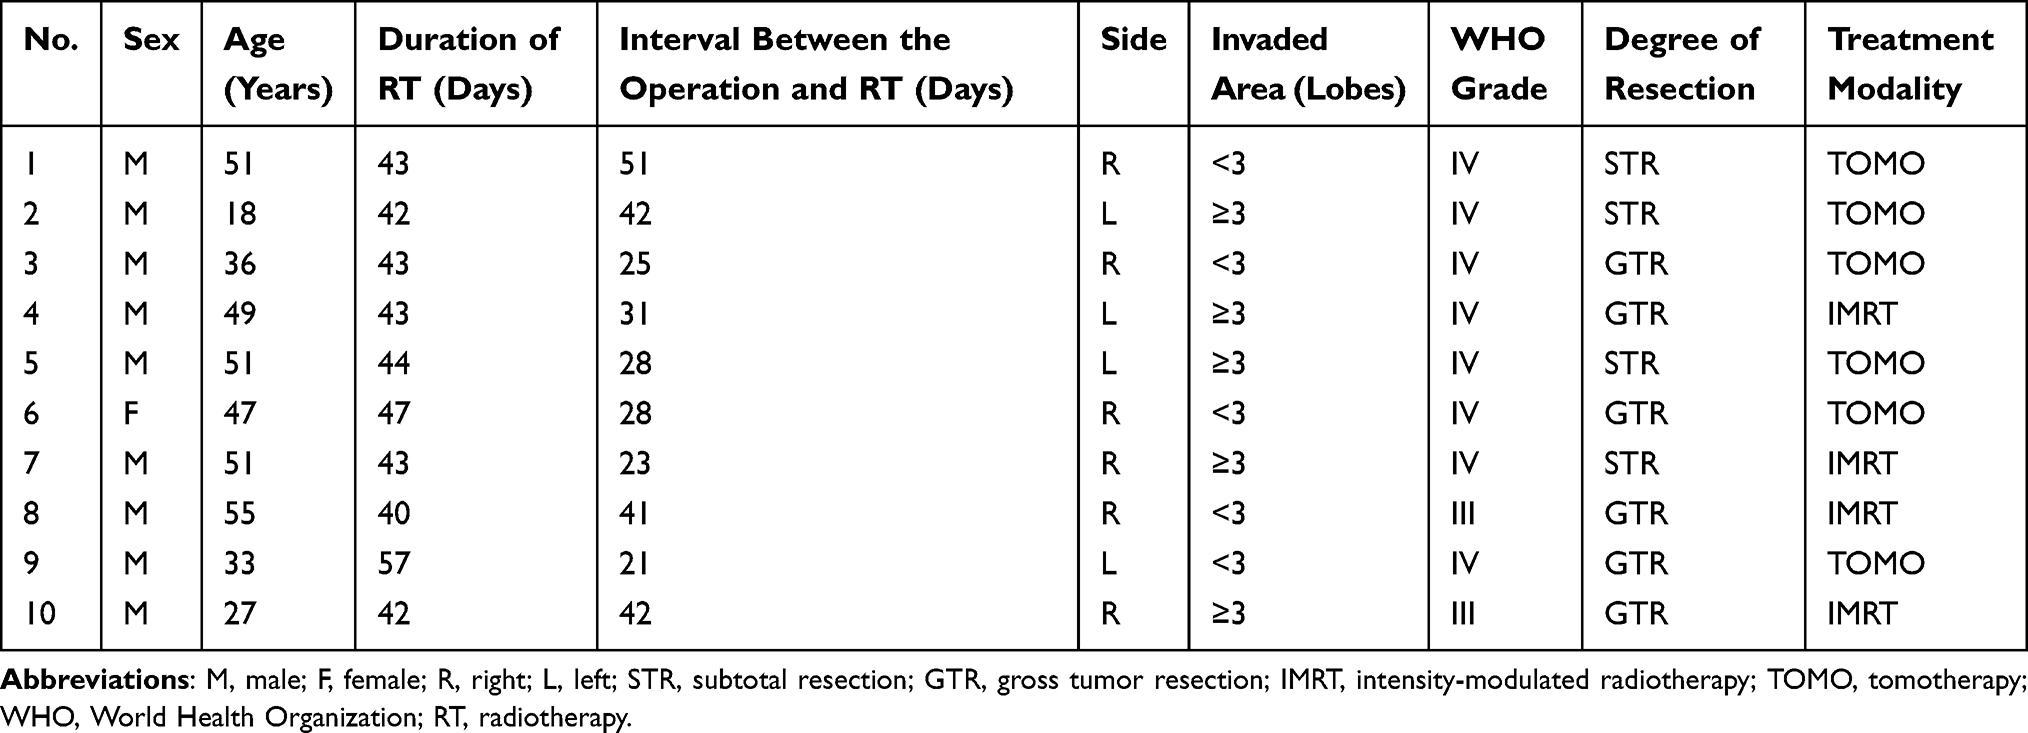 |
Table 2 Clinical Data |
Changes in Target Volume
A comparison of plan2 with plan1 revealed that the GTV, GTVtb, CTV and PTV decreased by 17.06%, 24.16%, 10.80% and 8.76% on average, respectively, while the GTVr increased by 10.30%. A comparison of plan3 with plan1 revealed that the GTV, GTVtb, CTV and PTV decreased by 22.40%, 31.96%, 14.40% and 12.13% on average, respectively, while the GTVr increased by 14.56%. A comparison of plan4 with plan1 revealed that the GTV, GTVtb, CTV and PTV decreased by 20.50%, 35.29%, 14.92% and 14.49% on average, respectively, while the GTVr increased by 36.54%. There was a statistically significant difference in the GTV, GTVtb, CTV and PTV before and at the end of RT (P<0.05), as shown in Table 3. The changes in the GTV, CTV and PTV of patient No. 10 based on plan1, plan2 and plan3 are shown in Figure 1.
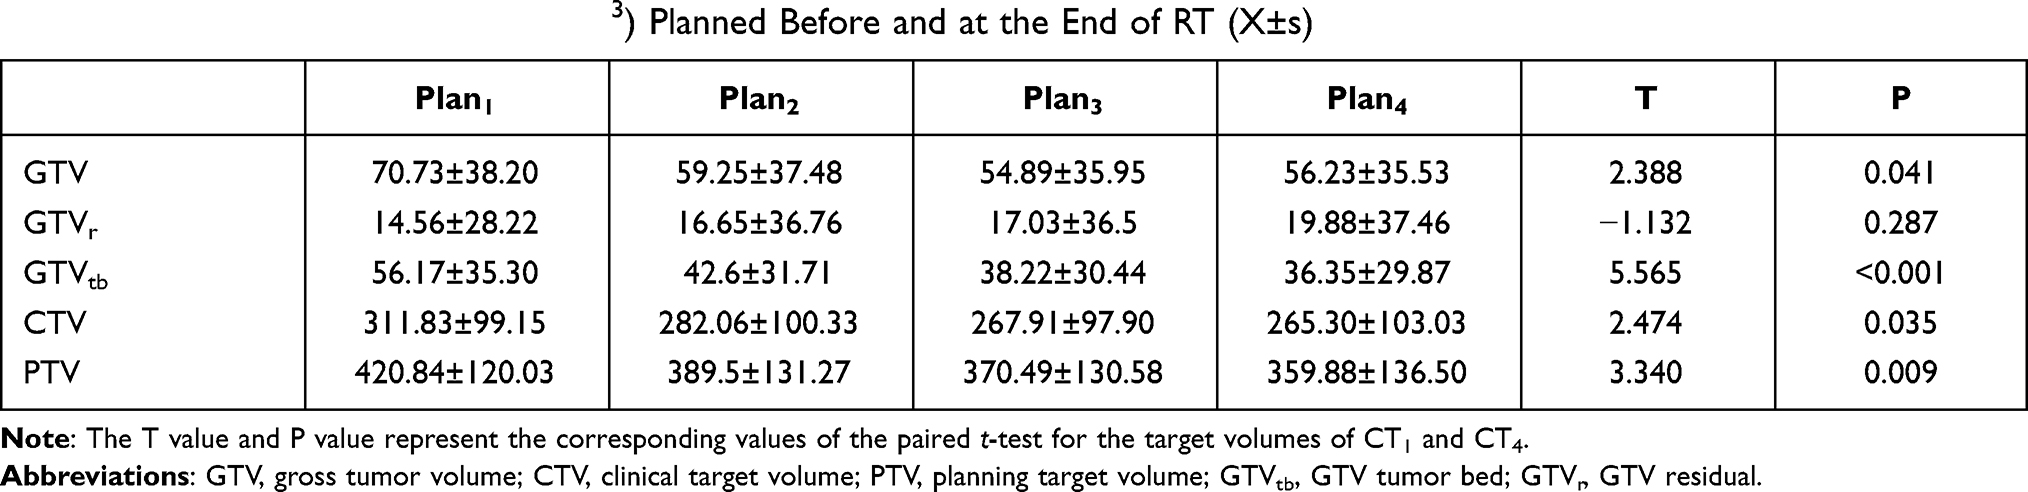 |
Table 3 Changes in Target Volume (cm3) Planned Before and at the End of RT (X±s) |
 |
Figure 1 Target volumes on MRI1, MRI2 and MRI3 are displayed in (A–C), respectively. The GTV, CTV and PTV are shown as red, green and blue solid lines, respectively. Abbreviations: MRI1, before RT; MRI2, during 10-fraction RT; MRI3, during 20-fraction RT; GTV, gross tumor volume; CTV, clinical target volume; PTV, planning target volume; RT, radiotherapy. |
Comparison of Dosimetric PTV Data Between the Adaptive and Projection Plans
Compared with projection plan1–2 and plan1–3, the mean value of the near maximum dose (D2) to the PTV in adaptive plan10+20 and plan20+10 was reduced by 1.74% and 2.39%, respectively, showing statistical significance (P<0.05). There was no statistically significant difference in the dose received by 95% of the PTV (D95) and volume of the PTV receiving 110% of the prescribed dose (V110) to the PTV between projection plan1–2 and plan1–3 and adaptive plan10+20 and plan20+10 (P > 0.05), as shown in Table 4. The distribution of the dose delivered to patient No. 10 in plan1, plan10+20, plan1–2, plan20+10, and plan1–3 is shown in Figure 2.
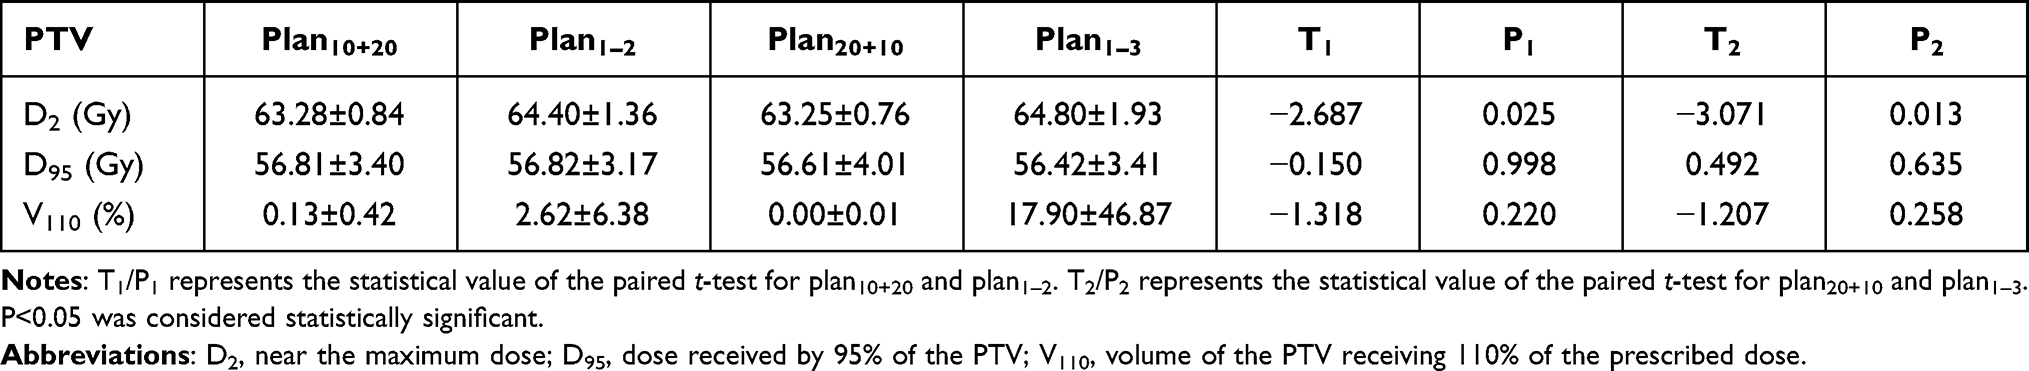 |
Table 4 Comparison of Dosimetric PTV Data Between the Adaptive and Projection Plans |
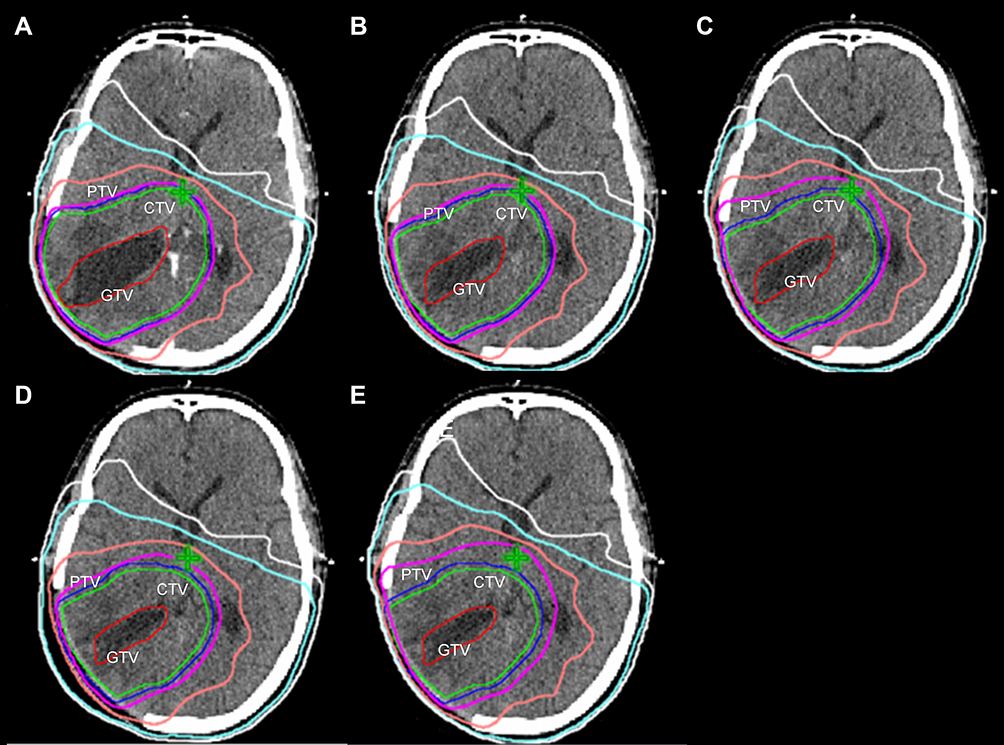 |
Figure 2 Dose distributions according to plan1, plan10+20, plan1–2, plan20+10 and plan1–3 (initial RT plan1, plan sum of the 10-fraction RT doses of plan1 and the 20-fraction RT doses of plan2, projection plan of initial plan1 to CT2, plan sum of the 20-fraction RT dose of plan1 and the 10-fraction RT dose of plan3, and projection plan of initial plan1 to CT3, respectively) are shown in (A–E), respectively. Isodose levels of 60, 48 30 and 20 Gy are shown as magenta, pink, cyan and white solid lines, respectively. Abbreviations: plan1, initial RT plan; plan2, RT plan in 10 fraction; plan3, RT plan in 20 fraction; RT, radiotherapy; CT2, during 10-fraction RT; CT3, during 20-fraction RT; GTV, gross tumor volume; CTV, clinical target volume; PTV, planning target volume. |
Comparison of Dosimetric OAR Data Between the Adaptive and Projection Plans
Compared with projection plan1–2, the D2/mean dose (Dmean) to the brain stem, pituitary, and optic chiasm, as well as V20, V30, V40 and V50 to normal brain tissue in adaptive plan10+20, was significantly reduced by 6.38%, 5.54%, 9.57%, 5.76%, 6.69%, 4.12%, 4.71%, 7.34%, 14.60% and 24.07%, respectively (P<0.05). Compared with projection plan1–3, the values of D2/Dmean to the brain stem, pituitary and optic chiasm, D2 to the contralateral optic nerve, and V20, V30, V40 and V50 to normal brain tissue in adaptive plan20+10 were significantly reduced by 5.56%, 5.42%, 6.75%, 4.58%, 4.99%, 3.83%, 5.93, 4.75%, 7.41%, 11.66% and 14.86%, respectively (P<0.05). For the D2/Dmean to both the contralateral and ipsilateral lenses and Dmean to the ipsilateral optic nerve, there were no differences between the adaptive and projection plans, as shown in Table 5.
 |
Table 5 Comparison of Dosimetric OAR Data Between the Adaptive and Projection Plans |
Changes in the Conformity Index (CI) and Homogeneity Index (HI) of the PTV Between the Adaptive and Projection Plans
In the equation CI=(VT,ref/VT)*(VT,ref/Vref), VT is the target volume, Vref is the total volume enclosed by the reference isodose line and VT,ref is the target volume enclosed by the reference isodose line. The greater the CI is, the better the conformity.18 In this study, 95% of the prescribed dose (ie, 57 Gy) was taken as the reference isodose line. HI=D5/D95 indicated the ratio of the irradiated dose to 5% of the target volume to the irradiated dose to 95% of the target volume. The closer the HI is to 1, the better the homogeneity.19
Compared with plan1–2, the CI to the PTV in plan10+20 increased by 11.76%, while the HI was reduced by 1.77%, showing statistical significance (P<0.05). Compared with plan1–3, the CI to the PTV in plan20+10 increased by 9.23%, while the HI was reduced by 4.35%, showing statistical significance (P<0.05) (Table 6).
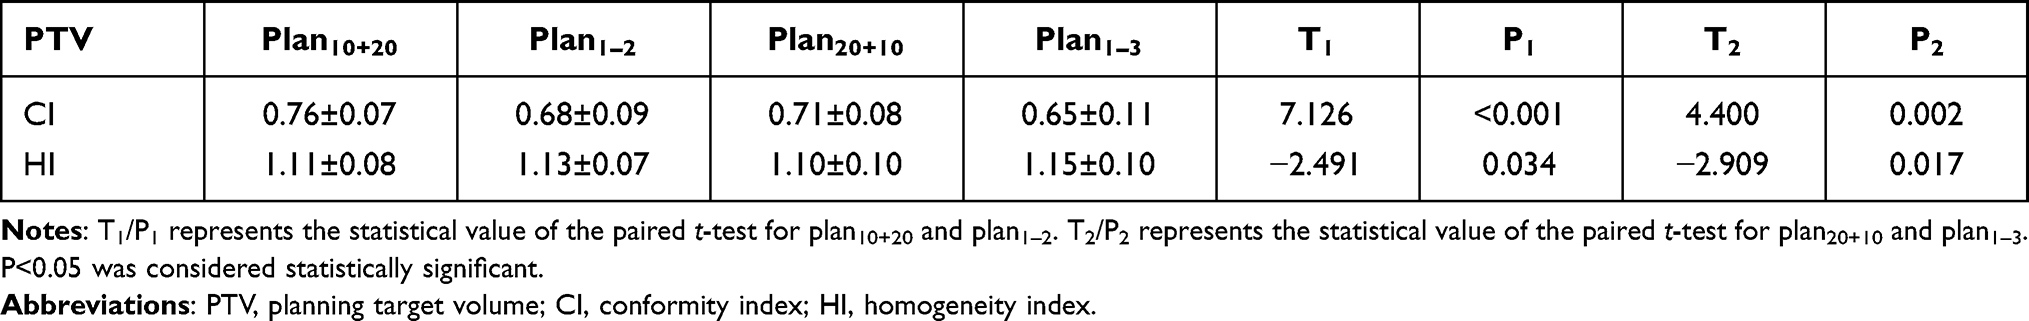 |
Table 6 Comparison of the CI and HI of the PTV Between the Adaptive and Projection Plans |
Timing for ART
Compared with plan20+10, in plan10+20, the values of D2, D95 and V110 to the PTV increased by 0.05%, 0.35% and 0.13%, respectively, while the D2/Dmean to the brain stem, pituitary, and optic chiasma, as well as the V20, V30, V40 and V50 to normal brain tissues, were reduced by 2.70%, 1.73%, 4.57%, 1.82%, 2.37%, 1.62%, 5.08%, 8.54%, 11.43% and 18.66%, respectively, corresponding to a significant reduction in the D2 to the pituitary and optic chiasm as well as the V20, V30, V40 and V50 to normal brain tissues (P<0.05). Compared with plan20+10, in plan10+20, the CI to the PTV increased by 7.04%, showing statistical significance (P<0.05), while the HI to the PTV increased by 0.91%, indicating no statistical significance (P>0.05) (see Table 7).
 |
Table 7 Comparison of Dosimetric Parameters of the Target Volume and OARs Between Adaptive Plan10+20 and Plan20+10 |
The TCP of the PTV in plan10+20 was higher than that in plan20+10 (0.77±0.32 vs 0.73±0.33, P<0.05), while the NTCP of the brain stem, optic chiasm, ipsilateral optic nerve and normal brain tissue in plan10+20 was lower than that in plan20+10, without statistical significance (P > 0.05). The NTCP of the contralateral and ipsilateral lens was almost equal between plan10+20 and plan20+10 (P > 0.05). The NTCP of the contralateral optic nerve in plan10+20 was higher than that in plan20+10, without statistical significance (P > 0.05) (Table 8).
 |
Table 8 Comparison of Radiobiological Parameters of the Target Volume and OARs Between Adaptive Plan10+20 and Plan20+10 |
Discussion
Some studies have shown that in the process of RT for gliomas, the location, volume and morphology of the target volume and surrounding normal tissues change due to a reduction in the tumor bed/surgical cavity and disease progression. If the initial RT plan before treatment is used continuously during the treatment, missed irradiation of the tumor and irradiation of normal tissues may be increased.
By comparing changes in the GTVpre and GTVmid displayed on the MR images before and during RT for 15 patients with glioblastomas, Manon et al1 found that the location of the GTVmid changed to varying degrees in 12 patients, among whom the GTVmid was beyond CTV1 but did not exceed CTV2 in 8, the GTVmid was beyond CTV2 in 4, and the GTVmid did not overlap with the GTVpre completely but did not exceed CTV1 in 3 patients, all indicating that the location of the GTV changes accordingly during RT and that there may be missed irradiation of the target volume when the location changes dramatically.
After observing CT scans on day 1 after surgery (CT0), on the first day of RT (CT1) and after 5 weeks of RT (CT2) in 19 patients undergoing gross total resection of glioblastomas, the GTV1/CTV1 and GTV2/CTV2 were drawn according to CT1 and CT2, respectively, and Kim et al4 developed radiation plan1 and plan2 accordingly. Their research suggested that the GTV reduction rate was 14.4–51.3% between CT0 and CT1 (median, 29%) and 7.9–71.9% between CT1 and CT2 (median, 34.9%), and the volume of normal brain tissue around the surgical cavity covered by the 95% isodose line in plan2 was much smaller than that in plan1, where the CTV2 of 5 patients exceeded the range covered by the 95% isodose line in plan1, which would result in missed irradiation of the target volume. This result indicated that the GTV decreased to varying degrees during RT and that the location of the GTV changed correspondingly with a reduction in the GTV. The normal brain tissue around the target volume gradually entered the high-dose irradiation area, and the volume of the normal brain tissue exposed to high-dose irradiation increased gradually.
By analyzing the daily MR images of 3 patients with grade IV gliomas during postoperative RT, Mehta et al5 observed that the volume of the surgical cavity was reduced in 3 patients (2 who underwent gross total resection and 1 who underwent subtotal resection) during RT and was gradually stable in 2 of these patients after 20 fractions of RT. The residual GTV (GTVr) of patients undergoing subtotal resection did not change significantly during RT, while the edema volume decreased at the beginning of RT but began to increase with the progression of RT and decreased again after 13 fractions of RT. This study showed that the volume of the surgical cavity tended to decrease during RT.
By comparing changes in the GTV (including the GTVtb and GTVr) displayed on MR images before and at the end of RT in 15 patients with gliomas, Yang et al9 found that the GTVtb shrank significantly while the GTVr did not change significantly during RT and thought that the reduction in the surgical cavity (tumor bed) was the main reason for the decrease in the GTV. They also discovered that the irradiated doses to the OARs and normal brain tissues in the initial RT plan were significantly higher than the replanned doses at the end of RT. Therefore, it is necessary for patients with gliomas to undergo ART during RT.
Our study indicated that decreases in the GTV, CTV and PTV were more significant before 10 fractions of RT than after 20 fractions of RT, while the decreases in the GTV, CTV and PTV slowed dramatically after 20 fractions of RT. The shrinkage of the GTV and corresponding target volume was relative to the shrinkage of the GTVtb, which shrank gradually, and the shrinkage of the GTVtb was associated with the interval between the operation and postoperative MRI examination. The GTVtb may shrink quickly during a period of time after surgery; however, over time, when the GTVtb is reduced to a certain size, the rate of GTVtb shrinkage slows. Our research also indicated that the GTV increased gradually during RT, and the mean GTV at the end of RT was slightly higher than the GTV after 20 fractions of RT (56.23±35.53 cm3 vs 54.89±35.95 cm3) based on a comparison of RT replans among different fraction intervals; this result may be associated with a change in the target volume of the blood brain barrier or tumor progression during RT. At the same time, it was found that a reduction in the surgical cavity or tumor bed was the main reason for the decrease in the GTV, CTV and PTV, similar to the conclusion of Yang et al.9
By comparing the dosimetric data of the target volume and OARs between projection plan1–2 and adaptive plan10+20, as well as between projection plan1–3 and adaptive plan20+10, it was determined that ART was not obviously superior to projection RT for increasing the irradiated dose to the target volume, but it could increase the precision of irradiation and reduce the irradiated dose to the OARs to a certain extent.
As the cognitive impairment caused by RT in most cases generally occurs a few years later, ART has obvious advantages in patients with low-grade gliomas. Patients with low-grade gliomas have a median survival duration of 10 years and can survive for even longer time periods.20–22 ART can reduce the sequelae of RT and improve the quality of life of these patients. However, for patients with glioblastomas, the 5-year survival rate of those receiving postoperative RT with synchronous and adjuvant 6-cycle TMZ chemotherapy is only 9.8%.23 Therefore, regarding cognitive function, patients with lower-grade gliomas can benefit more from ART than patients with higher-grade glioblastomas. The study from Tsien et al24 indicated that IMRT with an escalated dose could improve the survival of glioblastoma patients. The PTV1 (GTV+1.5 cm) received 60 Gy/30 fractions, and the PTV2 (residual tumor or surgical cavity) received 66–81 Gy using simultaneous integrated boosts with concurrent and adjuvant TMZ chemotherapy. The median overall survival (OS) and progression-free survival (PFS) durations were 20.1 and 9.0 months, respectively, which was superior to the results of Stupp’s protocol.23 ART improved the irradiation precision of the PTV in high-grade gliomas and reduced the radiation dose to the OARs and normal brain tissue. If ART is used to escalate the radiation dose to the GTV in glioblastoma after a standard dose was given, it may improve patient prognosis. Whether ART can increase the local control rate of high-grade gliomas and reduce radiation toxicity to the OARs and normal brain tissue should be further studied.
ART is also beneficial to some glioma patients who have disease progression during RT, which leads to a corresponding increase in the GTV during RT compared with the GTV in the original RT plan. By comparing the changes in GTVpre (GTV before RT) and GTVmid (GTV during 3 weeks of RT) in 19 patients with high-grade gliomas, Tsien et al2 observed that GTVmid decreased in 14 patients (including 2 with a reduction rate of over 50%), did not change significantly in 2, and increased in 3. Similarly, by comparing the changes in GTV displayed on the MRI before postoperative RT and during 5 weeks of RT for 15 patients with high-grade gliomas, Shukla et al3 found that 12 patients had decreased GTV (median, 54.85 cm3), 4 of whom had decreased GTV by more than 50% and 3 of whom had increased GTV (median, 14 cm3). The above two studies showed that the GTV of some patients with high-grade gliomas increased by varying degrees during radiotherapy. The increase in GTV during radiotherapy may be due to the true progression or pseudoprogression of the tumor. Pseudoprogression is related to the therapeutic effect of radiotherapy and chemotherapy, but not the real tumor progression. With the application of synchronous and adjuvant chemotherapy using TMZ, the incidence of pseudoprogression increases, especially in patients with methylguanine methyltransferase (MGMT) promoter methylation. The neuroimaging of pseudoprogression showed localized blood brain barrier disruption, T1 contrast enhancement, a mass effect and strong T2 or FLAIR signals of peritumoral vasogenic edema on MRI images.25 When the GTV increases to a certain extent, the PTV in the original plan cannot cover the changed PTV; if RT is completed according to the original plan, the probability of tumor recurrence may increase. Therefore, for patients with progressive disease, MRI can be used repeatedly during RT to evaluate the GTV. If the GTV increases dramatically, it is necessary to modify the RT plan.
Regarding modifications of the planned time points, we found that compared with plan20+10, the D2, D95 and V110 to the PTV increased to varying degrees, while the D2/Dmean to the brain stem, pituitary, and optic chiasm, as well as the V20, V30, V40 and V50 to normal brain tissues, were reduced to varying degrees, and the CI to the PTV increased in plan10+20. The decreases in D2 to the pituitary and optic chiasm, as well as V20, V30, V40 and V50 to normal brain tissues, together with the CI to the PTV, were statistically significant (P<0.05). Therefore, we conclude that the irradiated dose to the target volume can be increased slightly in plan10+20, showing no statistical significance. Regarding the increased precision of RT and reduced irradiated dose to some OARs and normal brain tissue, plan10+20 was significantly superior to plan20+10.
Furthermore, our results demonstrated that the value of the TCP in plan10+20 was higher than that in plan20+10 (0.77±0.32 vs 0.73±0.33, P<0.05), showing that the RT plan modified after 10 fractions of RT was more appropriate than that modified after 20 fractions of RT. MacDonald et al13 suggested that the TCP for high-grade gliomas treated with IMRT was as high as 92.57%, which is much higher than that in our study. We adopted the same modified TCP model based on EUD,14 which was derived using Poisson statistics and the linear quadratic (LQ) model. This difference between the value of the TCP in our study and MacDonald’s is related to the PTV. The PTV cone down (PTVcd) in MacDonald’s study ranged from 18.9 cm3 to 383.5 cm3, but we found that the initial mean volume of the PTV was 420.84±120.03 cm3. The patients in our study had a larger PTV than those in MacDonald’s study. In the TCP model, the greater the PTV is, the smaller the TCP value. The NTCP values of the normal brain tissue, brain stem, optic chiasm, contralateral lens and ipsilateral optic nerve in plan10+20 were slightly lower than those in plan20+10, although there was no significant difference. However, these results still show that plan10+20 is more advantageous in terms of the protection of normal tissue.
Finally, there are many limitations to this study. First, only ten patients were enrolled, and the sample size was too small. Second, we performed only simulated CT/MRI after 10, 20 and 30 fractions of RT and concluded that the modified RT plan after 10 rounds of RT was better than that after 20 rounds of RT; however, we did not explore changes in the volume size or RT-irradiated dose to the target volume and OARs at other time points, such as after 15 rounds of RT. Most importantly, our study was carried out only to explore the effect of ART on the size of the target volume and radiation dosimetry and biophysical parameters of the target volume and OARs. The effect of ART on the OS rate and PFS rate of high-grade glioma patients has not yet been investigated. We will focus on this area in the future.
Conclusion
The GTV and PTV in patients with high-grade gliomas decreased with a reduction in the GTVtb accordingly during postoperative RT. By using ART, the precision of the target volume can be improved, the irradiated dose to some OARs can be reduced, and the TCP of the PTV can be increased. We conclude from this study that it is more appropriate to modify the RT plan after 10 fractions of RT than after 20 fractions of RT.
Acknowledgments
This work was funded under the neuro-oncology research project by the Chinese Society of Neuro-Oncology (CNSO-2016-MSD07), the Natural Science Foundation of Hunan Province (2019JJ80015), the Youth Natural Science Foundation of Hunan Province (2018JJ3810) and the Scientific Research Foundation of the Development and Reform Committee of Hunan (2019-412).
Disclosure
The authors report no conflicts of interest in this work.
References
1. Manon R, Hui S, Chinnaiyan P, et al. The impact of mid-treatment MRI on defining boost volumes in the radiation treatment of glioblastoma multiforme. Technol Cancer Res Treat. 2004;3(3):303–307. doi:10.1177/153303460400300308
2. Tsien C, Gomez-Hassan D, Ten Haken RK, et al. Evaluating changes in tumor volume using magnetic resonance imaging during the course of radiotherapy treatment of high-grade gliomas: implications for conformal dose-escalation studies. Int J Radiat Oncol Biol Phys. 2005;62(2):328–332. doi:10.1016/j.ijrobp.2004.10.010
3. Shukla D, Huilgol NG, Trivedi N, Mekala C. T2 weighted MRI in assessment of volume changes during radiotherapy of high grade gliomas. J Cancer Res Ther. 2005;1(4):235–238. doi:10.4103/0973-1482.19601
4. Kim TG, Lim DH. Interfractional variation of radiation target and adaptive radiotherapy for totally resected glioblastoma. J Korean Med Sci. 2013;28(8):1233–1237. doi:10.3346/jkms.2013.28.8.1233
5. Mehta S, Gajjar SR, Padgett KR, et al. Daily tracking of glioblastoma resection cavity, cerebral edema, and tumor volume with MRI-guided radiation therapy. Cureus. 2018;10(3):e2346.
6. Ruben JD, Dally M, Bailey M, Smith R, McLean CA, Fedele P. Cerebral radiation necrosis: incidence, outcomes, and risk factors with emphasis on radiation parameters and chemotherapy. Int J Radiat Oncol Biol Phys. 2006;65(2):499–508. doi:10.1016/j.ijrobp.2005.12.002
7. Keime-Guibert F, Chinot O, Taillandier L, et al. Radiotherapy for glioblastoma in the elderly. N Engl J Med. 2007;356(15):1527–1535. doi:10.1056/NEJMoa065901
8. Yan D, Ziaja E, Jaffray D, et al. The use of adaptive radiation therapy to reduce setup error: a Prospective Clinical Study. Int J Radiat Oncol Biol Phys. 1998;41(3):715–720. doi:10.1016/S0360-3016(97)00567-1
9. Yang Z, Zhang Z, Wang X, et al. Intensity-modulated radiotherapy for gliomas: dosimetriceffects of changes in gross tumor volume on organs at risk and healthy brain tissue. Onco Targets Ther. 2016;9:3545–3554. doi:10.2147/OTT.S100455
10. Louis DN, Perry A, Reifenberger G, et al. The 2016 World Health Organization classification of tumors of the central nervous system: a summary. Acta Neuropathol. 2016;131(6):803–820. doi:10.1007/s00401-016-1545-1
11. Cabrera AR, Kirkpatrick JP, Fiveash JB, et al. Radiation therapy for glioblastoma: executive summary of an American society for radiation oncology evidence-based clinical practice guideline. Pract Radiat Oncol. 2016;6(4):217–225. doi:10.1016/j.prro.2016.03.007
12. Ali AN, Ogunleye T, Hardy CW, Shu HK, Curran WJ, Crocker IR. Improved hippocampal dose with reduced margin radiotherapy for glioblastoma multiforme. Radiat Oncol. 2014;9(1):20. doi:10.1186/1748-717X-9-20
13. MacDonald SM, Ahmad S, Kachris S, et al. Intensity modulated radiation therapy versus three-dimensional conformal radiation therapy for the treatment of high grade glioma: a dosimetric comparison. J Appl Clin Med Phys. 2007;8(2):47–60. doi:10.1120/jacmp.v8i2.2423
14. Niemierko A. Reporting and analyzing dose distributions: a concept of equivalent uniform dose. Med Phys. 1997;24(1):103–110. doi:10.1118/1.598063
15. Lyman JT. Normal tissue complication probabilities: variable dose per fraction. Int J Radiat Oncol Biol Phys. 1992;22(2):247–250. doi:10.1016/0360-3016(92)90040-O
16. Kutcher GJ, Burman C. Calculation of complication probability factors for non-uniform normal tissue irradiation: the effective volume method. Int J Radiat Oncol Biol Phys. 1989;16(6):1623–1630. doi:10.1016/0360-3016(89)90972-3
17. Burman C, Kutcher GJ, Emami B, Goitein M. Fitting of normal tissue tolerance data to an analytic function. Int J Radiat Oncol Biol Phys. 1991;21(1):123–135. doi:10.1016/0360-3016(91)90172-Z
18. Paddick I. A simple scoring ratio to index the conformity of radiosurgical treatment plans. Technical note. J Neurosurg. 2000;93(Suppl 3):219–222. doi:10.3171/jns.2000.93.supplement_3.0219
19. Semenenko VA, Reitz B, Day E, Qi XS, Miften M, Li XA. Evaluation of a commercial biologically based IMRT treatment planning system. Med Phys. 2008;35(12):5851–5860. doi:10.1118/1.3013556
20. Shaw EG, Scheithauer BW, O’Fallon JR. Management of supratentorial low-grade gliomas. Oncology (Williston Park). 1993;7(7):97–104, 107. discussion 108–111. doi:10.1016/1053-4296(91)90006-s
21. Olson JD, Riedel E, DeAngelis LM. Long-term outcome of low-grade oligodendroglioma and mixed glioma. Neurology. 2000;54(7):1442–1448. doi:10.1212/WNL.54.7.1442
22. Pignatti F, van den Bent M, Curran D, et al. Prognostic factors for survival in adult patients with cerebral low-grade glioma. J Clin Oncol. 2002;20(8):2076–2084. doi:10.1200/JCO.2002.08.121
23. Stupp R, Mason WP, van den Bent MJ, et al. Radiotherapy plus concomitant and adjuvant temozolomide for glioblastoma. N Engl J Med. 2005;352(10):987–996. doi:10.1056/NEJMoa043330
24. Tsien CI, Brown D, Normolle D, et al. Concurrent temozolomide and dose-escalated intensity-modulated radiation therapy in newly diagnosed glioblastoma. Clin Cancer Res. 2012;18(1):273–279. doi:10.1158/1078-0432.CCR-11-2073
25. Fink J, Born D, Chamberlain MC. Pseudoprogression: relevance with respect to treatment of high-grade gliomas. Curr Treat Options Oncol. 2011;12(3):240–252. doi:10.1007/s11864-011-0157-1
 © 2021 The Author(s). This work is published and licensed by Dove Medical Press Limited. The
full terms of this license are available at https://www.dovepress.com/terms
and incorporate the Creative Commons Attribution
- Non Commercial (unported, 3.0) License.
By accessing the work you hereby accept the Terms. Non-commercial uses of the work are permitted
without any further permission from Dove Medical Press Limited, provided the work is properly
attributed. For permission for commercial use of this work, please see paragraphs 4.2 and 5 of our Terms.
© 2021 The Author(s). This work is published and licensed by Dove Medical Press Limited. The
full terms of this license are available at https://www.dovepress.com/terms
and incorporate the Creative Commons Attribution
- Non Commercial (unported, 3.0) License.
By accessing the work you hereby accept the Terms. Non-commercial uses of the work are permitted
without any further permission from Dove Medical Press Limited, provided the work is properly
attributed. For permission for commercial use of this work, please see paragraphs 4.2 and 5 of our Terms.