Back to Journals » Cancer Management and Research » Volume 14
Study of KRAS-Related miRNA Expression in Colorectal Cancer
Authors Wu X ![]() , Li Z, Huang N, Li X, Chen R
, Li Z, Huang N, Li X, Chen R
Received 2 April 2022
Accepted for publication 9 October 2022
Published 17 October 2022 Volume 2022:14 Pages 2987—3008
DOI https://doi.org/10.2147/CMAR.S368551
Checked for plagiarism Yes
Review by Single anonymous peer review
Peer reviewer comments 2
Editor who approved publication: Dr Ahmet Emre Eşkazan
Xiaobing Wu,1 Zhifa Li,1 Nanqi Huang,1 Xiaodan Li,2 Rong Chen1
1Gastrointestinal Surgery, The Third Affiliated Hospital of Guangzhou Medical University, Guangzhou, People’s Republic of China; 2Blood Transfusion Department, The Third Affiliated Hospital of Guangzhou Medical University, Guangzhou, People’s Republic of China
Correspondence: Rong Chen, Gastrointestinal Surgery, The Third Affiliated Hospital of the Guangzhou Medical University, NO. 63, Duobao Road, Liwan District, Guangzhou City, Guangdong Province, People’s Republic of China, Tel +8613710886775, Fax +86 02081292182, Email [email protected]
Introduction: Colorectal cancer (CRC) is one of the most common digestive system tumors and seriously threatens the lives of patients. The choice of treatment options and the prognosis of CRC patients are closely related to the KRAS genotype. Notably, microRNAs (miRNAs) have great application value in the diagnosis and treatment of CRC.
Methods: The current study used qRT–PCR to analyze the expression of KRAS-targeting miRNAs and determine the correlation between miRNA expression and KRAS gene expression among patients with varying genotypes. The effect of the KRAS gene on the prognosis of patients with cancer was determined.
Results: Eighty-two differentially expressed miRNAs were identified between CRC tumor and normal tissues: 58 dysregulated miRNAs were identified in patients with KRAS mutations, and 62 aberrantly expressed miRNAs were detected in patients with wild-type KRAS. Thirteen miRNAs were abnormally expressed in KRAS-mutant patients compared with KRAS wild-type patients. Some miRNAs not only acted as biomarkers for CRC but also indicated the genotype of KRAS.
Conclusion: This finding is very important for patients who must choose from clinical treatment options based on KRAS results. Thus, the abnormal expression of miRNAs has great application potential for the selection of chemotherapy regimens for patients with cancer. The relationship between differential miRNA expression and the KRAS genotype is very important for studying related mechanisms in CRC.
Keywords: colorectal, KRAS, microRNAs, biomarker
Introduction
Colorectal cancer (CRC) is one of the leading causes of cancer-related death worldwide.1 Although the mortality rate of early CRC has been reduced by the screening and removal of premalignant lesions, the overall survival (OS) of advanced CRC patients presenting with metastases and chemoresistance is still very poor.2 RAS proteins are GTPases that participate in signaling pathways by regulating cell proliferation and cell survival and are often mutated in cancer patients. Human RAS genes, including Kirsten RAS (KRAS), neuroblastoma RAS (NRAS) and Harvey RAS, play an important role in GTPase activity.3 However, different isoforms of the RAS protein are associated with different kinds of cancer. KRAS mutations are common in solid tumors such as CRC, lung cancer and pancreatic cancer.4
Clinical studies have shown that compared with wild-type KRAS patients, CRC patients with KRAS mutations have worse outcomes in terms of distant metastasis, survival time and long-term prognosis.2,5 These findings may partly explain why KRAS mutation drives CRC cell metastasis and invasion by inducing the expression of genes related to invasion and epithelial mesenchymal transformation (EMT).6–8 Although KRAS mutation plays an important role in tumor development and progression, the mechanism of KRAS-mediated transcriptional regulation is still not fully understood. MicroRNAs (miRNAs) are a class of 22–24 nucleotides encoding noncoding RNAs that mediate posttranscriptional regulation by binding to complementary target mRNAs and inducing their degradation or inhibiting their translation.9 An increasing number of studies have shown that gene mutations of transcription regulators are closely related to the dysregulation of miRNAs.10–12 For example, P53 mutation reduces the transcriptional activity of miR-223 and promotes chemoresistance in breast cancer.13 APC mutation leads to downregulation of miR-155 expression and reduces the survival and colony formation ability of CRC cells.14 It is worth noting that KRAS mutation is one of the most common gene mutations in human cancer, especially CRC, and some miRNAs interact directly with mutant KRAS in CRC to exert their effects.15 For example, miR-193a-3p is downregulated in CRC tissues and is significantly related to the occurrence of early CRC.16 The dual-luciferase reporter test showed that miR-193a-3p directly targets the 3’UTR of KRAS mRNA;17 when the expression of miR-193a-3p is upregulated, the translation of KRAS mRNA decreases. MiR-193a-3p significantly inhibits cell proliferation and migration by reducing the expression of KRAS and exerts a tumor-suppressive effect on CRC.16 MiR-224 is differentially expressed in isogeneic KRAS WT and mutant HCT116 cells, and antagomiR-mediated miR-224 silencing in HCT116 KRAS WT cells phenocopies KRAS mutation and increases KRAS activity.18 MiR-143 is downregulated in CRC, and it directly targets the KRAS protein.19,20 Upregulating the expression level of miR-143-3p can inhibit KRAS mRNA and protein expression; in contrast, reducing the expression level of miR-143-3p can significantly increase the expression of KRAS protein.19 MiR-200 and miR-126 are expressed in KRAS-mutant CRC but not in wild-type tumors.21 However, few studies have analyzed the expression of miRNAs that have a targeting relationship with KRAS in CRC. The abnormal expression of some miRNAs is thought to be related to KRAS, but these miRNAs have no targeting relationship with KRAS. For example, although miR-126, mentioned above, is expressed in KRAS-mutant patients, it has no targeting relationship with KRAS.22,23 MiR-31 is highly expressed in CRC, and the progression-free survival (PFS) of metastatic CRC (mCRC) patients expressing wild-type KRAS and high levels of miR-31-3p is significantly shortened, but miR-31 has no targeting relationship with KRAS.24,25 The dysregulated miRNAs and their functions and underlying mechanisms following KRAS mutation have yet to be fully explored. Our study focuses on the miRNA expression profile of CRC after KRAS mutation screening. CRC patients with mutant versus wild-type KRAS have different therapeutic options, and differentially expressed miRNAs could be used to reflect the KRAS genotype to help guide clinical treatment.
Materials and Methods
Patient and Tissue Samples
Fifty tissue specimens, twenty-five cancer tissues, and twenty-five matched adjacent normal mucosal samples (at least 5 cm from the negative surgical margin) were selected from twenty-five patients with CRC who had undergone gastrointestinal resection at the Third Affiliated Hospital of Guangzhou Medical University from June 2010 to October 2012. All patients were included continuously during this period, and the patient demographics and essential patient characteristics are described in Table 1. Ten patients had KRAS mutations, and fifteen patients had wild-type KRAS. The pathological diagnosis and KRAS genotype of each patient were determined by two experienced senior pathologists in the Pathology Department of the Third Affiliated Hospital of Guangzhou Medical University. The 31 pairs of tumor specimens used for the validation experiment were collected from 2015 to 2019 from 16 KRAS wild-type patients and 15 KRAS-mutant patients. All tissues were immediately snap frozen in liquid nitrogen after resection and stored −80°C until the nucleic acids were extracted and tissue diagnosis was performed by two experienced pathologists according to the tumor-node-metastasis (TNM) staging system. No patients were diagnosed with any other primary cancer, and those who had received chemotherapy or radiotherapy before surgery were excluded. Written informed consent was obtained from all the participants, and the study was approved by the Institutional Ethical Board of the Third Affiliated Hospital of Guangzhou Medical University, this study complies with the Declaration of Helsinki. All experiments were performed in accordance with relevant guidelines and regulations.
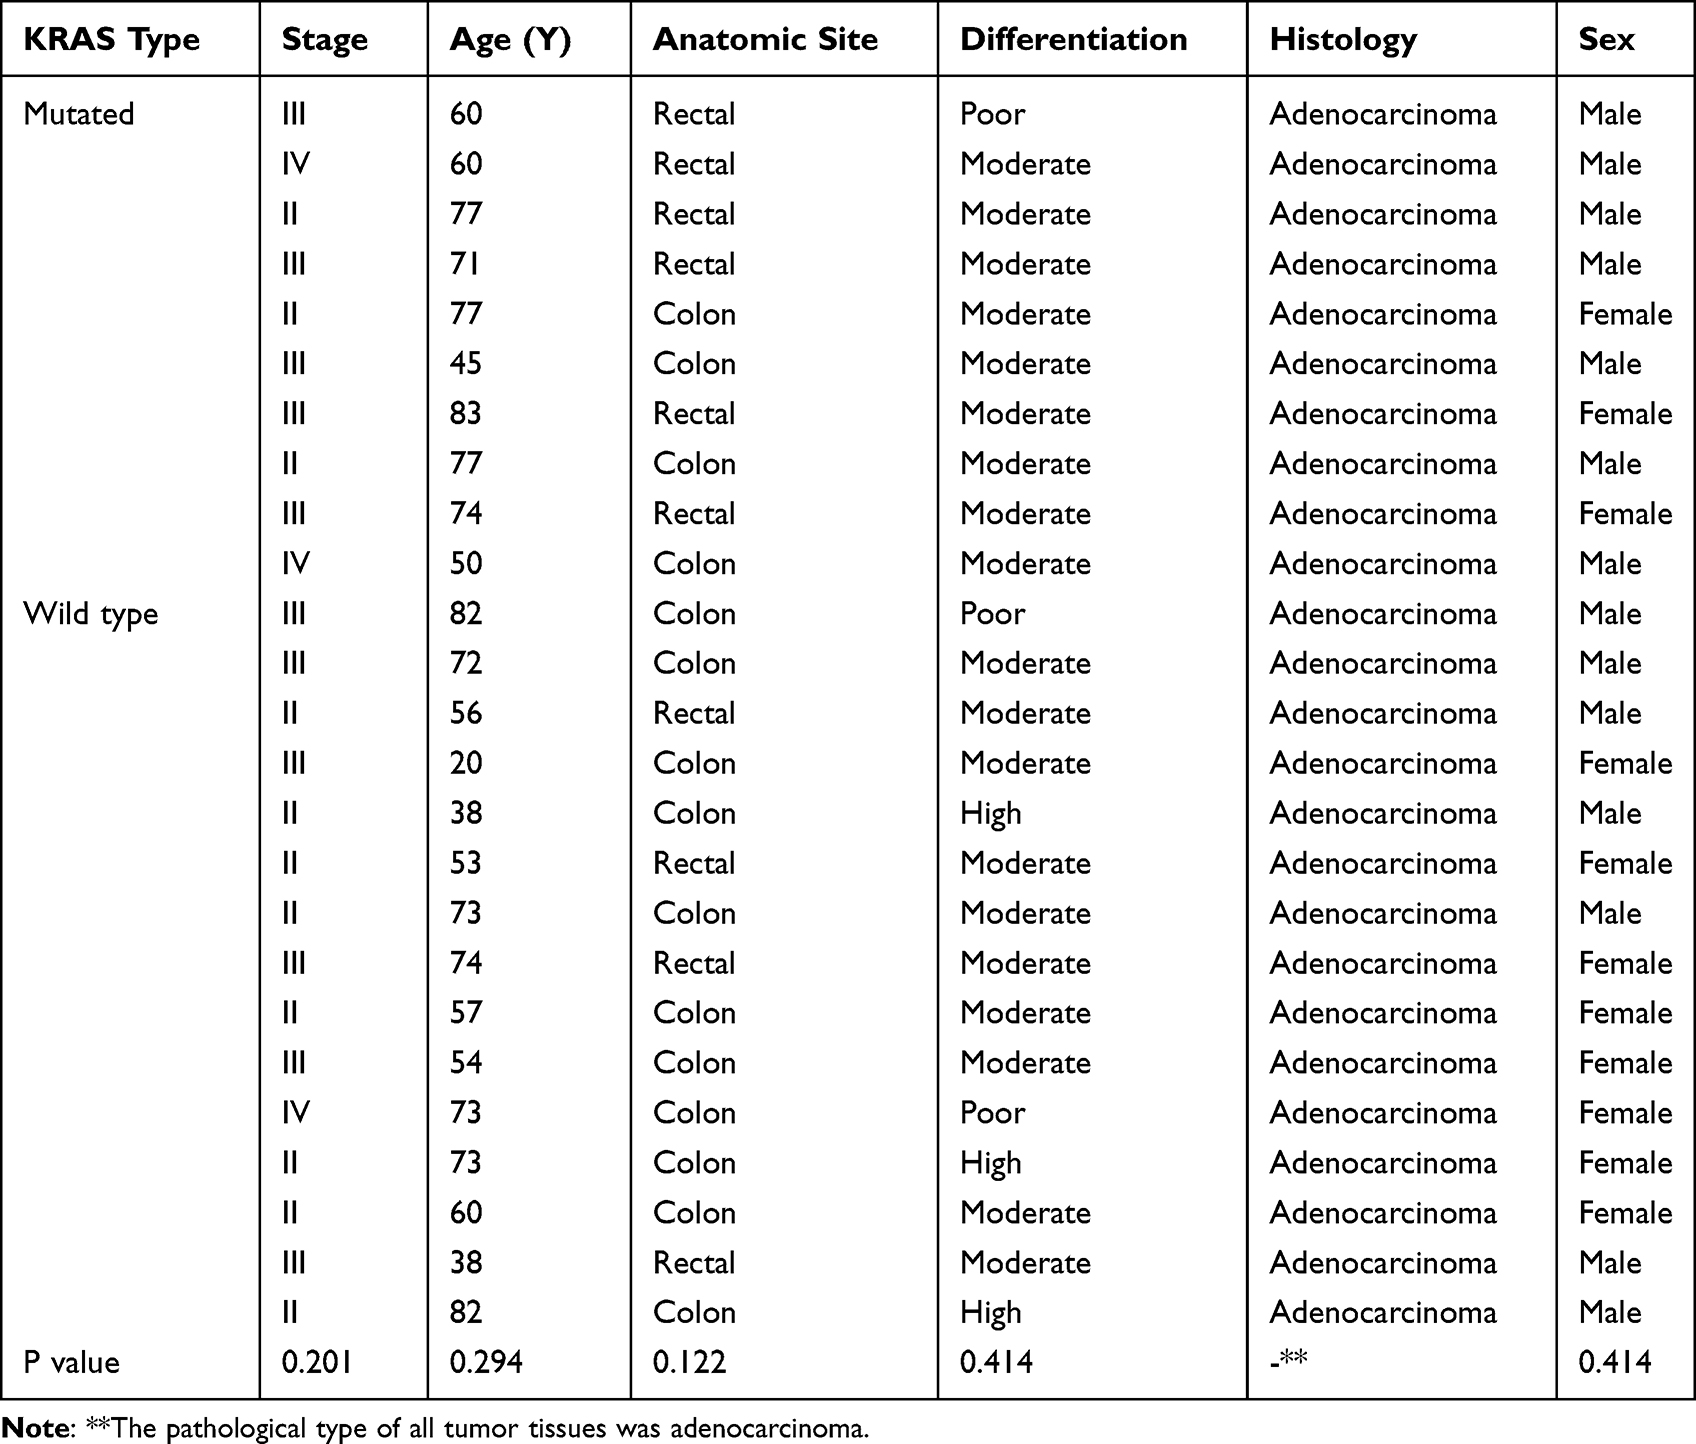 |
Table 1 Clinical and Histopathological Characteristics of Patients |
KRAS Mutational Testing
In this study, KRAS gene detection results were detected by pathology experts in the Department of Pathology. In short, all patients had a pathological diagnosis of primary colorectal tumors. DNA was purified from formalin-fixed samples. According to the human KRAS gene mutation detection kit (Xiamen aide Biomedical Technology Co., Ltd.), mutations in exons 2, 3 and 4 of the KRAS gene in samples were detected by an amplification refractory mutation system (ARMS) and fluorescent PCR technology.
RNA Isolation
Briefly, approximately 100 mg of frozen tissue was homogenized in 1 mL of RNAzol reagent (Molecular Research Center, USA) to isolate miRNAs. Next, 0.4 mL of RNase-free water was added and vortexed for 30s to ensure complete homogenization, and the mixture was then centrifuged at 12,000 g for 15 min to precipitate the DNA/protein after 5–10 min. One milliliter of the supernatant was removed, mixed with 0.4 mL of 75% ethanol, incubated for 10 min, and centrifuged at 12,000 g for 8 min to precipitate the miRNAs. The miRNA supernatant was mixed with isopropanol (0.8 volumes), incubated for 30 min, centrifuged at 12,000 g for 15 min, washed twice with 0.4 mL of 70% isopropanol, and centrifuged at 8000 g for 3 min. Finally, diethylpyrocarbonate-treated water was used to dissolve the miRNAs. The concentration and purity of the miRNAs were measured using electrophoresis and a NanoDrop spectrophotometer (Thermo Scientific, USA). The quality of the miRNAs was considered acceptable if the OD260/OD280 was between 1.7 and 2.0. The integrity of the miRNAs was evaluated by determining the robust amplification of small nuclear ubiquitous RNAs (ie, RNU6b, RNU44, and RNU48) using real-time reverse transcription PCR (qRT–PCR) because they are commonly used as endogenous controls in miRNA studies.
MiRNA Profiling
The Universal RT miRNA PCR system (GeneCopoeia, USA) was used to profile the miRNAs in the two pooled tissue samples (ie, 25 tumors and 25 matched normal controls). The profiling assay consisted of universal reverse transcription (RT) and sequential qRT–PCR amplification with special primers using SYBR Green (GeneCopoeia, USA).
PCR
PCR was performed in a 384-well PCR plate, and each well contained 20 µL of the reaction system, including 1 µL of cDNA templates and 1 µL of gene-specific PCR primers. All reactions were performed in triplicate, and the fold changes in the expression of each miRNA were determined.
Quantification of miRNAs Using qRT–PCR
RT for the miRNA microarray was carried out using the All-in-One First-Strand cDNA Synthesis kit (GeneCopoeia, USA). The experimental steps were described briefly in our previous studies.26,27 The cDNA product of the RT reaction was diluted tenfold and subsequently used as the template for PCR in an Applied Biosystems ViiA 7 Real-Time PCR System (Life Technologies, USA). In this study, as an external reference, MS2 RNA was used to evaluate the quality of the extracted miRNAs, and a combination of RNU6b, RNU44, and RNU48 was utilized as an internal reference for the normalization of miRNA concentrations. In a total volume of 20 µL, the PCR mix contained the following components: 1 µL of template, 2 µL of the PCR forward primer (2 M), 2 µL of the PCR reverse primer (2 M), 10 µL of 2× All-in-one qPCR Mix, 4.8 µL of ddH2O, and 0.2 µL of 50× ROX Reference Dye (for calibration). A master mix that included all the components except for the template was often prepared first. If the total volume of the master mix changed, each component was added in the proper proportion. The conditions of real-time PCR were described previously.26,27 As a method to ensure PCR quality, a preliminary experiment was performed to ensure that the difference in the cycle threshold (CT) value of the MS2 RNA between the two samples was less than 1.0. The expression levels of the miRNAs were quantified using SYBR Green-based All-in-One qPCR Mix (GeneCopoeia, USA).
Statistical Analyses
SPSS 16.0 (SPSS, UK) and GraphPad Prism 5.0 (San Diego, CA, USA) statistical software were used to analyze the data. The relative expression of miRNAs was determined using the 2^(-ΔΔCT) method.28 Unpaired Student’s t-test was used to detect the difference of miRNA expression between different tissues, and receiver operating characteristic (ROC) curves was calculated to evaluate the sensitivity and specificity of miRNA levels in the tissue specimens as diagnostic markers for the detection of colorectal adenocarcinoma and KRAS genotype, and Youden Index was used for the optimal threshold calculation. In the two-tailed test and other statistical test methods, a P value less than 0.05 was considered to indicate statistical significance. Descriptive statistics were used to describe demographic characteristics. The age difference between the two groups was assessed by independent t-test, the sex difference and the difference in tumor anatomical location, as well as the degree of tumor differentiation and tumor stage were assessed by Fisher’s exact test, the parametric method consists of conducting univariate paired tests followed by Bonferroni P value correction (P < 0.05) after quality control. Heatmap production was performed using R statistical software; the heatmap shows 2ΔCt values of each miRNA, so the higher the value is, the lower the expression level [ΔCt=Ct (target miRNA)-Ct (internal reference)]. Since the 2ΔCt values of miRNAs varied greatly, Z score normalization was performed, and survival trends were evaluated using the Kaplan–Meier method. OS was calculated as the time from the first day of treatment to death. If no evidence of disease progression or a new tumor was observed during the last visit to the clinician, the date was confirmed as censored.
Results
Differentially Expressed miRNAs Between Tumors and Adjacent Normal Mucosa
Twenty-five adenocarcinoma samples were subjected to analysis, and 82 dysregulated miRNAs were identified, of which 70 were downregulated and 12 were upregulated (Table 2). Except for miR-150, all of the dysregulated miRNAs, regardless of their upregulation or downregulation status, exhibited a fold change greater than 2. The fold changes in miR-1 and miR-145 expression were greatest (approximately 15-fold). Other miRNAs with fold changes greater than 5 included miR-135b, miR-141, miR-96, miR-137, miR-4770, miR-4510, miR-133a, miR-144*, miR-143, miR-3195, miR-363, miR-451, miR-4469, miR-99a, miR-490-5p, miR-4423-3p, and miR-23b (Table 2 and Figure 1).
 |
Table 2 Differentially Expressed miRNAs Between Tumors and Adjacent Normal Mucosa |
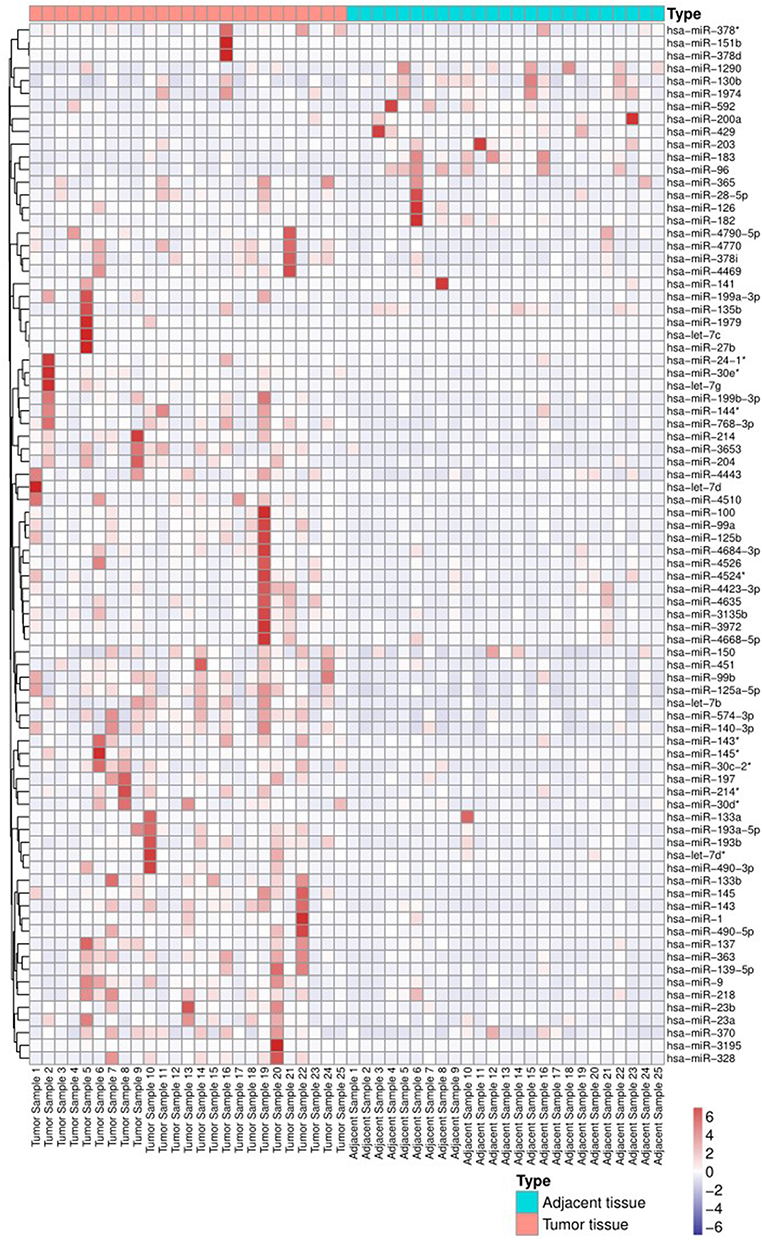 |
Figure 1 Heatmap of miRNA expression between tumor tissues and adjacent tissues. *According to the naming rules of miRNAs29, the two arms of a miRNA precursor (pre-miRNA) may generate a miRNA, in which the miRNA with higher expression level is not followed by any coincidence, and the miRNA with lower expression level is followed by*, such as miR-145 and mir-45*, which indicates that the expression level of mir-145 is higher. |
Abnormal Expression of miRNAs in Tumor Tissues from Patients with KRAS Mutations
All patients were divided into groups according to KRAS mutation status. First, we analyzed the expression of miRNAs in patients with KRAS mutations, and 58 dysregulated miRNAs were identified, all of which exhibited a greater than 2-fold change. Forty of these miRNAs were downregulated, and 18 were upregulated (Table 3 and Figure 2). Of these dysregulated miRNAs, miR-1 and miR-145* were the most altered, and they were downregulated more than 26-fold. Other miRNAs with fold changes greater than 5 included miR-145, miR-137, miR-4703-5p, let-7d, miR-3122, miR-451b, miR-4699-5p, miR-3117, miR-4770, miR-4753-5p, miR-27b, let-7c, miR-9, miR-363, miR-143, miR-4510, miR-99a, miR-214, miR-218, miR-99b, miR-144*, miR-125b, miR-1979, miR-296-3p, miR-3196, miR-203, miR-135b, miR-19a, miR-96, miR-520b, miR-1914, and miR-421 (Table 3).
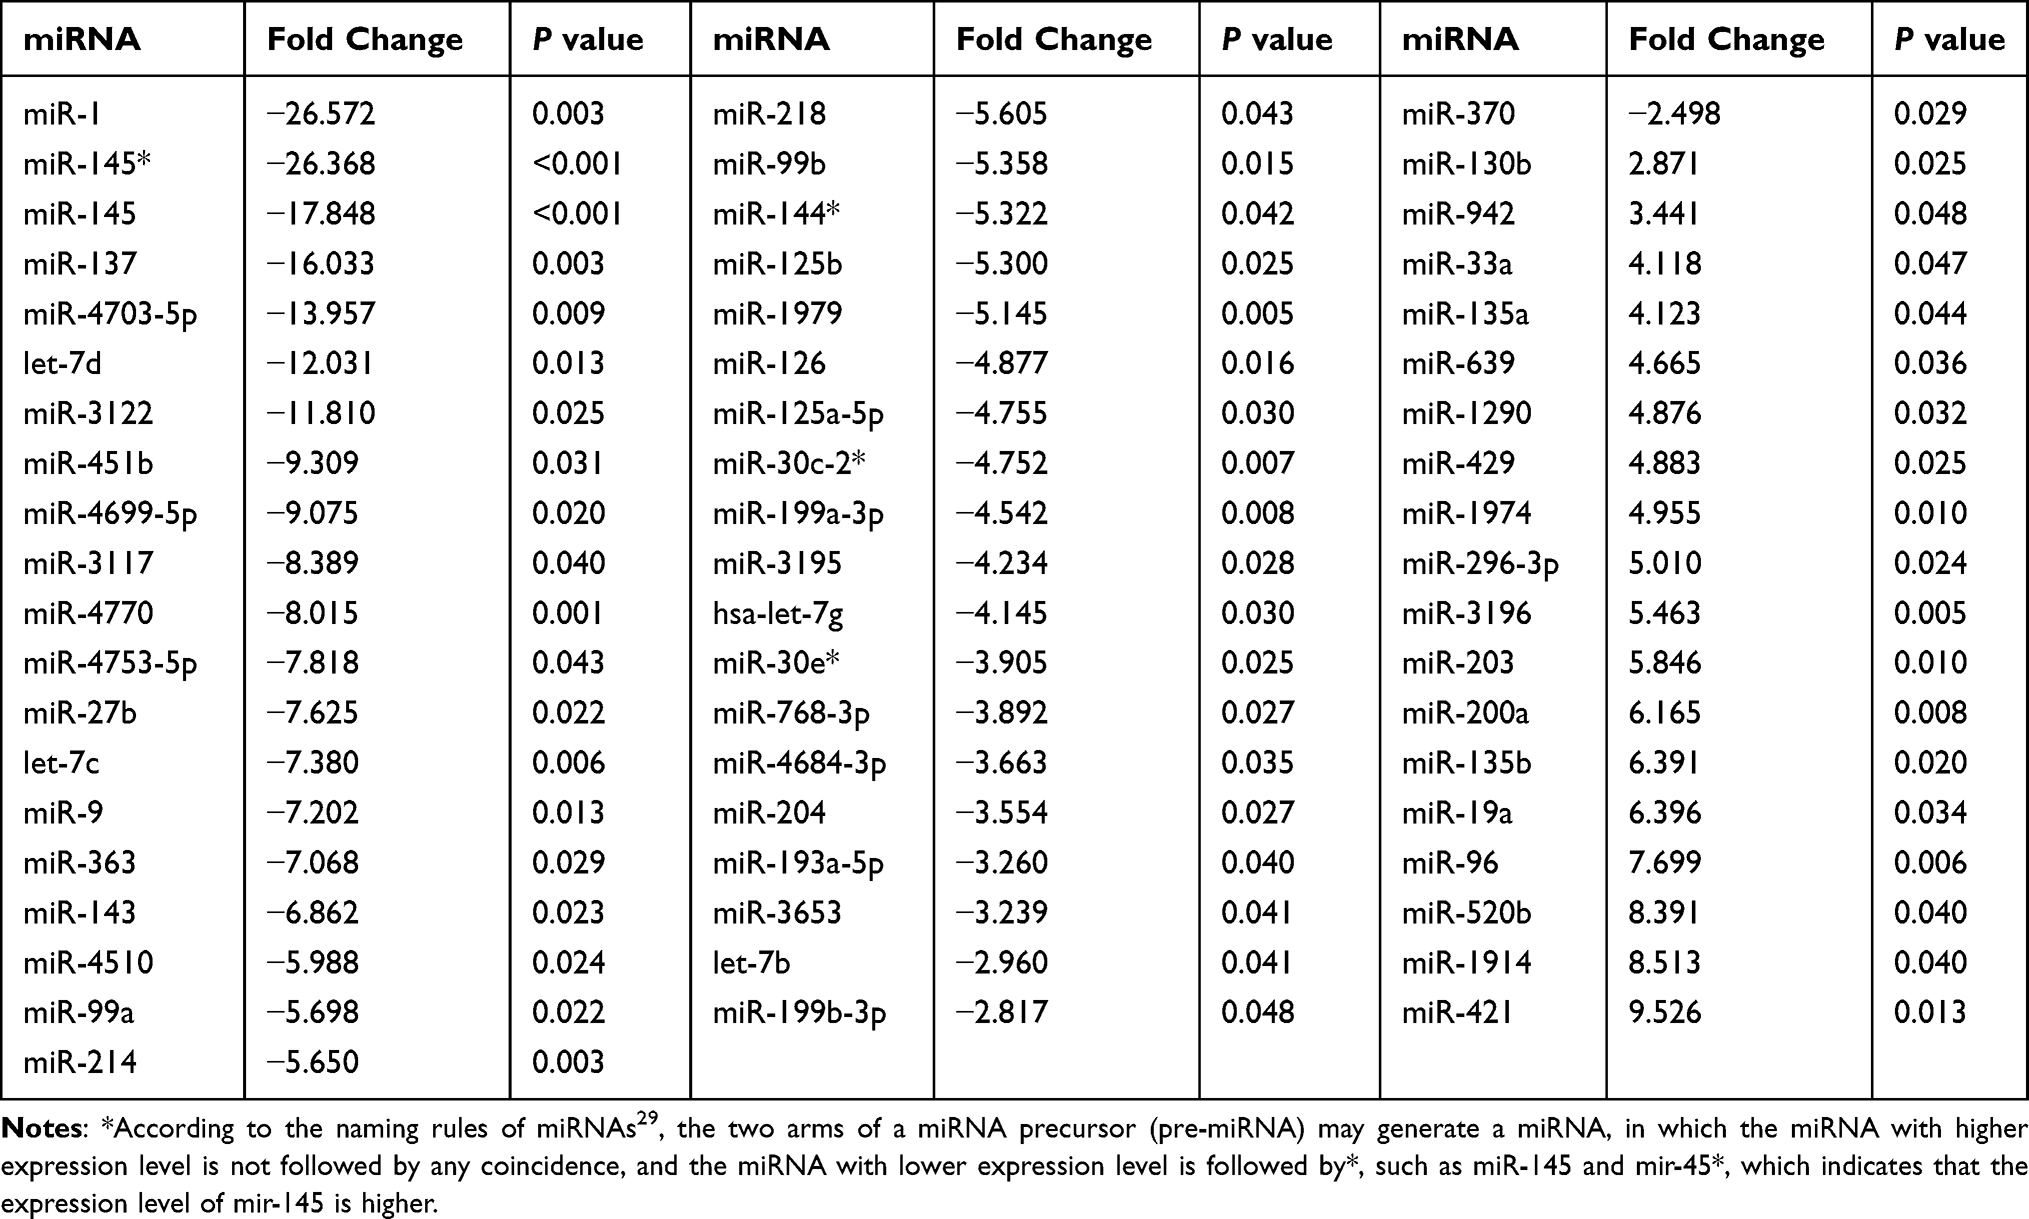 |
Table 3 Abnormal Expression of miRNAs in Tumor Tissues from Patients with KRAS Mutations |
 |
Figure 2 Heatmap of miRNA expression differences between KRAS-mutant tumor tissues and adjacent tissues. |
Aberrant Expression of miRNAs in Tumor Tissues from Patients with Wild-Type KRAS
As mentioned above, the patients were divided into two groups, and we identified miRNAs that were dysregulated in adenocarcinoma tissue from patients with KRAS mutations. Then, we further investigated the expression levels of miRNAs in patients with wild-type KRAS. Sixty-two miRNAs were dysregulated in patients with wild-type KRAS. Six of these miRNAs were upregulated, namely, miR-130b, miR-429, miR-182, miR-135b, miR-96, and miR-141. Fifty-six of these miRNAs were downregulated, and miR-145, miR-1, and miR-490-5p were downregulated more than 10-fold (Table 4 and Figure 3).
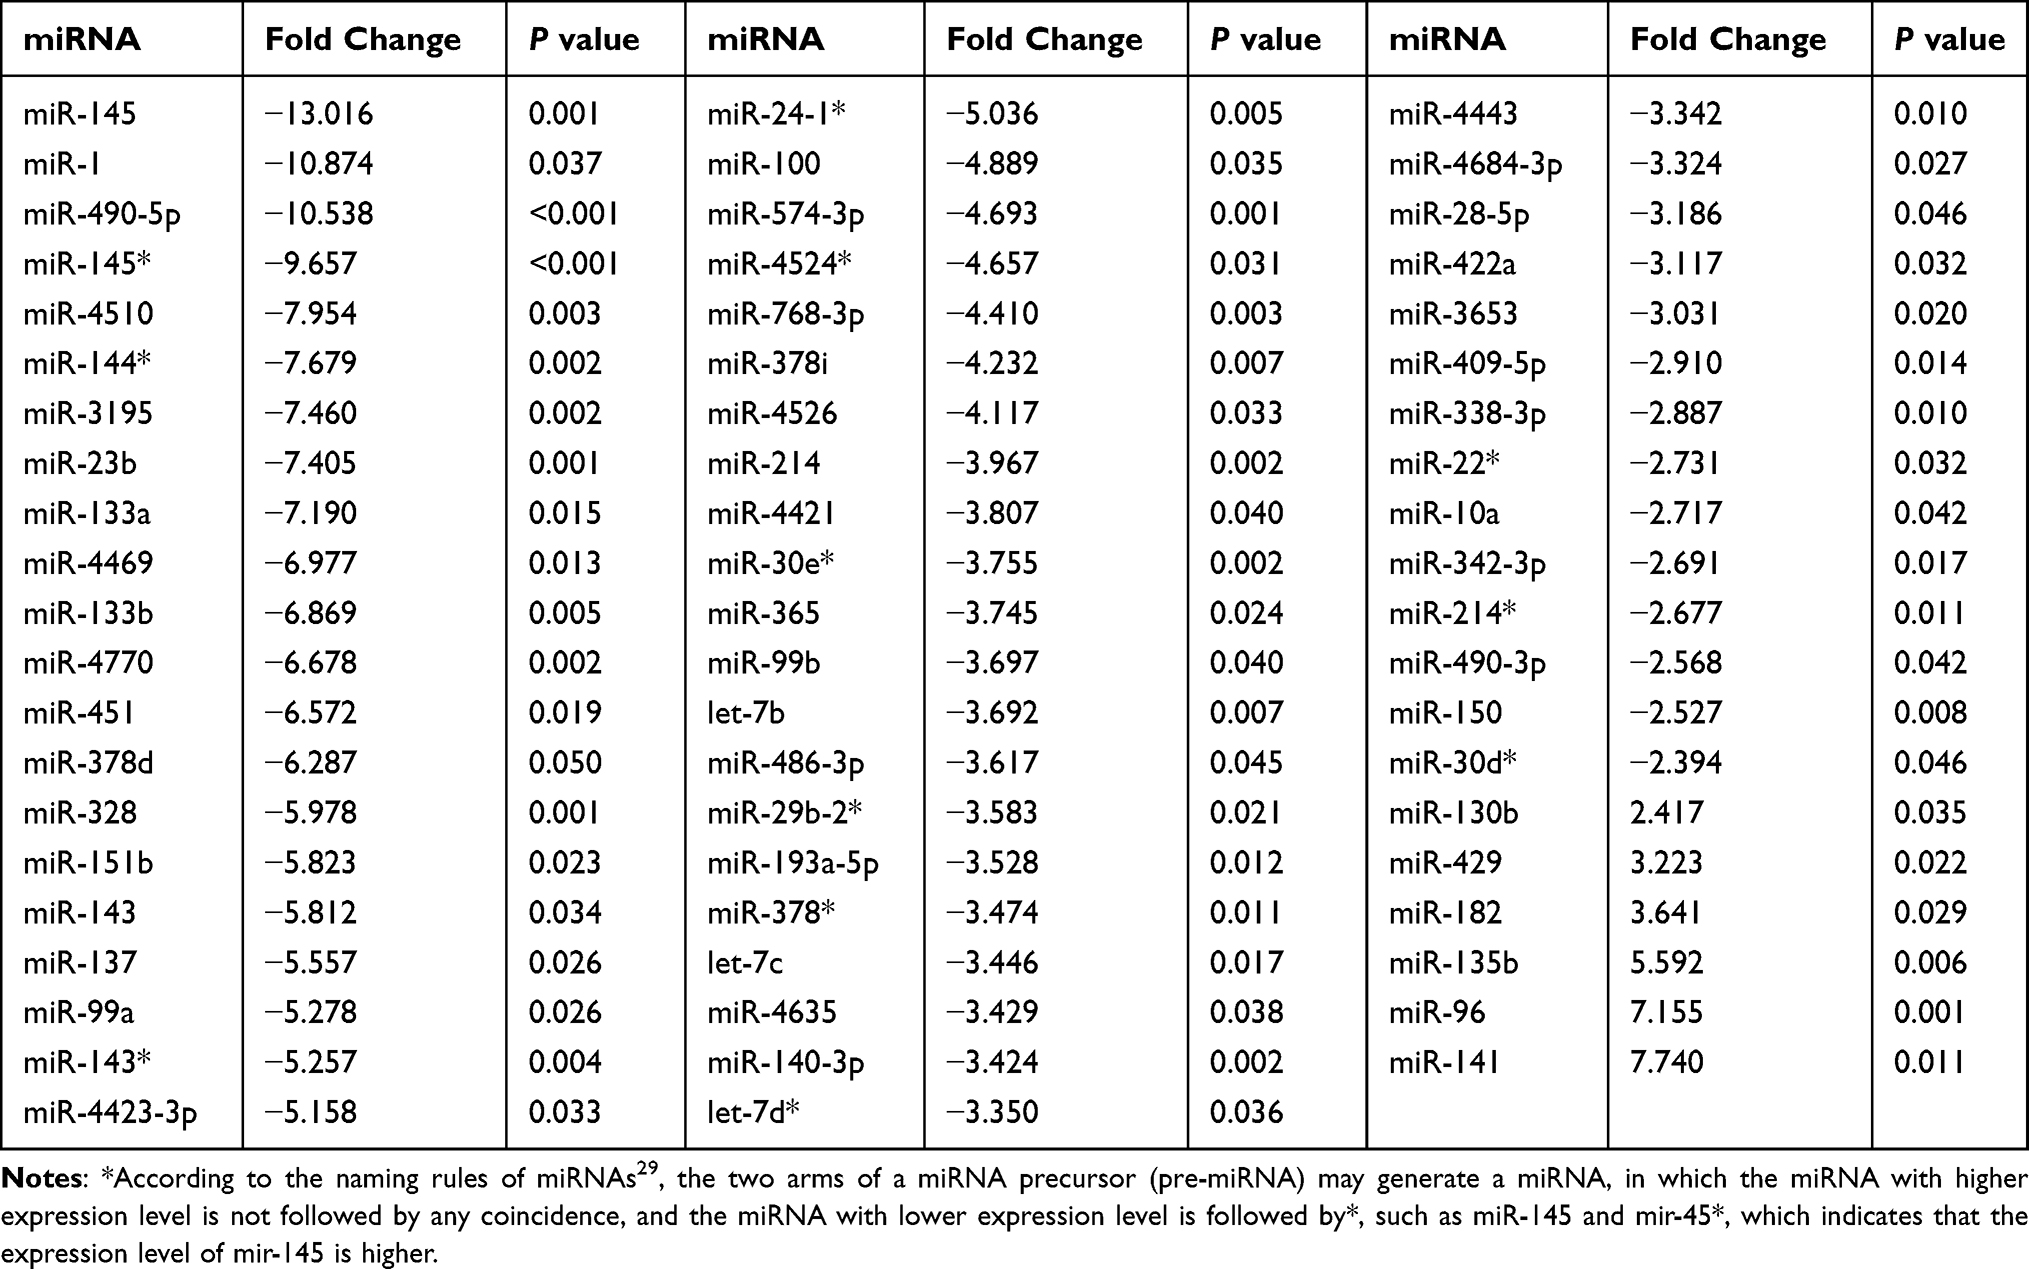 |
Table 4 Aberrant Expression of miRNAs in Tumor Tissues from Patients with the Wild-Type KRAS Genotype |
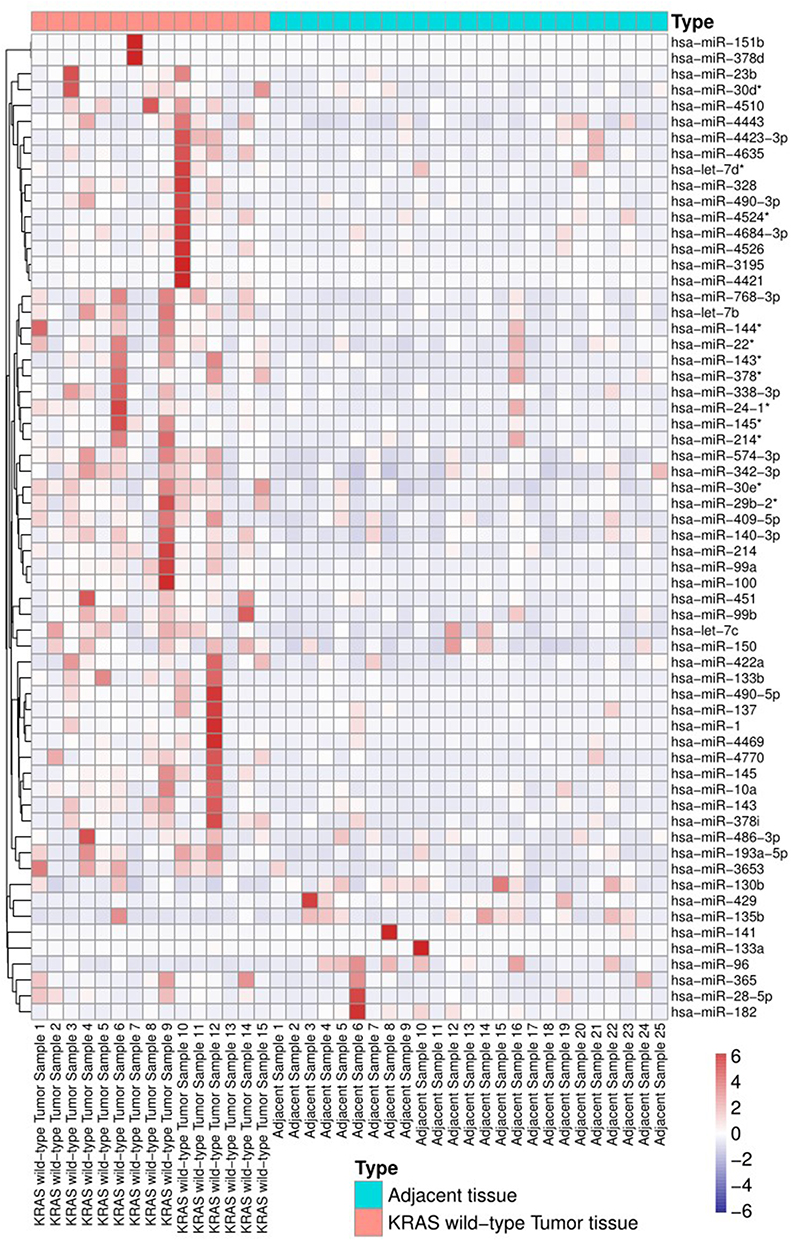 |
Figure 3 Heatmap of miRNA expression differences between KRAS wild-type tumor tissues and adjacent tissues. |
Comparison of the Expression Patterns of miRNAs Between Patients with KRAS Mutations and Patients with Wild-Type KRAS
Furthermore, we investigated the expression patterns of miRNAs between patients with KRAS mutations and patients with wild-type KRAS. Thirteen miRNAs were identified to be differentially expressed, all the miRNAs were upregulated (Table 5 and Figure 4).
 |
Table 5 Comparison of the Expression Patterns of miRNAs Between Patients with KRAS Mutations and Patients with Wild-Type KRAS |
 |
Figure 4 Heatmap of miRNA expression differences between KRAS-mutant tumor tissue and KRAS wild-type tumor tissue. |
MiRNAs That Can Be Used as Biomarkers for Both CRC and the KRAS Genotype
Interestingly, through further analysis, we identified some miRNAs with special significance that can not only diagnose CRC but can also indicate the KRAS genotype (KRAS mutant or KRAS wild-type). First, we focused on miRNAs that were aberrantly expressed not only in CRC but also in patients with wild-type KRAS, and the results revealed 29 miRNAs that were dysregulated in CRC and in patients with wild-type KRAS (Table 6).
 |
Table 6 MiRNAs That Were Aberrantly Expressed Not Only in CRC but Also in Patients with Wild-Type KRAS |
Similarly, some miRNAs were differentially expressed in in CRC but also in patients with KRAS mutations, and the results showed that 19 miRNAs were dysregulated in CRC and in patients with KRAS mutations (Table 7).
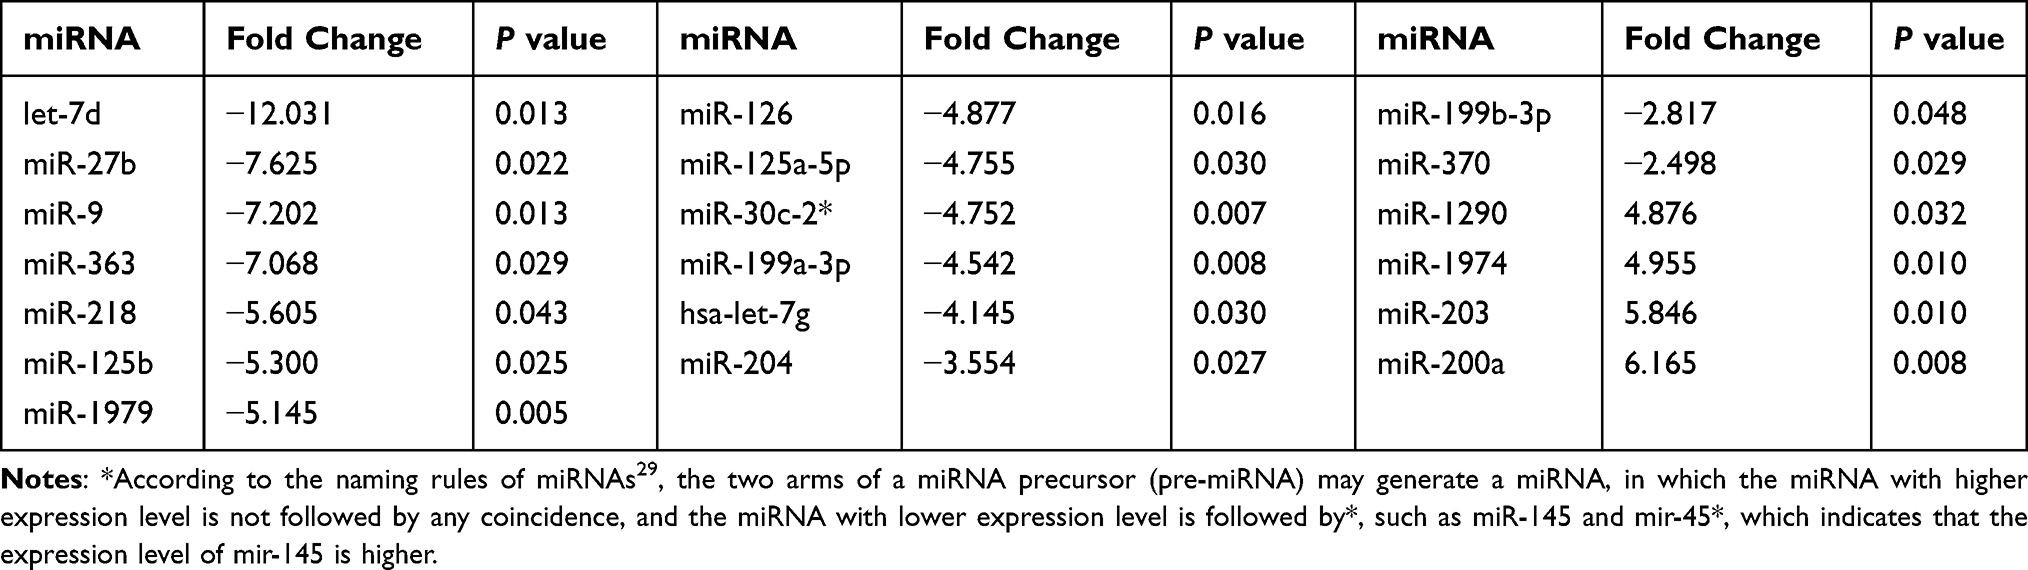 |
Table 7 MiRNAs That Were Aberrantly Expressed Not Only in CRC versus Adjacent Tissues but Also in Patients with versus Without KRAS Mutations |
MiRNAs That Can Be Used Screen for CRC but Not KRAS Status
We also identified some miRNAs that were abnormally expressed in tumor versus adjacent tissues from patients (and thus could be used as diagnostic markers of tumors) but were not significantly differentially expressed according to KRAS status. Thirty-one of these miRNAs were detected: 27 were downregulated, and 4 were upregulated in tumor tissues versus adjacent normal tissues (Table 8).
 |
Table 8 MiRNAs That Can Be Used to Screen for CRC but Not KRAS Status |
MiRNAs That Can Identify KRAS Status but Cannot Be Used to Diagnose CRC
Among these aberrant miRNAs, some were differentially expressed in patients with KRAS mutations, and some were differentially expressed in patients with wild-type KRAS. However, in the total sample set, a significant difference in the expression of these miRNAs was not observed in colon cancer. Twenty miRNAs met this classification, 11 of which were abnormally expressed in patients with KRAS mutations and 9 in patients with wild-type KRAS (Tables 9 and 10).
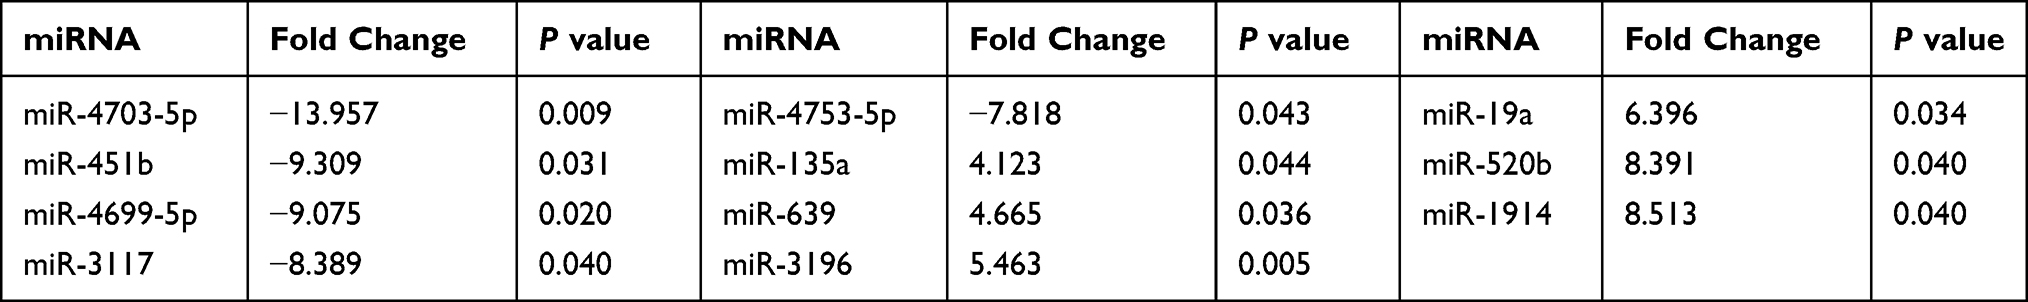 |
Table 9 MiRNAs That Can Indicate Mutant KRAS but Do Not Support CRC Diagnosis |
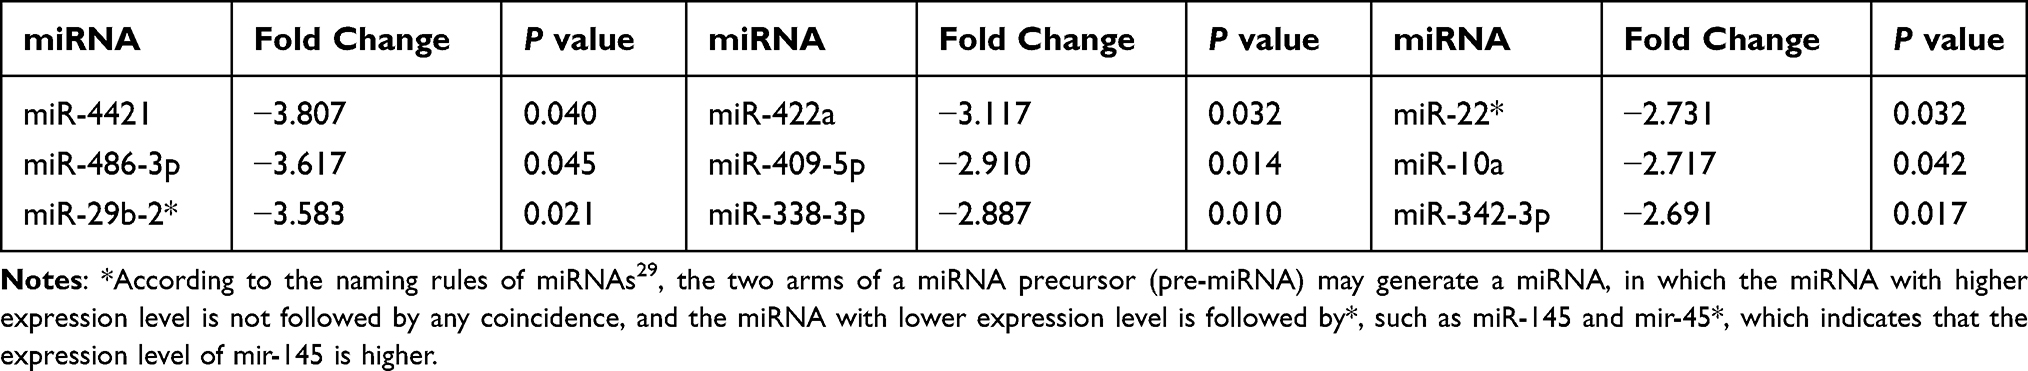 |
Table 10 MiRNAs That Indicate Wild-Type KRAS but Do Not Support CRC Diagnosis |
The Expression of KRAS-Targeting miRNAs in CRC and Tumors with Different KRAS Genotypes
According to bioinformatics analysis using TargetScan, 35 miRNAs exhibit targeting relationships with KRAS (Table 11). However, only 8 miRNAs displayed differential expression in different groups of tumors: miR-4770, miR-143, miR-27b, miR-193b, miR-429, miR-96, miR-181d and miR-19a. Some, such as miR-4770, miR-143, miR-27b, miR-193b, miR-429, and miR-96, were differentially expressed in CRC versus adjacent tissues. Some, such as miR-4770, miR-143, miR-27b, miR-429, miR-96, and miR-19a, were differentially expressed in patients with versus without KRAS mutations. Some, such as miR-4770, miR-143, miR-429, and miR-96, were differentially upregulated in patients with wild-type KRAS; one, namely, miR-181d, was differentially expressed between patients with KRAS-mutant and wild-type KRAS genotypes. Some, such as miR-4770, miR-143, miR-27b, miR-429 and miR-96, were differentially expressed in several different group comparisons (Table 12).
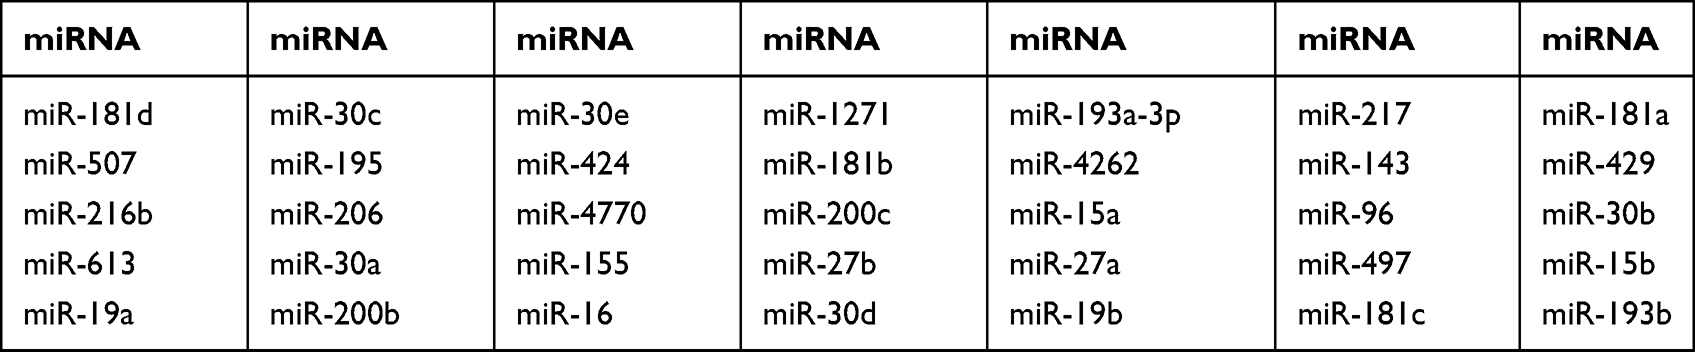 |
Table 11 KRAS-Targeting miRNAs Predicted by TargetScan |
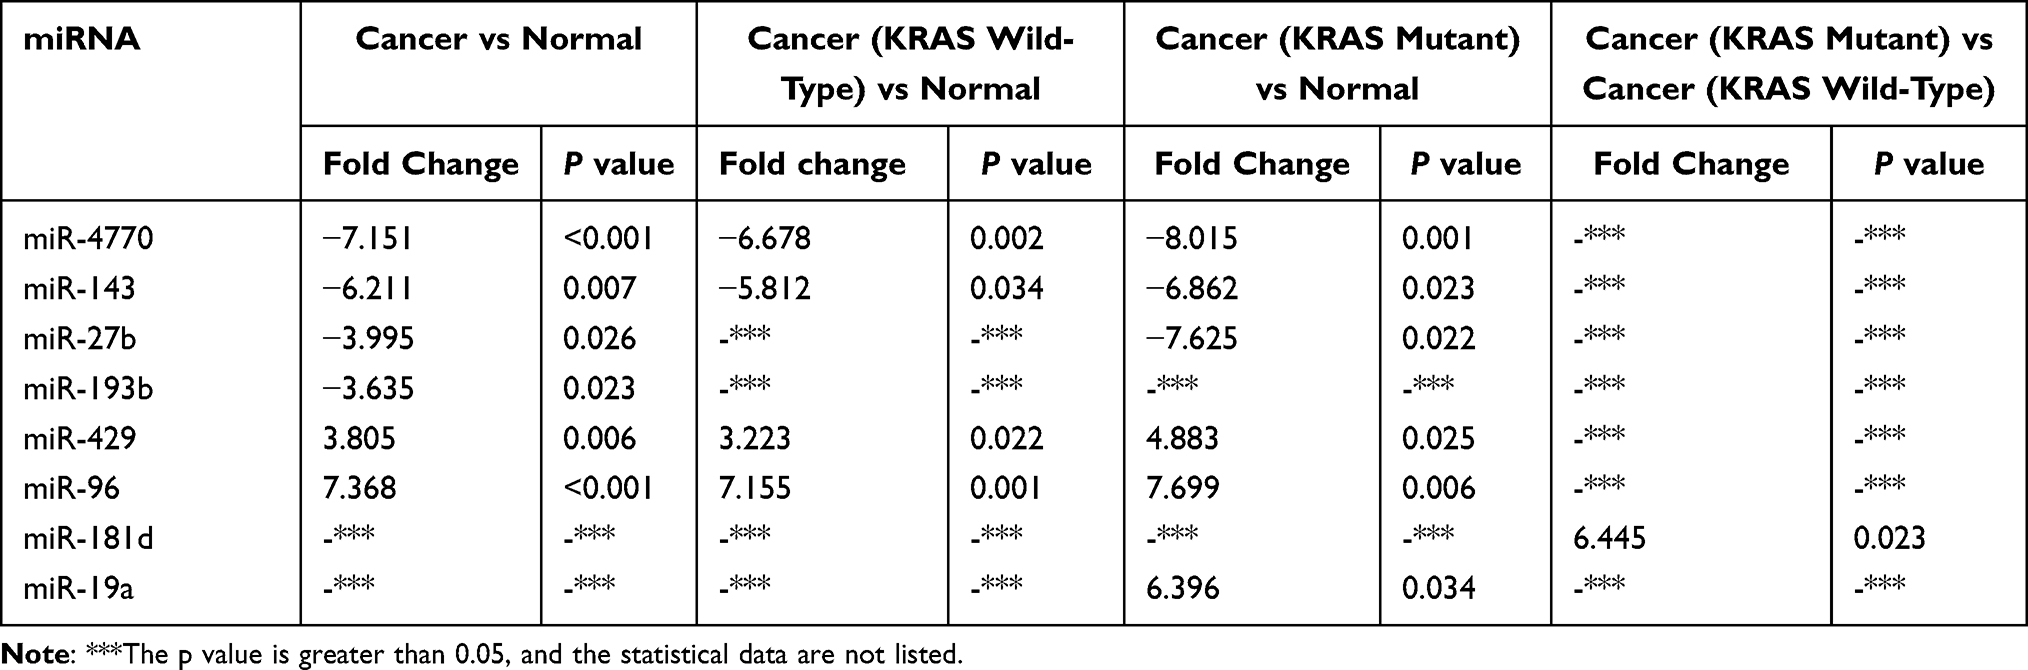 |
Table 12 Expression of KRAS-Targeting miRNAs (Results of Target Gene Prediction Software Crossover) |
The Relationship Between the Expression of miR-181d and KRAS Genotype
According to a comparative analysis, the expression levels of miR-181d in patients with tumors, patients with KRAS mutations and patients with wild-type KRAS were different. The expression level of miR-181d in tumor and normal tissues was basically the same (P > 0.05). The expression level of miR-181d was downregulated by more than 2-fold in KRAS wild-type versus normal tissues, but the difference was not statistically significant (P > 0.05). The expression level of miR-181d was increased more than 3-fold in KRAS-mutant versus normal tissue, but the difference was not significant (P > 0.05). However, compared with that in KRAS wild-type tumor tissue, the expression level of miR-181d in KRAS-mutant tumor tissue was significantly upregulated (more than 6-fold, P = 0.023; Table 13 and Figure 5). The ROC curve analysis showed that miR-181d was a marker for KRAS mutation status with an AUC = 0.713, sensitivity of 70%, and specificity of 73.33% (Figure 6A).
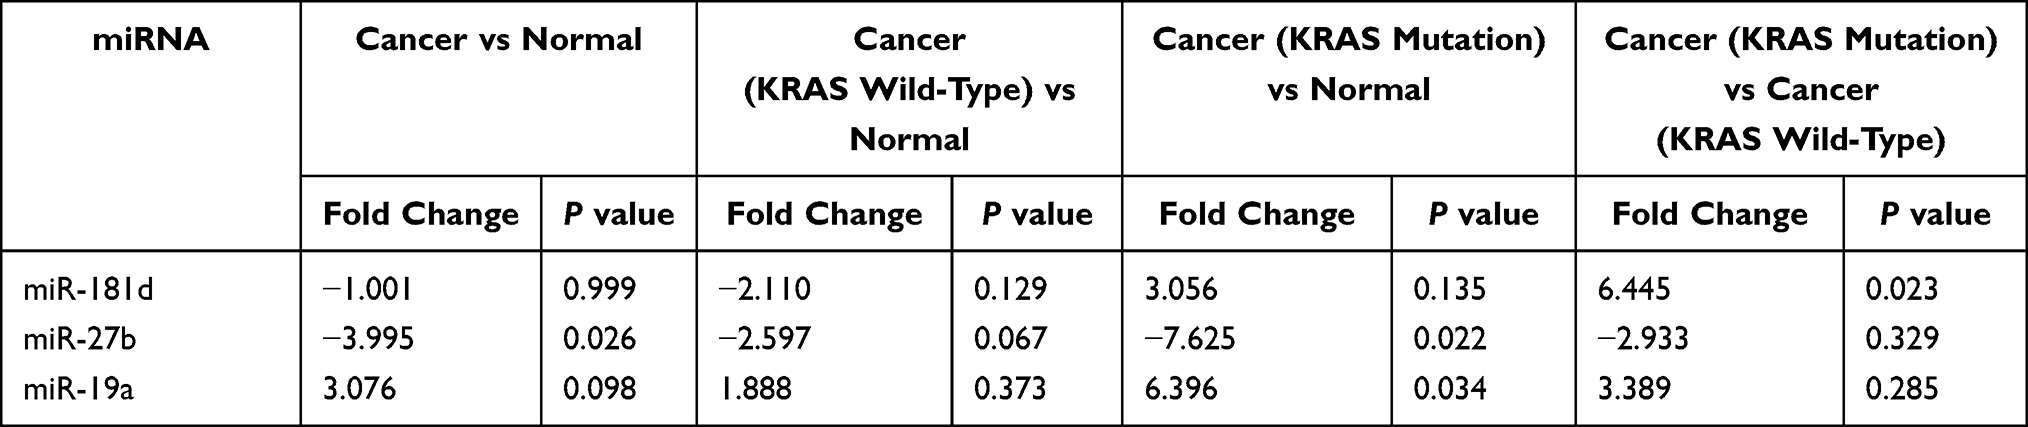 |
Table 13 The Expression of miR-181d, miR-27b and miR-19a in CRC and Patients with Different KRAS Genotypes |
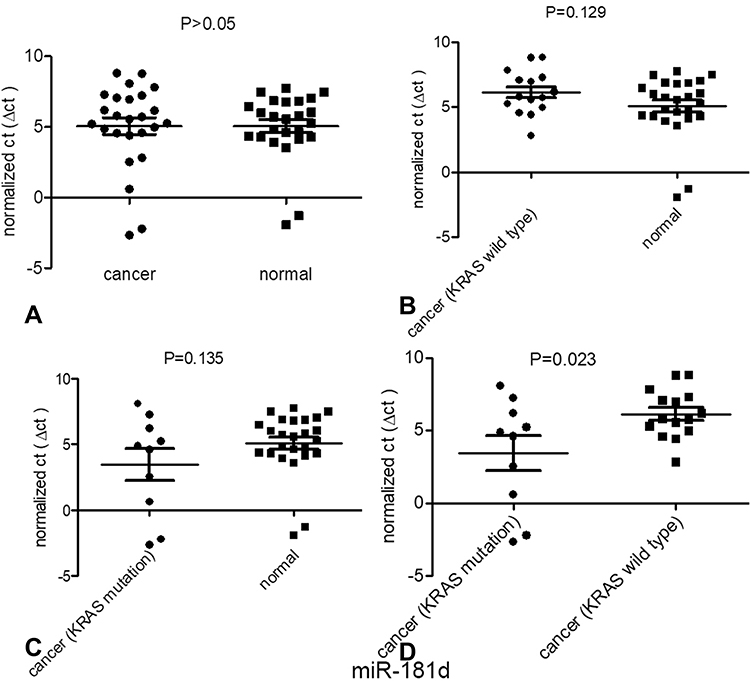 |
Figure 5 Expression of one of the miRNAs targeting KRAS, miR-181d, in patients with different types of CRC. (A) The expression of mir-181d between normal tissues and tumor tissues; (B) The expression of miR-181d between normal tissues and KRAS wild-type tumor tissues; (C) The expression of miR-181d between normal tissues and KRAS mutant tumor tissues;(D) The expression of miR-181d between KRAS wild-type tissue and KRAS mutant tumor tissue. |
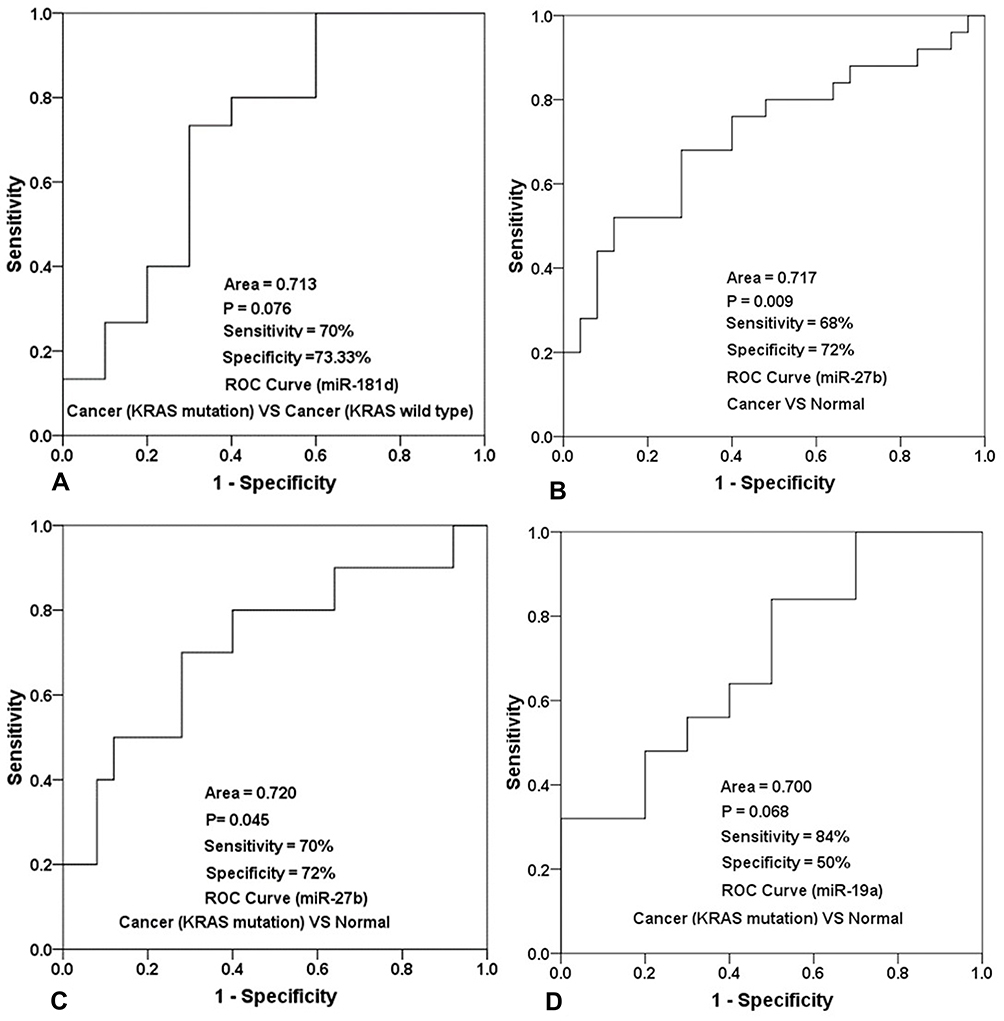 |
Figure 6 ROC curve analysis results and the sensitivity and specificity of miR-181d, miR-27b and miR-19a in the diagnosis of different types of CRC. (A) The sensitivity and specificity of mir-181d in distinguishing KRAS wild-type tumor patients from KRAS mutant tumor patients, and the statistical results of its ROC characteristic curve; (B) The sensitivity and specificity of mir-27b in screening the patients of CRC, and the statistical results of its ROC characteristic curve; (C) The sensitivity and specificity of mir-27b in screening KRAS mutant colorectal cancer patients and normal people, and the statistical results of its ROC characteristic curve; (D) The sensitivity and specificity of mir-19a in screening patients with KRAS mutant colorectal cancer and normal people, and the statistical results of its ROC characteristic curve. |
The Relationship Between the Expression of miR-27b and KRAS Genotype
As shown above, miR-27b has a targeting relationship with KRAS, the expression of miR-27b was significantly different between tumor and normal tissues; the expression level in tumor tissue was approximately 4 times lower (P=0.026). A statistically significant difference in miR-27b expression between KRAS-mutant and KRAS wild-type tumor tissues was not observed. However, compared with that in normal tissues, the expression level in KRAS-mutant tumor tissue decreased by more than 7-fold, and the difference was statistically significant (P=0.022) (Table 13, Figure 7). The ROC curve analysis showed that miR-27b was a diagnostic marker for CRC (AUC = 0.717, sensitivity = 68%, and specificity = 72%) and an indicator of KRAS mutation (AUC = 0.720, sensitivity = 70% and specificity = 72%) (Figure 6B and C).
 |
Figure 7 Expression of one of the miRNAs targeting KRAS, miR-27b, in patients with different types of CRC. (A) The expression of miR-27b between normal tissues and tumor tissues; (B) The expression of miR-27b between normal tissues and KRAS wild-type tumor tissues; (C) The expression of miR-27b between normal tissues and KRAS mutant tumor tissues;(D) The expression of miR-27b between KRAS wild-type tissue and KRAS mutant tumor tissue. |
The Relationship Between the Expression of miR-19a and KRAS Genotype
Similar to the two miRNAs listed above, miR-19a also has a targeting relationship with KRAS. The expression level of miR-19a in KRAS mutant patients versus normal tissues was significantly different and increased by more than 6-fold (P = 0.034) (Table 13 and Figure 8). The ROC curve analysis showed that miR-19a was an indicator of KRAS mutation (AUC = 0.700, sensitivity = 84%, and specificity = 50%) (Figure 6D).
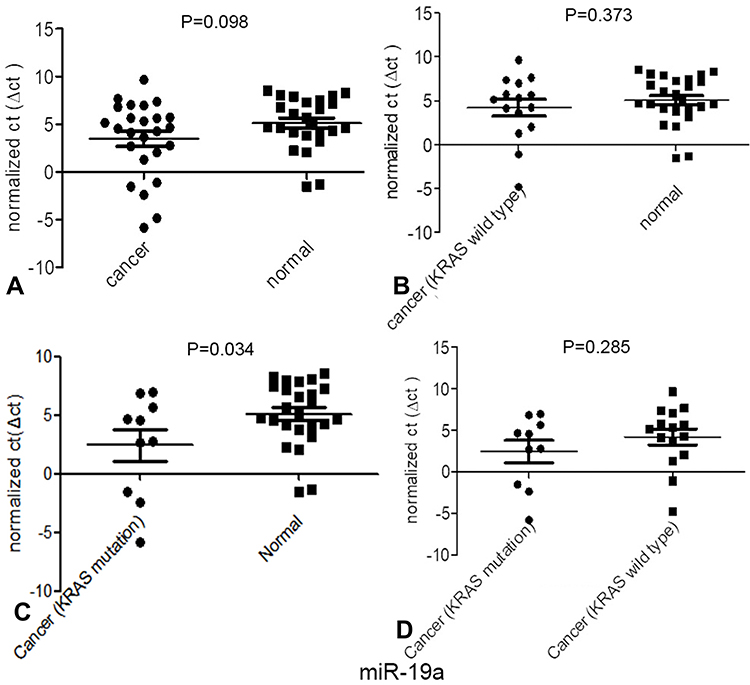 |
Figure 8 Expression of one of the miRNAs targeting KRAS, miR-19a, in patients with different types of CRC. (A) The expression of miR-19a between normal tissues and tumor tissues; (B) The expression of miR-19a between normal tissues and KRAS wild-type tumor tissues; (C) The expression of miR-19a between normal tissues and KRAS mutant tumor tissues; (D) The expression of miR-19a between KRAS wild-type tissue and KRAS mutant tumor tissue. |
Effect of KRAS Mutation on the Prognosis of Patients with Cancer
The Kaplan–Meier analysis revealed shorter survival in patients with CRC presenting KRAS mutations. When the follow up time was set to 5 years as the cutoff point, the average survival time of KRAS wild-type patients was 50.667 months. The average survival time of KRAS-mutant patients was 31.300 months (P=0.014) (Figure 9).
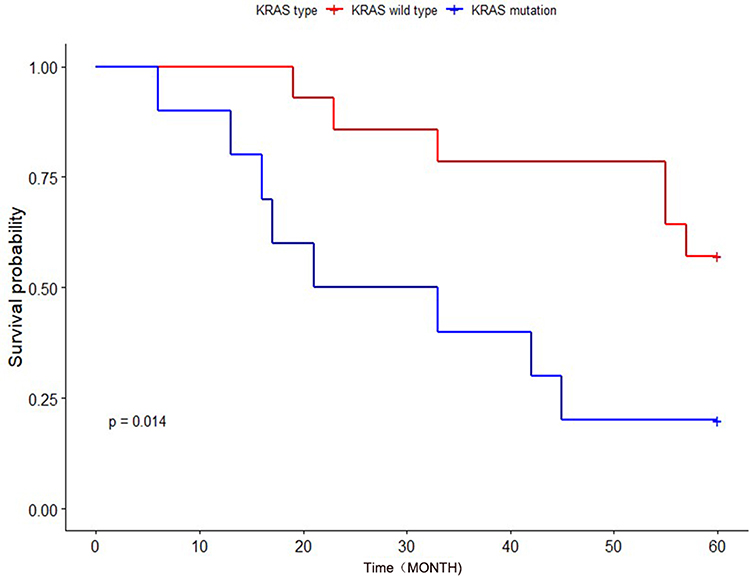 |
Figure 9 The effects of different KRAS genotypes on the survival and prognosis of patients with CRC. |
Validation of miR-27b Expression Levels in Independent Samples
The results showed that the expression level of miR-27b was consistent with the above experimental results. Compared with normal tissues, the expression of miR-27b was downregulated in tumor tissues, p=0.017, and was also downregulated in KRAS-mutant tumor tissues, p=0.009, both statistically significant, but not in KRAS wild-type tumors, and similarly, there was no statistically significant difference in expression between KRAS wild-type and mutant. (Table 14).
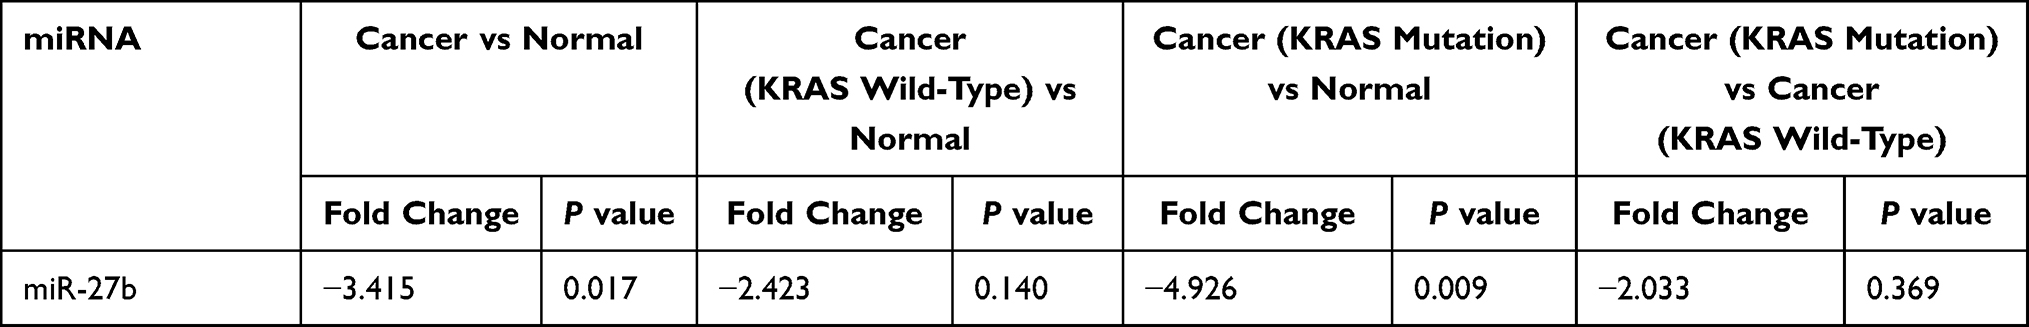 |
Table 14 The Expression Level of miR-27b in an Independent Sample Test |
Discussion
Accumulating studies have revealed that driver gene mutations exert comprehensive effects on miRNA expression.11,30,31 KRAS mutation is one of the most common genetic changes and plays a crucial role in CRC carcinogenesis.32,33 KRAS mutation status is closely related to the success of drug therapy in patients with tumors. In 2006, Lievre et al were the first to report the association between KRAS gene mutations and a reduced response to anti-EGFR agents, suggesting that patients with wild-type KRAS experienced the longest OS.34 Mutation of KRAS leads to the failure of anti-EGFR treatments, which are widely used in the treatment of metastatic colorectal carcinoma.35 Activating oncogenic KRAS mutations are often associated with the resistance of CRC to chemotherapy and targeted therapies.36,37 However, KRAS gene detection is expensive and difficult to popularize in small- and medium-sized hospitals. Therefore, a fast, inexpensive and feasible alternative detection method is particularly important. KRAS mutations affect miRNA expression and promote the development and progression of cancer. In non-small-cell lung cancer, KRAS mutation induces the expression of miR-29b and ultimately transcriptionally silences a variety of tumor suppressor factors.38 In pancreatic cancer, KRAS mutation inhibits the expression of miR-489 and inhibits tumor cell migration and metastasis by targeting MMP7 and ADAM9.39 However, researchers have not explored whether miRNAs contribute to KRAS-driven aggressiveness in CRC.
A systematic analysis of miRNA expression in patients with CRC and different KRAS genotypes has not been performed, nor is there any report on the differential expression of miRNAs between patients with KRAS-mutant and KRAS wild-type CRC. In the present study, tumor and adjacent normal tissues (n=50) were collected from 25 patients with CRC, including 10 KRAS mutant-positive patients and 15 wild-type KRAS patients. The expression of 1547 miRNAs (we provide information about these miRNAs in the Supplementary Material) in patients with different KRAS genotypes was analyzed and compared, and some miRNAs with potential clinical application value were identified. In particular, we discovered some miRNAs that can simultaneously screen for CRC and indicate the KRAS genotype. Then, we predicted the miRNAs targeting KRAS using bioinformatics and analyzed the expression and clinical significance of these miRNAs.
We first analyzed the expression of miRNAs between CRC tumor and normal tissues, and 82 abnormal miRNAs were identified. The expression of most of these miRNAs was consistent with results from our previous research and research reports from other groups. Of the miRNAs that have a targeting relationship with KRAS, miR-4770, miR-143, miR-193b, miR-429 and miR-96 showed consistent expression patterns in this study and our previous studies.22,40 MiR-27b,41 and miR-193a-3p16 were significantly downregulated in CRC tissues, miR-96,42 and miR-429 were significantly increased in CRC tissue compared with adjacent nontumor tissue.43 The previously published results regarding the expression of these miRNAs are also consistent with our research results, but there are some studies with conflicting results; for example, miR-193b expression was found to be significantly upregulated in CRC,44 miR-429 expression was found to be downregulated, HMGB3 expression was found to be upregulated in CRC tissues compared with adjacent noncancer tissues, and the expression levels of miR-429 were found to be negatively associated with those of HMGB3.45 The contradictory results may be caused by the differences in the sample size used in each experiment, the differences in patient demographics, the differences in clinicopathological types and so on. Next, we focused on the expression of miRNAs in patients with the KRAS-mutant or KRAS wild-type genotype and between patients with the KRAS-mutant and KRAS wild-type genotypes. Fifty-eight dysregulated miRNAs were identified in patients with KRAS mutations, and 62 aberrantly expressed miRNAs were detected in patients with the KRAS wild-type genotype. Thirteen miRNAs were abnormally expressed in KRAS-mutant patients versus KRAS wild-type patients. This study also analyzed the number and distribution of abnormally expressed miRNAs in tumor tissues of different KRAS genotypes (Figure 10).
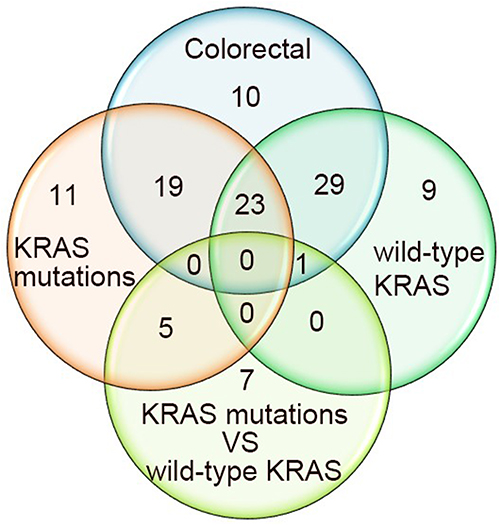 |
Figure 10 The number and distribution of abnormally expressed miRNAs in tumor tissues of patients with different KRAS genotypes. Colorectal: The differentially expressed miRNAs between tumor tissue and normal tissue. KRAS mutations: The differentially expressed miRNAs between KRAS-mutant tumor tissue and normal tissue. Wild-type KRAS: The differentially expressed miRNAs between KRAS wild-type tumor tissue and normal tissue. KRAS mutations vs wild-type KRAS: The differentially expressed miRNAs between KRAS-mutant tumor tissue and KRAS wild-type tumor tissue. |
Some miRNAs are not only biomarkers for CRC but are also closely related to the genotype of KRAS. This finding is very important for patients who must choose clinical treatment options based on KRAS results. Some miRNAs showed no obvious difference in CRC tissues compared to adjacent normal colonic epithelium but exhibited significant differences in expression between patients with different KRAS genotypes. The ability to distinguish KRAS genotypes is also important and meaningful for patients who have been diagnosed with CRC, and this method is inexpensive and feasible. Based on the important role of KRAS in CRC, we performed bioinformatics analysis to predict miRNAs that have a targeting relationship with KRAS and analyzed the expression of these KRAS-targeting miRNAs in CRC. Most of these KRAS-targeting miRNAs did not show obvious differential expression, but three miRNAs caught our attention: miR-181d, miR-27b and miR-19a. Although miR-181d did not display obvious differential expression between tumor and normal tissues (P>0.05), a substantial difference was observed between patients with KRAS-mutant and KRAS wild-type genotypes, as its expression level in patients with the mutant genotype was significantly increased by more than 6-fold. Interestingly, compared to that in normal tissues, miR-181d expression was upregulated more than 3-fold in KRAS-mutant patients and downregulated more than 2-fold in KRAS wild-type patients, although the difference was not significant (P>0.05). Although miR-181d cannot be used to screen for CRC, it appears to be able to determine the KRAS genotype of patients with CRC, but this difference may be related to the sample size of the study. Based on the substantial differences in the expression of this miRNA between patients with different KRAS genotypes, we predict that it is closely related to the role of KRAS in CRC. Notably, miR-27b is another miRNA targeting KRAS. Compared with that in normal tissues, miR-27b expression was downregulated more than 3-fold in CRC tumor tissues (P=0.026), suggesting its potential utility as a biomarker for patients with CRC. Its expression was also significantly decreased by more than 7-fold in KRAS-mutant tumor tissues (P=0.022), indicating that it has the potential to indicate the KRAS genotype. Another miRNA targeting KRAS, miR-19a, showed significant differential expression in tumor tissues from patients with versus without KRAS mutations (P=0.034). Although significant differential expression of this miRNA was not observed in CRC versus normal tissues (P=0.098), miR-19a can be used as an indicator of the KRAS genotype in patients diagnosed with CRC. KRAS is also very important for prognosis evaluation. In our study, the prognosis of patients with KRAS mutations was significantly poorer than that of patients with wild-type KRAS, and no significant differences in sex or age were observed between patients with KRAS-mutant and wild-type genotypes.
In summary, KRAS plays an important role in the development, invasion and prognosis of CRC. In the postoperative treatment of patients with CRC, the KRAS genotype should be determined to guide the use of antitumor drugs. However, the current high cost of KRAS testing has restricted its use in small- and medium-sized hospitals and by ordinary patients. A better understanding of CRC biology and the establishment of predictive factors are crucial for the identification of new therapeutic targets in patients with CRC carrying KRAS mutations to improve their outcomes. Numerous studies have shown that miRNAs are potentially useful as diagnostic markers for CRC. As shown in the present study, miR-181d, miR-27b and miR-19a are closely related to the KRAS genotype and might distinguish the KRAS genotype in patients with CRC, which helps to reduce the cost of testing before drug treatment. KRAS genotyping is very important to improve the precise treatment of tumors and the prognosis of patients. Of course, this study also has its shortcomings. In addition to the small number of samples, the samples are mostly from a single source, and there is a lack of multicenter research data. In addition to these problems, it is still necessary to unify and standardize the experimental process and standards to reduce experimental error. Moreover, further research on the interaction mechanism and signaling pathway between miRNA, KRAS and CRC is needed.
Acknowledgments
We express our thanks for the use of the facility and the academic advice from the Guangzhou Institute of Obstetrics and Gynecology and the Key Laboratory for Major Obstetric Diseases of Guangdong Province. The miRNA profiling and qRT–PCR experiments in this study were performed at GeneCopoeia (Guangzhou, China). Huaping Li and his colleagues provided substantial support during the experiments.
The contents of this paper have not been published or submitted for publication elsewhere in whole or in part. There are no ethical/legal conflicts involved in the article.
Funding
The present study was supported by the Guangzhou Medical University Youth Program (grant no. 2014A10).
Disclosure
The authors report no conflicts of interest in this work.
References
1. Siegel RL, Miller KD, Jemal A. Cancer statistics, 2018. CA Cancer J Clin. 2018;68:7–30. doi:10.3322/caac.21442
2. Fakih MG. Metastatic colorectal cancer: current state and future directions. J Clin Oncol. 2015;33:1809–1824. doi:10.1200/JCO.2014.59.7633
3. Jancik S, Drabek J, Radzioch D, Hajduch M. Clinical relevance of KRAS in human cancers. J Biomedcine Biotechnol. 2010;2010:1–13. doi:10.1155/2010/150960
4. Fernández-medarde A, Santos E. Ras in cancer and developmental diseases. Genes Cancer. 2011;2:344–358. doi:10.1177/1947601911411084
5. Li X, Yang T, Li CS, et al. Surface enhanced Raman spectroscopy (SERS) for the multiplex detection of BRAF, KRAS, and PIK3CA mutations in plasma of colorectal cancer patients. Theranostics. 2018;8:1678–1689. doi:10.7150/thno.22502
6. Lambert AW, Pattabiraman DR, Weinberg RA. Emerging biological principles of metastasis. Cell. 2017;168:670–691. doi:10.1016/j.cell.2016.11.037
7. Chen P, Li X, Zhang R, et al. Combinative treatment of beta-elemene and cetuximab is sensitive to KRAS mutant colorectal cancer cells by inducing ferroptosis and inhibiting epithelial-mesenchymal transformation. Theranostics. 2020;10:5107–5119. doi:10.7150/thno.44705
8. Choi JW, Kim P, Kim JK, et al. Longitudinal tracing of spontaneous regression and anti-angiogenic response of individual microadenomas during colon tumorigenesis. Theranostics. 2015;5:724–732. doi:10.7150/thno.10734
9. Rupaimoole R, Slack FJ. MicroRNA therapeutics: towards a new era for the management of cancer and other diseases. Nat Rev Drug Discov. 2017;16:203–222. doi:10.1038/nrd.2016.246
10. Cooks T, Pateras IS, Jenkins LM, et al. Mutant p53 cancers reprogram macrophages to tumor supporting macrophages via exosomal miR-1246. Nat Commun. 2018;9:771. doi:10.1038/s41467-018-03224-w
11. Yang Y, Shu X, Liu D, et al. EPAC null mutation impairs learning and social interactions via aberrant regulation of miR-124 and ZIF268 translation. Neuron. 2012;73:774–788. doi:10.1016/j.neuron.2012.02.003
12. Chu PC, Lin P-C, Wu H-Y, et al. Mutant KRAS promotes liver metastasis of colorectal cancer, in part, by upregulating the MEK-Sp1-DNMT1-miR-137-YB-1-IGF-IR signaling pathway. Oncogene. 2018;37:3440–3455. doi:10.1038/s41388-018-0222-3
13. Masciarelli S, Fontemaggi G, Di Agostino S, et al. Gain-of-function mutant p53 downregulates miR-223 contributing to chemoresistance of cultured tumor cells. Oncogene. 2014;33:1601–1608. doi:10.1038/onc.2013.106
14. Prossomariti A, Piazzi G, D’Angelo L, et al. MiR-155 is downregulated in familial adenomatous polyposis and modulates WNT signaling by targeting AXIN1 and TCF4. Mol Cancer Res. 2018;16:1965–1976. doi:10.1158/1541-7786.MCR-18-0115
15. De Roock W, De Vriendt V, Normanno N, Ciardiello F, Tejpa RS. KRAS, BRAF, PIK3CA, and PTEN mutations: implications for targeted therapies in metastatic colorectal cancer. Lancet Oncol. 2011;12:594–603. doi:10.1016/S1470-2045(10)70209-6
16. Mamoori A, Wahab R, Islam F, et al. Clinical and biological significance of miR-193a-3p targeted KRAS in colorectal cancer pathogenesis. Hum Pathol. 2018;71:145–156. doi:10.1016/j.humpath.2017.10.024
17. Fan Q, Hu X, Zhang H, et al. MiR-193a-3p is an important tumour suppressor in lung cancer and directly targets KRAS. Cell Physiol Biochem. 2017;44:1311–1324. doi:10.1159/000485491
18. Amankwatia EB, Chakravarty P, Carey FA, et al. MicroRNA-224 is associated with colorectal cancer progression and response to 5-fluorouracil-based chemotherapy by KRAS-dependent and -independent mechanisms. Br J Cancer. 2015;112:1480–1490. doi:10.1038/bjc.2015.125
19. Chen X, Guo X, Zhang H, et al. Role of miR-143 targeting KRAS in colorectal tumorigenesis. Oncogene. 2009;28:1385–1392. doi:10.1038/onc.2008.474
20. Akao Y, Kumazaki M, Shinohara H, et al. Impairment of KRas signaling networks and increased efficacy of epidermal growth factor receptor inhibitors by a novel synthetic miR-143. Cancer Sci. 2018;109:1–13. doi:10.1111/cas.13559
21. Hara T, Jones MF, Subramanian M, et al. Selective targeting of KRAS-Mutant cells by miR-126 through repression of multiple genes essential for the survival of KRAS-Mutant cells. Oncotarget. 2014;5:7635–7650. doi:10.18632/oncotarget.2284
22. Schee K, Boye K, Abrahamsen TW, Fodstad Ø, Flatmark K. Clinical relevance of microRNA miR-21, miR-31, miR-92a, miR-101, miR-106a and miR-145 in colorectal cancer. BMC Cancer. 2012;12:505. doi:10.1186/1471-2407-12-505
23. Pugh S, Thiébaut R, Bridgewater J, et al. Association between miR-31-3p expression and cetuximab efficacy in patients with KRAS wild-type metastatic colorectal cancer: a post-hoc analysis of the New EPOC trial. Oncotarget. 2017;8:93856–93866. doi:10.18632/oncotarget.21291
24. Ramon L, David C, Fontaine K, et al. Technical validation of a reverse-transcription quantitative polymerase chain reaction in vitro diagnostic test for the determination of MiR-31-3p expression levels in formalin-fixed paraffinembedded metastatic colorectal cancer tumor specimens. Biomark Insights. 2018;13:1–11. doi:10.1177/1177271918763357
25. Manceau G, Imbeaud S, Thiébaut R, et al. Hsa-miR-31-3p expression is linked to progression-free survival in patients with KRAS wild-type metastatic colorectal cancer treated with anti-EGFR therapy. Clin Cancer Res. 2014;20:3338–3347. doi:10.1158/1078-0432.CCR-13-2750
26. Wu X, Xu X, Li S, et al. Identification and validation of potential biomarkers for the detection of dysregulated microRNA by qPCR in patients with colorectal adenocarcinoma. PLoS One. 2015;10:e0120024. doi:10.1371/journal.pone.0120024
27. Wu X, Li S, Xu X, et al. The potential value of miR-1 and miR-374b as biomarkers for colorectal cancer. Int J Clin Exp Pathol. 2015;8:2840–2851.
28. Livak K, Schmittgen T. Analysis of relative gene expression data using real-time quantitative PCR and the 2-ΔΔCT method. Methods. 2001;25:402–408. doi:10.1006/meth.2001.1262
29. Griffiths-Jones S, Saini HK, van Dongen S, Enright AJ. miRBase: tools for microRNA genomics. Nucleic Acids Res. 2008;36:D154–D158. doi:10.1093/nar/gkm952
30. Suzuki HI, Yamagata K, Sugimoto K, et al. Modulation of microRNA processing by p53. Nature. 2009;460:529–533. doi:10.1038/nature08199
31. Lin PL, Wu D-W, Huang -C-C, et al. MicroRNA-21 promotes tumour malignancy via increased nuclear translocation of beta-catenin and predicts poor outcome in APC-mutated but not in APC-wild-type colorectal cancer. Carcinogenesis. 2014;35:2175–2182. doi:10.1093/carcin/bgu110
32. Roberts PJ, Stinchcombe TE. KRAS mutation: should we test for it, and does it matter? J Clin Oncol. 2013;31:1112–1121. doi:10.1200/JCO.2012.43.0454
33. Worthley DL, Leggett BA. Colorectal cancer: molecular features and clinical opportunities. Clin Biochem Rev. 2010;31:31–38.
34. Lièvre A, Bachet J-B, Le Corre D, et al. KRAS mutation status is predictive of response to cetuximab therapy in colorectal cancer. Cancer Res. 2006;66:3992–3995. doi:10.1158/0008-5472
35. Ung L, Lam AK, Morris DL, Chua TC. Tissue-based biomarkers predicting outcomes in metastatic colorectal cancer: a review. Clin Transl Oncol. 2014;16:425–435. doi:10.1007/s12094-013-1154-6
36. Sameen S, Barbuti R, Milazzo P, et al. Mathematical modeling of drug resistance due to KRAS mutation in colorectal cancer. J Theor Biol. 2016;389:263–273. doi:10.1016/j.jtbi.2015.10.019
37. Osumi H, Shinozaki E, Osako M, et al. Cetuximab treatment for metastatic colorectal cancer with KRAS p.G13D mutations improves progression-free survival. Mol Clin Oncol. 2015;3:1053–1057. doi:10.3892/mco.2015.602
38. Langsch S, Baumgartner U, Haemmig S, et al. MiR-29b mediates NF-kappaB signaling in KRAS-induced non-small cell lung cancers. Cancer Res. 2016;76:4160–4169. doi:10.1158/0008-5472.CAN-15-2580
39. Yuan P, He X-H, Rong Y-F, et al. KRAS/NF-kappaB/YY1/miR-489 signaling axis controls pancreatic cancer metastasis. Cancer Res. 2017;77:100–111. doi:10.1158/0008-5472.CAN-16-1898
40. Xu XH, Wu X-B, Wu S-B, et al. Identification of miRNAs differentially expressed in clinical stages of human colorectal carcinoma-an investigation in Guangzhou, China. PLoS One. 2014;9:e94060. doi:10.1371/journal.pone.0094060
41. Luo Y, Yu S-Y, Chen -J-J, et al. MiR-27b directly targets Rab3D to inhibit the malignant phenotype in colorectal cancer. Oncotarget. 2017;9:3830–3841. doi:10.18632/oncotarget.23237
42. Ge T, Xiang P, Mao H, et al. Inhibition of miR-96 enhances the sensitivity of colorectal cancer cells to oxaliplatin by targeting TPM1. Exp Ther Med. 2020;20:2134–2140. doi:10.3892/etm.2020.8936
43. Han Y, Zhao Q, Zhou J, Shi R. miR-429 mediates tumor growth and metastasis in colorectal cancer. Am J Cancer Res. 2017;7:218–233.
44. Guo F, Luo Y, Mu Y-F, et al. miR-193b directly targets STMN1 and inhibits the malignant phenotype in colorectal cancer. Am J Cancer Res. 2016;6:2463–2475.
45. Tian X, Chang J, Zhang N, Wu S, Liu H, Yu J. MicroRNA-429 acts as a tumor suppressor in colorectal cancer by targeting high mobility group box 3. Oncol Lett. 2021;21:250. doi:10.3892/ol.2021.12511
 © 2022 The Author(s). This work is published and licensed by Dove Medical Press Limited. The
full terms of this license are available at https://www.dovepress.com/terms
and incorporate the Creative Commons Attribution
- Non Commercial (unported, 3.0) License.
By accessing the work you hereby accept the Terms. Non-commercial uses of the work are permitted
without any further permission from Dove Medical Press Limited, provided the work is properly
attributed. For permission for commercial use of this work, please see paragraphs 4.2 and 5 of our Terms.
© 2022 The Author(s). This work is published and licensed by Dove Medical Press Limited. The
full terms of this license are available at https://www.dovepress.com/terms
and incorporate the Creative Commons Attribution
- Non Commercial (unported, 3.0) License.
By accessing the work you hereby accept the Terms. Non-commercial uses of the work are permitted
without any further permission from Dove Medical Press Limited, provided the work is properly
attributed. For permission for commercial use of this work, please see paragraphs 4.2 and 5 of our Terms.