Back to Journals » International Journal of Nanomedicine » Volume 11
Study of a new bone-targeting titanium implant–bone interface
Authors Liu XN, Zhang Y, Li SB, Wang YY, Sun T, Li ZJ, Cai LZ, Wang XG, Zhou L ![]() , Lai RF
, Lai RF
Received 11 August 2016
Accepted for publication 10 October 2016
Published 25 November 2016 Volume 2016:11 Pages 6307—6324
DOI https://doi.org/10.2147/IJN.S119520
Checked for plagiarism Yes
Review by Single anonymous peer review
Peer reviewer comments 3
Editor who approved publication: Professor Lei Yang
Xiangning Liu,1,* Ye Zhang,1,* Shaobing Li,2,* Yayu Wang,3 Ting Sun,1 Zejian Li,1 Lizhao Cai,1 Xiaogang Wang,3,* Lei Zhou,2 Renfa Lai1
1The Medical Center of Stomatology, The First Affiliated Hospital of Jinan University, 2The Department of Oral Implantology, Guangdong Provincial Stomatological Hospital, Southern Medical University, 3Department of Cell Biology, Institute of Biomedicine, College of Life Science and Technology, Jinan University, Guangzhou, People’s Republic of China
*These authors contributed equally to this work
Abstract: New strategies involving bone-targeting titanium (Ti) implant–bone interface are required to enhance bone regeneration and osseointegration for orthopedic and dental implants, especially in osteoporotic subjects. In this study, a new dual-controlled, local, bone-targeting delivery system was successfully constructed by loading tetracycline-grafted simvastatin (SV)-loaded polymeric micelles in titania nanotube (TNT) arrays, and a bone-targeting Ti implant–bone interface was also successfully constructed by implanting the delivery system in vivo. The biological effects were evaluated both in vitro and in vivo. The results showed that Ti surfaces with TNT–bone-targeting micelles could promote cytoskeletal spreading, early adhesion, alkaline phosphatase activity, and extracellular osteocalcin concentrations of rat osteoblasts, with concomitant enhanced protein expression of bone morphogenetic protein (BMP)-2. A single-wall bone-defect implant model was established in normal and ovariectomized rats as postmenopausal osteoporosis models. Microcomputed tomography imaging and BMP-2 expression in vivo demonstrated that the implant with a TNT-targeting micelle surface was able to promote bone regeneration and osseointegration in both animal models. Therefore, beneficial biological effects were demonstrated both in vitro and in vivo, which indicated that the bone-targeting effects of micelles greatly enhance the bioavailability of SV on the implant–bone interface, and the provision of SV-loaded targeting micelles alone exhibits the potential for extensive application in improving local bone regeneration and osseointegration, especially in osteoporotic subjects.
Keywords: bone regeneration, titania nanotubes, targeted drug delivery, orthopedic implant, drug release, micelles
Introduction
Despite rapid development in materials science and biotechnology, satisfactory bone regeneration and osseointegration remain major challenges for orthopedic and dental implants in cases of age-related, postmenopausal and other forms of secondary osteoporosis resulting from systemic diseases or pharmacological therapies.1–4 Many clinicians and researchers have observed that bone regeneration and biomaterial osseointegration are slower in osteoporotic subjects, with an increased rate of prosthetic device failure in both dental and orthopedic reconstructive surgery.5–7 Different strategies have been proposed to improve implant–bone interfaces on mainstream titanium (Ti) and Ti alloy implants, including the manipulation of surface topography, application of biomimetic coatings, and local delivery of drugs to enhance bone formation or inhibit bone resorption.8–10 To enhance the osseointegration of Ti implants in either normal or osteoporotic subjects, in some ways, it is important to induce and enhance the osteoblast functions more precisely and more effectively on the implant–bone interface. Thus, the studies of bone-targeting Ti implant–bone interface with bone-targeting effect have become a focus recently. Among the modifications to the Ti surface, the nanotubular structure fabricated by anodic oxidation has demonstrated accelerated osteoblast adhesion or proliferation and can be used as a carrier for drugs and antibacterial agents,11,12 certainly including bone-targeting agents.
Simvastatin (SV) is a well-known member of the statin family, which comprises hydroxy-3-methylglutaryl coenzyme A reductase inhibitors and represents one of the most promising families of antiosteoporotic drugs. Specifically, SV acts as an activator of bone morphogenetic protein-2 (BMP-2), which accounts for the major osteoinductive potential of bone.13 For the systemic administration of SV, a hydrophobic small molecule drug, it has been reported that <5% of an oral dose reaches the systemic circulation and that high doses increase the risk of liver failure, kidney disease, and other side effects.14 However, local administration can bypass the hepatic degradation of SV to achieve therapeutic concentrations in bone and avoid the side effects caused by systemic administration. Furthermore, local delivery of SV at the desired site of action has been shown to have positive effects on bone formation.15,16 Although there are some reports about the administration of SV enhancing the bone regeneration around implants, few studies involved the relationship between local delivery of SV and implant–bone interface, especially for the in vivo studies in either normal or osteoporosis models.17,18 As the polymeric micellar system is considered promising for enhancing the bioavailability and reducing the toxic side effects of hydrophobic drugs, SV-loaded polymeric micelles with sustained-release profiles were developed with preferable bioavailability in our previous study.19 Then, in our additional previous study, SV-loaded polymeric micelles were loaded in titania nanotube (TNT) arrays to develop a local delivery system.11 However, a big difficulty for the application of this delivery system was the lack of bone-targeting effects; SV-loaded polymeric micelles could be rapidly released from the TNTs and spread far from the implant–bone interface, which seemingly prevents the best biological efficiency of SV on the osteoblasts, contributing to osseointegration.
Tetracycline (TC) has been shown by numerous studies to display a high affinity for the mineral constituent of bone (hydroxyapatite).20 TC is also well known as a broad-spectrum antibiotic, as well as an inhibitor of mammalian collagenases and matrix metalloproteinases, which promotes its applications in disorders such as periodontitis, atherosclerotic cardiovascular disease, and osteoarthritis.21,22 As a bone-targeting drug agent, TC offers the advantages of being relatively nontoxic compared to bisphosphonates.20,23,24 In addition, the biological activity of pharmaceutical TC is less susceptible to physicochemical factors and physiological environments compared with bone-targeting biological agents such as acidic oligopeptides and aptamers.20,25 Wang et al26 reported the development of nanoparticles (NPs) that target bone tissue by poly(lactic-co-glycolic acid) copolymers and TC-based bone-targeting moieties and found that the NPs loaded with SV could improve the curative effects of SV on the recovery of bone mineral density in vivo. Consequently, the strong bone-binding potential of TC has inspired our efforts to establish its conjugation to polymer to affect bone targeting in a local delivery system and implant–bone interface.
In the current study, TC-grafted SV-loaded polymeric micelles were prepared and loaded in TNT arrays to develop a dual-controlled, local, bone-targeting delivery system. Then, this system was implanted in vivo to develop a bone-targeting Ti implant–bone interface. The biological effects of this system were evaluated in vitro and in vivo. The local delivery system would be expected to improve local bone regeneration and osseointegration in normal and postmenopausal osteoporosis models because of bone-targeting Ti implant–bone interface.
Materials and methods
Synthesis and characterization of the TC–poly(ethylene glycol) (PEG)–poly(ε-caprolactone) (PCL) (TC–PECL) polymer
The synthesis process is shown in Figure 1. First, 3.6 g Boc–NH–PEG–OH 2000 (tert-butoxycarbonyl-protected NH2–PEG–OH, MW 2000), 3.6 g caprolactone (CL) [ε-CL], 27 mg Sn(Oct)2 (Suzhou Nord Derivatives Pharm-tech Co., Ltd., Suzhou, China) and a total volume (TV) of 45 mL toluene solution was sequentially added to the sealed reaction flask in the glove box. The sealed reaction flask was placed in an oil bath at 80°C for 48 h of reaction. Then, excess CH3I was added, and the reaction was continued at room temperature for 24 h. Thus, the polymer Boc–NH–PEG–PCL (OCH3) was synthesized by ring-opening polymerization of ε-CL with Boc–NH–PEG–OH 2000 under the catalysis of Sn(Oct)2 and capped with CH3I. Second, under the protection of nitrogen, the resulting polymer NH2–PEG–PCL (OCH3) was produced by deprotection of Boc–NH–PEG–PCL (OCH3) via 4 M HCl in the 1,4-dioxane solution for 4 h at 30°C. When 3 g NH2-PEG-PCL(OCH3), 4.5 g triphosgene and 3 mL of pyridine were mixed together in 45 mL of dry dichloromethane at room temperature overnight, the polymer NCO-PEG-PCL (OCH3) was synthesized by transformation of –NH2 into –NCO. Third, under the protection of nitrogen and the catalysis of 60 μL dibutyltin dilaurate, the reaction between 1.1 g TC and 2 g NCO–PEG–PCL (OCH3) in 45 mL of dry tetrahydrofuran continued at room temperature for 12 h. Therefore, the final polymer TC–PEG–PCL (OCH3) was synthesized by the reaction of –OH on TC and –NCO on NCO–PEG–PCL (OCH3) groups. The proton nuclear magnetic resonance (1H-NMR) spectra of the products were obtained using an NMR spectrometer (BioSpin AC-80; Bruker Optik GmbH, Ettlingen, Germany). For testing, 5 mg of TC–PECL was dissolved in 600 μL of deuterated dimethyl sulfoxide.
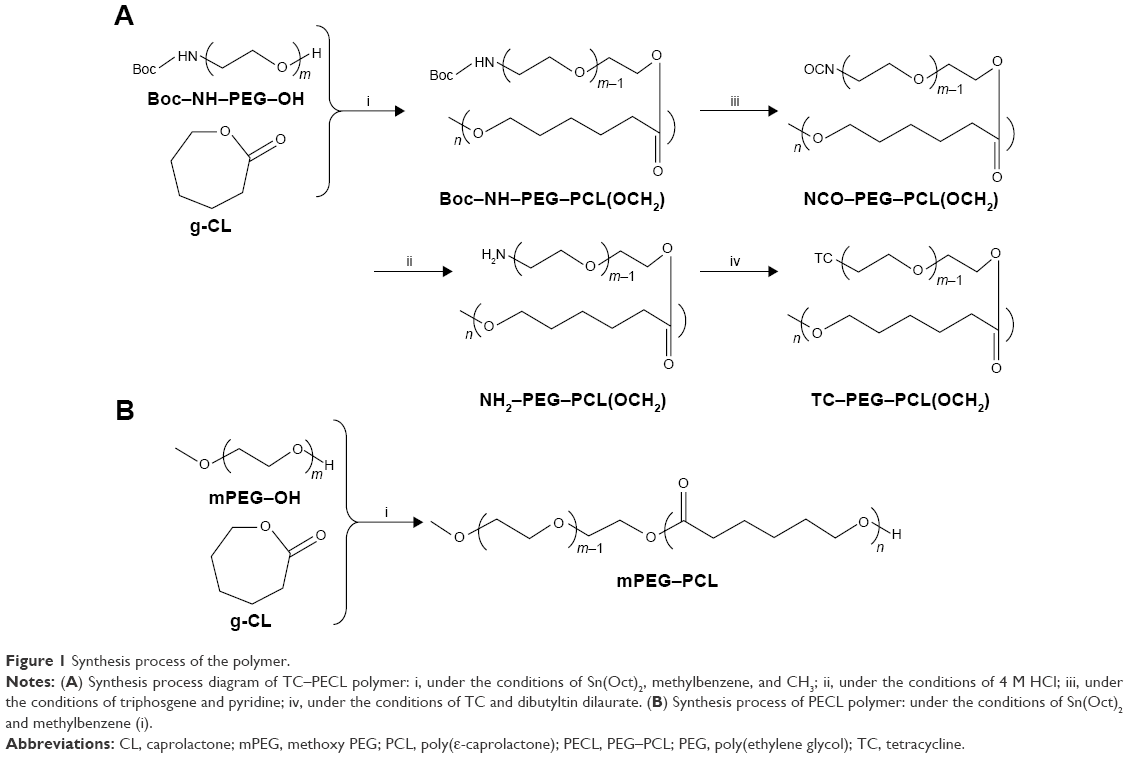 | Figure 1 Synthesis process of the polymer. |
As a control, methoxy PEG–PCL (2000–2000) block polymer was synthesized by ring-opening polymerization of CL to PEG–OH 2000 under the catalysis of Sn(Oct)2, which is shown in Figure 2. The characterization of the products was obtained as described earlier.
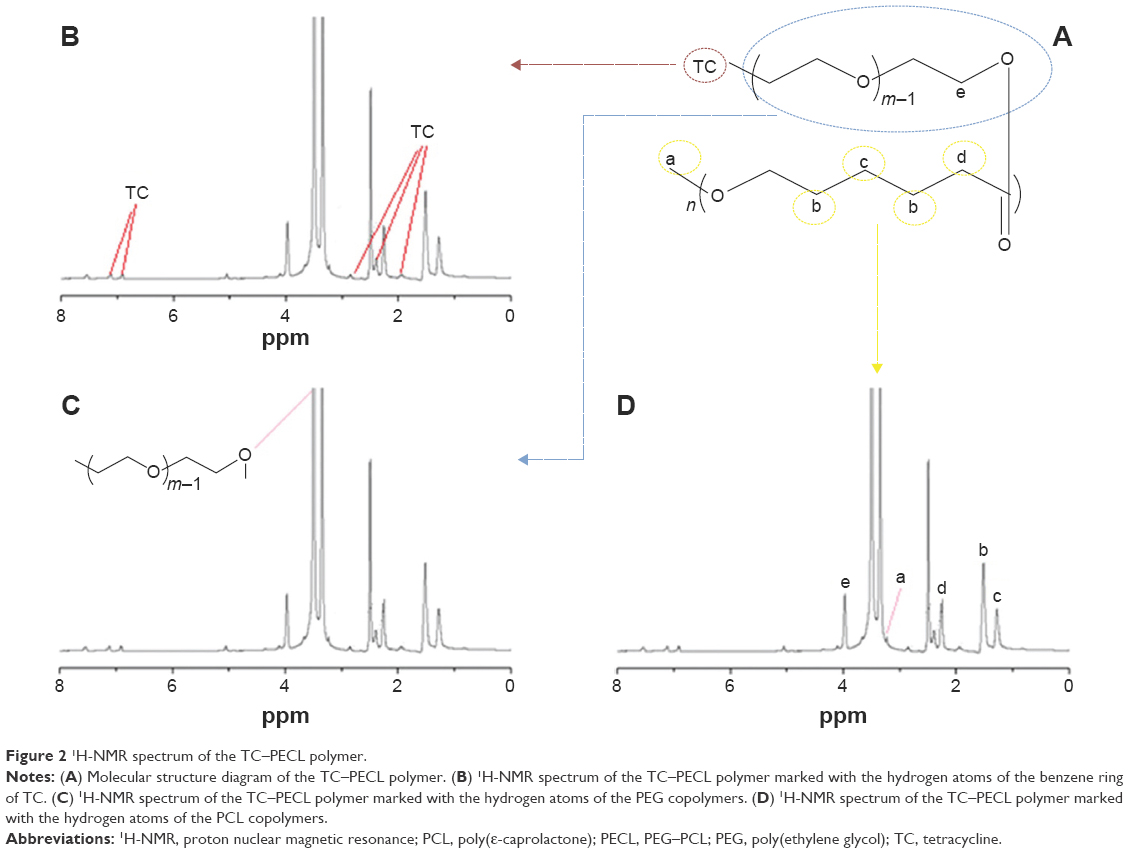 | Figure 2 1H-NMR spectrum of the TC–PECL polymer. |
Preparation and properties of TC-grafted PECL micelles
Preparation
As in our previous study,19 SV-loaded micelles were prepared by a membrane dialysis method. Briefly, 100 mg of TC–PECL polymer and a fixed amount of SV were dissolved in 16 mL acetone. Deionized water (20 mL) was added dropwise to the polymer solution while stirring, followed by ultrasonication of the solution in an ice bath. This mixture was then dialyzed against deionized water at room temperature for 24 h using a dialysis bag with a molecular weight cutoff of 3,500 g/mol. The dialysis process enabled the solvent exchange between the acetone and deionized water, during which self-assembly of the PECL occurred. After dialysis, the solution in the dialysis bag was collected and filtered through a 0.45 μm syringe filter. As a control, PECL micelles were also prepared.
Characterization
The particle sizes of the TC–PECL and PECL micelles were evaluated by dynamic light scattering (Nano ZS, ZEN3600; Malvern Instruments Ltd., Malvern, UK) after appropriate dilution with deionized water. Light-scattering data were obtained at a detection angle of 173° at 25°C and were subsequently analyzed by the cumulant method to obtain the hydrodynamic diameter and polydispersity index (PDI) of the micelles; the pH value and zeta potential were also obtained. The morphological characteristics of the TC–PECL and PECL micelles were examined by transmission electron microscopy (TEM; TecnaiG220; FEI, Hillsboro, OR, USA). For analysis, the samples were placed on copper grids and stained with 1.0 wt% phosphotungstic acid.
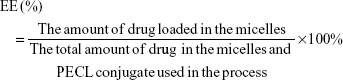
Encapsulation ratio and drug-loading (DL) efficiency
To determine the SV DL ratio and encapsulation efficiency (EE), a known amount of SV-loaded micelles was dissolved in 1 mL of tetrahydrofuran. This solution was then analyzed in an ultraviolet (UV) spectrophotometer at 238 nm, with TC–PECL solution as the control. The drug concentration in the solution was calculated based on the standard curve. The DL ratio and drug EE were obtained according to the following formulae:
|
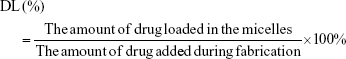
|
In vitro SV release
TC–PECL micelle solution was loaded with 9 mg SV. The same amounts of SV loaded in PECL micelle solution were prepared as controls. Both the SV-loaded micelles and the free SV were placed into a dialysis bag suspended in a 0.2% sodium dodecyl sulfate (SDS) solution. The TV of each sample solution was 20 mL. The sealed vials were placed in a gas bath thermostatic oscillator (SHZ-82; Jintan Honghua Instruments Co. Ltd., Jintan, China) at 200 rpm and 37°C. At predetermined time intervals, 3 mL aliquots of the solution were withdrawn from the release medium and replaced with fresh medium. The SV concentration was analyzed by measuring the UV absorbance at 238 nm.
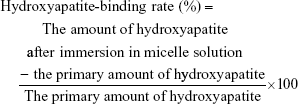
Hydroxyapatite-binding assay
Apatite is the main component of bone in its natural state. In vertebrate bones, this inorganic material is known as hydroxyapatite or carbonated hydroxyapatite. To confirm the bone-targeting property of TC–PECL micelles in vitro, a hydroxyapatite-binding assay was performed as follows: 20 mg hydroxyapatite was dispersed in 40 mL TC–PECL micelle solution, and the same amounts of hydroxyapatite in PECL micelle solution were prepared as controls. The micelle solution was placed into the centrifuge tube in the gas bath thermostatic oscillator at 200 rpm and 37°C. At predetermined time intervals, the centrifuge tube was removed from the oscillator and centrifuged for 25 min at 8,000 rpm and 20°C. Then, the centrifuged deposit was washed twice with pure water and purified by centrifugation for 10 min at 8,000 rpm and 20°C, which was repeated three times. After completion of 72 h of freeze-drying, the lyophilizate was weighed. The hydroxyapatite-binding rates at 6, 12, 24, 36, 48, and 72 h were calculated according to the following formula:
|
Fabrication and morphology of TNT arrays
The TNTs were fabricated by the method of anodic oxidation on a Ti sheet, as reported earlier.11,27 The Ti sheet was mechanically polished and cleaned by sonication in acetone for 30 min, prior to anodization. In a typical procedure, a 2×3 cm2, cleaned Ti sheet (99%) with a thickness of 0.1 mm was used as an anode and an iron/tantalum alloy as a cathode. The electrolyte was a solution containing 1,2,3-propanetriol, NH4F (1.1 wt%), and H2O (15 vol%). The anodizing voltage varied from 0 to 25 V with an increasing rate of 500 mV/s and was maintained at 25 V for 1 h. The prepared TNTs were then annealed in air at 450°C for 4 h to form a steady anatase crystal phase and improve the interfacial structure between the TNT film and Ti substrate.28,29
The surface morphology of the TNTs was examined by field-emission scanning electron microscopy (SEM; ZEISS ULTRA55; Carl Zeiss Company, Oberkochen, Germany) at an acceleration voltage of 20 kV.
Loading SV-loaded micelles into the TNTs
SV-loaded TC–PECL micelles were loaded into the TNTs via a simplified drying method with a vacuum, according to our previous study.11 For cytological tests, TNT samples (1×1 cm ×0.1 mm) were cleaned with deionized water and anhydrous ethanol prior to loading the micelles. Then, a 0.09 mg/mL concentration of SV-loaded TC–PECL micelles and a 0.085 mg/mL concentration of SV-loaded PECL micelles were prepared. A 10 μL aliquot of the micelle solution was pipetted onto the TNT surface and gently spread to ensure even coverage. The surfaces were then allowed to dry under a vacuum at room temperature for 4 h. For the in vivo tests, a 0.9 mg/mL concentration of SV-loaded TC–PECL micelles and a 0.85 mg/mL concentration of SV-loaded PECL micelles were prepared, and TNT specimens (0.5×0.1 cm ×0.1 mm) were placed into 1 mL micelle solution in centrifuge tubes for 24 h of immersion. After the excess liquid was removed from the centrifuge tubes, the specimens were allowed to dry under a vacuum at room temperature for 24 h.
Cytological tests
Cell culture
The cytological features of the Ti samples were evaluated in vitro using primary rat calvaria-derived osteoblasts primary cells cultured in complete medium under standard culture conditions (37°C and 5% CO2). The complete medium included Dulbecco’s Modified Eagle’s Medium (Life Technologies Corp., Grand Island, NY, USA) supplemented with 10% fetal calf serum (Gibco Laboratories), 100 U/mL penicillin, and 100 mg/mL streptomycin (Sigma-Aldrich Co., St Louis, MO, USA).
For the siRNA transfection experiments in rat osteoblasts in vitro as given in the “FAM-siRNA transfection test” section, the following five groups were tested: TNTs loaded with SV-loaded TC-grafted PECL micelles (NT-SVTCPM), TNTs loaded with SV-loaded PECL micelles (NT-SVPM), SV-loaded TC-grafted PECL micelles (SVTCPM), SV-loaded PECL micelles (SVPM), and a blank (BK) as the control. According to our previous study, SV-loaded micelles with 2.5×10⁻⁷ SV molecules were optimal for incubation with the osteoblasts; therefore, this was used as the concentration reference for micelles in each group in the current study. In the other in vitro tests, the following four groups of Ti sheets were tested: NT-SVTCPM, NT-SVPM, uncoated TNTs (NT) as the positive control, and polished Ti (PT) metal as the negative control. To seed the cells on the surface of the Ti samples (1×1 cm), each sheet was placed onto the bottom of one well of a 24-well plate. The plates were then placed in a biological hood in the presence of UV light for 30 min for sterilization. The surfaces of the Ti sheets were then washed twice with warm phosphate-buffered saline (PBS), and the cells were plated at a density of 2×10⁴ cells/cm2. The medium was refreshed twice a week.
FAM-siRNA transfection test
Negatively charged siRNAs labeled with carboxyfluorescein (FAM-siRNAs) were able to be transfected into cells by binding to the positively charged NPs.25,26 To confirm the bone-targeting abilities of TC–PECL micelles toward rat osteoblasts in vitro, the visualized cellular uptake of the micelles was detected using an FAM-siRNA transfection test. In both the NT-SVTCPM and NT-SVPM groups, cells (2×10⁴ cells/cm2) were seeded onto Ti samples in the 24-well plates and treated with a concentration of 80 nM FAM-siRNAs, during which time the cells attached to the plate. In the SVTCPM, SVPM, or BK groups, the cells were seeded in the 24-well plates and treated instead with SVTCPM plus FAM-siRNAs, SVPM plus FAM-siRNAs, or FAM-siRNAs alone, respectively. After co-incubation for 1–12 h, cells were washed twice with PBS and the samples were observed and imaged by fluorescence microscopy (DMI6000B; Leica, Wetzlar, Germany) at the time points of 1, 2, 3, 4, 5, 6, and 12 h, respectively.
Cytoskeletal arrangement and early cell adhesion
Immunofluorescence staining was used to evaluate the cytoskeletal arrangement of rat osteoblasts cultured on Ti samples after 2, 6, 12, and 24 h of incubation, and cell adhesion was evaluated after 1, 2, and 6 h of incubation. After incubation, samples were rinsed twice with prewarmed PBS and then fixed in 4% paraformaldehyde at room temperature for 30 min, followed by three PBS rinses. Cells were incubated with PBS containing 5 μg/mL rhodamine phalloidin (Cytoskeleton, Inc., Denver, CO, USA) for 30 min at room temperature, followed by three PBS rinses, then with 4′,6-diamidino-2-phenylindole (DAPI) for 10 min for nuclei staining followed by two PBS rinses. Next, the fluorescence mounting medium (neutral buffer plus the same amount of glycerol) was added to the samples, which were observed by confocal laser scanning microscopy (CLSM; TCS SP2 AOBS; Leica). The samples used for the evaluation of early cell adhesion were incubated only with DAPI for 10 min. High-magnification immunofluorescence images were used to examine the actin arrangement and adhesion points. For the evaluation of early cell adhesion, each sample was selected to obtain a relatively uniform distribution of five different horizons for images at 126× magnification. An image-processing system (Image-Pro Plus 7.0; Media Cybernetics, Inc., Rockville, MD, USA) was used to analyze and count the number of adherent cells. The adhesion rate was calculated according to the following formula:
|

Cell proliferation
Cell proliferation was evaluated by determining the mitochondrial dehydrogenase enzymatic activity in metabolically active cells, using the methyl tetrazole sulfate (MTS) assay kit (CellTiter 96VR AQueous One Solution Cell Proliferation Assay; Promega, Madison, WI, USA), which measures the conversion of MTS to a colored aqueous soluble formazan product. After 1, 2, and 3 days of incubation, Ti samples were rinsed three times with PBS and then incubated with 10% MTS reagent at 37°C for 4 h in a humidified, 5% CO2 atmosphere. Thereafter, the absorbance of 100 μL of culture medium containing colored formazan product was measured in a 96-well plate, using a spectrophotometric microplate reader (Multiskan MK3; Thermo Fisher Scientific Inc., Hudson, NH, USA) at 492 nm.
Alkaline phosphatase (ALP) activity
The ALP produced by the cells was measured to determine the degree of osteoblastic differentiation. After 1, 2, and 3 days of incubation, Ti samples were rinsed three times with PBS and cells were digested and collected by centrifugation at 800 rpm for 3 min at room temperature. The cell pellets were lysed in 100 μL 0.1% Triton X-100 by three standard freeze-thaw cycles. The cell lysates were quantified with a colorimetric quantitative assay kit (Nanjing Jiancheng Bioengineering Institute, Nanjing, China). According to the experimental protocol of the kit, the amount of ALP was measured at a wavelength of 405 nm. The protein concentrations were evaluated using the bicinchoninic acid (BCA) assay kit (Thermo Fisher Scientific Inc.). The absorbance of the solution was measured at 560 nm, and the amount of total protein was calculated using a standard curve. To determine the ALP activity, the amount of ALP was normalized to the amount of total proteins synthesized.
Enzyme-linked immunosorbent assay (ELISA) for osteocalcin (OC)
OC, a marker for the late stage of osteoblast differentiation, is expressed by highly differentiated osteoblasts during the mineralization stage. The extracellular OC concentration was determined via ELISA using a rat OC ELISA kit (Shanghai Westang Biological Scientific Technology Co., Ltd., Shanghai, China). After 3, 7, and 14 days of incubation, the cell lysates and supernatants of each Ti sample were collected and subjected to ELISA. According to the manufacturer instruction, the OC concentrations were quantified by measuring the absorbance at 450 nm with reference to the standard curve calculated by detecting the samples provided in the ELISA kit.
Western blot analysis
Western blotting was used to measure the protein expression of BMP-2 in the rat osteoblasts cultured for 48 h with the different Ti samples. Cells were washed with ice-cold PBS three times and lysed with a lysis buffer containing protease inhibitors. The protein content was quantified using the BCA protein assay. Equal amounts of protein (30 μg per lane) were loaded onto a 10% SDS-polyacrylamide gel, followed by transfer to a polyvinylidene difluoride membrane. The membrane was blocked with 5% nonfat milk solution in Tris-buffered saline with 0.1% Triton X-100 (TBST) for 1 h and then incubated with the primary antibody (Anti-BMP2 antibody; Abcam, Cambridge, MA, USA) in TBST (1/300 dilution) at 4°C overnight. The membrane was then washed and incubated with the secondary antibody (goat anti-mouse IgG(H+L)-horseradish peroxidase; Tianjin Sungene Biotech Co., Ltd, Tianjin, China) for 1 h at room temperature. BandScan 5.0 software was used with a gray scale scan to evaluate the relative values for protein expression.
In vivo tests
Animals and surgical procedures
The in vivo experiments were performed using both normal and postmenopausal osteoporosis animal models in equal numbers. Seventy-eight 8-week-old female Sprague Dawley rats were obtained from Guangdong Medical Laboratory Animal Center (Guangzhou, People’s Republic of China), which were randomly divided into 39 rats for each model. The study protocol was approved by the Ethics Committee of Jinan University, and animal care guidelines of The Regulations on Administration of the Institute of Laboratory Animal Science, Jinan University, were followed in this study. All rats were reared in individual cages; the temperature was maintained at 20°C–25°C and the relative humidity at 30%–50%. All surgical procedures were performed under intraperitoneal anesthesia induced with pentobarbital sodium (30 mg/kg). A phytoestrogen-free diet and tap water were available ad libitum. To establish the postmenopausal osteoporosis animal model, the 39 female rats were subjected to ovariectomy and three animals were sacrificed at 14 weeks after ovariectomy (ie, at the time of implant surgery) to confirm the degree of reduced bone mineral density of the ovariectomized rats. The bone mineral density of the tibia compartment in the knee joint was compared to that of the three otherwise identical animals that had not undergone ovariectomy.
In both rat models, the following four groups of Ti specimens (5×1×0.1 mm) were used for implantation in the rat tibia: NT-SVTCPM (n=3), NT-SVPM (n=3), NT (n=3) as the positive control, and PT (n=3) as the negative control. These were labeled as NT-SVTCPM1 for the normal model and NT-SVTCPM2 for the ovariectomized rat models.
The implants were inserted into the middle tibia on the right side of each rat. Under intraperitoneal anesthesia induced with pentobarbital sodium (30 mg/kg), after incision and dissection of the skin, muscle, fascia, and periosteum in the inner side of the right leg, a 5×1×0.5 mm bone-defect groove (a wall of bone defect) was made in the middle tibia, using handheld drills moving parallel to the longitudinal axis of the tibia. A Ti specimen serving as the implant was then horizontally placed into the bone groove ensuring contact with the undersurface as well as the upper and the lower ends of the bone groove. Dental resin was used to wrap the tibial groove with a collagen membrane covering to fix the Ti specimens in place, followed by wound stitching. Antibiotics (penicillin and streptomycin, 50,000 U/kg) were administered subcutaneously daily on the first 3 postoperative days. Postoperative antibiotic treatment was administered according to the body weight by injection into the rats twice daily for 4 days.
Microcomputed tomography (m-CT) analysis
m-CT was performed using the ZKKS-MCT-Sharp apparatus (Guangzhou Zhongke Kaisheng Medical Technology Company, Guangzhou, People’s Republic of China), operating with an anode electrical current of 60 kV with an aluminum filter for elimination of the hardening beam at a resolution of 20 μm. The normal rats in each group at 1, 2, and 4 weeks after implantation and the ovariectomized rats in each group at 2, 4, and 8 weeks after implantation were sacrificed, and the legs were scanned by m-CT to evaluate the bone–implant contact changes. Regions of interest (ROI) that included the tibia compartment around the implants and in the knee joint were selected. After scanning, three-dimensional (3D) models were generated and trabecular analysis of the tibia compartment in the knee joint was analyzed using a medical image-processing and analyzing program (Medproject; Guangzhou Zhongke Kaisheng Medical Technology Company). Bone volume to TV (BV/TV) of ROI for the tibia compartment in the knee joint was calculated as a typical indicator for trabecular analysis, which was always used to evaluate relative changes in BV density following a given treatment.
Western blot analysis
Western blotting was performed to measure the protein expression of BMP-2 in the bone tissue in the implantation region. The protein content was extracted from the rat bone tissue of the subject rats at 2 and 4 weeks after implantation. A small sample of fresh bone tissue was lysed with a lysis buffer containing protease inhibitors accompanied by 3–5 min of homogenization. The subsequent procedures were as described earlier in the “Western blot analysis” section regarding in vitro.
Statistical analysis
Data were expressed as mean ± standard deviation and the mean ± standard error of the mean. Statistical analysis was performed with a factorial-designed ANOVA using the IBM SPSS Statistics 21.0 (International Business Machines Corp., Armonk, NY, USA). The Levene’s test for homogeneity of variance was used followed by a pairwise comparison by the Bonferroni test in the case of homogeneity variance or by Tamhane’s T2 test in the case of heterogeneity of variance. Differences were considered significant when the P-value was <0.05.
Results
Characterization of the TC–PECL polymer
TC–PECL was successfully synthesized by the conjugation of –OH on TC and –NCO on NCO–PEG–PCL (OCH3) groups. To characterize the TC–PECL polymer, the product was evaluated by 1H-NMR spectroscopy. As shown in Figure 2, the 1H-NMR spectra revealed peaks at 1.5–3.0 and 6.5–7.5 ppm that corresponded to the hydrogen atoms of the benzene ring of TC, a peak at 3.5–4.0 ppm representing the hydrogen atoms of the PEG copolymers, as well as the peak at 3.5–4.0 ppm representing the hydrogen atoms of the PCL copolymers.
Properties of TC–PECL micelles
Characterization of TC–PECL micelles
Table 1 lists the hydrodynamic diameter and PDI of micelles from different ratios of SV/TC–PECL in addition to SV/PECL as a control. The SV loading caused an increase in size, most likely because of a change in the micellar structure caused by the SV enclosed in the hydrophobic core of the micelles. The mean diameter of the micelles produced from 10% SV/TC–PECL copolymer was ~76 nm with a narrow distribution in size, whereas that from 10% SV/PECL copolymer was ~64 nm. For both TC–PECL and PECL micelles; however, no obvious change was observed in the narrow size distributions of micelles upon SV loading. TEM images of SV-loaded micelles are shown in Figure 3A. The micelles were sparsely scattered and nearly spherical in shape. The SV-loaded TC–PECL micelle sizes in the TEM were ~80 nm, which was consistent with the dynamic light-scattering determination. In this study, SV-loaded TC–PECL micelles produced from 10% SV/TC–PECL with DL and EE of 9.1% and 91%, respectively, with a zeta potential of −40.9 and pH value of 6.8 were selected for the in vitro release test and cytological and in vivo experiments. SV-loaded PECL micelles produced from 10% SV/PECL with DL and EE of 8.7% and 87%, respectively, with a zeta potential of −45.8 and pH value of 7.2 were applied as a control. These DL and EE values accounted for the higher loading capacity of TC–PECL micelles than that of PECL micelles.
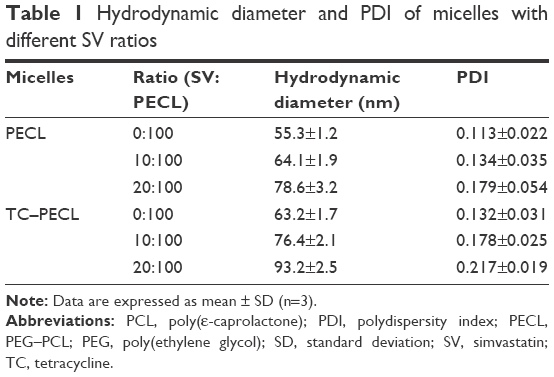 | Table 1 Hydrodynamic diameter and PDI of micelles with different SV ratios |
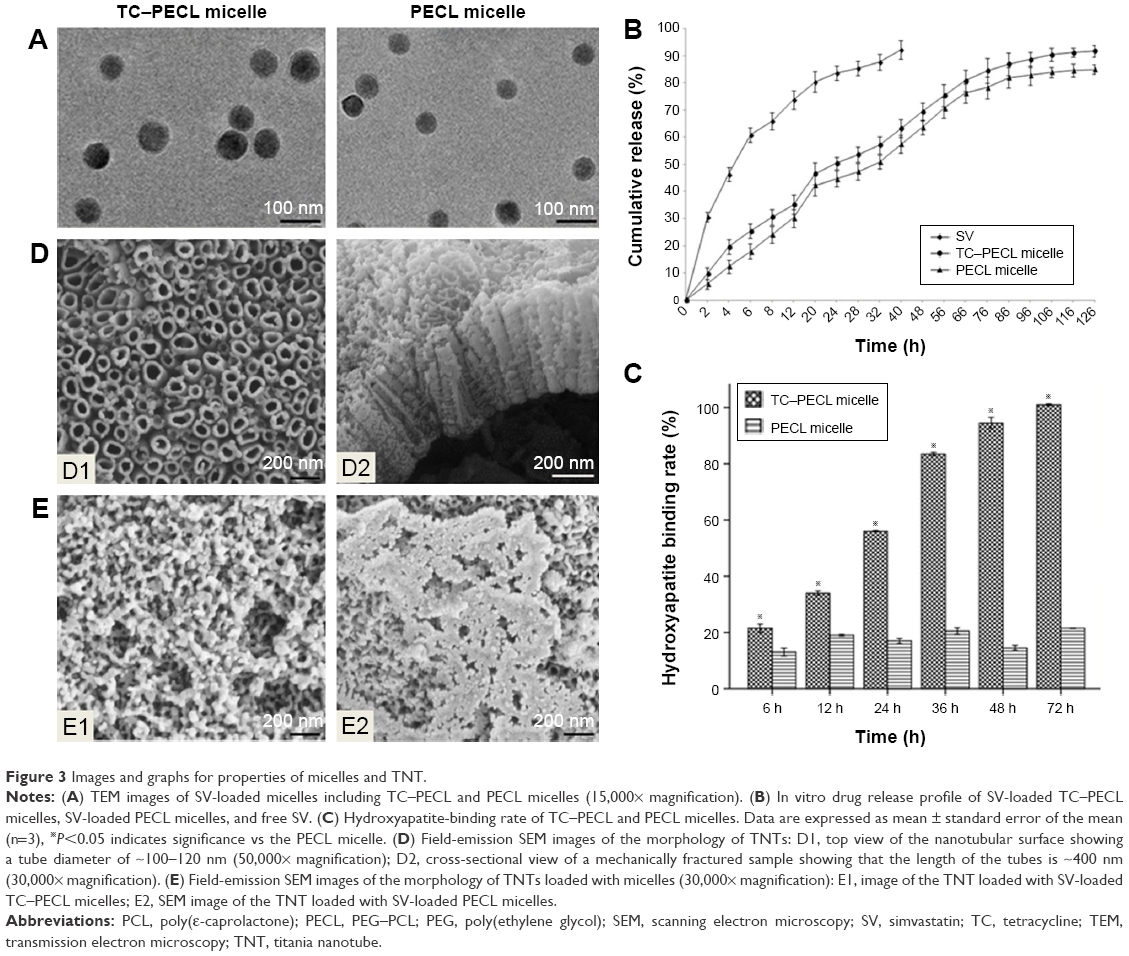 | Figure 3 Images and graphs for properties of micelles and TNT. |
In vitro SV release
The cumulative release profiles of SV from drug-loaded micelles are shown in Figure 3B. A typical sustained-release profile for the micelle solution was observed, indicating that a sustained and slow release of the drug over a prolonged period of time was achieved. TC–PECL micelles exhibited a cumulative drug release of 91.7% or so during a 126 h time span, whereas PECL micelles showed ~84.9% release within the same time span. There were no significant differences in cumulative drug release between SV-loaded TC–PECL micelles produced from 10% SV/TC–PECL and SV-loaded PECL micelles from 10% SV/PECL (P>0.05).
Hydroxyapatite-binding rate of micelles
As shown in Figure 3C, the hydroxyapatite-binding rate of TC–PECL micelles increased with the time extension and reached 100% at 72 h; however, the rate of PECL micelles remained under 21.5%.
Morphology of TNT arrays and TNTs loaded with micelles
The morphologies of the TNT arrays and TNTs loaded with micelles were characterized by field-emission SEM and are shown in Figure 3D. A typical cross-sectional image of free-standing TNT structures, removed from the Ti substrate for imaging purposes, is presented. A high-resolution image of the cross-sectional SEM image of the TNT layer shows a vertically aligned and densely packed array of TNTs across the entire structure. SEM images of the top of the TNT surface (Figure 3D1) shows the presence of pores with diameters of ~100–120 nm and a tube wall thickness of ~15–20 nm. A side view of the TNTs (Figure 3D2) indicates that the thickness of the TNT layer is ~400 nm. Compared to our previous study, the diameters of the TNTs were increased to 100–120 nm to load the micelles, which exhibit diameters of ~80 nm, more effectively. The SEM image of the TNT loaded with SV-loaded TC–PECL micelles is shown in Figure 3E1, which illustrates that the TNT pores were covered by granular drug deposits. An image of the TNT loaded with SV-loaded PECL micelles is shown in Figure 3E2, showing that the TNT pores were covered by drug sediments gathering together into flakes.
Cytological tests
FAM-siRNA transfection test
Visualization of micelle cellular uptake was obtained through FAM-siRNA transfection. As shown in Figure 4, the overlaid microscopy images of treated cells indicated that the FAM-siRNA appeared as green fluorescence inside the cells. At the earliest, SVTCPM with electrostatic adhesion of FAM-siRNA fluorescence achieved entry into the cells at the 2 h time point. At 3 h, the fluorescence associated with NT-SVTCPM had entered the cells, whereas in SVPM and NT-SVPM, intracellular fluorescence was observed for the first time at the 6 h time point, at which time the fluorescence intensity for SVTCPM and NT-SVTCPM reached its highest levels. At 12 h, the fluorescence intensity in NT-SVTCPM and NT-SVPM was reduced because of fluorescence quenching effects; a small amount of fluorescence was also observed inside the cells in the BK group at this time because of cell phagocytosis. Therefore, the fluorescence entry into the cells in the SVTCPM and NT-SVTCPM groups occurred earlier and faster than in the SVPM and NT-SVPM groups.
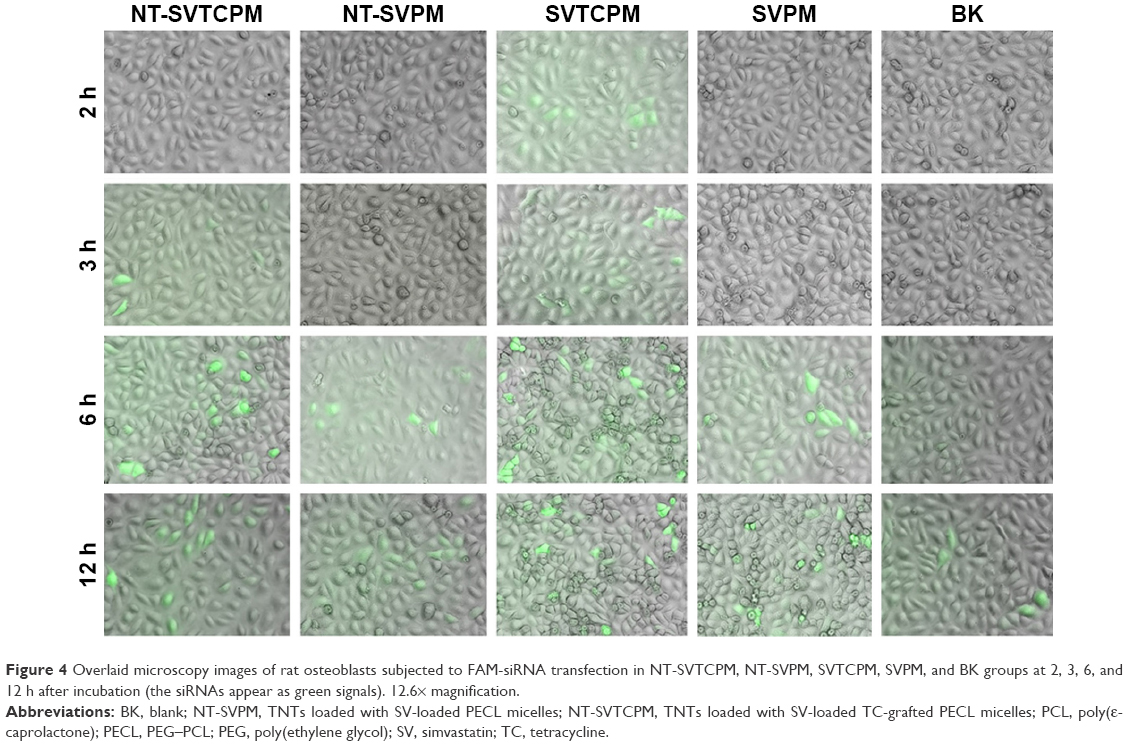 | Figure 4 Overlaid microscopy images of rat osteoblasts subjected to FAM-siRNA transfection in NT-SVTCPM, NT-SVPM, SVTCPM, SVPM, and BK groups at 2, 3, 6, and 12 h after incubation (the siRNAs appear as green signals). 12.6× magnification. |
Cytoskeletal arrangement and early cell adhesion
Cytoskeletal arrangement
The results of immunofluorescence staining of rat osteoblasts cultured on the surfaces of Ti samples are shown in Figure 5. Actin, which is the major cytoskeleton protein around the blue nuclei, was stained red. After 2 h of incubation, most of the cells on the NT-SVTCPM and NT-SVPM surfaces had spread and acquired a bipolar, tripolar, or multipolar shape, accompanied by bundling of the actin filaments; whereas on the NT and on the PT surface, most or just a small fraction of the cells, respectively, had begun to spread accompanied by the presence of sparse filopodia (Figure 5A1–D1). At 6 h after seeding (Figure 5A2–D2), the cells on the NT-SVTCPM and NT-SVPM surfaces had extended into a triangular or polygonal shape; simultaneously, the actin filaments that had been organized in well-defined stress fibers were mostly arranged along the major cellular axis. In contrast, on the NT and PT surfaces, most of the cells had spread into spindle, triangular, or polygonal shapes, wherein the actin was organized along the spreading direction and had formed a number of filopodia. As shown in Figure 5A3–D3, by 12 h, cells on the different surfaces were well extended. After 24 h of incubation, cells on the different surfaces had spread out to a flat shape and stacked together (Figure 5A4–D4). Therefore, compared to the NT and PT surfaces, cell spreading on the NT-SVTCPM and NT-SVPM surfaces was more rapid.
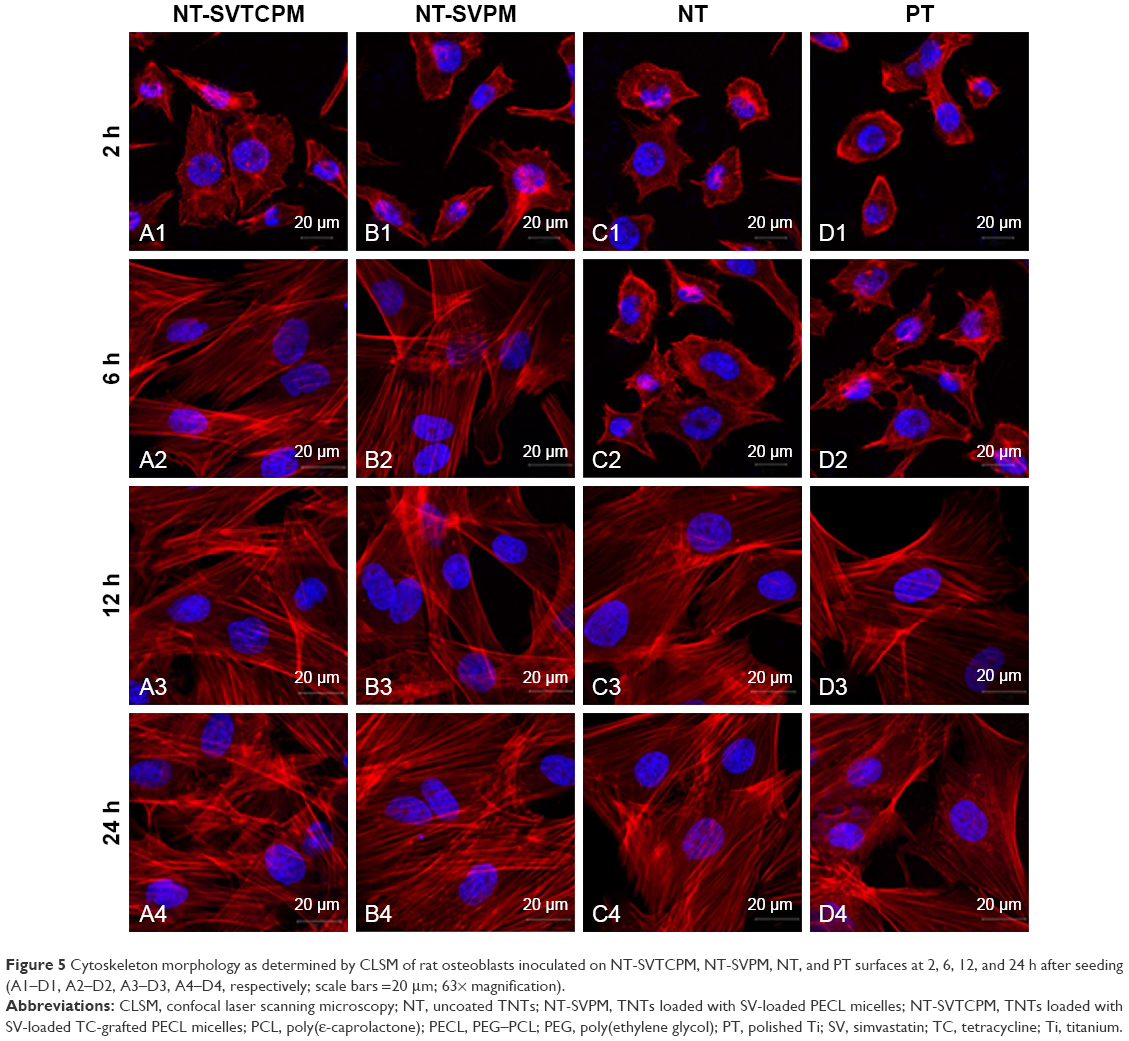 | Figure 5 Cytoskeleton morphology as determined by CLSM of rat osteoblasts inoculated on NT-SVTCPM, NT-SVPM, NT, and PT surfaces at 2, 6, 12, and 24 h after seeding (A1–D1, A2–D2, A3–D3, A4–D4, respectively; scale bars =20 μm; 63× magnification). |
Early cell adhesion
As presented in Figure 6A1, blue nuclei were directly counted on different fluorescently stained images at 126× magnification. Next, the adhesion rates of the different cells were calculated to compare the attachment of cells on different surfaces over a 6 h period, as shown in Figure 6A2. Observations after 1, 2, or 6 h of incubation indicated that the adhesion rate of cells on the NT-SVTCPM, NT-SVPM, NT, and PT surfaces gradually increased over time (P<0.05). At 1 h after seeding, the adhesion rate of the cells on NT-SVTCPM was the highest followed by NT-SVPM among the different surfaces (P<0.05). At 2 h after seeding, a higher adhesion rate was observed for cells on the NT-SVTCPM and NT-SVPM surfaces than on the NT and PT surfaces (P<0.05). No difference in the adhesion rate among the NT-SVTCPM, NT-SVPM, NT, and PT surfaces was observed after 6 h of incubation (P>0.05).
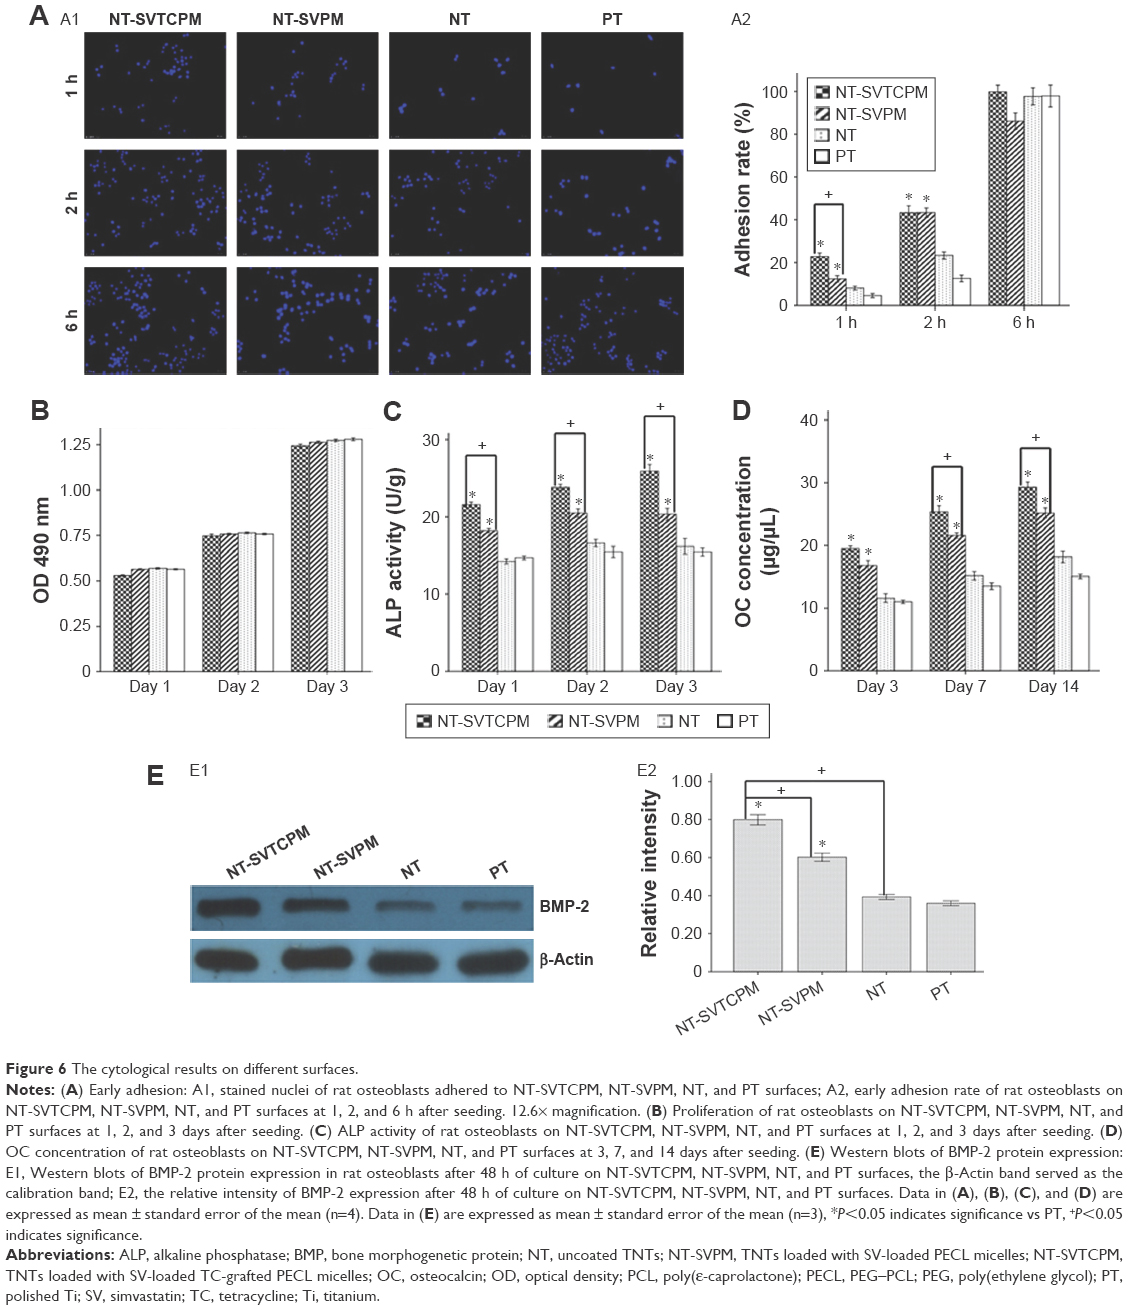 | Figure 6 The cytological results on different surfaces. |
Cell proliferation
Cell proliferation was evaluated by the MTS assay; the results are shown in Figure 6B. No significant difference in the proliferative activity of cells was observed among the groups at 1, 2, and 3 days of incubation (P>0.05). The proliferative activities of cells on the NT-SVTCPM, NT-SVPM, NT, and PT surfaces increased over time with significant differences among 1, 2, and 3 days after seeding (P<0.05).
ALP activity
ALP activity was determined to detect the early differentiation of cells on the different surfaces. As shown in Figure 6C, at 1, 2, and 3 days after seeding, the cells on the NT-SVTCPM surface demonstrated the highest ALP activity, followed by those on the NT-SVPM surface (P<0.05). No significant differences were found between the NT and PT surfaces (P>0.05). The ALP activity of cells on the NT-SVTCPM surfaces at 3 days after seeding were higher than that at 1 day after seeding (P<0.05), whereas no significant differences were found among different times on the NT-SVPM, NT, or PT surfaces (P>0.05).
OC concentration
The OC concentration is shown in Figure 6D. At 3 days after seeding, the cells on the NT-SVTCPM and NT-SVPM surfaces exhibited higher OC concentrations than those on the NT and PT surfaces (P<0.05). At 7 and 14 days after seeding, the cells on the NT-SVTCPM surface demonstrated the highest OC concentration, followed by those on the NT-SVPM surface (P<0.05). The OC concentrations of cells on the NT-SVTCPM and NT-SVPM surfaces increased over time with significant differences among 1, 2, and 3 days after seeding (P<0.05).
BMP-2 expression in rat osteoblasts in vitro
The protein expression level of BMP-2 in the rat osteoblasts cultured on different surfaces at 2 days after seeding was determined by Western blot analysis. The photodensity scanning profiles of SDS-polyacrylamide gel electrophoresis (PAGE) for BMP-2 (Figure 6E1) indicate that the greatest photodensity was shown in the NT-SVTCPM group and the second highest photodensity was shown in the NT-SVPM group (P<0.05). The densitometry values of the BMP-2 bands normalized to the β-Actin bands are shown in Figure 6E2. The protein expression of BMP-2 in the NT-SVTCPM group was the highest, followed by that in the NT-SVPM group (P<0.05). There was no difference between the NT and BK groups (P>0.05).
In vivo tests
m-CT analysis
This study examined whether the NT-SVTCPM and NT-SVPM surfaces influenced local bone regeneration and osseointegration on a wall of bone defect at the implant site in the middle tibia of the normal and ovariectomized rat models. m-CT analysis of the three ovariectomized animals sacrificed at 14 weeks after ovariectomy (equivalent to the time of implant surgery) showed significantly lower BV/TV ratio when compared to three animals that had not undergone ovariectomy, confirming that the osteoporosis animal model had been successfully created (Figure 7). In both normal and ovariectomized models, NT-SVTCPM, NT-SVPM, NT, and PT implants were inserted into the site of a one-wall bone defect in the tibia. For in vivo implantation in normal rats, a 1-month period was allowed for complete healing, whereas a 2-month period was allowed for ovariectomized rats.
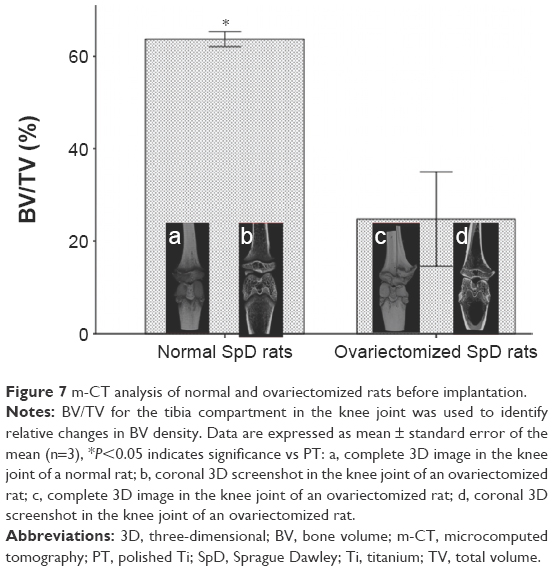 | Figure 7 m-CT analysis of normal and ovariectomized rats before implantation. |
m-CT analysis was carried out for the structural assessment of new bone formation at the implantation site and the quantitative assessment of BV density postimplantation near the implantation site. The BV/TV ratio was used to identify relative changes in BV density after implantation in normal and ovariectomized rats. 3D and two-dimensional (2D) m-CT images showed the integral and a cross-section of the morphology of bone formation, respectively, around the implants on different days.
As shown in Figure 8A, the m-CT images for normal rats clearly demonstrated new bone formation around the implant site in a time-dependent manner after implantation. At the first week postimplantation, different degrees of new bone formation connecting the implant inner surface and the defect undersurface were observed, in which the NT-SVTCPM1 implant exhibited the tightest anchorage. At 2 weeks postimplantation, images showed that the new bone formation partly overlaid the outer surface of the NT-SVTCPM1 implant only, with more new bone was observed connecting the implant inner surface and the defect undersurface in the other three groups. At 4 weeks postimplantation, the images showed thick new bone formation overlaying all of the outer surface of the NT-SVTCPM1 implant; in particular, the 2D images showed new bone surrounding the two surfaces and two ends of the implant. In comparison, in the other three groups, the 2D images illustrated that new bone surrounded the inner surface and one end of the implant. As shown in Figure 8B, the BV/TV ratio in the NT-SVTCPM1 group was higher than that in the PT1 group (P<0.05), indicating the significant increase in BV density in the NT-SVTCPM1 group. No differences were observed among the NT-SVPM1, NT1, and PT1 groups (P>0.05).
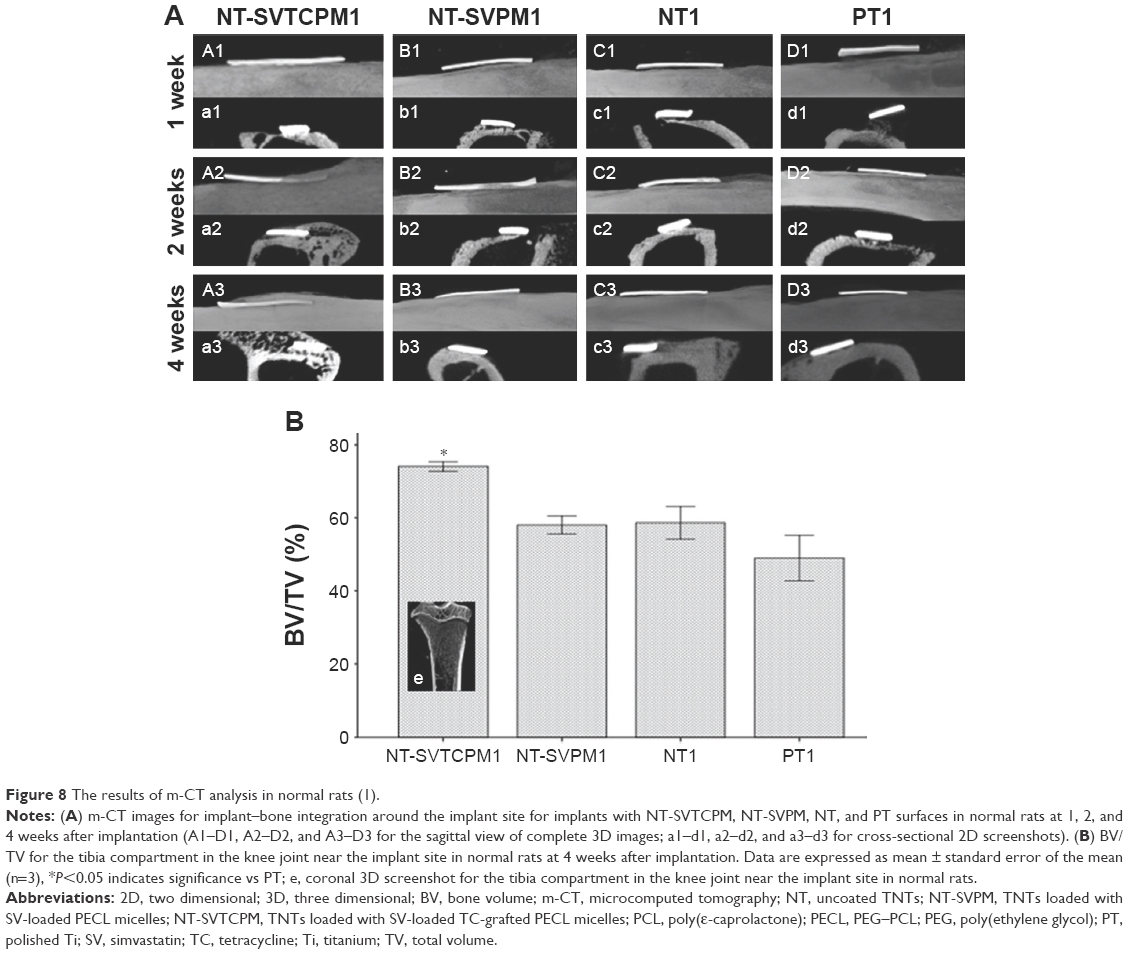 | Figure 8 The results of m-CT analysis in normal rats (1). |
In the m-CT images of the ovariectomized rats, the formation of new bone around the implant site in a time-dependent manner after implantation was only observed in the NT-SVTCPM2 group and the successful anchorage of the implant was not apparent until 4 weeks postimplantation. Furthermore, thin new bone formation almost overlaid the outer surface until 8 weeks postimplantation (Figure 9A [A1–A3, a1–a3]). In the NT-SVPM2 group, only a small amount of new bone tissue connecting some part of the implant inner surface and the defect undersurface was observed (Figure 9A [B1–B3, b1–b3]), whereas no new bone was found between the implant and the defect undersurface in the NT and PT groups. At 8 weeks postimplantation for the ovariectomized rats, as shown in Figure 9B, the BV/TV ratio in the NT-SVTCPM2 group was higher than that in the PT group (P<0.05), which indicated the significant increase in BV density in the NT-SVTCPM2 group. No significant differences among the NT-SVPM2, NT2, and PT2 groups were observed (P>0.05).
 | Figure 9 The results of m-CT analysis in ovariectomized rats (2). |
BMP-2 protein expression in the rat osteoblasts in vivo
The protein expression levels of BMP-2 in the rat osteoblasts obtained from the bone tissue around the implants in the different groups at 2 and 4 weeks postimplantation in vivo were determined by Western blot analysis. The photodensity scanning profiles of SDS-PAGE for BMP-2 (Figure 10A) indicate that there were significant differences between normal and ovariectomized rats at both 2 and 4 weeks postimplantation. Among the different normal rat groups, the greatest photodensity was shown in the NT-SVTCPM1 group; similarly, the highest photodensity among the ovariectomized rat groups was shown in NT-SVTCPM2 (P<0.05). The BMP-2 band density values normalized to those of β-Actin are represented in Figure 10B. BMP-2 expression in the NT-SVTCPM1 and NT-SVTCPM2 groups was the highest among the different groups for the normal and ovariectomized rats, respectively (P<0.05). Among the normal rat groups, BMP-2 expression in the NT-SVPM1 group was higher than that in the PT group (P<0.05), whereas there was no difference between that in the NT-SVPM1 and NT1 groups (P>0.05).
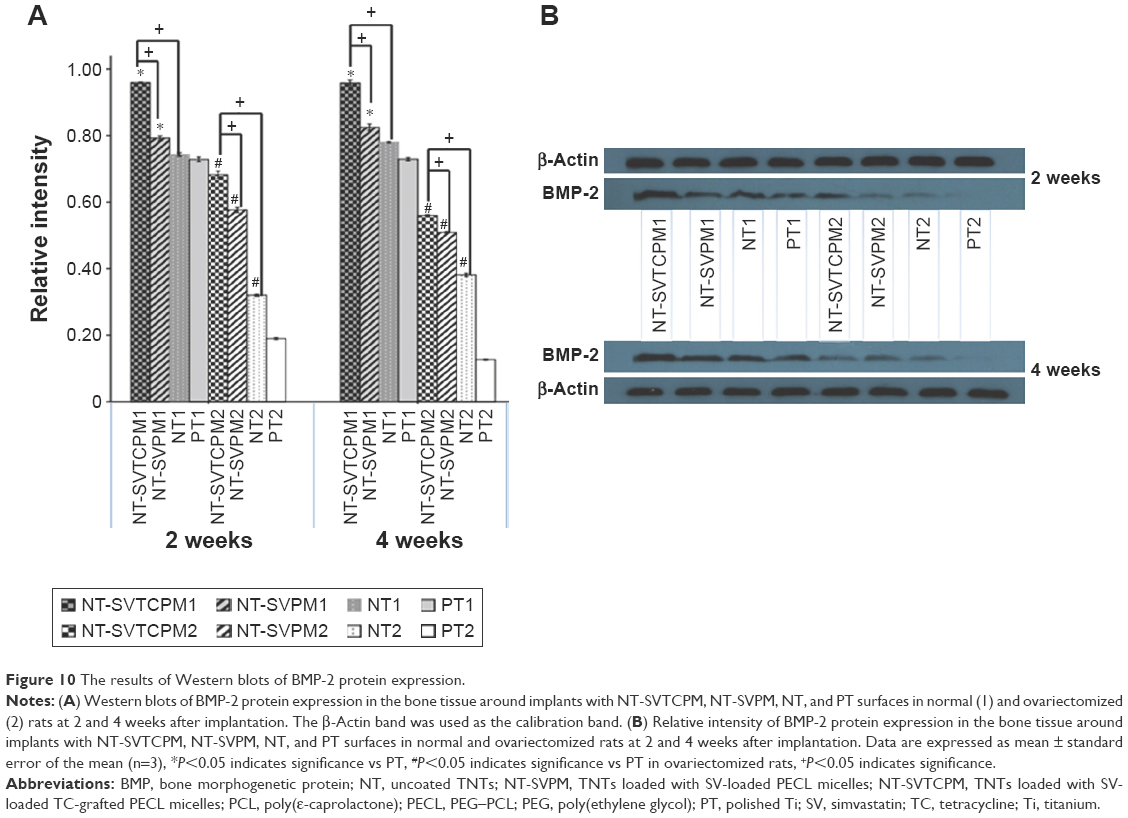 | Figure 10 The results of Western blots of BMP-2 protein expression. |
Discussion
In this study, TC-grafted SV-loaded polymeric micelles were prepared and loaded in TNT arrays to develop a dual-controlled, local, bone-targeting delivery system, and this system was implanted in vivo to develop a bone-targeting Ti implant–bone interface. In vitro and in vivo testing demonstrated good biological effects of the local bone-targeting delivery system; in particular, improvements in local bone regeneration and osseointegration in normal and postmenopausal osteoporosis models were highlighted in the bone-targeting Ti implant–bone interface.
First, the TC-grafted polymer was successfully synthesized as all of the expected molecular characteristics were observed in the 1H-NMR spectra, which indicated that the carboxyl group of PECL had conjugated with the hydroxyl group of TC. Second, TC-grafted SV-loaded polymeric micelles were prepared, and the in vitro release experiment indicated that they could provide a sustained release of SV and that the TC graft could be considered to have no effect on drug release. The results of hydroxyapatite binding assay indicated that after grafting, TC was able to maintain its affinity for hydroxyapatite and that, in addition, the bone-targeting ability of the TC–PECL micelles was improved. Third, TC-grafted SV-loaded polymeric micelles were loaded in TNT arrays fabricated by anodizing Ti sheets via a simplified drying method in a vacuum to produce a Ti implant surface with TNT-targeting micelles. The FAM-siRNA transfection test further demonstrated the bone-targeting effects of TNT-targeting micelles as indicated by the earlier and faster entry of the fluorescence into the cells in SVTCPM and NT-SVTCPM compared to that in SVPM and NT-SVPM. Furthermore, the time point for fluorescence entry in NT-SVTCPM was 1 h later than that in SVTCPM, which indicated that TNTs alone function in drug release. Overall, these findings confirmed that a new dual-controlled, local, bone-targeting delivery system for SV consisting of SV-loaded TNTs-targeting micelles was successfully constructed. Therefore, in vitro experiments were prepared to evaluate the biological effects and provide experimental evidence supporting the use of this system in an effective bone-targeting implant–bone interface in vivo.
In this study, cytoskeletal arrangement, early adhesion, proliferation, ALP activity, and extracellular OC concentration of rat osteoblasts on Ti surfaces engineered with TNT-targeting micelles were detected through cytological experiments. Notably, for the initiation of bone matrix synthesis, the Ti surface must first be colonized by bone cells. To investigate this phenomenon, a series of changes in the cytoskeletal arrangement of osteoblasts ranging from attachment on the surfaces of the Ti samples to complete spreading was observed by CLSM with immunofluorescence staining. Compared with the NT and PT surfaces, cell spreading on the NT-SVTCPM and NT-SVPM surfaces was more rapid, which indicated that Ti surfaces with either SV-loaded TNT-targeting micelles or SV-loaded TNT micelles were able to promote the spreading of osteoblasts. In addition, the adhesion rate of osteoblasts on the NT-SVTCPM surface was the highest followed by that on the NT-SVPM surface at 1 h after seeding, implying that the Ti surface with SV-loaded TNT micelles could facilitate early cell adhesion that was further promoted by the presence of the targeting micelles. The results of cell proliferation implied that the cells did not experience cytotoxicity on each surface in the current study. ALP, an enzyme that marks the beginning of osteoblast differentiation, is beneficial for bone formation because it hydrolyzes phosphate esters and provides the required phosphate for the deposition of hydroxyapatite in the process of osteogenesis. The measured ALP activity indicated that the Ti surface with SV-loaded TNT-targeting micelles and with SV-loaded TNT micelles could contribute to the increase in ALP activity of rat osteoblasts from 1 to 3 days after inoculation, with the former contributing to a higher increase. Therefore, both surfaces were able to promote the osteoblast differentiation, with the former being more effective. In turn, OC is a noncollagenous protein that is synthesized and secreted specifically by osteoblasts, appears in the late phase of cell differentiation, and is a functional indicator reflecting calcification of the osteoblast extracellular matrix. The results indicated that the Ti surfaces with SV-loaded TNT-targeting micelles and, to lesser degree, those with SV-loaded TNT micelles were able to promote the secretion of OC, which enables OC to promote the calcification of the extracellular matrix and osteoblast maturation. Overall, the cytological results suggested that the dual-controlled, local, bone-targeting delivery system had the potential to construct the bone-targeting Ti implant–bone interface in vivo.
Previous studies had verified the positive effects of local application of SV, mostly on bone formation in the bone-defect model, but seldom on osseointegration related to endosseous implants.15,27,28,30 Considering that the concurrent observation of bone defects and implantation frequently occurred in clinical practice but lacked experiment evidence, this study attempted to develop a wall of bone-defect model of a Ti implant with a TNT-targeting micelle surface in the middle tibia region of normal and ovariectomized rats to probe the biological effects in vivo. Thus, the bone-targeting Ti implant–bone interface in vivo was constructed. m-CT imaging effectively measured the temporal process of tissue–implant integration in vivo and was beneficial for determining the accurate amount of bone formation around the implant surfaces.31 Hence, m-CT monitoring was used to evaluate bone integration on the implant–bone interface in the in vivo model. For a wall of bone-defect implantation model, the m-CT images clearly demonstrated that successful osseointegration surrounding the implant was only observed in the implant with the TNT-targeting micelle surface at 4 weeks postimplantation in the normal rats or at 8 weeks postimplantation in the ovariectomized rats. Furthermore, the results of BV/TV analysis, used to evaluate the relative changes in BV density, demonstrated the highest value of the ROI occurred near the implant with the TNT-targeting micelle surface in either the normal or ovariectomized rats. In addition, BMP-2 expression around the implant with the SV-loaded TNT-targeting micelle surface was far higher in both rat models than that around the implant with the other surfaces, which was consistent with the BMP-2 protein expression obtained in vitro.
In summary, the in vivo experiments demonstrated that loading of SV-loaded targeting micelles on the TNT surfaces of Ti implants increased osteogenesis and promoted osseointegration in a wall of bone-defect implantation model in both normal and ovariectomized rats, a model of postmenopausal osteoporosis. Thus, the bone-targeting Ti implant–bone interface was constructed, which was greatly beneficial to osseointegration. These effects were likely primarily associated with the increased BMP-2 expression caused by the sustained release of SV to the targeted bone tissue. The markedly enhanced performance of the SV-loaded TNT-targeting micelle surface, compared to the SV-loaded TNT micelle surface in vivo, was strongly complementary to the results obtained from in vitro experiments and might similarly be due to the targeting effects of micelles greatly enhancing the bioavailability of SV on the implant–bone interface.
Conclusion
In this study, a dual-controlled, local, bone-targeting delivery system was successfully constructed by loading TC-grafted SV-loaded polymeric micelles in TNT arrays, and a bone-targeting Ti implant–bone interface was also successfully constructed by implanting the delivery system in vivo. Good biological effects were demonstrated both in vitro and in vivo, which indicated that the bone-targeting effects of micelles greatly enhance the bioavailability of SV on the implant–bone interface, and the provision of SV-loaded targeting micelles alone exhibits the potential for extensive application in improving local bone regeneration and osseointegration, especially in osteoporotic subjects.
Acknowledgments
The authors gratefully acknowledge the assistance by Dr Shan Huang and Dr Xiaoli Gao. This work was supported by Natural Science Foundation of China for young scholars (81300908 and 81400557), National Natural Science Foundation Projects (81370971 and 81170998), the Fundamental Research Funds for the Central Universities (21615480), Guangdong Natural Science Funds for Distinguished Young Scholar (S2013050013880), Natural Science Foundation of Guangdong Province (S2013040014986), Guangdong Science and Technology Foundation (2012B061700091 and 2014A020212634), Medical Scientific Research Foundation of Guangdong Province (C2012034 and 2013B010404032), Guangzhou TianHe Science and Development Project (201504KW020), and Scientific Cultivation Foundation of the First Affiliated Hospital of Jinan University (2015212).
Disclosure
The authors report no conflicts of interest in this work.
References
Qiao Y, Zhang W, Tian P, et al. Stimulation of bone growth following zinc incorporation into biomaterials. Biomaterials. 2014;35(25): 6882–6897. | ||
Fini M, Giavaresi G, Torricelli P, et al. Osteoporosis and biomaterial osteointegration. Biomed Pharmacother. 2004;58(9):487–493. | ||
Makinen TJ, Alm JJ, Laine H, Svedstrom E, Aro HT. The incidence of osteopenia and osteoporosis in women with hip osteoarthritis scheduled for cementless total joint replacement. Bone. 2007;40(4):1041–1047. | ||
Gaetti-Jardim EC, Santiago-Junior JF, Goiato MC, Pellizer EP, Magro-Filho O, Jardim Junior EG. Dental implants in patients with osteoporosis: a clinical reality. J Craniofac Surg. 2011;22(3):1111–1113. | ||
Marco F, Milena F, Gianluca G, Vittoria O. Peri-implantosteogenesis in health and osteoporosis. Micron. 2005;36(7–8):630–644. | ||
Shibli JA, Aguiar KC, Melo L, et al. Histological comparison between implants retrieved from patients with and without osteoporosis. Int J Oral Maxillofac Surg. 2008;37(4):321–327. | ||
Qi M, Hu J, Li J, et al. Effect of zoledronate acid treatment on osseointegration and fixation of implants in autologous iliac bone grafts in ovariectomized rabbits. Bone. 2012;50(1):119–127. | ||
Sun YS, Liu JF, Wu CP, Huang HH. Nanoporous surface topography enhances bone cell differentiation on Ti–6Al–7Nb alloy in bone implant applications. J Alloys Compd. 2015;643(23):S124–S132. | ||
Kim SE, Kim CS, Yun YP, et al. Improving osteoblast functions and bone formation upon BMP-2 immobilization on titanium modified with heparin. Carbohydr Polym. 2014;114:123–132. | ||
Andersen OZ, Offermanns V, Sillassen M, et al. Accelerated bone ingrowth by local delivery of strontium from surface functionalized titanium implants. Biomaterials. 2013;34(24):5883–5890. | ||
Liu X, Li X, Li S, et al. An in vitro study of a titanium surface modified by simvastatin-loaded titania nanotubes-micelles. J Biomed Nanotechnol. 2014;10(2):194–204. | ||
Feng W, Geng Z, Li Z, et al. Controlled release behaviour and antibacterial effects of antibiotic-loaded titania nanotubes. Mater Sci Eng C Mater Biol Appl. 2016;62:105–112. | ||
Kheirallah M, Almeshaly H. Simvastatin, dosage and delivery system for supporting bone regeneration, an update review. J Oral Maxillofac Surg Med Pathol. 2016;28(3):205–209. | ||
Wu Z, Liu C, Zang G, Sun H. The effect of simvastatin on remodelling of the alveolar bone following tooth extraction. Int J Oral Maxillofac Surg. 2008;37(2):170–176. | ||
Papadimitriou K, Karkavelas G, Vouros I, Kessopoulou E, Konstantinidis A. Effects of local application of simvastatin on bone regeneration in femoral bone defects in rabbit. J Craniomaxillofac Surg. 2015;43(2):232–237. | ||
Sukul M, Min YK, Lee SY, Lee BT. Osteogenic potential of simvastatin loaded gelatin-nanofibrillar cellulose-b tricalcium phosphate hydrogel scaffold in critical-sized rat calvarial defect. Tissue Eng Part A. 2015;21: 1822–1836. | ||
Tao ZS, Zhou WS, Tu KK, et al. The effects of combined human parathyroid hormone (1–34) and simvastatin treatment on osseous integration of hydroxyapatite-coated titanium implants in the femur of ovariectomized rats. Injury. 2015;46(11):2164–2169. | ||
Yin H, Li J, Yu X, Fu Z. Effects of simvastatin on osseointegration in a canine total hip arthroplasty model: an experimental study. J Arthroplasty. 2011;26(8):1534–1539. | ||
Liu X, Li X, Zhou L, et al. Effects of simvastatin-loaded polymeric micelles on human osteoblast-like MG-63 cells. Colloids Surf B Biointerfaces. 2013;102:420–427. | ||
Neale JR, Richter NB, Merten KE, et al. Bone selective effect of an estradiol conjugate with a novel tetracycline-derived bone-targeting agent. Bioorg Med Chem Lett. 2009;19(3):680–683. | ||
Chopra I, Hawkey PM, Hinton M. Tetracyclines, molecular and clinical aspects. J Antimicrob Chemother. 1992;29(3):245–277. | ||
Gu Y, Lee HM, Sorsa T, et al. Non-antibacterial tetracyclines modulate mediators of periodontitis and atherosclerotic cardiovascular disease: a mechanistic link between local and systemic inflammation. Pharmacol Res. 2011;64(6):573–579. | ||
Luhmann T, Germershaus O, Groll J, Meinel L. Bone targeting for the treatment of osteoporosis. J Control Release. 2012;161(2):198–213. | ||
Wang D, Miller SC, Kopecková P, Kopecek J. Bone-targeting macromolecular therapeutics. Adv Drug Deliv Rev. 2005;57(7):1049–1076. | ||
Newman MR, Benoit DS. Local and targeted drug delivery for bone regeneration. Curr Opin Biotechnol. 2016;40:125–132. | ||
Wang H, Liu J, Tao S, et al. Tetracycline-grafted PLGA nanoparticles as bone-targeting drug delivery system. Int J Nanomedicine. 2015;10:5671–5685. | ||
Liu X, Zhou X, Li S, et al. Effects of titania nanotubes with or without bovine serum albumin loaded on human gingival fibroblasts. Int J Nanomedicine. 2014;9:1185–1198. | ||
Eskandarloo H, Hashempour M, Vicenzo A, et al. High-temperature stable anatase-type TiO2 nanotube arrays: a study of the structure–activity relationship. Appl Catal B Environ. 2016;185:119–132. | ||
Zhang Y, Han Y, Zhang L. Interfacial structure of the firmly adhered TiO2 nanotube films to titanium fabricated by a modified anodization. Thin Solid Films. 2015;583:151–157. | ||
Chang PC, Chong LY, Dovban AS, et al. Sequential platelet derived growth factor – simvastatin release promotes dentoalveolar regeneration. Tissue Eng A. 2014;20(1–2):356–364. | ||
Lee YH, Bhattarai G, Park IS, et al. Bone regeneration around N-acetyl cysteine-loaded nanotube titanium dental implant in rat mandible. Biomaterials. 2013;34(38):10199–10208. |
 © 2016 The Author(s). This work is published and licensed by Dove Medical Press Limited. The
full terms of this license are available at https://www.dovepress.com/terms
and incorporate the Creative Commons Attribution
- Non Commercial (unported, 3.0) License.
By accessing the work you hereby accept the Terms. Non-commercial uses of the work are permitted
without any further permission from Dove Medical Press Limited, provided the work is properly
attributed. For permission for commercial use of this work, please see paragraphs 4.2 and 5 of our Terms.
© 2016 The Author(s). This work is published and licensed by Dove Medical Press Limited. The
full terms of this license are available at https://www.dovepress.com/terms
and incorporate the Creative Commons Attribution
- Non Commercial (unported, 3.0) License.
By accessing the work you hereby accept the Terms. Non-commercial uses of the work are permitted
without any further permission from Dove Medical Press Limited, provided the work is properly
attributed. For permission for commercial use of this work, please see paragraphs 4.2 and 5 of our Terms.