Back to Journals » International Journal of Nanomedicine » Volume 18
Strategies and Progress of Raman Technologies for Cellular Uptake Analysis of the Drug Delivery Systems
Authors Liu Y, Li M, Liu H, Kang C, Yu X ![]()
Received 7 September 2023
Accepted for publication 6 November 2023
Published 20 November 2023 Volume 2023:18 Pages 6883—6900
DOI https://doi.org/10.2147/IJN.S435087
Checked for plagiarism Yes
Review by Single anonymous peer review
Peer reviewer comments 3
Editor who approved publication: Prof. Dr. RDK Misra
Yajuan Liu,1 Mei Li,2 Haisha Liu,2 Chao Kang,2 Xiyong Yu1
1Key Laboratory of Molecular Target & Clinical Pharmacology, and the NMPA & State Key Laboratory of Respiratory Disease, School of Pharmaceutical Sciences & the Fifth Affiliated Hospital, Guangzhou Medical University, Guangzhou, 511436, People’s Republic of China; 2School of Chemistry and Chemical Engineering, Guizhou University, Guiyang, 550025, People’s Republic of China
Correspondence: Chao Kang, Guizhou University, Guiyang, 550025, People’s Republic of China, Tel +008615285040313, Email [email protected] Xiyong Yu, Guangzhou Medical University (Panyu), Guangzhou, 511436, People’s Republic of China, Tel +008602037103261, Fax +008602037103261, Email [email protected]
Abstract: Nanoparticle (NP)-based drug delivery systems have the potential to significantly enhance the pharmacological and therapeutic properties of drugs. These systems enhance the bioavailability and biocompatibility of pharmaceutical agents via enabling targeted delivery to specific tissues or organs. However, the efficacy and safety of these systems are largely dependent on the cellular uptake and intracellular transport of NPs. Thus, it is crucial to monitor the intracellular behavior of NPs within a single cell. Yet, it is challenging due to the complexity and size of the cell. Recently, the development of the Raman instrumentation offers a versatile tool to allow noninvasive cellular measurements. The primary objective of this review is to highlight the most recent advancements in Raman techniques (spontaneous Raman scattering, bioorthogonal Raman scattering, coherence Raman scattering, and surface-enhanced Raman scattering) when it comes to assessing the internalization of NP-based drug delivery systems and their subsequent movement within cells.
Keywords: nanoparticle, spontaneous Raman scattering, coherence Raman scattering, surface-enhanced Raman scattering, drug delivery systems
Introduction
Drug delivery systems aim to enhance the pharmacological properties of conventional drugs, including pharmacokinetics, absorption rate, distribution, tissue targeting, and metabolism.1,2 Nanoparticles (NPs) are one of the most widely researched and utilized carriers in drug delivery systems due to their high potential.3 NPs enter cells through various endocytosis pathways, which plays a crucial role in determining their therapeutic efficacy, biodistribution, and toxicity.4 The intracellular fate and transport of NPs are also critical factors in the therapeutic effect, as they determine the delivery of drugs to specific subcellular organelles such as the cytoplasm, nucleus, Golgi apparatus, and endoplasmic reticulum.5 The cytotoxicity of NPs is also influenced by their internalization and intracellular fate. Hence, understanding the cellular uptake and intracellular transport of NPs is crucial for the safe and effective design of nanomedicine. Recent advances in chemical analysis and imaging have greatly contributed to the progress in understanding cellular uptake and intracellular transport.6,7 Some fluorescent probes have enabled dynamic imaging in living cells and animals, but the approach has several limitations, including toxicity, limited target linkages, and disruption of biological molecules.7–9 Under this circumstance, there is a growing need for imaging techniques to visualize cells and investigate the interactions between cells and NPs.
The Raman technique has garnered increasing attention for its role in analyzing cellular uptake and intracellular transport of NPs. This appeal arises from its label-free nature, high-throughput capability, excellent specificity, and straightforward sample preparation.10–12 Leveraging spontaneous Raman scattering (RS), these methods offer enhanced precision in investigating intricate cellular processes of NPs and drug.13 Through advancements in Raman instrumentation, insights into NPs and drug in the cellular and even subcellular components have been achieved by interpreting scattering data from cytoplasm, nucleus, and lipids as well as NPs and drug.14 Nonetheless, the sensitivity of spontaneous RS in cellular analysis remains comparatively limited.15 Consequently, cellular research increasingly turns to more sensitive techniques, including derivatives of RS such as Coherent Raman scattering (CRS) including coherent anti-Stokes Raman scattering (CARS)9,16 and stimulated Raman scattering (SRS),17,18 along with surface-enhanced Raman scattering (SERS).19,20 This is particularly evident in the study of uptake and intracellular fate of carrier systems. Notably, all these techniques fall under label-free and tag-based strategies. To enhance the selectivity of NPs and drugs, researchers have employs Raman tags which is also named bioorthogonal Raman spectroscopy (RS) to bolster molecular specificity in intricate cellular analyses.21 In the label-free approach, analyte fingerprints are acquired, encompassing a myriad of intertwined features originating from diverse biomolecules and materials within the drug delivery system.22 Extracting valuable biochemical insights embedded within this dataset often necessitates the application of multivariate analysis methods.23 The review embarks by addressing the heterogeneity of drug delivery systems and delves deep into the mechanisms underpinning cellular uptake and intracellular transport. Subsequently, it introduces and compares the fundamentals of the Raman technique and its derivatives, furnishing a comprehensive grasp of these methods. Ultimately, the spotlight shifts towards the exploration of the pivotal role played by multivariate analysis. Furthermore, this discourse delves into the challenges and prospects intertwined with the methodologies and advancements in Raman technologies for the analysis of cellular uptake of drug delivery systems. In contrast to other review papers24–27 in the field of Raman techniques, our review is centered on the most recent advancements in the analysis of cellular uptake within drug delivery systems. We specifically explore the application of various Raman techniques in this context and provide comparative insights based on their respective properties.
Drug Delivery Systems Based on Nanocarrier
NPs used in drug delivery systems can be made from a wide range of materials (Figure 1).28–31 Lipid-based NPs, for instance, are spherical structures composed of a lipid bilayer and include different forms, such as liposomes and micelles.32,33 Solid lipid nanoparticles consist of biodegradable solid lipids, boasting intriguing properties like small size, a large surface area, high drug loading capacity, and the potential for phase interactions at the interface. These attributes make them highly attractive for enhancing the performance of pharmaceuticals.34 Polymer-drug conjugates are another popular type of NPs used in drug delivery and offer the advantage of precise control of biocompatibility and formulation parameters.35,36 Nanocapsules, as a distinctive type of nanoparticle, exhibit a unique nanostructure characterized by a liquid or solid core encased within a polymeric shell.37 Additionally, inorganic materials are also used to prepare NPs of various shapes.38,39 Recently, it is popular to design NPs with different binding materials on their surface such greatly influence effectiveness.40 Overall, the characteristics of NPs significantly influence their uptake pathways and intracellular transport routes.41
 |
Figure 1 (a) Illustration of heterogeneity of drug delivery systems. From a material perspective, NPs can be constructed from lipids, polymers, and inorganic materials; In terms of shape, NPs can be designed into cube, sphere, rod, ellipse, star, and triangle; On the surface, surface-binding materials can be proteins, carbohydrates, antibodies, and polymers. These differences in NPs give rise to distinct characteristics, encompassing material composition, size, stiffness, porosity, morphology, and shape. (b) The mechanisms involved in cellular uptake and intracellular transport of NPs. The endocytosis of NPs encompasses two major pathways: phagocytosis and pinocytosis, which includes clathrin-mediated endocytosis, caveolin-mediated endocytosis, clathrin/caveolae-independent endocytosis, and micropinocytosis. Subsequently, there are three possible transport mechanisms for NPs inside cells: (1) Rapid recycling, (2) Release into the cytoplasm or nucleus, and (3) Degradation by lysosomes. Created with BioRender.com. |
NPs can be generally internalized into cells through the cellular membrane by endocytosis, which can be fundamentally sorted into two main groups: phagocytosis and pinocytosis (Figure 1).42,43 Phagocytosis generally describes the receptor-mediated engulfment of relatively large particles into phagosomes.44 On the other hand, pinocytosis encompasses clathrin-mediated endocytosis, caveolin-mediated endocytosis, clathrin/caveolae-independent endocytosis, and macropinocytosis.7 The uptake pathway depends on the specific characteristics of the NPs, which is often influenced by inhibitors that obstruct this pathway. For instance, clathrin-mediated endocytosis takes place at the clathrin-rich area of the plasma membrane.45
The intracellular transport of NPs following uptake affects their degradation within cellular compartments and ultimately determines their cytotoxicity and the drug therapeutic efficacy.42 Upon internalization across the cell membrane, NPs fuse with early endosomes and proceed through various pathways, primarily guided by a network of endosomes in collaboration with other subcellular organelles such as the Golgi apparatus, endoplasmic reticulum, and lysosomes.6,7 Lysosomes play a crucial role in the degradation process by fusing with matured late endosomes and releasing the breakdown products.46,47 Conversely, NPs can also undergo a rapid recycling pathway, leading to their release outside the cell. However, to persist within the cell, NPs must evade these two pathways and instead interact with specific subcellular organelles, such as the nucleus or Golgi apparatus.48
Raman Technology
Spontaneous Raman Scattering (RS)
The spontaneous RS occurs when a laser interacts with a target molecule (Figure 2).49 This interaction results in the emission of scattered light at altered wavelengths.27 The change in wavelength is related to the vibrational and rotational energy levels of the molecule, which provides information about the molecular identity.50 RS can be used to analyze the interaction of drug delivery systems with cells by measuring the spontaneous Raman response from the drug delivery systems and cellular components such as lipids, proteins, and nucleic acids.24,51,52 Contemporary confocal Raman microscopy boasts exceptional high-resolution imaging capabilities, facilitating the simultaneous detection of multiple cellular compartments without the need for labeling.14,53–55 The RS fingerprint contains various biochemical peaks of cellular components, including lipids, cytoplasm, and nucleic acids.56 For example, characteristic Raman peaks of proteins can be found at 618 (C-C twisting), 937 (C-C stretching), and 1083 (C-N stretching) cm−1, while peaks at 1340, 1458, 1576, and 1662 cm−1 can indicate the presence of nucleic acids (Figure 3).51,57 Additionally, the presence and content of lipids and related compounds can be evaluated based on the Raman peaks at 1754 (C=O), 1656 (C=C), 1440 (CH2 bend), and 1300 (CH2 twist) cm−1 58 (Figure 3). These characteristic bands in the fingerprint region provide valuable information about the biomolecules within the cell.53,54,59–62
 |
Figure 2 The interactions between light and molecular vibrations related to four types of Raman techniques including spontaneous RS, CARS, SRS, and SERS. ωp, ωs, and ωas represent the frequencies of the incident radiation, Stokes beam, and anti-Stokes beam, respectively. |
 |
Figure 3 Pure spectrum of lipid (red), protein (blue), RNA (cyan) and DNA (black). |
Lipid/protein ratio,63–65 nucleic acid-to-lipid ratio,66 and DNA/protein ratio67 have been used to indicate the cellular compartment scattering based on univariate analytical methods. For example, DNA/protein ratio was used to indicate the cellular uptake of the encapsulated doxorubicin inside poly (D,L-lactide-co-glycolide) (PLGA) NPs.67 At the single-cell level, the observation of changes in the bands of DNA and proteins within the cell nucleus, leading to a reduced DNA/protein ratio, strongly indicates DNA damage in the doxorubicin treated group. To be noted, we show the cellular uptake of NPs analysis based on various Raman techniques in Table 1. Another example is the tracking of PLGA NPs and their cargo of antibodies inside the cell.68 The spontaneous Raman response of the PLGA NPs, antibody, and lipid generated a cellular profile, and the concentration of the antibody was indicated by the Raman intensity. This implied that most of the encapsulated antibodies were released into the lipid-rich region or the cytoplasm of the cell. Several studies have demonstrated the usefulness of label-free RS for imaging and tracking the intracellular degradation of PLGA NPs. In addition to univariate analysis, multivariate analysis is commonly employed in RS analysis.14,69–71
 |
Table 1 Cellular Uptake Analysis of the Drug Delivery Systems Based on Various Raman Technologies |
For instance, in Figure 4A (i and iii), we can observe Raman images of two types of cells that were incubated with NPs for 1 and 3 hours, employing a conventional spectral unmixing algorithm.71 The uptake of these particles through endocytosis becomes distinctly evident after the initial 1-hour incubation period. Notably, there are small vesicle-like inclusions, measuring approximately 0.5–1 µm in size, dispersed throughout the cytosol. The Raman spectrum associated with the cytosol exhibits characteristic protein bands, displaying the typical Raman signatures of cells, including the amide I band at 1650 cm−1, methylene groups at 145 cm−1, and the phenylalanine ring at 1002 cm−1 71 (Figure 4A (ii and iv)). In a study by Chernenko et al, Vertex Component Analysis (VCA) was used to analyze the cellular uptake and intracellular delivery of C6-ceramide within modified PLGA NPs using label free Raman spectral data.72 The decomposed loadings and scores were based on the spectral matrix are expected to contain the spectral information of the pure components. The results based on VCA reveals that modified NPs were rapidly internalized in the cells, as depicted by overlaying pseudo-color images representing the concentration of cell body and nuclei, membrane-rich organelles, early endocytic vesicles, and NPs (Figure 4B). The scores resulting from VCA modeling showed the relative concentration of those components, which provided a superior image in terms of contrast and sharpness compared with the conventional fluorescence staining. The label free spectral model significantly indicated the intracellular accumulation of the PLGA NPs in the targeted cancer cells because of the surface peptide modification. RS provides valuable information about the NPs and cellular profile, including the presence and spatial distribution of specific molecules, such as proteins, lipids, nucleic acids, and other biomolecules. This allows researchers to gain insights into the metabolism of NPs. This makes it a powerful tool for real-time and dynamic observation of the cellular uptake analysis of the drug delivery systems.82,83
 |
Figure 4 Cellular uptake analysis of the drug delivery systems based spontaneous RS. (A) Raman images of two distinct cell types incubated with NPs for different durations: i) 1 hour and ii) 3 hours, are presented alongside their respective spectral information, plotted in iii) and iv), respectively. The distribution of the nanoparticles is visualized in red. Scale bars represent 10 μm. Reproduced from Yildirim T, Matthäus C, Press AT et al. Uptake of Retinoic Acid‐Modified PMMA Nanoparticles in LX‐2 and Liver Tissue by Raman Imaging and Intravital Microscopy. Macromolecular bioscience. 2017;17(10):1700064. © 2017 WILEY-VCH Verlag GmbH & Co. KGaA, Weinheim.71 (B) Raman imaging of individual cells after incubation with nanoparticles conducted over specific time periods. Blue: cell body and nuclei, green: membrane-rich organelles, yellow: early endocytic vesicles, red: the nanoparticles, and arrows: intracellular aggregation points of the targeted polymeric systems. Reproduced from Chernenko T, Buyukozturk F, Miljkovic M, Carrier R, Diem M, Amiji M. Label-free Raman microspectral analysis for comparison of cellular uptake and distribution between nontargeted and EGFR-targeted biodegradable polymeric nanoparticles. Drug delivery and translational research. 2013;3(6):575–586. Springer Nature.72 |
Bioorthogonal Raman Technique
Raman technology, although utilizing intrinsic signature bands of cellular biomolecules and drug delivery systems, is often limited by low spatial resolution, sensitivity, and molecular specificity.56 The shared intrinsic chemical bonds of the drug delivery systems among multiple cellular biomolecules result in low specificity of the target molecules. To overcome these limitations, Raman tags with only a few atoms have been developed to enhance molecular specificity in complex cellular analysis while preserving the molecular properties.84,85 Raman tags are bioorthogonal and vibrate in the cell-silent window (1800 ∼ 2600 cm−1), improving sensitivity and specificity by reducing the influence of cellular background.84 Importantly, the Raman technique utilizing Raman tags is alternatively referred to as bioorthogonal Raman technique. This methodology finds applicability not only in RS but also in CRS and SERS.56 Alkyne is widely used as Raman tag in biological analysis, including the analysis of cellular uptake of drug delivery systems.86,87 For example, the NPs based on Poly (phenylene ethynylene) (PPE) derivatives have been shown to enhance alkyne vibrations in the Raman-silent region, providing improved imaging of live cells (Figure 5A).73 This phenomenon can be attributed to the heightened alkyne signals arising from the incorporation of alkyne groups into the robust backbone and the extended delocalized π-conjugated structure. Besides, deuterium labeling is also frequently employed, especially in the analysis of liposomes. For instance, in a study of the intracellular fate and distribution of non-modified and peptide-modified liposomes, deuterium was used to label the liposomes74 (Figure 5B). The resulting Raman imaging utilized CD/CH ratio as a preliminary quantification variable. Based on its nondestructive nature and high sensitivity, it is expected to make significant progress in the dynamic monitoring of the intracellular processes of NPs and their pharmaceutical agents.21,88
 |
Figure 5 Cellular uptake analysis of the drug delivery systems based spontaneous bioorthogonal RS. (A) Raman images of live HeLa cells treated with PPE NPs (10 μg/mL) for 6 hours are presented. Scale bars indicate 5 μm. Reproduced from Li S, Chen T, Wang Y et al. Conjugated polymer with intrinsic alkyne units for synergistically enhanced Raman imaging in living cells. Angewandte Chemie International Edition. 2017;56(43):13455–13458. © 2017 Wiley-VCH Verlag GmbH & Co. KGaA, Weinheim.73 (B) MCF-7 cells treated with DSPC-d70 liposomes (i). Raman images of one cell reconstructed from the C-H (ii) and C-D stretching intensities (iii). Overlay of Raman images related to both C-H and C-D stretching intensities (iv). A depth profile was collected for the same cell (v–vii). Reproduced from Matthäus C, Kale A, Chernenko T, Torchilin V, Diem M. New ways of imaging uptake and intracellular fate of liposomal drug carrier systems inside individual cells, based on Raman microscopy. Molecular Pharmaceutics. 2008;5(2):287–293. Copyright © 2008 American Chemical Society.74 |
Coherent Raman Scattering (CRS)
CRS technique has significantly improved the speed compared to spontaneous RS. The real-time vibrational imaging capabilities of CRS make it a promising tool in the analysis of cellular uptake of drug delivery systems.9,89 CRS imaging involves both CARS and SRS.89 CARS is a nonlinear parametric phenomenon corresponding to a new frequency of (ωp − ωs) +ωp and the quantum state of the molecule remains unaffected (Figure 2).90 SRS, on the other hand, is a dissipative process related to stimulated Raman gain at ωs and stimulated Raman loss at ωp where the stokes beam experiences a gain in intensity and the incident radiation beam experiences an intensity loss (Figure 2).91 The input excitation (ωp − ωs) is transmitted to the target molecule for the vibrational excitation. To be noted, the intensity of SRS is linearly related to the concentration of the target molecule and appears at the same wavelengths as the excitation fields.17 Both CARS and SRS have been used to monitor the dynamic cellular uptake of drug delivery systems.92 For example, the label-free SRS imaging technique was employed to investigate the subcellular distribution of NPs (Figure 6A) in T. thermophila.75 This exploration was guided by semi-quantitative findings achieved through multivariate curve resolution (MCR) analysis. Notably, distinctive subcellular distribution patterns emerged due to diverse uptake pathways and notable competitive uptake dynamics involving two distinct NPs: polyacrylate-coated α-Fe2O3 and TiO2. Additionally, bioorthogonal labels can be used in CRS analysis to evaluate NPs and drug dynamics at the cellular level.77 For instance, Vanden-Hehir and colleagues have undertaken an investigation involving two derivatives of PLGA.76 These derivatives have been modified with deuterium and alkyne labels, which possess Raman activity in the cell-silent spectrum. Notably, these engineered NPs exhibit no toxicity towards living cells. Furthermore, through SRS imaging, it has been demonstrated that PLGA containing both types of Raman tags are effectively internalized within primary rat microglia cells. Another example of SRS with Raman tags is a live-cell imaging which was performed using Raman tags like alkyne, nitrile, and carbon-deuterium bonds to analyze the behavior of polymer NPs.77 The high and sharp SRS signal produced by NPs with Raman tags is used to demonstrate the efficient endocytosis and accumulation of NPs in vesicles near the cell nucleus. In addition to small molecules, polydiacetylenes (PDDA) can also serve as Raman tags.78 In this study, these PDDA molecules have been deliberately designed and synthesized to exhibit water solubility and enable their function through a host-guest supramolecular scaffolding strategy (Figure 6B). In comparison to traditional small molecule alkyne reporters, PDDA demonstrates a remarkable enhancement of alkyne Raman signals, with an increase of up to approximately 104-fold. Leveraging these derivatives of PDDA, hyperspectral live-cell Raman imaging of subcellular organelles was successfully achieved, which offers both high spatiotemporal resolution and employs SRS at low laser power and time constants. Furthermore, SRS analysis does not have to be based on a single Raman tag. Dual-color and multi-modal imaging can be achieved using multiple tags. For example, two functionally-active lead tags were selected to identify drug-dependent changes in cellular composition and the progression of the cell cycle at the single-cell level.87 SRS presents a multitude of benefits. These include heightened sensitivity, distinct fingerprint-like characteristics, seamless three-dimensional optical sectioning without the need for a pinhole, non-intrusive observation, the ability to penetrate deep tissues, and immunity to non-resonant background interference. Additionally, SRS offers quantitative capabilities. Owing to these diverse advantages, SRS has found an expanding range of applications, notably in the realm of analyzing cellular uptake within drug delivery systems.
 |
Figure 6 Cellular uptake analysis of the drug delivery systems based on SRS. (A) The composition of subcellular compartments in T. thermophila achieved through hyperspectral SRS analyzed by MCR. The distribution of AnaNPs (green), HemNPs (yellow), lipids (red), and proteins (purple) in T. thermophila cells preexposed to: (i) AnaNPs (ii) HemNPs or (iii) a combination of both AnaNPs and HemNPs. (iv) MCR-retrieved Raman spectra of AnaNPs, HemNPs, lipids, and proteins when cells preexposed to both AnaNPs and HemNPs. Scale bars indicate 5 μm. Reproduced from Huang B, Yan S, Xiao L et al. Label-Free Imaging of Nanoparticle Uptake Competition in Single Cells by Hyperspectral Stimulated Raman Scattering. Small. 2018;14(10):1703246. © 2017 WILEY-VCH Verlag GmbH & Co. KGaA, Weinheim.75 (B) SRS images depict HeLa cells treated with 50 μM of various PDDA derivatives, specifically P2, P3, and P4. The displayed images, arranged from left to right, represent the alkyne signal (2120 cm−1), lipid content (2850 cm−1), and a merged view. A scale bar of 10 μm is provided for reference. Reproduced from Tian S, Li H, Li Z et al. Polydiacetylene-based ultrastrong bioorthogonal Raman probes for targeted live-cell Raman imaging. Nature communications. 2020;11(1):81. Creative Commons.78 |
Surface-Enhanced Raman Scattering (SERS)
SERS is a widely-used technique that leverages the interaction between a Raman reporter and a metal surface with rough features, such as Ag or Au NPs.93 This interaction can result in greatly enhanced Raman responses, up to a factor of 1011 or higher, which allows for the analysis of small sample volumes with high optical contrast and specificity for individual molecule (Figure 2).94 For example, a label free SERS platform was developed to discern and visually depict the distinct stages of endocytosis involving AuNPs within cells.79 This achievement was facilitated through the utilization of multivariate analysis techniques, which enable the differentiation of various cellular compartments. SERS has also been used to analyze the uptake of NPs into cells through tagged strategies. One example of this is the work of Kapara et al, who developed a non-destructive SERS imaging method for the cellular uptake of antibody-modified AuNPs in human breast cancer cells.80 They tracked the real-time intracellular uptake of AuNPs using SERS nanotags. The SERS map (Figure 7A) vividly displays heightened signal accumulation within cell interiors (left). Upon dynamin inhibition, SERS signal across cells diminishes, with the signal becoming concentrated at the cell surface (right). This SERS cell mapping underscores the reliance on dynamin-mediated endocytosis for the internalization of SERS nanotags into cells. The study not only showed the endocytic mechanism of the internalization but also illustrated the dynamic localization based on Raman imaging. Endocytosis analysis based on SERS can also be applied to two-dimensional nanomaterials. For example, the black-phosphorus-based-gold nanoparticles (BP-Au NPs) has achieved great SERS sensitivity because of the presence of Au NPs on the surface of a BP sheet95 (Figure 7B). The analysis based on the endocytosis inhibitor indicated that most of the BP-NPs were uptake based on macropinocytosis and caveolae-dependent endocytosis. Furthermore, they showed the localization of the population of the hybrids in the sub-organelles including lysosomes based on the SERS-fluorescence dual-mode imaging analysis along with the statistical analysis. As well as the cellular level analysis, SERS can also achieve single NP observation based on super-resolution imaging techniques, which shows that SERS hotspots have seen fluctuation instead of a fixed feature of the corresponding NPs.96 The results provided a useful guide for single-molecule SERS experiments. The detailed characterization of endosomes and lysosomes allowed the depiction of the cellular uptake of AuNP reporter-free SERS probes at a subcellular level. Compared with other Raman techniques, SERS analysis has achieved much higher sensitivity, which allows the relatively precise quantification and localization of NPs in the cell.80,81,97–100 As a highly sensitive visualization method, SERS is frequently juxtaposed with fluorescence for comparison. For instance, Bálint conducted a study investigating the mechanisms of drug diffusion and uptake, specifically focusing on emodin-a potential anticancer drug-within live cancer cells using Ag NPs.101 In this study, SERS exhibited a level of comparability with fluorescence, as indicated by the similar patterns of cellular drug accumulation observed. SERS boasts several advantages over fluorescence, including the capability to work with minute drug quantities, utilization of embedded probes, and the flexibility to position probes within cells.
 |
Figure 7 Cellular uptake analysis of the drug delivery systems based SERS. (A) SERS map images for breast cancer cells incubated AuNPs with (right) or without dynasore (left). Scale bars indicate 5 μm. Reproduced from Kapara A, Brunton V, Graham D, Faulds K. Investigation of cellular uptake mechanism of functionalised gold nanoparticles into breast cancer using SERS. Chemical Science. 2020;11(22):5819–5829. Creative Commons.80 (B) Raman mapping of HepG2 cells following incubation with BP-Au NSs, following treatment with various endocytic inhibitors. A scale bar of 10 μm is included for reference. Reproduced from Zhao H, Zhang W, Liu Z et al. Insights into the intracellular behaviors of black-phosphorus-based nanocomposites via surface-enhanced Raman spectroscopy. Nanophotonics. 2018;7(10):1651–1662. Creative Commons.95 |
 |
Figure 8 The imaging analysis strategy aims to uncover biochemical information by reducing the dimensionality of the column-wise augmented spectral matrix. In this approach, the 3D Raman data is first unfolded and subsequently decomposed into pure spectra matrix and independent concentration profile matrix, which are associated with pure compounds such as nucleic acid, protein, and lipid. The independent concentration profile matrix is then refolded to construct a cellular image that illustrates the distribution of the pure component among cellular compartments and the presence of drugs. |
Nonetheless, it is important to acknowledge that SERS also presents certain drawbacks when contrasted with fluorescence. For instance, while fluorescence enables estimation of drug accumulation based on overall cell uptake, SERS relies on estimating drug concentrations at specific cellular locations. This discrepancy could potentially lead to lower repeatability in SERS measurements. This repeatability issue might be attributed to factors such as variations in metal structures and inconsistencies in SERS enhancement levels. To address these challenges, numerous research groups are actively engaged in the pursuit of improved SERS substrates and tagging techniques. This concerted effort holds the potential to elevate SERS to a level where it could serve as an alternative to fluorescence in the realm of cellular uptake analysis for drug delivery systems.
Comparison Between Various Techniques
Fluorescent labeling is a commonly employed technique in cellular analysis; however, its utility in drug delivery studies for tracking dynamic processes of nanomaterials within cells and understanding drug degradation pathways is constrained due to limitations associated with available fluorescent labels.102,103 Moreover, the use of fluorescent labels has the potential to alter the characteristics of both NPs and cells. In addition to fluorescence microscopy, there are alternative methods utilized in cellular uptake analysis of drug delivery systems, including atomic force microscopy (AFM),104 transmission electron microscopy (TEM),105 and flow cytometry,106 each with its own set of advantages and drawbacks. AFM boasts high resolution, the ability to provide quantitative mechanical data, and requires minimal sample preparation.104 Nonetheless, it does come with drawbacks such as slow scanning speeds, limited in-depth imaging capabilities, and the necessity for specialized training. TEM offers ultra-high resolution and the capacity to delve into subcellular details while enabling the study of internalization at the nanoscale.104 However, it demands extensive sample preparation, may introduce potential artifacts from staining procedures, and predominantly produces 2D images. Flow cytometry is distinguished by its high throughput, quantitative analytical capabilities, and suitability for large cell population studies.106 Nevertheless, it suffers from limited spatial information and the inability to observe the real-time internalization process. In summary, fluorescence microscopy facilitates real-time visualization, while AFM, TEM, and flow cytometry contribute valuable information regarding nanoscale interactions, cellular ultrastructure, and quantitative data, respectively. Nevertheless, all these techniques come with certain limitations, particularly related to sample preparation and other factors.
RS, SERS, CARS, and SRS are powerful tools for analyzing molecular vibrations and gaining insight into the chemical composition of cellular uptake analysis of the drug delivery systems.10 Table 2 presents a comparison of these techniques in various aspects. Bioorthogonal Raman technique is essentially a type of technique with an additional tag, making the difference between them lie primarily in specificity, which is not discussed here.85 SERS utilizes the same instrumentation as RS but exhibits different characteristics due to its much higher sensitivity enabled by the SERS substrate.20,81 However, the linearity of SERS is affected by the non-uniformity of the SERS intensity, mainly due to variations in the hotspot distribution on the substrate.20 Despite attempts to improve uniformity, complete uniformity and linearity of SERS intensity remain theoretical.107 The reliability of SERS is related to the uniformity of SERS substrate, which is a challenge in SERS analysis. Contrasting RS, CRS, including CARS and SRS, shows significant differences in instrumentation.89 CRS typically involves more expensive equipment compared to RS. While RS uses a single continuous wave (CW) laser, CARS requires two pulsed laser sources. In many CARS experiments, sensitivity is not limited by the detection of CARS photons but by distinguishing the resonant and non-resonant parts of the CARS signal, leading to substantially higher sensitivity than RS.108 Moreover, due to the different spectroscopic principles, the analyte’s profile in CARS exhibits a Fano-like shape, shifted with respect to the Raman signal. The intensity of CARS is nonlinear to the analyte due to coherent addition from individual molecules, whereas RS intensity is linear to the analyte concentration since it involves incoherent addition from individual molecules.109 SRS instrumentation can be based on CARS with an optical modulator, a photodiode detector, and a demodulator.91 SRS offers the advantage of linear intensity response to the analyte, similar to RS, but with significantly higher sensitivity than RS.17 Compared with CARS, SRS offers significant advantages in cellular imaging because of its linear concentration dependence, automatic phase matching, preservation of spontaneous Raman spectra, and higher detection sensitivity.10 Additionally, CRS, including CARS and SRS, provides background reduction and reduced fluorescence interference, further improving sensitivity and speeding up data acquisition.10 When considering resolution, it’s important to note that both RS and SERS exhibit relatively low resolution, primarily influenced by the laser wavenumber. On the contrary, CARS and SRS techniques provide markedly superior resolution, primarily owing to distinctions in their laser sources. The high resolution empowers the precise localization of nanoparticles within cellular compartments and support time-lapse analysis. The issue of sample preparation is pivotal in cellular analysis, directly linked to the experiment’s complexity. In this context, Raman techniques hold a distinct advantage due to their minimal sample preparation requirements, making them suitable for real-time cellular analysis of drug delivery systems without using special sample holder. However, it’s worth noting that in SERS analysis, live imaging may not always be feasible, as it depends on the specific SERS substrate, some of which can potentially harm or even lead to cell death. In addition, it is necessary to pre-fix cells for live SERS imaging analysis. Moreover, label-free techniques do not require staining, whereas bioorthogonal Raman techniques do. In summary, each technique has its advantages and limitations. RS is widely used for its simplicity and broad applicability. SERS and CRS offer enhanced sensitivity and specificity for certain applications, but with more complex instrumentation.
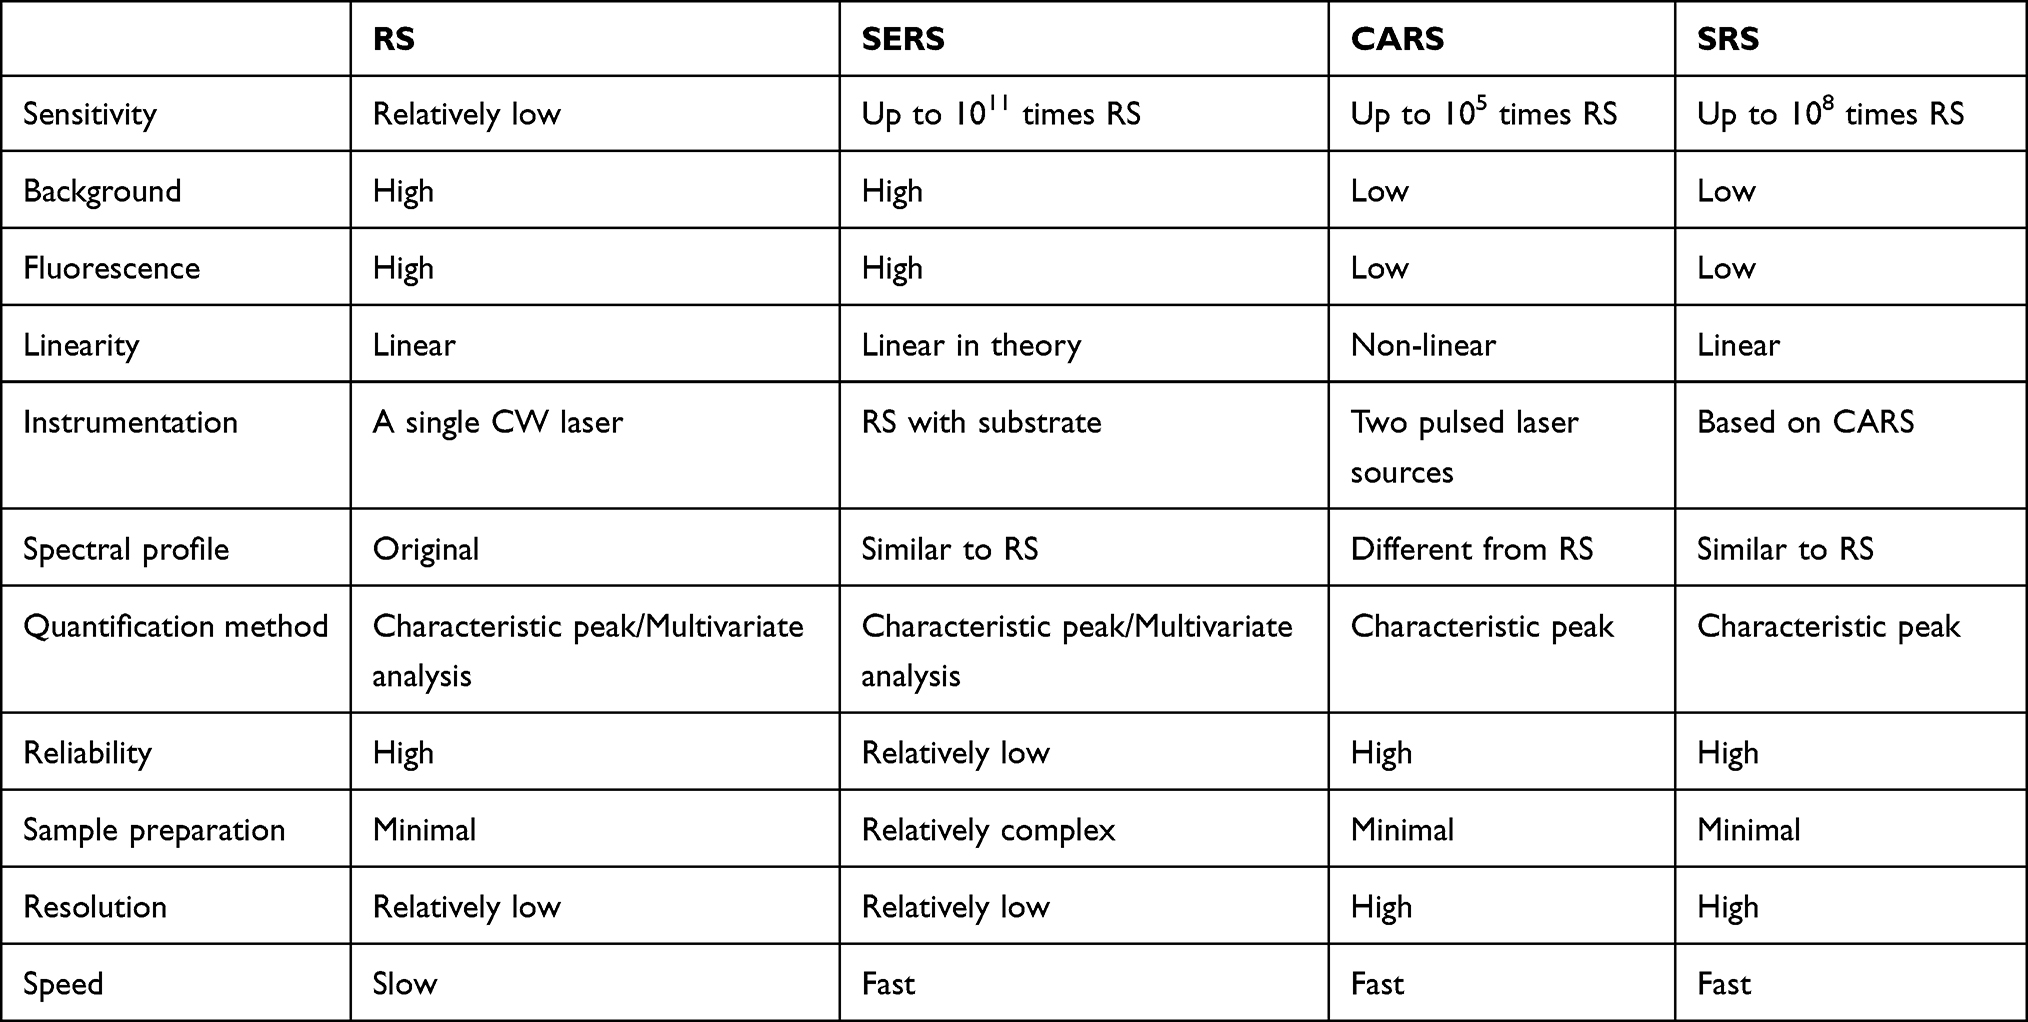 |
Table 2 Comparison of Distinctive Features Among RS, SERS, CARS, and SRS |
Raman Imaging Based on Multivariate Analysis
The cell environment is complex, and the Raman spectra of the cellular biomolecules are often overlapped with each other and with the Raman signals resulting from the drug delivery systems.110 Thus, the information-rich Raman spectral dataset includes many covariate features of multiple biomolecules and the materials from the drug delivery systems.111 Machine learning methods are commonly used in the Raman spectral dataset to reveal the biochemical information after the preprocessing of the spectra including cosmic ray removal, baseline correction, and scaling.112 It is common to extract the characteristic spectral information, cluster the cellular biomaterials and the drug delivery systems, and then visualize the biomaterials and the drug delivery systems at the single-cell level based on the machine learning methods (Figure 4).
One of the common strategies is to reduce the dimension of the column-wise augmented spectral matrix by creating new coordinates which are also named new variables.110,111 Examples involve principal component analysis (PCA),113,114 VCA,27,115 independent component analysis (ICA),116,117 and MCR.118,119 Although those methods are based on different strategies, they all decompose the column-wise augmented spectral matrix into two matrices, pure spectra matrix and scores independent concentration profile matrix (Figure 4). Generally, the loading matrix is made of the new variables, which are related to the relevant spectral information from the biomolecules. Correspondingly the score matrix shows the associated weights of the samples in the new coordinate systems related to the loadings. Among those methods, PCA extracts the eigenvector based on the largest variance of the data, resulting that the first few loadings being related to most of the spectral variance information.113 This means that PCA is not expected to obtain the pure spectra of the biomolecules. Compared with PCA, VCA, ICA, and MCR are designed to extract the pure spectra of the biomolecules.120 Among them, VCA is commonly used in cellular visualization based on RS.14,69,70 To be noted, the scores represent the relative concentrations of the new variables, which are expected to be pure biomaterials.69,121 The visualization of the cell can be accomplished based on the relative concentration information of the biomaterials (Figure 8).
Machine learning can also be used to in labeled Raman data analysis. For example, deuterium-labeled liposomes was used to demonstrate targeted delivery to specific cellular organelles, based on the content analysis of internalized liposomes in distinct vesicular compartments.122 In this case, the visualization of the cell was achieved through decomposing the column-wise augmented spectral matrix using VCA, which extracted information on the nuclei, cell body, mitochondria-rich regions, and internalized liposomes. Besides, the machine learning can also be used in SERS analysis to assist cellular visualization. For example, Huefner et al introduced the PCA-LDA model to identify the spectral features of endosomes based on reference spectra and achieved cellular SERS maps displaying the scatter of AuNPs based on reporter-free SERS.79 In this study, they used the separated spectra of the endosomal and lysosomal as a reference and showed the distribution of endosomes and lysosomes based on the PCA-LDA scores.
Conclusion
Drug delivery systems have significant potential in the pharmaceutical industry due to their ability to target specific issues or organs such as tumors, infections, and inflammation sites. Understanding the mechanisms of cellular uptake is crucial in evaluating the efficiency and safety of NPs. In recent years, Raman technique has gained growing significance in the visualization of the internalization and subsequent cellular dynamics of NPs. This technique offers the distinctive capability to unveil the unique signatures of various components, encompassing cellular organelles and drug delivery systems, all while demanding minimal sample preparation. Notably, its inherent label-free nature circumvents the need for introducing external markers that could potentially disrupt normal cellular responses. Capitalizing on these merits, RS facilitates the real-time tracking of cellular interactions, thereby enriching our comprehension of the behavior of drug delivery systems within the intricate milieu of living cells.
Nonetheless, challenges persist within the realm of RS, notably encompassing its inherent limitations in sensitivity and spectral resolution. These factors curtail its efficacy in conducting analyses at the single-cell level. Mitigating these constraints, the emergence of nonlinear RS, exemplified by techniques like CRS, including SRS and CARS along with SERS, has ushered in noteworthy enhancements in sensitivity and spectral clarity for cellular investigations.
Among these innovative techniques, SRS stands out due to its exceptional sensitivity and chemical specificity, rendering it a preferred choice for real-time monitoring of NP interactions within cellular components. This extends to the meticulous examination of NP-cell interactions at the subcellular level. A distinct advantage of SRS lies in its quantitative capacity, facilitating studies that explore dose-dependent effects, NP distribution, and variations in uptake across diverse cell types. Moreover, SERS stands out as an exceptionally sensitive technique, rivaling even fluorescence. A growing number of researchers are embracing SERS to investigate the intricate interactions between drug delivery systems and cells. Nonetheless, this method is not without its limitations, notably encompassing challenges like low repeatability and nonlinearity. To address these concerns, there is active development underway to engineer improved SERS substrates for better signal uniformity and enhancement. This endeavor holds the potential to elevate SERS into a promising and robust technique for analyzing drug delivery systems at the cellular level.
Besides, incorporating bioorthogonal Raman tags involves the design of specialized probes targeting NPs, which can subsequently be internalized by cells. This precision, rooted in the distinct and discernible Raman peaks, empowers researchers to differentiate between various types of NPs and subcellular structures. This differentiation unveils intricate insights into the spatial distribution and interactions governing these elements. Furthermore, the ongoing development of a broader spectrum of Raman tags promises expanded applications and refined capabilities for cellular analysis. Moreover, the refinement of RS resolution can be advanced through the integration of machine learning techniques. This convergence empowers the extraction of intricate chemical and biological information from the distinctive Raman fingerprints. The marriage of Raman technology and machine learning thus presents a potent synergy, paving the way for more comprehensive and nuanced insights into the intricacies of cellular and molecular dynamics of NPs.
In conclusion, cellular behavior studies of NPs based on Raman techniques are expected to remain a popular research area in the coming years. The advancements in nonlinear Raman technology, the exploration of novel Raman tags, and the development of robust data analysis platforms are poised to significantly expand the applications of Raman techniques in the analysis of cellular uptake of NPs.
Funding
This research was supported by National Key Research and Development Program of China (2022YFE0209700), the grant from Bureau of Education of Guangzhou Municipality Foundation (No. 202201010404 and No.201831836), the Guizhou Provincial Science and Technology Project (No. ZK2022063), and plan on enhancing scientific research in GMU.
Disclosure
The authors report no conflicts of interest in this work.
References
1. Allen TM, Cullis PR. Drug delivery systems: entering the mainstream. Science. 2004;303(5665):1818–1822.
2. Tibbitt MW, Dahlman JE, Langer R. Emerging frontiers in drug delivery. J Am Chem Soc. 2016;138(3):704–717.
3. Singh R, Lillard JW Jr. Nanoparticle-based targeted drug delivery. Exp Mol Pathol. 2009;86(3):215–223.
4. Mosquera J, García I, Liz-Marzán LM. Cellular Uptake of Nanoparticles versus Small Molecules: a Matter of Size. Acc Chem Res. 2018;51(9):2305–2313.
5. Chaudhuri A, Battaglia G, Golestanian R. The effect of interactions on the cellular uptake of nanoparticles. Phys Biol. 2011;8(4):046002.
6. Tantra R, Knight A. Cellular uptake and intracellular fate of engineered nanoparticles: a review on the application of imaging techniques. Nanotoxicology. 2011;5(3):381–392.
7. Behzadi S, Serpooshan V, Tao W, et al. Cellular uptake of nanoparticles: journey inside the cell. Chem Soc Rev. 2017;46(14):4218–4244.
8. Khan S, Mansoor S, Rafi Z, et al. A review on nanotechnology: properties, applications, and mechanistic insights of cellular uptake mechanisms. J Mol Liq. 2022;348:118008.
9. Cheng J-X, Xie XS. Vibrational spectroscopic imaging of living systems: an emerging platform for biology and medicine. Science. 2015;350(6264):aaa8870.
10. Stewart S, Priore RJ, Nelson MP, Treado PJ. Raman imaging. Ann Rev Analytical Chem. 2012;5:337–360.
11. Li W, Wei H, Li N, et al. Rapid identification and quantification of diquat in biological fluids within 30s using a portable Raman spectrometer. Biosens Bioelectron. 2023;115083.
12. Brunton VG, Lee M, Maguregui A, et al. Applications of Raman microscopy in cancer biology and drug discovery (Conference Presentation).
13. Zhang J, Yan S, He Z, et al. Small unnatural amino acid carried Raman tag for molecular imaging of genetically targeted proteins. J Phys Chem Lett. 2018;9(16):4679–4685.
14. Kallepitis C, Bergholt MS, Mazo MM, et al. Quantitative volumetric Raman imaging of three dimensional cell cultures. Nat Commun. 2017;8(1):14843.
15. Allakhverdiev ES, Khabatova VV, Kossalbayev BD, et al. Raman spectroscopy and its modifications applied to biological and medical research. Cells. 2022;11(3):386.
16. Xu S, Camp CH Jr, Lee YJ. Coherent anti‐Stokes Raman scattering microscopy for polymers. J Polymer Sci. 2022;60(7):1244–1265.
17. Hu F, Shi L, Min W. Biological imaging of chemical bonds by stimulated Raman scattering microscopy. Nat Methods. 2019;16(9):830–842.
18. Tipping WJ, Wilson LT, An C, et al. Stimulated Raman scattering microscopy with spectral phasor analysis: applications in assessing drug–cell interactions. Chemical Sci. 2022;13(12):3468–3476.
19. Cialla D, März A, Böhme R, et al. Surface-enhanced Raman spectroscopy (SERS): progress and trends. Anal Bioanal Chem. 2012;403(1):27–54.
20. Liu C, Weber S, Peng R, et al. Toward SERS-based therapeutic drug monitoring in clinical settings: recent developments and trends. TrAC Trends in Analytical Chem. 2023;117094.
21. Bakthavatsalam S, Dodo K, Sodeoka M. A decade of alkyne-tag Raman imaging (ATRI): applications in biological systems. RSC Chem Biol. 2021;2(5):1415–1429.
22. El-Mashtoly SF, Petersen D, Yosef HK, et al. Label-free imaging of drug distribution and metabolism in colon cancer cells by Raman microscopy. Analyst. 2014;139(5):1155–1161.
23. Smith JP, Liu M, Lauro ML, et al. Raman hyperspectral imaging with multivariate analysis for investigating enzyme immobilization. Analyst. 2020;145(23):7571–7581.
24. Smith GPS, McGoverin CM, Fraser SJ, Gordon KC. Raman imaging of drug delivery systems. Adv Drug Deliv Rev. 2015;89:21–41.
25. Rangan S, Schulze HG, Vardaki MZ, Blades MW, Piret JM, Turner RF. Applications of Raman spectroscopy in the development of cell therapies: state of the art and future perspectives. Analyst. 2020;145(6):2070–2105.
26. Tanwar S, Paidi SK, Prasad R, Pandey R, Barman I. Advancing Raman spectroscopy from research to clinic: translational potential and challenges. Spectrochim Acta A Mol Biomol Spectrosc. 2021;260:119957.
27. Vanden-Hehir S, Tipping WJ, Lee M, Brunton VG, Williams A, Hulme AN. Raman imaging of nanocarriers for drug delivery. Nanomaterials. 2019;9(3):341.
28. Blanco E, Shen H, Ferrari M. Principles of nanoparticle design for overcoming biological barriers to drug delivery. Nat Biotechnol. 2015;33(9):941–951.
29. Hu G, Guo M, Xu J, et al. Nanoparticles targeting macrophages as potential clinical therapeutic agents against cancer and inflammation. Front Immunol. 2019;10:1998.
30. Malik MK, Bhatt P, Kumar T, et al. Significance of chemically derivatized starch as drug carrier in developing novel drug delivery devices. Natural Products J. 2023;13(6):40–53.
31. Gao J, Karp JM, Langer R, Joshi N. The Future of Drug Delivery. Vol. 35. ACS Publications; 2023:359–363.
32. Allen TM, Cullis PR. Liposomal drug delivery systems: from concept to clinical applications. Adv Drug Deliv Rev. 2013;65(1):36–48.
33. Han H, Li S, Xu M, et al. Polymer-and lipid-based nanocarriers for ocular drug delivery: current status and future perspectives. Adv Drug Deliv Rev. 2023;114770.
34. Lingayat VJ, Zarekar NS, Shendge RS. Solid lipid nanoparticles: a review. Nanosci Nanotechnol Res. 2017;4(2):67–72.
35. Mora-Huertas CE, Fessi H, Elaissari A. Polymer-based nanocapsules for drug delivery. Int J Pharm. 2010;385(1–2):113–142.
36. Pu Y, Fan X, Zhang Z, et al. Harnessing polymer-derived drug delivery systems for combating inflammatory bowel disease. J Controlled Release. 2023;354:1–18.
37. Deng S, Gigliobianco MR, Censi R, Di Martino P. Polymeric nanocapsules as nanotechnological alternative for drug delivery system: current status, challenges and opportunities. Nanomaterials. 2020;10(5):847.
38. Mitchell MJ, Billingsley MM, Haley RM, Wechsler ME, Peppas NA, Langer R. Engineering precision nanoparticles for drug delivery. Nat Rev Drug Discov. 2021;20(2):101–124.
39. Liong M, Lu J, Kovochich M, et al. Multifunctional inorganic nanoparticles for imaging, targeting, and drug delivery. ACS nano. 2008;2(5):889–896.
40. Osman N, Devnarain N, Omolo CA, Fasiku V, Jaglal Y, Govender T. Surface modification of nano‐drug delivery systems for enhancing antibiotic delivery and activity. Wiley Interdiscip Rev Nanomed Nanobiotechnol. 2022;14(1):567.
41. Shen Z, Nieh M-P, Li Y. Decorating nanoparticle surface for targeted drug delivery: opportunities and challenges. Polymers. 2016;8(3):83.
42. Foroozandeh P, Aziz AA. Insight into Cellular Uptake and Intracellular Trafficking of Nanoparticles. Nanoscale Res Lett. 2018;13(1):339.
43. Banushi B, Joseph SR, Lum B, Lee JJ, Simpson F. Endocytosis in cancer and cancer therapy. Nat Rev Cancer. 2023;1–24.
44. Flannagan RS, Jaumouillé V, Grinstein S. The cell biology of phagocytosis. Ann Rev Pathol. 2012;7:61–98.
45. Dutta D, Donaldson JG. Search for inhibitors of endocytosis: intended specificity and unintended consequences. Cell Logist. 2012;2(4):203–208.
46. Uzhytchak M, Smolková B, Lunova M, et al. Lysosomal nanotoxicity: impact of nanomedicines on lysosomal function. Adv Drug Deliv Rev. 2023;114828.
47. Wang P, Wu B, Li M, et al. Lysosome-Targeting Aggregation-Induced Emission Nanoparticle Enables Adoptive Macrophage Transfer-Based Precise Therapy of Bacterial Infections. ACS nano. 2023.
48. Portilla Y, Mulens-Arias V, Paradela A, et al. The surface coating of iron oxide nanoparticles drives their intracellular trafficking and degradation in endolysosomes differently depending on the cell type. Biomaterials. 2022;281:121365.
49. Amin MO, Al-Hetlani E, Lednev IK. Detection and identification of drug traces in latent fingermarks using Raman spectroscopy. Sci Rep. 2022;12(1):3136.
50. Syed A, Smith EA. Raman imaging in cell membranes, lipid-rich organelles, and lipid bilayers. Ann Rev Analytical Chem. 2017;10(1):56.
51. Movasaghi Z, Rehman S, Rehman IU. Raman spectroscopy of biological tissues. Appl Spectrosc Rev. 2007;42(5):493–541.
52. Ren J, Mao S, Lin J, Xu Y, Zhu Q, Xu N. Research Progress of Raman Spectroscopy and Raman Imaging in Pharmaceutical Analysis. Curr Pharm Des. 2022;28(18):1445–1456.
53. Butler HJ, Ashton L, Bird B, et al. Using Raman spectroscopy to characterize biological materials. Nat Protoc. 2016;11(4):664–687.
54. Lohumi S, Kim MS, Qin J, Cho B-K. Raman imaging from microscopy to macroscopy: quality and safety control of biological materials. TrAC Trends in Analytical Chem. 2017;93:183–198.
55. Gaifulina R, Maher AT, Kendall C, et al. Label-free Raman spectroscopic imaging to extract morphological and chemical information from a formalin-fixed, paraffin-embedded rat colon tissue section. Int J Exp Pathol. 2016;97(4):337–350.
56. Shen Y, Hu F, Min W. Raman Imaging of Small Biomolecules. Annu Rev Biophys. 2019;48:347–369.
57. Jansen A, Kortum R Raman spectroscopy for cancer detection.
58. Utzinger U, Heintzelman DL, Mahadevan-Jansen A, Malpica A, Follen M, Richards-Kortum R. Near-infrared Raman spectroscopy for in vivo detection of cervical precancers. Appl Spectrosc. 2001;55(8):955–959.
59. Gomes da Costa S, Richter A, Schmidt U, Breuninger S, Hollricher O. Confocal Raman microscopy in life sciences. Morphologie. 2019;103(341):11–16.
60. Durrant B, Trappett M, Shipp D, Notingher I. Recent developments in spontaneous Raman imaging of living biological cells. Curr Opin Chem Biol. 2019;51:138–145.
61. Bocklitz TW, Guo S, Ryabchykov O, Vogler N, Popp J. Raman Based Molecular Imaging and Analytics: a Magic Bullet for Biomedical Applications!? Anal Chem. 2016;88(1):133–151.
62. Gierlinger N, Keplinger T, Harrington M. Imaging of plant cell walls by confocal Raman microscopy. Nat Protoc. 2012;7(9):1694–1708.
63. Zini J, Saari H, Ciana P, et al. Infrared and Raman spectroscopy for purity assessment of extracellular vesicles. Eur J Pharm Sci. 2022;172:106135.
64. Kruglik SG, Royo F, Guigner J-M, et al. Raman tweezers microspectroscopy of circa 100 nm extracellular vesicles. Nanoscale. 2019;11(4):1661–1679.
65. Rojalin T, Koster HJ, Liu J, et al. Hybrid nanoplasmonic porous biomaterial scaffold for liquid biopsy diagnostics using extracellular vesicles. ACS sensors. 2020;5(9):2820–2833.
66. Gualerzi A, Kooijmans SAA, Niada S, et al. Raman spectroscopy as a quick tool to assess purity of extracellular vesicle preparations and predict their functionality. J Extracellular Vesicles. 2019;8(1):1568780.
67. Romero G, Qiu Y, Murray RA, Moya SE. Study of Intracellular Delivery of Doxorubicin from Poly (lactide‐co‐glycolide) Nanoparticles by Means of Fluorescence Lifetime Imaging and Confocal Raman Microscopy. Macromol Biosci. 2013;13(2):234–241.
68. Romero G, Ochoteco O, Sanz DJ, Estrela‐Lopis I, Donath E, Moya SE. Poly (L actide‐co‐G lycolide) Nanoparticles, Layer by Layer Engineered for the Sustainable Delivery of AntiTNF‐α. Macromol Biosci. 2013;13(7):903–912.
69. Horgan CC, Jensen M, Nagelkerke A, et al. High-throughput molecular imaging via deep-learning-enabled Raman spectroscopy. Anal Chem. 2021;93(48):15850–15860.
70. Chen Y, Li J, Song D, et al. NWU‐RSIT: an integrated graphical user interface for biomedical Raman spectral imaging with both univariate and multivariate modules. J Raman Spectroscopy. 2021;52(8):1428–1439.
71. Yildirim T, Matthäus C, Press AT, et al. Uptake of Retinoic Acid‐Modified PMMA Nanoparticles in LX‐2 and Liver Tissue by Raman Imaging and Intravital Microscopy. Macromol Biosci. 2017;17(10):1700064.
72. Chernenko T, Buyukozturk F, Miljkovic M, Carrier R, Diem M, Amiji M. Label-free Raman microspectral analysis for comparison of cellular uptake and distribution between nontargeted and EGFR-targeted biodegradable polymeric nanoparticles. Drug Deliv Transl Res. 2013;3(6):575–586.
73. Li S, Chen T, Wang Y, et al. Conjugated polymer with intrinsic alkyne units for synergistically enhanced Raman imaging in living cells. Angewandte Chemie Int Edition. 2017;56(43):13455–13458.
74. Matthäus C, Kale A, Chernenko T, Torchilin V, Diem M. New ways of imaging uptake and intracellular fate of liposomal drug carrier systems inside individual cells, based on Raman microscopy. Mol Pharm. 2008;5(2):287–293.
75. Huang B, Yan S, Xiao L, et al. Label-Free Imaging of Nanoparticle Uptake Competition in Single Cells by Hyperspectral Stimulated Raman Scattering. Small. 2018;14(10):1703246.
76. Vanden-Hehir S, Cairns SA, Lee M, et al. Alkyne-tagged PLGA allows direct visualization of nanoparticles in vitro and ex vivo by stimulated Raman scattering microscopy. Biomacromolecules. 2019;20(10):4008–4014.
77. Hu F, Brucks SD, Lambert TH, Campos LM, Min W. Stimulated Raman scattering of polymer nanoparticles for multiplexed live-cell imaging. Chem Commun. 2017;53(46):6187–6190.
78. Tian S, Li H, Li Z, et al. Polydiacetylene-based ultrastrong bioorthogonal Raman probes for targeted live-cell Raman imaging. Nat Commun. 2020;11(1):81.
79. Huefner A, Kuan W-L, Müller KH, Skepper JN, Barker RA, Mahajan S. Characterization and visualization of vesicles in the endo-lysosomal pathway with surface-enhanced Raman spectroscopy and chemometrics. ACS nano. 2016;10(1):307–316.
80. Kapara A, Brunton V, Graham D, Faulds K. Investigation of cellular uptake mechanism of functionalised gold nanoparticles into breast cancer using SERS. Chemical Sci. 2020;11(22):5819–5829.
81. Chen H, Luo C, Yang M, Li J, Ma P, Zhang X. Intracellular uptake of and sensing with SERS-active hybrid exosomes: insight into a role of metal nanoparticles. Nanomedicine. 2020;15(9):913–926.
82. van Apeldoorn AA, van Manen H-J, Bezemer JM, de Bruijn JD, van Blitterswijk CA, Otto C. Raman Imaging of PLGA Microsphere Degradation Inside Macrophages. J Am Chem Soc. 2004;126(41):13226–13227.
83. Chernenko T, Matthäus C, Milane L, Quintero L, Amiji M, Diem M. Label-Free Raman Spectral Imaging of Intracellular Delivery and Degradation of Polymeric Nanoparticle Systems. ACS Nano. 2009;3(11):3552–3559.
84. Wei L, Hu F, Chen Z, Shen Y, Zhang L, Min W. Live-cell bioorthogonal chemical imaging: stimulated Raman scattering microscopy of vibrational probes. Acc Chem Res. 2016;49(8):1494–1502.
85. Zhao Z, Shen Y, Hu F, Min W. Applications of vibrational tags in biological imaging by Raman microscopy. Analyst. 2017;142(21):4018–4029.
86. Gaschler MM, Hu F, Feng H, Linkermann A, Min W, Stockwell BR. Determination of the subcellular localization and mechanism of action of ferrostatins in suppressing ferroptosis. ACS Chem Biol. 2018;13(4):1013–1020.
87. Tipping WJ, Lee M, Serrels A, Brunton VG, Hulme AN. Imaging drug uptake by bioorthogonal stimulated Raman scattering microscopy. Chemical Sci. 2017;8(8):5606–5615.
88. Dodo K, Fujita K, Sodeoka M. Raman Spectroscopy for Chemical Biology Research. J Am Chem Soc. 2022;144(43):19651–19667.
89. Zhang C, Zhang D, Cheng J-X. Coherent Raman scattering microscopy in biology and medicine. Annu Rev Biomed Eng. 2015;17:415.
90. Schie IW, Krafft C, Popp J. Applications of coherent Raman scattering microscopies to clinical and biological studies. Analyst. 2015;140(12):3897–3909.
91. Prince RC, Frontiera RR, Potma EO. Stimulated Raman scattering: from bulk to nano. Chem Rev. 2017;117(7):5070–5094.
92. Camp CH Jr, Cicerone MT. Chemically sensitive bioimaging with coherent Raman scattering. Nat Photonics. 2015;9(5):295–305.
93. Langer J, Jimenez de Aberasturi D, Aizpurua J, et al. Present and future of surface-enhanced Raman scattering. ACS nano. 2019;14(1):28–117.
94. Tanwar S, Kim JH, Bulte JW, Barman I. Surface‐enhanced Raman scattering: an emerging tool for sensing cellular function. Wiley Interdiscip Rev Nanomed Nanobiotechnol. 2022;e1802.
95. Zhao H, Zhang W, Liu Z, et al. Insights into the intracellular behaviors of black-phosphorus-based nanocomposites via surface-enhanced Raman spectroscopy. Nanophotonics. 2018;7(10):1651–1662.
96. De albuquerque CDL, Hokanson KM, Thorud SR, Sobral-Filho RG, Lindquist NC, Brolo AG. Dynamic imaging of multiple SERS hotspots on single nanoparticles. ACS Photonics. 2020;7(2):434–443.
97. Gregas MK, Yan F, Scaffidi J, Wang H-N, Vo-Dinh T. Characterization of nanoprobe uptake in single cells: spatial and temporal tracking via SERS labeling and modulation of surface charge. Nanomedicine. 2011;7(1):115–122.
98. Pinheiro PC, Fateixa S, Nogueira HI, Trindade T. Magnetite-supported gold nanostars for the uptake and SERS detection of tetracycline. Nanomaterials. 2018;9(1):31.
99. Jakhmola A, Krishnan S, Onesto V, et al. Sustainable synthesis and theoretical studies of polyhedral gold nanoparticles displaying high SERS activity, NIR absorption, and cellular uptake. Materials Today Chem. 2022;26:101016.
100. Huefner A, Septiadi D, Wilts BD, et al. Gold nanoparticles explore cells: cellular uptake and their use as intracellular probes. Methods. 2014;68(2):354–363.
101. Bálint Š, Rao S, Sánchez MM, Huntošová V, Miškovský P, Petrov D. Diffusion and cellular uptake of drugs in live cells studied with surface-enhanced Raman scattering probes. J Biomed Opt. 2010;15(2):027005–027007.
102. Doane TL, Burda C. The unique role of nanoparticles in nanomedicine: imaging, drug delivery and therapy. Chem Soc Rev. 2012;41(7):2885–2911.
103. Biju V. Chemical modifications and bioconjugate reactions of nanomaterials for sensing, imaging, drug delivery and therapy. Chem Soc Rev. 2014;43(3):744–764.
104. Smith JR, Olusanya TO, Lamprou DA. Characterization of drug delivery vehicles using atomic force microscopy: current status. Expert Opin Drug Deliv. 2018;15(12):1211–1221.
105. Pardhi VP, Verma T, Flora S, Chandasana H, Shukla R. Nanocrystals: an overview of fabrication, characterization and therapeutic applications in drug delivery. Curr Pharm Des. 2018;24(43):5129–5146.
106. Si Y, Kim S, Zhang E, et al. Targeted exosomes for drug delivery: biomanufacturing, surface tagging, and validation. Biotechnol J. 2020;15(1):1900163.
107. Itoh T, Procházka M, Dong Z-C, et al. Toward a new era of SERS and TERS at the nanometer scale: from fundamentals to innovative applications. Chem Rev. 2023;123(4):1552–1634.
108. Krafft C, Dietzek B, Schmitt M, Popp J. Raman and coherent anti-Stokes Raman scattering microspectroscopy for biomedical applications. J Biomed Opt. 2012;17(4):040801.
109. Cheng J-X, Xie XS. Coherent Anti-Stokes Raman Scattering Microscopy: Instrumentation, Theory, and Applications. Vol. 108. ACS Publications; 2004:827–840.
110. Liu Y-J, Kyne M, Wang C, X-Y Y. Data mining in Raman imaging in a cellular biological system. Comput Struct Biotechnol J. 2020;18:2920–2930.
111. Liu Y-J, Kyne M, Wang S, Wang S, X-Y Y, Wang C. A User-Friendly Platform for Single-Cell Raman Spectroscopy Analysis. Spectrochim Acta A Mol Biomol Spectrosc. 2022;282:121686.
112. de Juan A, Maeder M, Hancewicz T, Duponchel L, Tauler R. Chemometric tools for image analysis. Infrared Raman Spectroscopic Imaging. 2009;1:65–106.
113. Wold S, Esbensen K, Geladi P. Principal component analysis. Chemometrics Intelligent Lab Sys. 1987;2(1–3):37–52.
114. Di Mascolo D, Coclite A, Gentile F, Francardi M. Quantitative micro-Raman analysis of micro-particles in drug delivery. Nanoscale Adv. 2019;1(4):1541–1552.
115. Nascimento JMP, Dias JMB. Vertex component analysis: a fast algorithm to unmix hyperspectral data. IEEE T Geosci Remote. 2005;43(4):898–910.
116. Hyvärinen A, Oja E. Independent component analysis: algorithms and applications. Neural Networks. 2000;13(4–5):411–430.
117. Murugesan R, Raman S. Recent trends in carbon nanotubes based prostate cancer therapy: a biomedical hybrid for diagnosis and treatment. Curr Drug Deliv. 2022;19(2):229–237.
118. Felten J, Hall H, Jaumot J, Tauler R, De Juan A, Gorzsás A. Vibrational spectroscopic image analysis of biological material using multivariate curve resolution–alternating least squares (MCR-ALS). Nat Protoc. 2015;10(2):217.
119. Essendoubi M, Alsamad F, Noël P, et al. Combining Raman imaging and MCR‐ALS analysis for monitoring retinol permeation in human skin. Skin Res Technol. 2021;27(6):1100–1109.
120. Li M, Nawa Y, Ishida S, Kanda Y, Fujita S, Fujita K. Label-free chemical imaging of cytochrome P450 activity by Raman microscopy. Commun Biol. 2022;5(1):778.
121. Prats-Mateu B, Felhofer M, de Juan A, Gierlinger N. Multivariate unmixing approaches on Raman images of plant cell walls: new insights or overinterpretation of results? Plant Methods. 2018;14(1):1–20.
122. Chernenko T, Sawant R, Miljkovic M, Quintero L, Diem M, Torchilin V. Raman microscopy for noninvasive imaging of pharmaceutical nanocarriers: intracellular distribution of cationic liposomes of different composition. Mol Pharm. 2012;9(4):930–936.
 © 2023 The Author(s). This work is published and licensed by Dove Medical Press Limited. The
full terms of this license are available at https://www.dovepress.com/terms
and incorporate the Creative Commons Attribution
- Non Commercial (unported, 3.0) License.
By accessing the work you hereby accept the Terms. Non-commercial uses of the work are permitted
without any further permission from Dove Medical Press Limited, provided the work is properly
attributed. For permission for commercial use of this work, please see paragraphs 4.2 and 5 of our Terms.
© 2023 The Author(s). This work is published and licensed by Dove Medical Press Limited. The
full terms of this license are available at https://www.dovepress.com/terms
and incorporate the Creative Commons Attribution
- Non Commercial (unported, 3.0) License.
By accessing the work you hereby accept the Terms. Non-commercial uses of the work are permitted
without any further permission from Dove Medical Press Limited, provided the work is properly
attributed. For permission for commercial use of this work, please see paragraphs 4.2 and 5 of our Terms.