Back to Journals » International Journal of Chronic Obstructive Pulmonary Disease » Volume 14
Strain measurement on four-dimensional dynamic-ventilation CT: quantitative analysis of abnormal respiratory deformation of the lung in COPD
Authors Xu Y ![]() , Yamashiro T
, Yamashiro T ![]() , Moriya H, Tsubakimoto M, Nagatani Y, Matsuoka S, Murayama S
, Moriya H, Tsubakimoto M, Nagatani Y, Matsuoka S, Murayama S
Received 13 August 2018
Accepted for publication 3 December 2018
Published 18 December 2018 Volume 2019:14 Pages 65—72
DOI https://doi.org/10.2147/COPD.S183740
Checked for plagiarism Yes
Review by Single anonymous peer review
Peer reviewer comments 2
Editor who approved publication: Prof. Dr. Richard Russell
Supplementary video showing strain mapping of a non-COPD smoker.
Views: 402
Yanyan Xu,1,2 Tsuneo Yamashiro,1 Hiroshi Moriya,3 Maho Tsubakimoto,1 Yukihiro Nagatani,4 Shin Matsuoka,5 Sadayuki Murayama1
On behalf of ACTIve Study Group
1Department of Radiology, Graduate School of Medical Science, University of the Ryukyus, Nishihara, Okinawa, Japan; 2Department of Radiology, China-Japan Friendship Hospital, Beijing, Republic of China; 3Department of Radiology, Ohara General Hospital, Fukushima-City, Fukushima, Japan; 4Department of Radiology, Shiga University of Medical Science, Otsu, Shiga, Japan; 5Department of Radiology, St Marianna University School of Medicine, Kawasaki, Kanagawa, Japan
Purpose: Strain measurement is frequently used to assess myocardial motion in cardiac imaging. This study aimed to apply strain measurement to pulmonary motion observed by four-dimensional dynamic-ventilation computed tomography (CT) and to clarify motion abnormality in COPD.
Materials and methods: Thirty-two smokers, including ten with COPD, underwent dynamic-ventilation CT during spontaneous breathing. CT data were continuously reconstructed every 0.5 seconds. In the series of images obtained by dynamic-ventilation CT, five expiratory frames were identified starting from the peak inspiratory frame (first expiratory frame) and ending with the fifth expiratory frame. Strain measurement of the scanned lung was performed using research software that was originally developed for cardiac strain measurement and modified for assessing deformation of the lung. The measured strain values were divided by the change in mean lung density to adjust for the degree of expiration. Spearman’s rank correlation analysis was used to evaluate associations between the adjusted strain measurements and various spirometric values.
Results: The adjusted strain measurement was negatively correlated with FEV1/FVC (ρ=-0.52, P<0.01), maximum mid-expiratory flow (ρ=-0.59, P<0.001), and peak expiratory flow (ρ=-0.48, P<0.01), suggesting that abnormal deformation of lung motion is related to various patterns of expiratory airflow limitation.
Conclusion: Abnormal deformation of lung motion exists in COPD patients and can be quantitatively assessed by strain measurement using dynamic-ventilation CT. This technique can be expanded to dynamic-ventilation CT in patients with various lung and airway diseases that cause abnormal pulmonary motion.
Keywords: COPD, computed tomography, CT, dynamic-ventilation CT, strain measurement, emphysema
Introduction
Strain analysis, which can express deformation of a tissue or organ in the human body, has been mainly used to assess myocardial motion using various four-dimensional (4D) imaging modalities, including echocardiography, magnetic resonance imaging (MRI), and computed tomography (CT).1–11 Although various parameters based on strain measurements have been advocated by different software vendors, it is commonly accepted in the field of cardiology that strain is a sensitive parameter to assess regional function of the myocardium.4–11 It has also been reported that strain measurements reveal minor left ventricular modifications in athletes with common anomalies (ie, bicuspid aortic valve),3 which might be masked by apparently normal values of global cardiac function parameters, such as ejection fraction and stroke volume.12,13
In cardiology, a higher value of myocardial strain observed on MRI or echocardiography usually indicates better myocardial movement, because strong systolic–diastolic movements result in large deformation of the measured myocardium. However, it has also been shown that myocardial strain is heterogeneous in patients with dilated cardiomyopathy, suggesting heterogeneity of myocardial contractile function.5 Joseph et al presented color contour maps based on MRI strain measurements in patients with dilated cardiomyopathy and concluded that myocardial systolic strain has a heterogeneous regional distribution.5
In patients with COPD, the destruction of normal “mesh-like” structures of pulmonary tissue results in pulmonary emphysema and leads to a reduction of lung compliance, causing inhomogeneous transmission of lung motion during the respiratory cycle.14 Furthermore, the heterogeneous distribution of emphysematous changes and airway diseases also intensify the heterogeneity of lung movement during ventilation,15–17 which has been clearly confirmed in recent studies using 4D dynamic-ventilation CT and other imaging techniques.18–20 These recent studies have demonstrated the existence of asynchrony between the right and left lungs, between the proximal airways and lung, and among different lung lobes. However, to the best of our knowledge, there is no published information on motion abnormality of the entire scanned lung. Considering the similar physiologic characteristics of the lungs and heart (both show cyclic movements and changes in volume), we hypothesized that the quantitative strain measurement used in cardiology could be transferred to pulmonary 4D-CT imaging and generate new knowledge on normal and abnormal respiratory movements of the lungs. Also, we predicted that heterogeneity of lung motion, which would be similar to strain heterogeneity in dilated cardiomyopathy, can be demonstrated as abnormal deformation, or a high strain value in the targeted portion of the lungs.
Thus, the goals of this study were the following: 1) to first measure lung strain using 4D dynamic-ventilation CT, 2) to clarify abnormal deformation of lung motion by strain measurement, and 3) to assess correlations between strain and COPD severity.
Materials and methods
The Institutional Review Board at Ohara General Hospital approved this retrospective study. Based on the national guideline of the Japanese Government, the Institutional Review Board at Ohara General Hospital waived written informed consent from enrolled patients for this study. Dynamic-ventilation CT and spirometry were performed as part of routine clinical care at Ohara Medical Center (part of Ohara General Hospital). This study was also part of the Area-detector Computed Tomography for the Investigation of Thoracic Diseases (ACTIve) Study, a multicenter research alliance in Japan. Also, the subjects’ data utilized in this study were previously analyzed with a different objective for other research.20
Subjects
Thirty-two smokers (4 females and 28 males; mean age 70±12 years) underwent both spirometry and chest CT (conventional and dynamic-ventilatory scans) at Ohara Medical Center. As the same patients were previously analyzed with a different objective,20 the detailed information regarding the study population is described in the Supplementary material. Patient data analyzed in this study, such as CT scans and clinical information, were anonymized and maintained with strict confidentiality.
CT scanning
All patients were scanned with a 320-row MDCT scanner (Aquilion ONE, Canon Medical Systems, Otawara, Tochigi, Japan) for both conventional (static) and dynamic-ventilatory scans. The detailed information regarding the CT scanning is described in the Supplementary material.
Image analysis – lung density measurement on dynamic-ventilation CT
Using commercially available software (Lung Volume Measurement, Canon Medical Systems), the mean lung density (MLD) of the scanned lung (<160 mm in the Z-axis) was measured automatically in each frame. On the time curve of MLD, the peak inspiratory frame (= first expiratory frame) was defined as the lowest MLD on the curve. The expiratory phase was defined as the frames starting from the peak inspiratory frame (first expiratory frame), and the MLD values for the first to fifth expiratory frames were obtained for this study.
Image analysis – strain measurement on dynamic-ventilation CT
Strain measurement on the dynamic-ventilation CT was performed using in-house research software installed in a commercially available workstation for 4D-CT analysis (PhyZiodynamics, Ziosoft, Tokyo, Japan). In brief, the software measured the “maximum principal strain” values (Figure 1), which were originally used in cardiac imaging but newly modified to assess lung motion. Using the motion coherence algorithm, dynamic-ventilation CT data could be analyzed at any given point in the imaging space using image matching and model matching algorithms that produce the matrix of the motion vectors. Maximum principal strain was calculated directly at the composition/interpolation stage, based on the motion vector at any point in the space. The maximum principal strain was calculated at the points in the space during ventilation, based on expansion of the principal direction from the starting (standard) frame (first expiratory frame = peak inspiratory frame) to the second to fifth expiratory frames. Figure 2 shows an example of a serial change in the maximum principal strain in each frame of the expiratory phase. The software automatically excluded the upper and lower marginal zones that were not included in the scanning field during inspiration, even if they were included during expiration.
 | Figure 1 Illustrations for the concept of “principal strain”. |
 | Figure 2 Example of serial changes in strain maps in a patient with COPD. |
Strain values for the second to fifth expiratory frames were divided by the changes in MLD between the first and second to fifth frames to adjust each strain value by the degree of expiration. Finally, adjusted strain values for the second to fifth frames were summed to express the total strain measurement during expiration. The sum of the adjusted strain values could be considered to express abnormal deformation of lung motion, which was discriminated from physiologic deformation in lung areas with normal exhalation.
Image analysis – emphysema measurement by conventional chest CT
Based on the data of the helical CT scans, an emphysema measurement was performed using the same software for the MLD measurement (Lung Volume Measurement, Canon Medical Systems). The percent low attenuation volume (LAV%, < −950 Hounsfield units [HU]) of the whole lung was automatically measured.
Spirometry
All subjects performed spirometry, including FEV1 and FVC, maximum mid-expiratory flow rate (MMFR), and peak expiratory flow (PEF), according to American Thoracic Society standards.21 The spirometric values from the study participants are shown in Table 1. Spirometry was performed within 2 weeks of the chest CT.
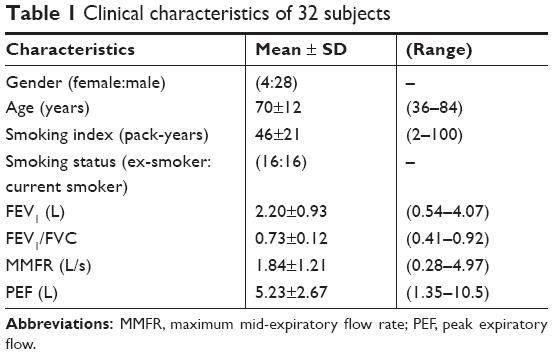 | Table 1 Clinical characteristics of 32 subjects |
Statistical analysis
Data are expressed as mean ± SD. Spearman’s rank correlation analysis was used to evaluate the associations among the CT indices or between the CT indices and the spirometric values. A P-value of <0.05 was considered significant. All statistical analyses were performed using JMP 12.0 software (SAS Institute Inc., Cary, NC, USA).
Results
MLD measurement on dynamic-ventilation CT and emphysema index on conventional CT
Based on dynamic-ventilation CT, the mean MLD values were −871.0±37.3 and −821.5±55.8 HU for the first and fifth expiratory frames, respectively. The MLD values for the first and fifth expiratory frame demonstrated positive correlations with all spirometric values; the MLD at the fifth expiratory frame demonstrated a stronger correlation with FEV1/FVC (ρ=0.75, P<0.0001) compared to the MLD at the first expiratory frame (Table 2). Based on helical CT for the whole lung, the mean LAV% (emphysema index) was 10.8%±14.8% and correlated with multiple spirometric values except for FEV1 (Table 2).
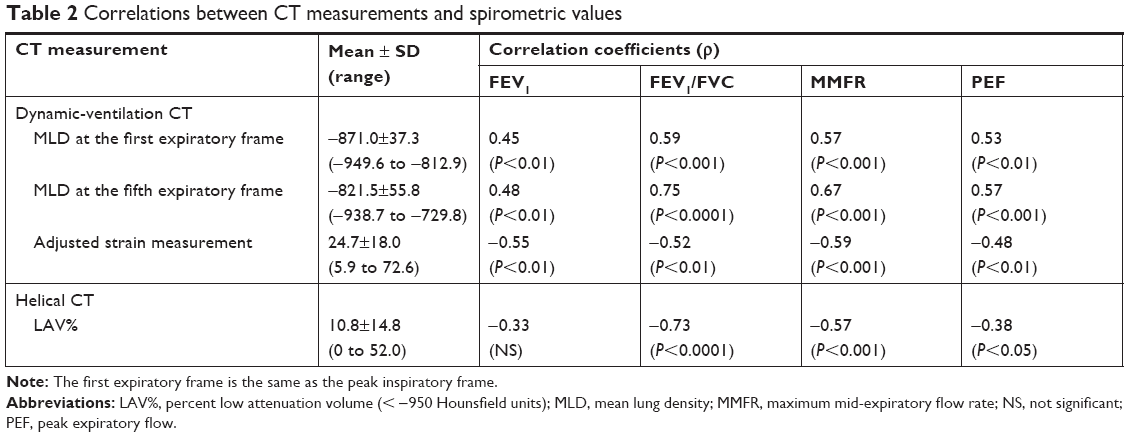 | Table 2 Correlations between CT measurements and spirometric values |
Strain measurement on dynamic-ventilation CT
The mean adjusted strain for expiration was 24.7±18.0 (range, 5.9–72.6). Generally, higher strain values were observed in patients with lower spirometric values, and negative correlations were found between strain and all spirometric values (ρ=−0.48 to −0.59, P<0.01) (Table 2) (Figures 3 and 4, Movies S1 and S2). This implies that homogeneous lung motion would be limited and lost in patients with more severe COPD. Particularly, the correlation coefficient between adjusted strain and the maximum mid-expiratory airflow was slightly higher (ρ=−0.59, P<0.001) than those with other spirometric values.
 | Figure 3 Strain mapping of a non-COPD smoker (during expiration, 39-year-old male, FEV1/FVC =0.92). |
 | Figure 4 Strain mapping of a severe COPD patient (during expiration, 70-year-old male, FEV1/FVC =0.41). |
Discussion
In this study, we applied quantitative strain measurement to 4D dynamic-ventilation CT images and found the following: 1) the strain measurement adjusted by the degree of expiration can be used for assessment of abnormal lung deformation during ventilation and 2) the adjusted strain measurement demonstrates negative correlations with several spirometric values. These observations suggest that abnormal pulmonary deformation by ventilation can be expressed by abnormally high strain values, and strain analysis can provide quantitative information that may reflect uneven, heterogeneous lung movement in various pulmonary and airway diseases. We currently believe that early heterogeneous changes in lung motion can be detected by abnormally high strain values in patients with various diseases, such as bronchiectasis, non-tuberculosis mycobacteria, and interstitial lung diseases, which may precede clinical symptoms or abnormalities found by other conventional lung function tests.
Strain measurement has been widely used in cardiology for describing multidimensional deformations or underlying structural changes of muscular fibers, observed by various modalities (such as MRI, CT, and echocardiography).1–13 Generally, as the normal myocardium contracts in systole and expands in diastole, high strain values are observed in the normal parts of the heart. In contrast to the normal myocardium, ischemic myocardium or scarred cardiac segments do not contract as well, causing heterogeneous deformation and abnormally low strain values.22 In addition, tethering effects of segments adjacent to area of myocardial infarction also cause an abnormal deformation pattern.23,24 Thus, quantitative strain measurement can be used to detect regional myocardial dysfunction in patients with ischemic heart disease, cardiomyopathies, hypertension, and valvular disease.25 Furthermore, strain analysis has been explored to evaluate heterogeneity of myocardial contractile function in patients with dilated cardiomyopathy. Three-dimensional color contour maps based on strain values using MRI accurately visualize heterogeneous contraction in patients with dilated cardiomyopathy.5 In other words, in the field of cardiology, strain measurement should be “uniformly high” throughout the myocardium and reduced or heterogeneous strain values imply underlying myocardial dysfunction by various diseases.26
In the current study, we attempted to introduce strain measurement to 4D dynamic-ventilation CT during free breathing. As strain values express deformation of targeted structures, we expected that two different types of deformation must have existed in the lung: normal deformation of the lung due to inhalation/exhalation and abnormal regional deformation caused by heterogeneous ventilation due to COPD (emphysema and airway disease). Normal deformation of the lung would appear at lung areas with large respiratory movements, such as the lung bottom adjacent to the diaphragm and the dorsal part of the lung in the supine position (Figure 3). In contrast, abnormal deformation may be observed throughout the lung without any specific locations, because this abnormal deformation is caused by heterogeneous ventilation or partial air-trapping due to emphysema and airway disease of COPD (Figure 4). To distinguish these two different deformation patterns, we adjusted measured strain values by the degree of expiration in this study. The changes in MLD between the first and the second to fifth respiratory frames indicate the magnitude of exhalation during the expiratory phase. Even if large deformation occurs by deep (sufficient) expiration in a relatively healthy subject, the high strain values are adjusted by large changes in MLD. In contrast, the value of strain itself may be intermediate in patients with severe COPD without large expiratory movements, but the adjusted strain value may be quite large because of small changes in MLD (insufficient expiration) due to limited airflow. Using this method, we successfully extracted “abnormal” deformation of the lung, which was expressed as the adjusted strain value, and this should be closely associated with heterogeneous lung movements.
The mechanical properties of the lung tissue are mainly determined by collagen and elastic fibers, demonstrating viscoelastic behavior during deflation and inflation.15 Normally, the stresses under constant ventilation are homogeneously transmitted throughout the entire lung.27 However, in COPD patients, in addition to loss of pulmonary elastic recoil, heterogeneous distribution of pulmonary emphysema and abnormalities of thoracic structures (such as narrowed/collapsed airways and the flattened diaphragm) must result in asynchronous transmission of physical stress in the lung during ventilation, which causes heterogeneous pulmonary movement. Although heterogeneity or asynchrony of lung/airway motion has been reported in COPD patients,17–20 this is the first study to quantitatively assess abnormal deformation in the entire scanned lung using strain measurement.
Interestingly, in the current study, adjusted strain was negatively correlated with FEV1, FEV1/FVC, MMFR, and PEF. Although the strength of the correlations was intermediate, these correlations suggest that pulmonary motion heterogeneity may be caused by various patterns, such as proximal airway disease, small airway disease, and lung parenchymal abnormalities. Thus, it should be possible to expand strain measurement by dynamic-ventilation CT to other lung/airway diseases, such as asthma, cystic fibrosis, or even diffuse lung disease, which have not been a target of quantitative motion analysis of the lung and airways. Currently, several different approaches have been described using novel CT techniques to measure respiratory changes in lung volume and the emphysema index. These new approaches, including our approach of dynamic-ventilation CT, should generate new information on the pathophysiology of various lung diseases.28
There were several limitations of the present study. First, a limited number of subjects were enrolled. These preliminary results should be reproduced with a larger cohort. Second, MLD and adjusted strain were calculated from part of the lung on 4D dynamic-ventilation CT due to the limited scan length in the Z-axis (≤160 mm). Thus, selection bias of the lung location would have influenced the strain measurements. Third, the adjusted strain measurements were extracted from the expiratory phase only. As it is known that CT indices at the expiratory phase show higher correlations than at the inspiratory phase,29 we focused on the expiratory phase only. However, strain measurements during inspiration may provide additional insight into pulmonary physiology, and these measurements shown be performed in future studies. Fourth, several patients enrolled in the current study had resectable thoracic neoplasms. Although no patient had a large mass invading the chest wall or proximal airways, the presence of thoracic tumor may have influenced the strain measurement. Fifth, other coexisting diseases caused by smoking, such as chronic bronchitis or slight interstitial changes, may have influenced the strain measurement. Ideally, healthy subjects without a smoking history should have been enrolled as a control group to assess the normal respiratory deformation of the lung.
In conclusion, strain analysis using 4D dynamic-ventilation CT is feasible to quantify the abnormal deformation of lung motion in patients with COPD. This technique can be expanded to various lung and airways diseases, in a manner that is similar to cardiac imaging.
Acknowledgments
The authors greatly thank Mr Shun Muramatsu (Ohara General Hospital) for his great help in scanning patients. The authors also thank Dr Shinsuke Tsukagoshi (Canon Medical Systems) and Mr Yasuhiro Kondo (Ziosoft) for their technical support. The ACTIve Study Group currently consists of the following institutions: Ohara General Hospital, Fukushima City, Fukushima, Japan (Kotaro Sakuma, MD, Hiroshi Moriya, MD, PhD); Saitama International Medical Center, Saitama Medical University, Hidaka, Saitama, Japan (Fumikazu Sakai, MD, PhD); Kanagawa Cardiovascular and Respiratory Center, Yokohama, Kanagawa, Japan (Tae Iwasawa, MD, PhD); Shiga University of Medical Science, Otsu, Shiga, Japan (Yukihiro Nagatani, MD, Norihisa Nitta, MD, Kiyoshi Murata, MD); Osaka University, Suita, Osaka, Japan (Masahiro Yanagawa, MD, PhD, Osamu Honda, MD, PhD, Noriyuki Tomiyama, MD, PhD); Osaka Medical College, Takatsuki, Osaka, Japan (Mitsuhiro Koyama, MD, PhD); Tenri Hospital, Tenri, Nara, Japan (Yuko Nishimoto, MD, Satoshi Noma, MD, PhD); Kobe University, Kobe, Hyogo, Japan (Yoshiharu Ohno, MD, PhD); University of Occupational and Environmental Health, Kitakyushu, Fukuoka, Japan (Takatoshi Aoki, MD, PhD); University of the Ryukyus, Nishihara, Okinawa, Japan (Tsuneo Yamashiro, MD, Maho Tsubakimoto, MD, PhD, Yanyan Xu, MD, Sadayuki Murayama, MD, PhD). University of the Ryukyus, Ohara General Hospital, and Shiga University of Medical Science receive a research grant from Canon Medical Systems (formerly Toshiba Medical Systems). University of the Ryukyus also receives a research grant from Ziosoft. Xu Y receives a scholarship (Sasagawa scholarship) from the Japan China Medical Association. Yamashiro T received a research grant from the Japan Society for the Promotion of Science (Kakenhi-16K19837).
Disclosure
The authors report no conflicts of interest in this work.
References
Pedrizzetti G, Sengupta S, Caracciolo G, et al. Three-dimensional principal strain analysis for characterizing subclinical changes in left ventricular function. J Am Soc Echocardiogr. 2014;27(10):1041–1050. | ||
Mor-Avi V, Lang RM, Badano LP, et al. Current and evolving echocardiographic techniques for the quantitative evaluation of cardiac mechanics: ASE/EAE consensus statement on methodology and indications endorsed by the Japanese Society of Echocardiography. J Am Soc Echocardiogr. 2011;24(3):277–313. | ||
Stefani L, De Luca A, Toncelli L, Pedrizzetti G, Galanti G. 3D strain helps relating LV function to LV and structure in athletes. Cardiovasc Ultrasound. 2014;12(1):33. | ||
Tanabe Y, Kido T, Kurata A, et al. Three-dimensional maximum principal strain using cardiac computed tomography for identification of myocardial infarction. Eur Radiol. 2017;27(4):1667–1675. | ||
Joseph S, Moazami N, Cupps BP, et al. Magnetic resonance imaging-based multiparametric systolic strain analysis and regional contractile heterogeneity in patients with dilated cardiomyopathy. J Heart Lung Transplant. 2009;28(4):388–394. | ||
McComb C, Carrick D, McClure JD, et al. Assessment of the relationships between myocardial contractility and infarct tissue revealed by serial magnetic resonance imaging in patients with acute myocardial infarction. Int J Cardiovasc Imaging. 2015;31(6):1201–1209. | ||
Buckert D, Tibi R, Cieslik M, et al. Myocardial strain characteristics and outcomes after transcatheter aortic valve replacement. Cardiol J. 2018;25(2):203–212. | ||
Di Franco A, Kim J, Rodriguez-Diego S, et al. Multiplanar strain quantification for assessment of right ventricular dysfunction and non-ischemic fibrosis among patients with ischemic mitral regurgitation. PLoS One. 2017;12(9):e0185657. | ||
Helle-Valle TM, Yu WC, Fernandes VR, Rosen BD, Lima JA. Usefulness of radial strain mapping by multidetector computer tomography to quantify regional myocardial function in patients with healed myocardial infarction. Am J Cardiol. 2010;106(4):483–491. | ||
Miyagi H, Nagata M, Kitagawa K, et al. Quantitative assessment of myocardial strain with displacement encoding with stimulated echoes MRI in patients with coronary artery disease. Int J Cardiovasc Imaging. 2013;29(8):1779–1786. | ||
Maret E, Liehl M, Brudin L, Todt T, Edvardsen T, Engvall JE. Phase analysis detects heterogeneity of myocardial deformation on cine MRI. Scand Cardiovasc J. 2015;49(3):149–158. | ||
Simpson RM, Keegan J, Firmin DN. MR assessment of regional myocardial mechanics. J Magn Reson Imaging. 2013;37(3):576–599. | ||
Jiang K, Yu X. Quantification of regional myocardial wall motion by cardiovascular magnetic resonance. Quant Imaging Med Surg. 2014;4(5):345–357. | ||
Lai-Fook SJ. Lung parenchyma described as a prestressed compressible material. J Biomech. 1977;10(5–6):357–365. | ||
Faffe DS, Zin WA. Lung parenchymal mechanics in health and disease. Physiol Rev. 2009;89(3):759–775. | ||
Sciurba FC, Rogers RM, Keenan RJ, et al. Improvement in pulmonary function and elastic recoil after lung-reduction surgery for diffuse emphysema. N Engl J Med. 1996;334(17):1095–1099. | ||
Stahr CS, Samarage CR, Donnelley M, et al. Quantification of heterogeneity in lung disease with image-based pulmonary function testing. Sci Rep. 2016;6(1):29438. | ||
Estrada L, Torres A, Sarlabous L, et al. Estimation of bilateral asynchrony between diaphragm mechanomyographic signals in patients with chronic obstructive pulmonary disease. Conf Proc IEEE Eng Med Biol Soc. 2014;2014:3813–3816. | ||
Yamashiro T, Moriya H, Tsubakimoto M, Matsuoka S, Murayama S. Continuous quantitative measurement of the proximal airway dimensions and lung density on four-dimensional dynamic-ventilation CT in smokers. Int J Chron Obstruct Pulmon Dis. 2016;11(1):755–764. | ||
Yamashiro T, Moriya H, Matsuoka S, et al. Asynchrony in respiratory movements between the pulmonary lobes in patients with COPD: continuous measurement of lung density by 4-dimensional dynamic-ventilation CT. Int J Chron Obstruct Pulmon Dis. 2017;12(1):2101–2109. | ||
Vestbo J, Hurd SS, Agustí AG, et al. Global strategy for the diagnosis, management, and prevention of chronic obstructive pulmonary disease: GOLD executive summary. Am J Respir Crit Care Med. 2013;187(4):347–365. | ||
Haugaa KH, Smedsrud MK, Steen T, et al. Mechanical dispersion assessed by myocardial strain in patients after myocardial infarction for risk prediction of ventricular arrhythmia. JACC Cardiovasc Imaging. 2010;3(3):247–256. | ||
Edvardsen T, Gerber BL, Garot J, Bluemke DA, Lima JA, Smiseth OA. Quantitative assessment of intrinsic regional myocardial deformation by Doppler strain rate echocardiography in humans: validation against three-dimensional tagged magnetic resonance imaging. Circulation. 2002;106(1):50–56. | ||
Force T, Kemper A, Perkins L, Gilfoil M, Cohen C, Parisi AF. Overestimation of infarct size by quantitative two-dimensional echocardiography: the role of tethering and of analytic procedures. Circulation. 1986;73(6):1360–1368. | ||
Jeung MY, Germain P, Croisille P, El ghannudi S, Roy C, Gangi A. Myocardial tagging with MR imaging: overview of normal and pathologic findings. Radiographics. 2012;32(5):1381–1398. | ||
Nagao M, Yamasaki Y, Yonezawa M, et al. Geometrical characteristics of left ventricular dyssynchrony in advanced heart failure. Myocardial strain analysis by tagged MRI. Int Heart J. 2014;55(6):512–518. | ||
Cai J, Altes TA, Miller GW, et al. MR grid-tagging using hyperpolarized helium-3 for regional quantitative assessment of pulmonary biomechanics and ventilation. Magn Reson Med. 2007;58(2):373–380. | ||
Ley-Zaporozhan J, Ley S, Mews J, Weinheimer O, Kandel S, Rogalla P. Changes of emphysema parameters over the respiratory cycle during free breathing: preliminary results using respiratory gated 4D-CT. COPD. 2017;14(6):597–602. | ||
Yamashiro T, Matsuoka S, Bartholmai BJ, et al. Collapsibility of lung volume by paired inspiratory and expiratory CT scans: correlations with lung function and mean lung density. Acad Radiol. 2010;17(4):489–495. |
 © 2018 The Author(s). This work is published and licensed by Dove Medical Press Limited. The
full terms of this license are available at https://www.dovepress.com/terms
and incorporate the Creative Commons Attribution
- Non Commercial (unported, 3.0) License.
By accessing the work you hereby accept the Terms. Non-commercial uses of the work are permitted
without any further permission from Dove Medical Press Limited, provided the work is properly
attributed. For permission for commercial use of this work, please see paragraphs 4.2 and 5 of our Terms.
© 2018 The Author(s). This work is published and licensed by Dove Medical Press Limited. The
full terms of this license are available at https://www.dovepress.com/terms
and incorporate the Creative Commons Attribution
- Non Commercial (unported, 3.0) License.
By accessing the work you hereby accept the Terms. Non-commercial uses of the work are permitted
without any further permission from Dove Medical Press Limited, provided the work is properly
attributed. For permission for commercial use of this work, please see paragraphs 4.2 and 5 of our Terms.