Back to Journals » International Journal of Nanomedicine » Volume 17
Statistical Sequential Experimentation: Preliminary Mixed Factorial Design, I-Optimal Mixture Design Then Finally Novel Design Space Expansion for Optimization of Tazarotene Cubosomes
Authors Hegazy D ![]() , Tag R, Habib BA
, Tag R, Habib BA ![]()
Received 7 September 2021
Accepted for publication 1 February 2022
Published 12 March 2022 Volume 2022:17 Pages 1069—1086
DOI https://doi.org/10.2147/IJN.S337130
Checked for plagiarism Yes
Review by Single anonymous peer review
Peer reviewer comments 3
Editor who approved publication: Dr Mian Wang
Doaa Hegazy, Randa Tag, Basant Ahmed Habib
Department of Pharmaceutics and Industrial Pharmacy, Faculty of Pharmacy, Cairo University, Cairo, Egypt
Correspondence: Doaa Hegazy, Department of Pharmaceutics and Industrial Pharmacy, Faculty of Pharmacy, Cairo University, Kasr El Aini Street, Cairo, 11562, Egypt, Tel +20-100-911-0847, Email [email protected]
Objective: This study aims to illustrate the potential of sequential experimentation for statistically scientific based optimization of Tazarotene (TAZA) cubosomes.
Methods: Hot melt emulsification method was used for cubosomes preparation. A preliminary (3.2) mixed factorial design (MFD) was conducted to choose suitable types of stabilizer and surfactant that maximize entrapment efficiency (EE) and minimize particle size (PS). These chosen stabilizer and surfactant were to be used in the statistical design proposed for optimization of TAZA cubosomes (I-optimal mixture design) (IOMD). Glyceryl monooleate (GMO), stabilizer and surfactant amounts were the three mixture components (MixCs) studied in that design. Responses (EE, PS and drug percent released after 24 hours (Q24h)) were statistically analyzed. Numerical optimization using desirability function based on different responses’ importance was used to find an IOMD-optimized formulation (IOMD-OF) with the predetermined characters. Then, a novel statistical methodology of design space expansion was adopted to enhance Q24h. Suitable models to express EE, PS and Q24h were elucidated over the expanded mixture design (EMD) space. Validity of derived models was verified via prediction intervals and percent deviations of actual values from predicted ones for all the EMD design points. EMD was then navigated to find EMD-OF.
Results: Analysis of MFD showed that Pluronic-F68 and polyvinyl alcohol were the best stabilizer and surfactant to be used. First stage optimization after IOMD analysis led to a formulation with unsatisfactory Q24h of 58.8%. After design space expansion adoption, re-analysis and re-optimization, a satisfactory EMD-OF having EE of 82.1%, PS of 273.0 nm and Q24h of 68.8% was found.
Conclusion: Statistical sequential experimentation with the novel design space expansion approach proved to be a successful paradigm for enhancing TAZA cubosomes optimization. Thus, this paradigm is expected to have promising future applications in various pharmaceutical formulations optimization.
Keywords: statistically scientific based optimization, topical drug delivery, Box-Cox transformation, contour plots, Piepel’s trace plots, hot melt emulsification
Graphical Abstract:

Introduction
In order to treat a topical disease, drugs can be administered systemically or topically. Nowadays topical application of drugs is preferred over systemic administration. Systemic administration of the drug may expose it to first pass metabolism or being deactivated by stomach pH. Moreover, all body organs are subjected to the systemically administered drug which may result in undesired side effects. Although topical conventional dosage forms have been used for decades, they have drawbacks such as frequent dosing and skin irritation or damage.1 To avoid several side effects of conventional topical dosage forms application, topical nano-carrier drug delivery systems have been developed. These nano-carriers can be classified into polymeric, lipid, and metallic nano-carriers according to their composition. Of these nano-carriers, lipid-based type is the most common in pharmaceutical research.2 These lipid-based nano-carriers can be subdivided into three different classes: vesicular carriers such as liposomes,3 niosomes,4 proniosomes,5 cerosomes,6 nano-particulate carriers7,8 and emulsion based carriers.9–11
Cubosomes are cubic shaped liquid crystal dispersions composed of lipid layers, separating non-intersecting water channels. They are considered a promising type of nano-vesicles. Besides being a non-toxic, biocompatible and inexpensive drug delivery system, cubosomes’ special structure enables the incorporation of both hydrophilic and lipophilic drugs. Also, cubosomes have a bioadhesive nature. They can form a thin layer on skin and mucosal surfaces. This allows convenient delivery and deposition of topical drugs with fair temporary protection from irritation.12,13 So, cubosomes can be considered as one of the nano-drug delivery systems of choice for topical drug delivery. Cubosomes can be prepared from lipids such as phytantriol and glyceryl monooleate in the presence of steric stabilizers such as poloxamers, casein and lecithin.14 Surfactants such as PVA, Tweens15 and Brijs16 can also be added along with the aforementioned stabilizers. They have the advantage of being stable at room temperature.12
Tazarotene (TAZA) is a third-generation synthetic retinoid (vitamin A derivative) with a selective retinoic acid receptors (mainly RAR-β and RAR-γ) activity.17 It is used for topical treatment of several skin conditions such as acne, psoriasis and photo-aging. TAZA is present in market as 0.1% gel6 (Acnitaz®), 0.1% cream18 (Tazarotene®) and 0.1% foam19 (Fabior®). It was reported that long-term treatment with TAZA in conventional dosage forms caused several side effects.10 Market formulations were reported to have skin irritation side effects such as pruritus, redness and peeling.20 Therefore, it was necessary to develop skin targeting formulations that can increase TAZA deposition into skin and reduce those annoying side effects. These formulations included liposomes,21 cerosomes,6 proniosomal gel,22 microemulsions,10,11,23 spanlastic nano-vesicles,24 nanoparticles,25 niosomal gel and nano-sponges.26 TAZA was also formulated as in situ gels which were reported to be non-irritant to the skin.27
The use of statistical experimental designs, statistical modeling and optimization of responses based on derived models saves more time and effort than the traditional one-at-a-time experimentation.28 Also, the use of statistical designs enhances the experimental input-output quality. Statistical designs have been recently widely used in pharmaceutical research for formulation development and optimization. These designs vary from the parent factorial designs either full29,30 or fractional,31 to response surface designs (RSD) such as Box-Behnken designs32 and central composite designs16 to mixture designs33 and even combined mixture designs.34
Our study aims to move a step forward in the field of the use of statistics in pharmaceutical formulations development and optimization. In this study, statistically scientific based optimization is to be implemented. This is to be done through a statistical sequential experimentation strategy together with the novel approach of design space expansion for formulation optimization. Optimization of TAZA cubosomes for topical application will be performed as a practical example. To our knowledge, this is the first work to use design space expansion as a statistical tool for pharmaceutical formulation optimization.
Theory
In many recent pharmaceutical formulation studies, researchers adopted a certain statistical design. This design – whatever its type – is used for choosing which trials (design points) (DPs) will be done, then elucidation of a suitable polynomial model for representing each response. Simultaneous numerical optimization was then used to search for an optimized formulation based on the derived models. Though this traditional sequence is satisfactory to some extent, yet questions arise. How should the studied variables or components be chosen? What can we do if the optimization results were not satisfying enough? Shall we build a new design from scratch? Or what can we do? In this study, statistically scientific based optimization will be implemented through statistical sequential experimentation aided by design space expansion. This is to answer the previous questions and map how the best possible results can be reached while minimizing the amount of experimentation performed.
The proposed statistically scientific based optimization scheme in this study starts with a preliminary design for selecting suitable formulation parameters. This design should be a simple design of relatively few runs to screen suspected variables. Factorial designs whether full or fractional and their descendants such as Plackett-Burman or Taguchi designs fit very well for this job.28
After the selection of certain factors (independent variables) (IVs) and subsequent levels or ranges to be studied, the main statistical design for optimizing these IVs (whether they are process variables (PVs) or mixture components (MixCs) or both) should be implemented. It’s preferable not to consume all the experimentation trials of the research in this design. Only about 70–80% of experimentation trials are used to build this experimental design. In case of studying PVs where changing the level of one factor does not affect the others, a response surface design (RSD) may be used. This may be a Box-Behnken design, a central composite design, an optimal design, etc. While if the studied factors are MixCs, a mixture design (MixD) should be used. Although really important, MixDs are not as popular as RSDs. MixDs should be used when the studied IVs are proportions of a blend, where changes in one of the components can affect the relative amounts of others. Types of MixDs include simplex lattice design, simplex-centroid design, and various types of optimal designs.34,35 In different types of simplex designs, there is a specified pattern for DPs (mixtures of specific composition to be formulated) selection. However, in optimal designs there is more flexibility in DPs selection. This DPs selection is dictated by a desire of achieving a certain property (optimality criterion). An algorithm is used to build the design in a manner that highly achieves this optimality criterion. There are different types of optimal designs according to the optimality criterion.28 D-optimal designs are best for screening designs as they produce a design that best estimates factors’ effects. A-optimal designs minimize the average variance of the polynomial coefficients. G-optimal designs minimize the maximum value of prediction variance in the design region. Integrated variance optimal designs (I-optimal designs) minimize the average prediction variance across the experimentation region. These optimal designs may be mandatory in some cases. These obligatory cases include unequal component ranges or multi-component constraints. In others, they are privileged for the ability of selecting a certain optimality criterion according to the study aims. Where it’s required to study MixCs and PVs simultaneously, Combined mixture designs34 can be used, although their application in pharmaceutical research is still rare.
After implementation of the main optimization statistical design and elucidation of suitable models for navigation of design space, process or formulation optimization is performed either numerically or graphically. Now, some questions must be asked. Was the optimized formulation in the center of the design, or was it marginal? Has the optimized formulation achieved my predetermined constraints to a satisfactory degree or do I need to enhance certain response(s)? If the optimized formulation is marginal (that is, you can reach better results by choosing different levels or ranges or you need to improve a certain response in the optimized formulation), here comes the use of the saved 20–30% of the experimentation trials.
Instead of performing a new design from scratch to choose different levels of PVs or ranges of MixCs, a novel statistical approach can be adopted, which is expansion of the design space. The saved 20–30% of the experimentation trials is now used to change the levels of some factors or ranges of MixCs. This change is dictated by the direction which is believed to be towards a sweeter optimization spot or towards the increase or decrease of a certain response. This change leads to an expansion of design space without the need of building a new design. The new DPs performed in this extra space may be added in the same block as the initial DPs or may be added in a new block. This can be decided case by case by judging whether any of the constant factors have been changed for the new DPs.36
Experimental details
Materials
Tazarotene was kindly supplied by ENALTEC Labs, Navi Mumbai, India. Glyceryl monooleate (GMO), Pluronic® F127 (PL-F127), Pluronic F108 (PL-F108), Pluronic F68 (PL-F68), Brij® 53, and Polyvinyl alcohol (PVA; Mwt. 13,000–23,000, 87–89% hydrolyzed) were purchased from Sigma Aldrich®, Darmstadt, Germany. Methanol, Sodium chloride, Disodium hydrogen phosphate, Potassium dihydrogen phosphate and Sodium lauryl sulphate were purchased from Adwic, El-Nasr Pharmaceutical Chemicals Co., Cairo, Egypt. All other chemicals and solvents were of analytical grade. Water used was deionized, distilled water.
Statistical Design
In this study mixed factorial design (MFD) (3.2) was chosen as the preliminary design. This design was chosen to select a stabilizer and a surfactant for formulation of TAZA loaded cubosomal dispersions. Three levels of stabilizer (PL-F68, PL-F108 and PL-F127) and two levels of surfactant (PVA and Brij 35) were incorporated into the study. Fixed amounts of GMO, TAZA and water were used. The prepared formulations were investigated for their entrapment efficiency percentage (EE) and particle size (PS).
On the basis of results obtained from the preliminary study, a statistical design was needed to search for the best proportion with which the components should be mixed to optimize a cubosomal formulation with desired characteristics. Hence an I-optimal mixture design (IOMD) was chosen as it can be the mixture design of choice when prediction across the experimental space is the main aim of the study. It was decided to use only 10 experimentation trials in this design to leave the possibility for design space expansion if needed. The components studied in the IOMD coded in different methods together with the responses studied and their constraints are shown in Table 1. Figure 1 shows the IOMD space with its 10 DPs (C1-C10). The detailed composition of the 10 cubosomal formulations (C1-C10) prepared accordingly is shown in Table 2.
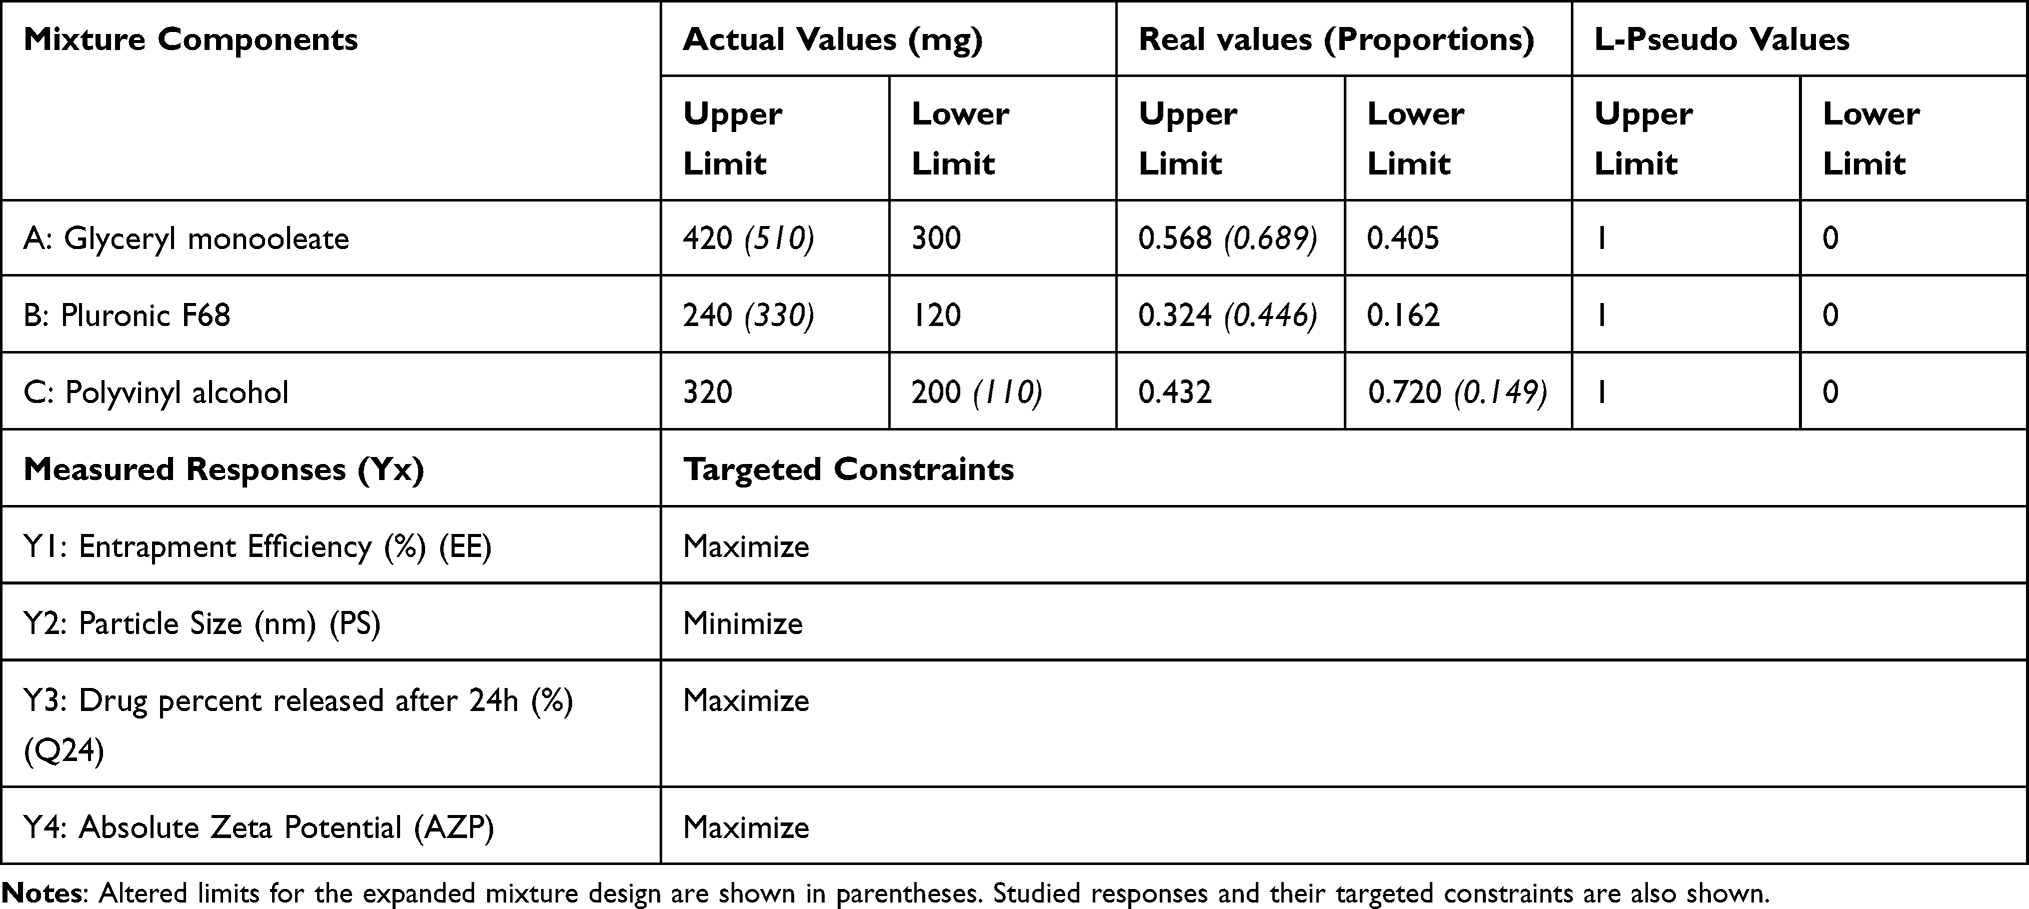 |
Table 1 Mixture Components Studied in the I-Optimal Mixture Design with Their Constraints Expressed in Different Values |
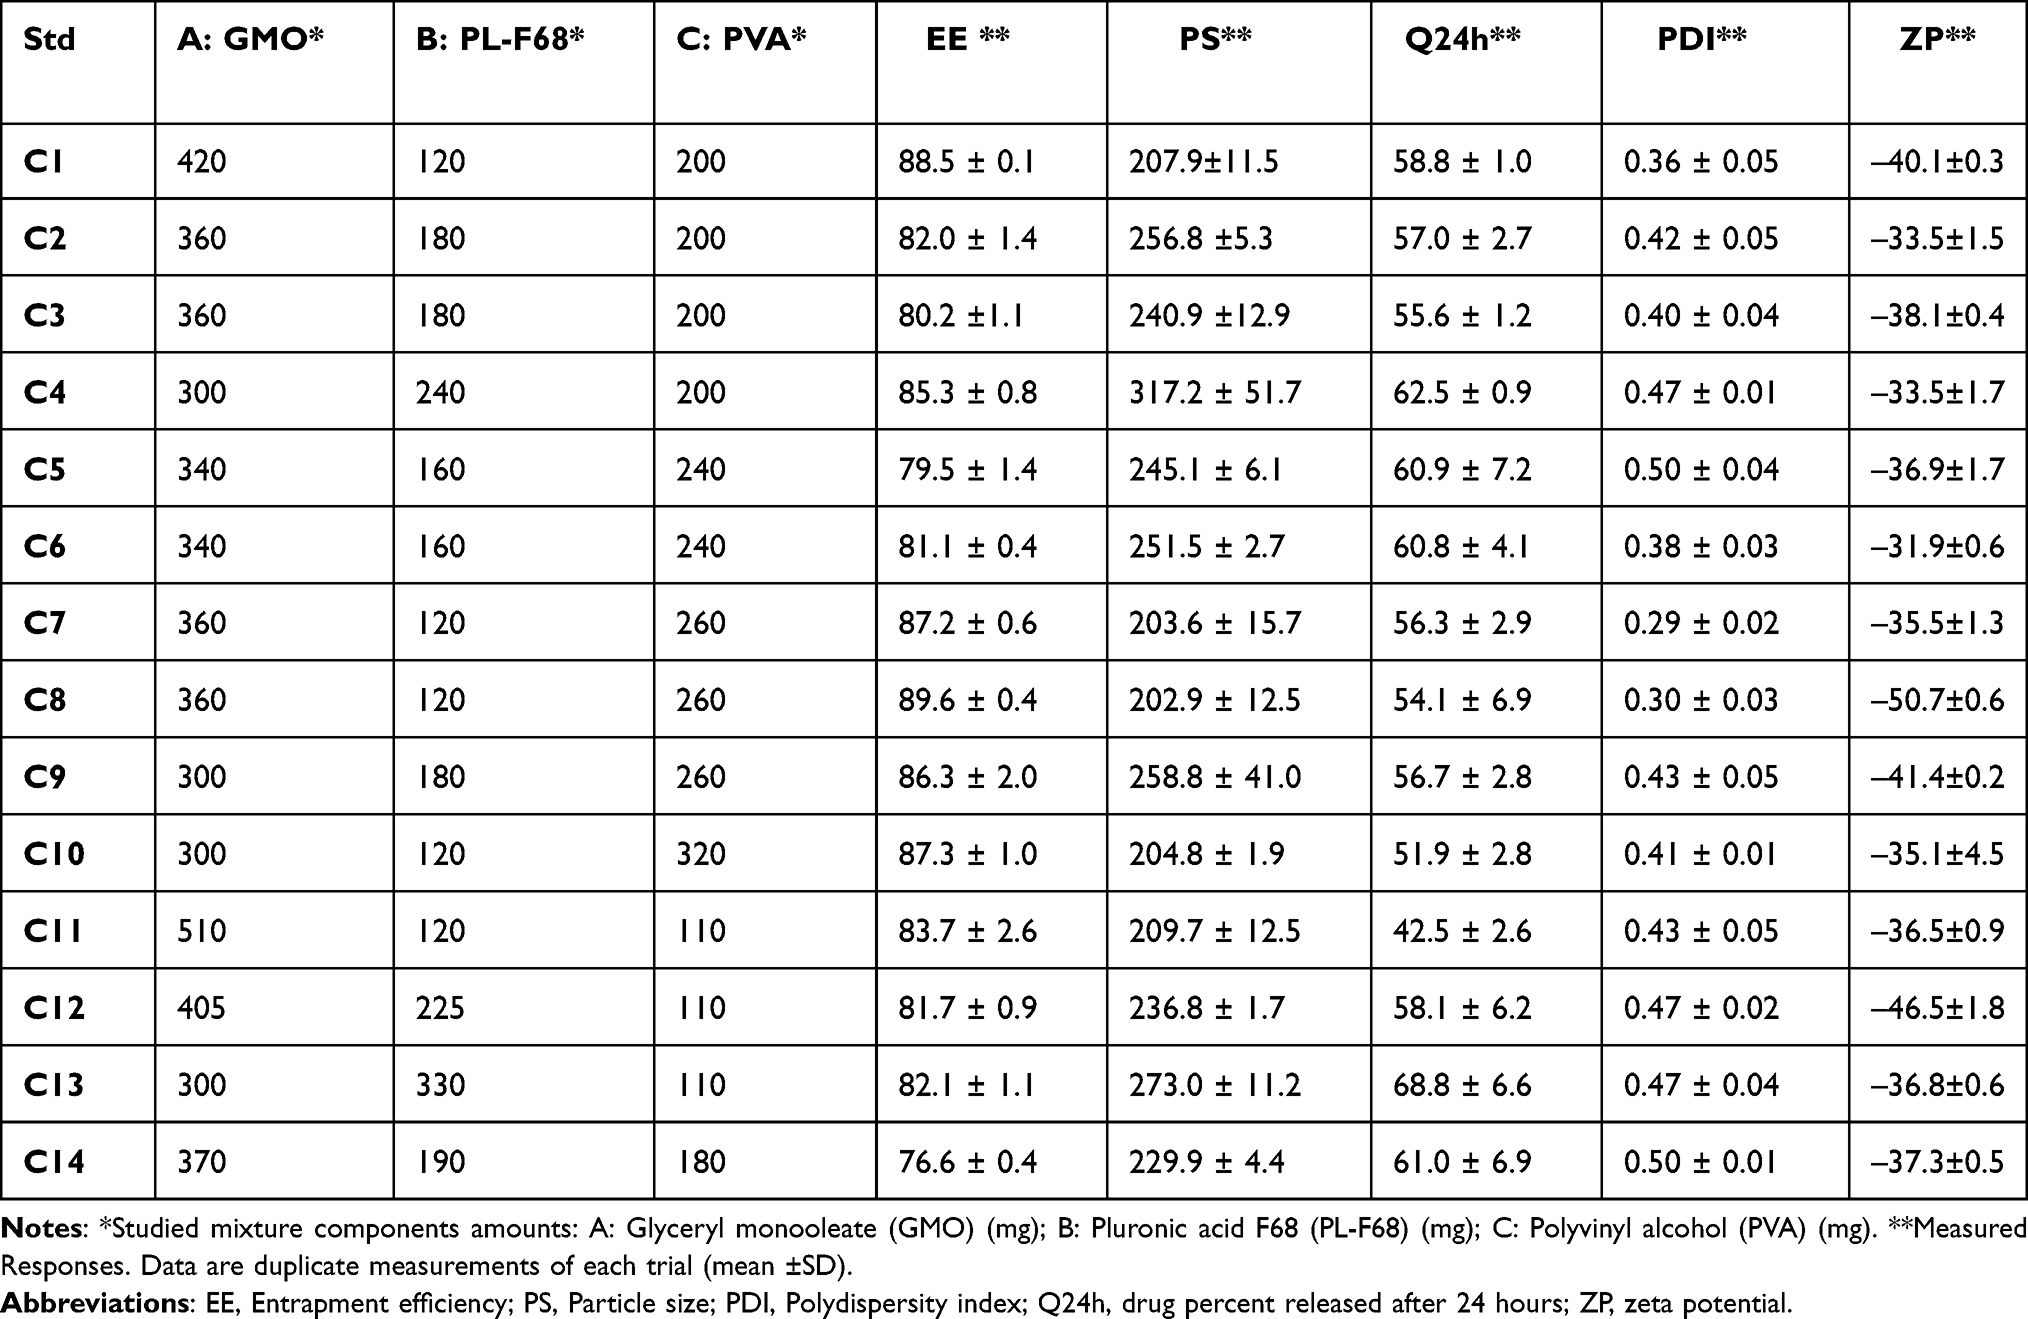 |
Table 2 Composition and Characterization of Cubosomes Prepared According to Different Design Points of I-Optimal Mixture Design (C1-C10) and Extra Points Added in Expanded Design Space (C11–C14) |
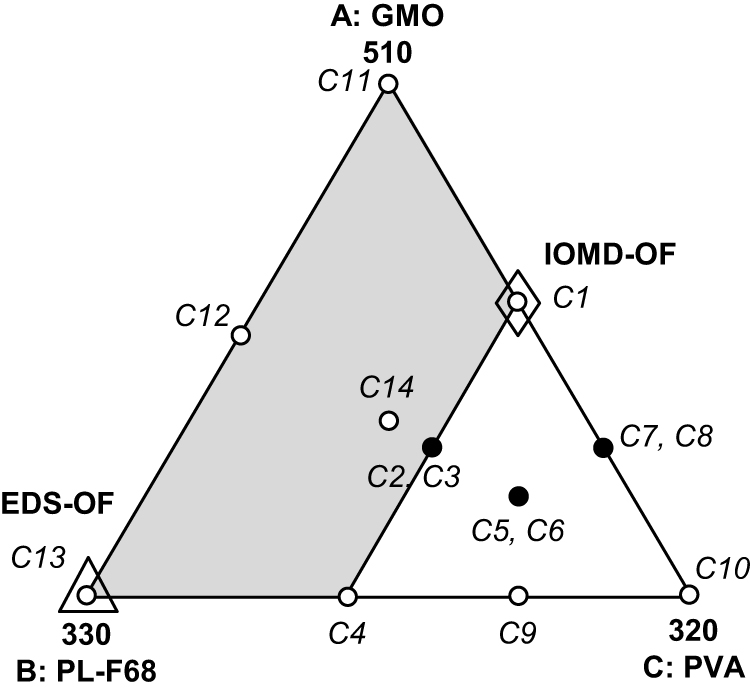 |
Figure 1 I-optimal mixture design (IOMD) space - defined by the constraints 300≤A≤420, 120≤B≤240 and 200≤C≤320 - and its DPs (C1–C11) together with extra added DPs (C11–C14) to give the expanded mixture design (EMD) space defined by the constraints 300≤A≤510, 120≤B≤330 and 110≤C≤320. Where; A = Glyceryl monooleate amount (mg), B = Pluronic F68 amount (mg), and C = Polyvinyl alcohol amount (mg). Design points (DPs): O single trial, ● replicated trial, ◊ selected optimized formulation from IOMD (IOMD-OF), Δ selected optimized formulation from EMD (EMD-OF). |
Expansion of design space in a certain required direction was finally adopted. Four extra trials were performed which represent the DPs at the two new vertices, the center of the new edge and the overall centroid of the expanded mixture design (EMD) space (see Figure 1). As the experimental space was expanded in a certain direction, only some of the limits of the ranges of original space of the IOMD changed. The limits that changed to obtain the new EMD space are shown in italics in Table 1. The detailed compositions of the extra four DPs (C11-C14) are shown in Table 2.
Preparation of TAZA Cubosomes
TAZA cubosomes (TAZA-Cs) were prepared by melt dispersion emulsification method.15 Accurately weighed amounts of GMO, stabilizer and 10 mg TAZA were melted on a hot plate magnetic stirrer (Model MSH-20D, Wise Stir, Daihan Scientific Co. Ltd, Korea) at 70°C. Accurate amount of surfactant was dissolved in a certain amount of water and the aqueous solution was heated to the same temperature and added dropwise to the molten lipid mixture under continuous stirring at 950 rpm. TAZA-Cs were formed as milk-like dispersions. All formulations were left to cool gradually at room temperature. Then they were homogenized by intermittent probe sonication for 10 minutes (5 s on and 5 s off).37 TAZA-Cs were kept at room temperature for further investigations.
Characterization of Prepared Cubosomes
EE and Drug Loading (DL)
Entrapment efficiency of TAZA-Cs was determined by separating the un-entrapped free drug. One mL of each formulation was centrifuged for 1 hour at 4°C and 22,000 rpm in an ultra-cooling centrifuge (Model 3–30KS, Sigma Laborzentrifugen GmbH, Osterode am Harz, Germany). The supernatant containing free TAZA was diluted with methanol and spectrophotometrically measured (UV-1601 PC shimadzu, Kyoto, Japan) at λmax= 351.5 nm. EE was calculated using the following formula:38
Drug loading for TAZA-Cs was calculated using the following equation:39,40
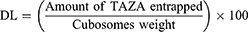
Where cubosomes weight is the weight of the lipid mixture of the formulation.
PS and Polydispersity Index (PDI)
In order to determine PS and PDI of the formulations, TAZA-Cs were appropriately diluted with water and measured by Malvern zetasizer (Model ZEN3600, Malvern Instrument Ltd, Worcestershire, England). The measurements were carried out at 25°C.41
ZP
Determination of ZP depends on measuring the mobility of charged moieties in an electric field.41 Malvern zetasizer was used to measure ZP at a potential of ± 150 mV via a laser Doppler anemometer.42 TAZA-Cs were diluted and measured for ZP at 25°C.
Q24h
The in-vitro TAZA release from TAZA-Cs was conducted in a horizontal shaking water bath (GFL, Gesellschaft Laboratories, Berlin, Germany). One mL of each formulation was placed in a dialysis bag (12,000–14,000 molecular weight cut off). The release medium was 50 mL hydro-alcoholic solution (PBS of pH = 7.4: methanol in ratio 1:1) containing 0.05% sodium lauryl sulphate at 37°C ± 0.5 under agitation speed of 50 rpm.21 The solubility of TAZA in water is very low (practically insoluble in water)43 as it is a highly lipophilic drug (Log P= 5.96).11 Hydroethanolic solution was used as a release medium to achieve the sink conditions.21,44 Samples of 3 mL were withdrawn at time intervals 0.5, 1, 1.5, 2, 3, 4, 6, 8 and 24 hours. The withdrawn aliquots were replaced by 3 mL of the dissolution medium each time. The amounts of TAZA released (µg/mL) were spectrophotometrically measured at λmax = 351.5 nm. For all formulations, Qn was calculated according to the following formula:38
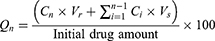
Where, Qn represents the cumulative percent of TAZA released, Cn is the receptor medium current concentration at nth sample, Vr is the receptor medium volume, Vs is the volume of each sample removed for analysis, and  denotes the summed total of the previously measured concentrations. Q24h was determined for each formulation.
Testing the Validity of the Elucidated Polynomial Models
In order to test the validity of the proposed statistical models for the whole EMD, 95% two-sided prediction intervals (95% PIs) for the predicted values of the investigated responses were calculated. It is an objective and statistically suitable method for model validity testing. The prediction interval (PI) is the range within which a single future response for a specified combination of PVs/MixCs is supposed to lie. All prepared 14 combinations (C1-C14) were inspected to find whether the actual values for their measured responses fall within the 95% PIs or not. Also percent deviation of actual responses measured from predicted ones were calculated according to the following equation:38
Development of Optimized Formulation
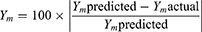
Optimization of TAZA-Cs was performed using the multi-response numerical optimization technique.45 Desirability function based on the individual desirability (dm) of each response (Ym) was used as the basis of optimization in many studies.29,30 In this research an extra feature of this function was used which is different levels of importance for responses to be optimized. A certain response (Q24h) was chosen to have higher importance than other responses as the release of the optimized formulation was the most important criterion. Q24h was to be given an importance value of 3 and the other responses a value of one. Design expert software (V.12, Stat-Ease Inc., MN, USA) (DX) software offers this by changing the importance given to each response from one to five based on the following formula:
where D is the desirability of the formulation ranging from zero to one, dm is the individual desirability of each response ranging from zero to one, m is the number of responses to be optimized, ri is the importance given to each response ranging from one to five.
At first IOMD was navigated and an optimized formulation within this space (IOMD-OF) was found. After design space expansion for enhancing the properties of IOMD-OF, another optimization process was performed to find the optimized formulation of the whole expanded mixture design (EMD-OF).
Investigation of Morphological Characters of EMD-OF
The morphological characters of the EMD-OF were investigated by transmission electron microscope (TEM) (Jeol, Jem-2100, Tokyo, Japan). EMD-OF was diluted with water then a drop of the diluted dispersion was placed on a copper grid coated with carbon, negatively stained with 1% phosphotungstic acid (w/v) and left to dry in air for 5 minutes. The stained sample was then placed into TEM for imaging. TEM was operated at 80 kv at room temperature and the morphological characters EMD-OF were inspected at proper magnifications.46
Statistical Analyses
Design expert software® (V.12, Stat-Ease Inc., Minneapolis, MN, USA) was used for analysis of the MFD and construction of the IOMD and its subsequent analysis and finding IOMD-OF. It was used for navigation of the expanded design space as well as finding EMD-OF.
Results and Discussion
Preliminary Parameters Selection
Upon exploring the different factors and interactions affecting different responses PL-F68 and PVA were respectively selected from the stabilizers and surfactants studied in the MFD as this would result in the maximized EE and minimized PS.
IOMD Results and Analysis
Composition and characterization of formulations prepared according to the IOMD (C1-C10) are listed in Table 2. Release profiles of TAZA from these trials and from TAZA suspension are shown in Figure 2. The chosen ranges for MixCs studied (stabilizer and surfactant) led to a wide range of characterization results. EE ranged from 79.5% ± 1.4 to 89.6% ± 0.4, PS ranged from 202.9 nm ± 12.5 to 317.2 nm ± 51.7, Q24h ranged from 51.9% ± 2.8 to 62.5% ± 0.9, PDI ranged from 0.29 nm ± 0.02 to 0.50 ± 0.04 and ZP ranged from −31.9 mV ± 0.6 to −50.7mV ± 0.6. All the formulations had a PDI of 0.5 or less indicating narrow size distribution.47 As for ZP which gives an indication about the physical stability of the system, all the formulations carried negative charges. This is mainly due to the presence of ionized carboxylic groups of GMO on their surfaces. It can also be due to the ionized water molecules surrounding the cubosomes.48 ZP of all prepared formulations was more negative than −30 mv. It was reported that an absolute ZP value more than 30 mV is sufficient for good repulsion and physical stability.49,50 So, all the prepared Cs are considered to have an acceptable stability against aggregations. Thus, optimization was based on selecting a formulation that maximizes EE and Q24h and minimizes PS.
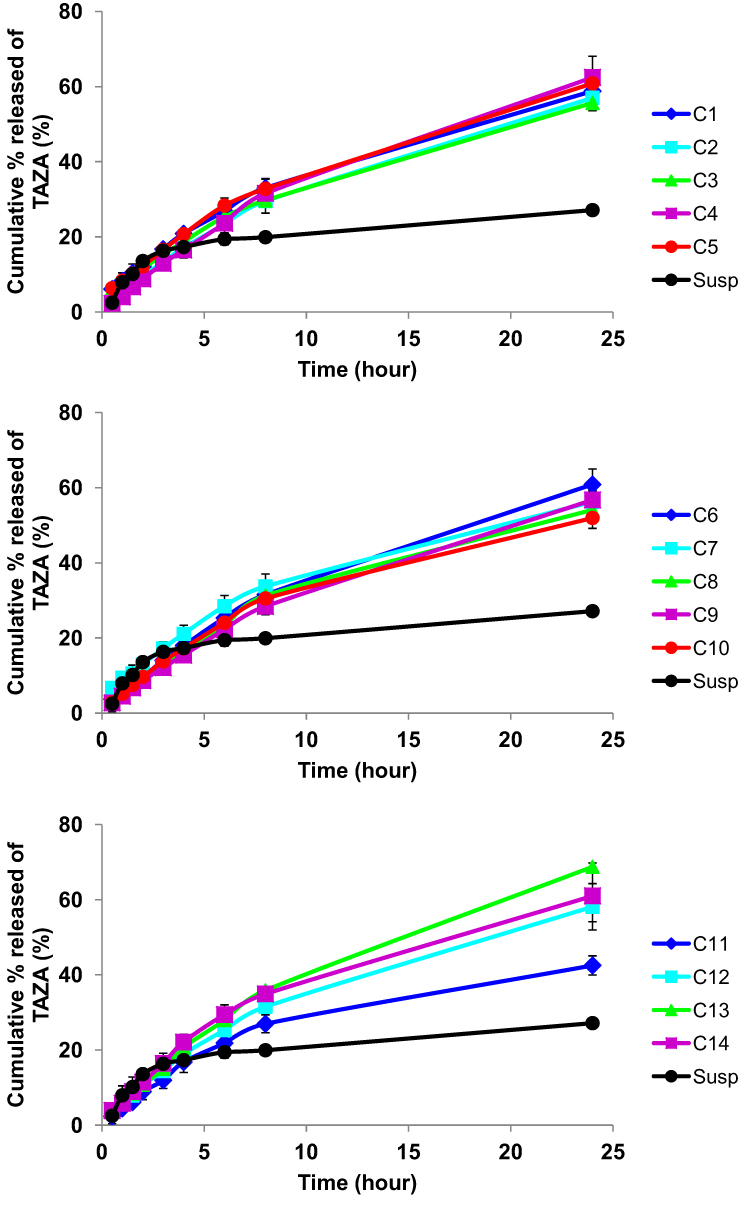 |
Figure 2 Release profiles of TAZA from trials (C1 – C14) compared with TAZA release from suspension. |
Optimization Based on IOMD
The measured values of the three responses; EE, PS and Q24h were individually analyzed. Reduced polynomial models based on maximizing prediction R2 were derived. EE, PS and Q24h were modeled with suitable prediction R2 of 0.8501, 0.9432 and 0.9028 respectively. Contour plots for the EE, PS and Q24h over the IOMD space are shown in Figure 3A-C. Numerical optimization - giving higher importance of 3 to Q24h - based on these models was performed. This optimization resulted in a formulation having the components of the previously performed trial C1. This formulation (C1 = IOMD-OF) resulted in EE of 88.7%, PS of 206.5 nm and Q24h of 58.8% and desirability of 0.753. IOMD-OF is shown in Figure 3D having the highest possible desirability.
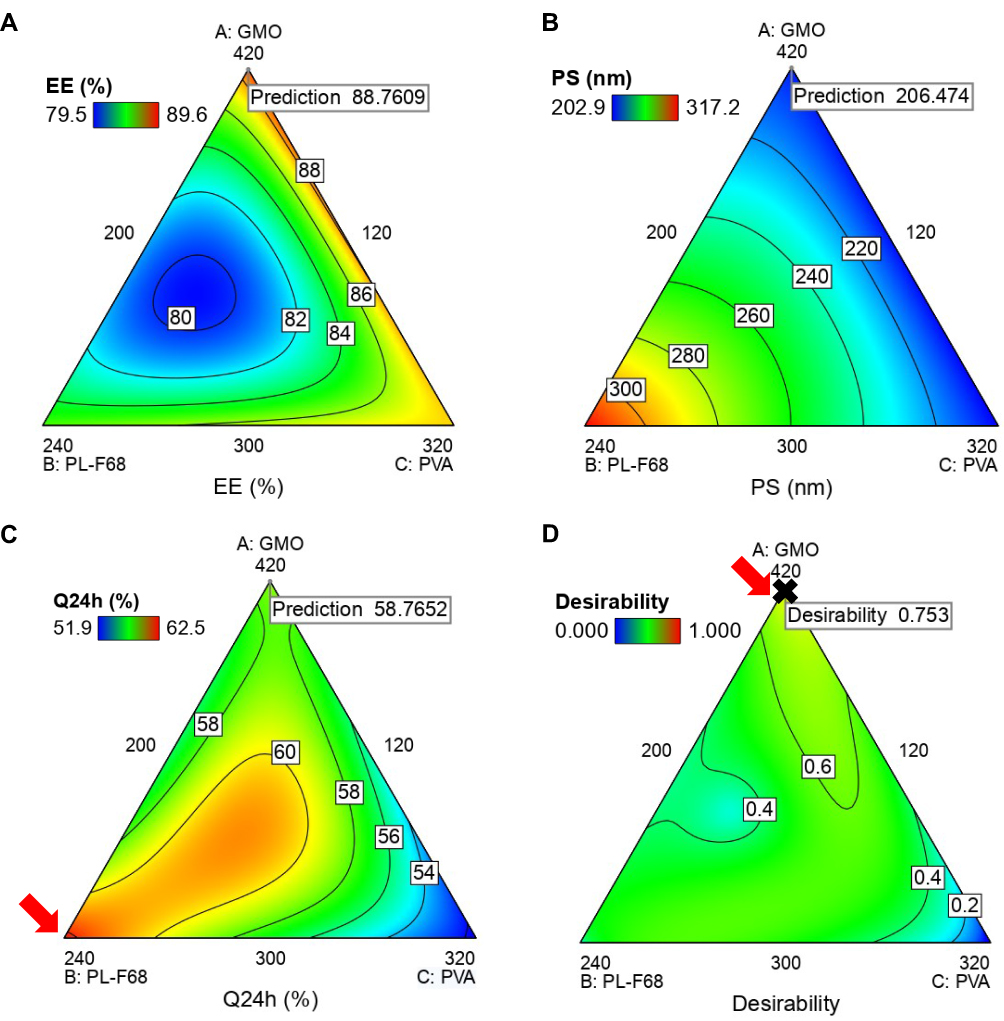 |
Figure 3 Contour plots showing the changes in (A) Entrapment efficiency, (B) Particle size, (C) Drug percent released after 24h (Q24h) and (D) desirability over the I-optimal mixture design space. Arrows represent regions of maximum: (C) Q24h and (D) desirability, ✖ represents the selected optimized formulation based on this design (IOMD-OF). |
Design Space Expansion
This IOMD-OF had unsatisfactory Q24h, and here comes the importance of not using all experimentation trials to be done in the main design. Expansion of design space was done in an attempt to increase Q24h. The direction of design expansion was dictated by the two vertices, one at which maximum Q24h was found and the other showing maximum desirability in the IOMD (see arrows in Figure 3C and D). These directions dictate an increment in the upper limits of A: GMO and B: PL-F68 and a reduction in lower limit of C: PVA. These limits changes are shown in parentheses in Table 1. Expanded design space is shown in Figure 1 in which the DPs of the IOMD (C1–C10) and the extra added points (C11–C14) are clarified. The whole EMD with its 14 DPs (C1–C14) was navigated to model each response individually. Composition and characterization of the extra added points (C11–C14) are listed in Table 2. Release profiles of TAZA from these trials and from TAZA suspension are shown in Figure 2.
EMD Results and Analysis
EE was adequately modeled using reduced three-factor interaction model with prediction R2 of 0.7342. PS and Q24h responses could not be directly modeled. Box-Cox transformations were recommended by DX for these responses.
Box-Cox transformation was introduced by George Box and David Cox in 1964 to transform the studied data into normal shape.28 Design expert software has the ability to suggest and conduct those transformations for some responses when ordinary modeling is not adequate enough.51,52 This transformation minimizes the natural log (ln) of the residual sum of squares by selecting a certain value for power transformation (λ) to which all results of a response are raised. The required transformations for the responses of PS and Q24h are shown in Figure 4. PS and Q24h were recommended to be raised to the power of −1.62 and 2.24 respectively. These recommended transformations were applied leading to adequate modeling of PS and Q24h with prediction R2 of 0.9225 and 0.8145 respectively. Final model terms for each response and their coefficient estimates appearing in the final equations derived from EMD analysis in addition to their p-values are illustrated in Table 3. This table shows final models’ evaluations too. From this table it is clear that all measured responses were significantly affected by the studied mixture components. Alpha was set at 0.05, and coefficients with p value <0.05 (shown in bold) are considered to significantly affect the respective response. As for model evaluation, all the derived models showed relatively small relative mean square error (RMSE) and coefficient of variation percent (CV%). Model adequacy was also verified by the high values of different calculated regression coefficients (R2); R2, Adjusted R2 and Prediction R2. Prediction R2 is the most relevant regression coefficient in optimization studies. Prediction R2 determines the ability of the derived model to predict the responses’ values for a new formula within the design space even if its mixture combination has not been investigated in the design. Prediction R2 values for the three studied responses were 0.7342, 0.9225 and 0.8145 for EE, PS and Q24h respectively. These values were high enough and were in good accordance with the Adjusted R2 values of 0.7873, 0.9255 and 0.8410 respectively.
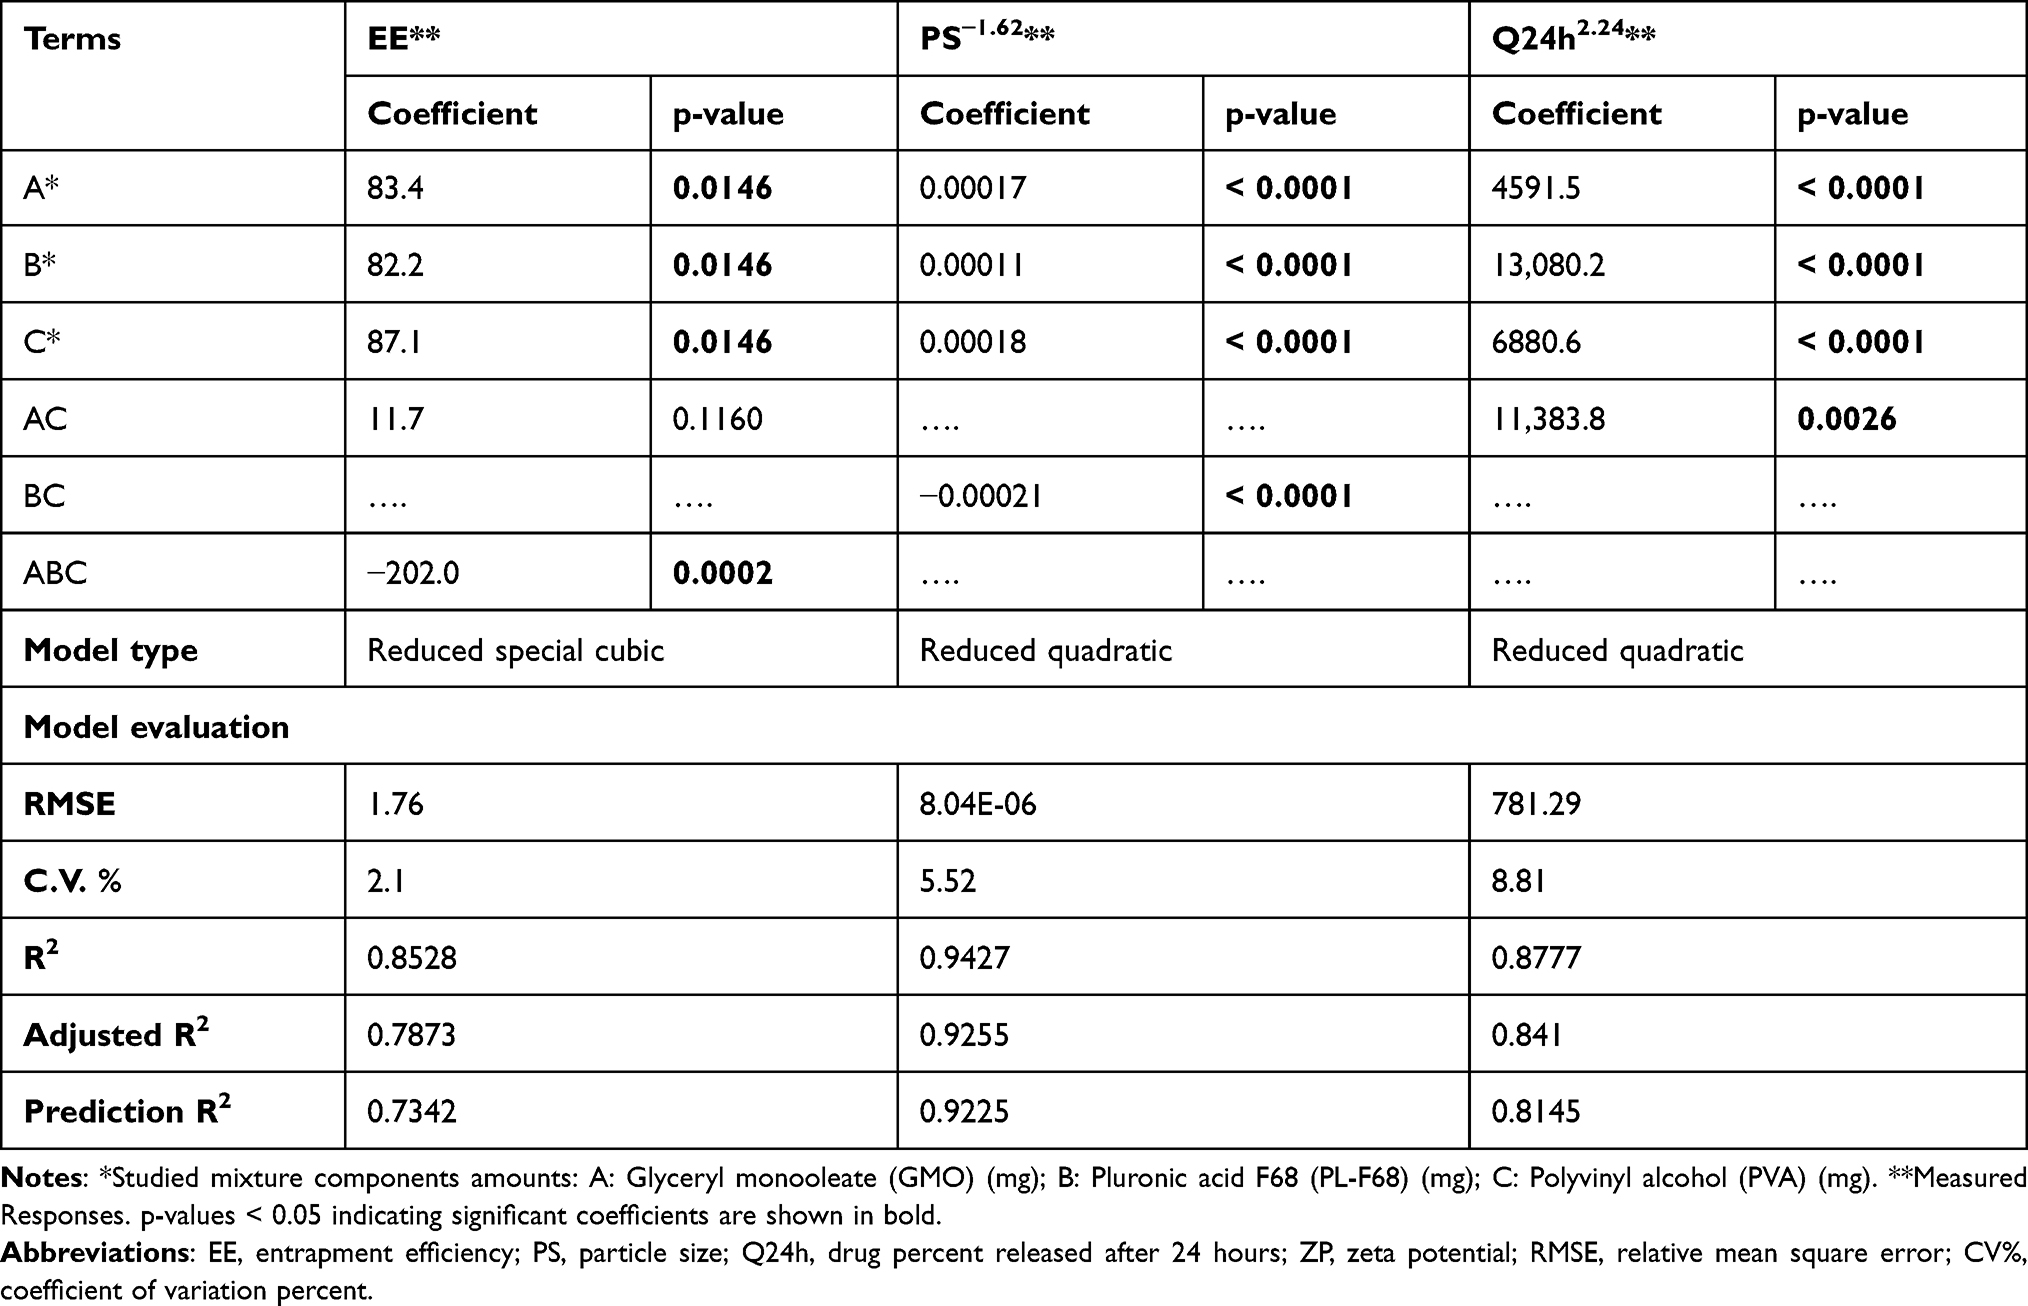 |
Table 3 Coefficient Estimates for Different Model Terms – Appearing in the Final Equations from the Expanded Mixture Design – for Each Response and Their Significance, Together with Models’ Types and Evaluation |
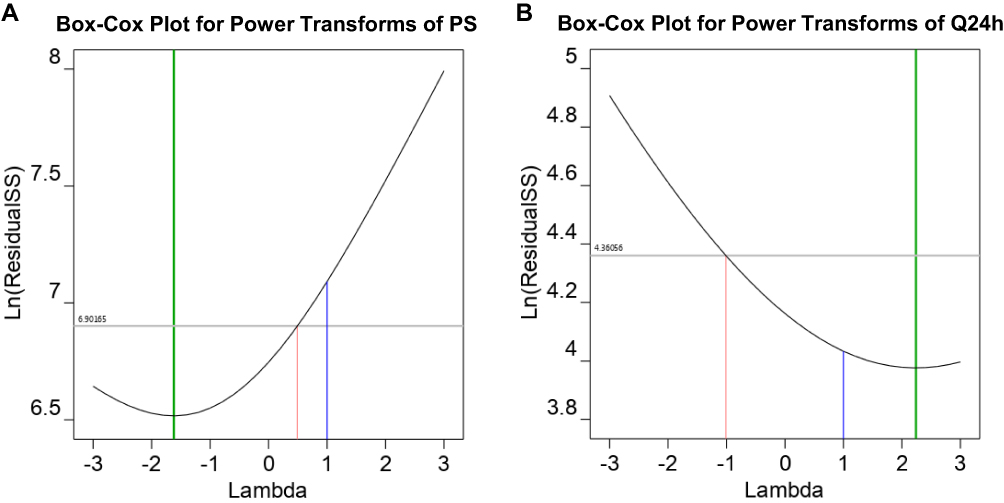 |
Figure 4 Box-Cox plot for data transformation showing ln residual sum of squares (ln residual SS) without transformation and after recommended transformation for the responses: (A) Particle size, (B) Drug percent released after 24h. |
Testing the Validity of the Developed Polynomial Models
In order to check the validity of results obtained from the EMD, the actual results of the three investigated responses for each of the 14 TAZA-Cs were compared with the predicted values developed by the software. Comparison took place via percentage deviation calculation. Maximum % deviation for EE, PS and Q24h were 3.8%, 7.3% and 6.3% respectively. All the results of the three responses for all formulations were found to fall within 95% PI. This ensures the validity and reliability of the derived models over the EMD space.
Effect of MixCs Used on the Studied Responses
For illustrating the effects of the studied MixCs on each of the studied responses, contour plots and Piepel’s trace plots were used. In contour plots, the response under study is shown as lines of equal value. These lines show the variation of this response all over the design space. In Piepel’s trace plots, the reference blend of values (1/3, 1/3, 1/3) for the three MixCs is the main point in the plot. A line is drawn for each MixC. The X axis for each line represents the deviation of this MixC from the reference blend in L-pseudo values. As each MixC has L-pseudo values ranging from 0 to 1, its deviation from reference blend ranges from −1/3 to 2/3. Tracing each MixC is moving with this MixC from its base (L-pseudo value = 0 and deviation = −1/3) passing through reference blend (L-pseudo value = 1/3 and deviation = 0) till we reach its peak (L-pseudo value = 1 and deviation = 2/3). Upon tracing the increment in each MixC, the values of the two other MixCs decrease simultaneously but keeping their ratio the same as in their reference blend (1:1). The response under study is shown on the Y axis.
EE and DL
EE is a valuable parameter in the assessment of nano-drug delivery systems. It shows the capability of the prepared nano-system to carry the drug. EE represents the portion of drug incorporated into the nano-carrier from the initial amount used. For accurate EE determination, the unentrapped drug needs to be separated from the nano-carrier containing the entrapped drug.53 The higher the EE the more drug delivered into the skin. This can be beneficial in the treatment of some topical diseases such as psoriasis which need high levels of drug into the skin.54 Also, high EE means less irritation to the skin surface that may occur when there is a direct contact with the drug.55
From Figure 5A and B illustrating Y1 (EE), it can be seen that for all the studied components, the reference blend showed nearly the least entrapment efficiency, with increasing the EE upon decreasing or increasing any of the studied MixCs. Before the reference blend, increasing GMO leads to an increase in the hydrophobicity of cubosomes and accordingly production of smaller PS. This may result in decreasing EE with increasing GMO before reference blend. As for reduction in EE with increasing of PVA and PL-F68 before the reference blend, this may be due to increasing solubility of TAZA in the aqueous phase. After the reference blend point, the increase of any component led to increasing EE. Increasing EE with increasing GMO amount can be attributed to the lipophilic nature of TAZA so it tends to be more entrapped when GMO increases as it became strongly attracted to the hydrophobic domain of the dispersion. Increasing EE with increasing either PL-F68 or PVA may be attributed to forming a coat around the formed cubosomes to stabilize them. This coat might contribute to the increased EE by retaining more drug with higher amounts of PL-F68 or PVA.56,57 DL for all the studied formulations ranged from 1 to 1.2%.
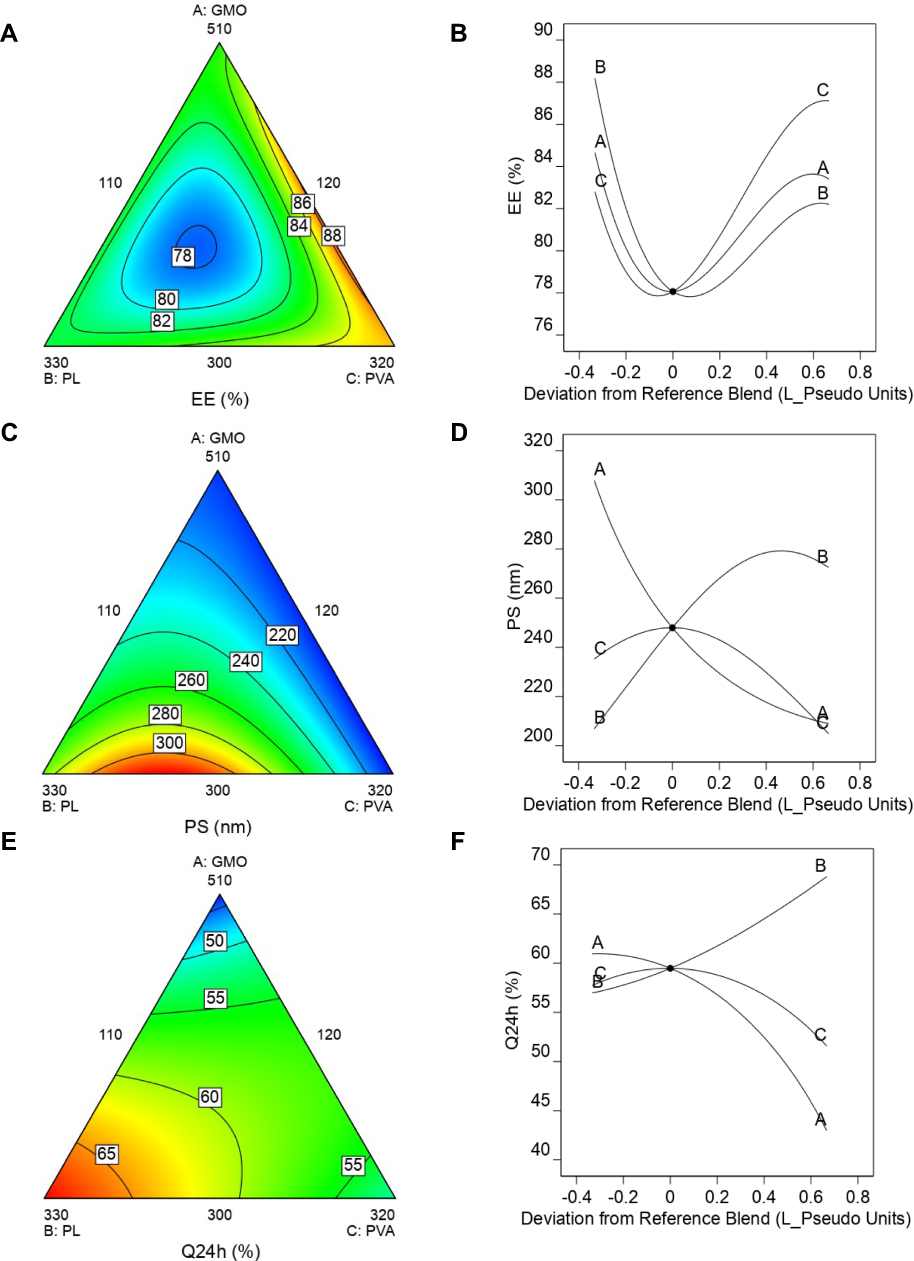 |
Figure 5 Contour plots and Piepel’s trace plots showing the changes in Entrapment efficiency (A and B), Particle size (C and D), Drug percent released after 24h (E and F) over the expanded mixture design space. |
PS
PS is a crucial parameter to be investigated for nano-carriers, as it has an influence on EE, drug release profiles, stability, mucoadhesion and cellular uptake of nano-systems.58,59
The response of PS is illustrated in Figure 5C and D. As for GMO, the higher the amount of GMO used the lower the PS. This may be due to increasing the hydrophobic domain of the cubosomal dispersion and therefore the surface free energy decreased leading to smaller PS.60 This is in contrary with Younes et al. and El-Deeb et al. Results of both studies stated that increasing GMO led to increase in PS of Sertaconazole and Brimonidine tartrate cubosomes respectively. The findings of these studies could be because of the increased dispersion viscosity which might have hindered formation of smaller cubosomes.15,16 PS showed a parabolic increase with increasing amount of PL-F68. This may be attributed to the intercalation of the increased amounts of PL-F68 in between the cubosomal bilayers. These findings are in agreement with the results reported by El-Deeb et al. It was found that high PL-F68 amounts in respect to GMO amounts caused a significant increase in particle size of Brimonidine tartrate cubosomes. This was justified that the triblock copolymer molecules of the poloxamer were accumulated into the bilayer causing its expansion and PS enlargement.15 PS showed a parabolic increase with increasing amount of PVA with maximum PS at reference blend then PS decreases with further increment in the amount of PVA. The increase in PS before reaching the reference blend may be attributed to PVA adsorption on cubosomal surface. Also, it can be due to the elevation of aqueous phase viscosity that may hinder the dispersion and subdivision of droplets.56 The reduction of PS with increasing PVA after reference blend may be explained on the basis that the PVA as a surfactant can minimize particles coalescence leading to smaller cubosomes. This explanation was also adopted by Esposito et al. They reported that increasing the PVA concentration led to PS reduction of topical cubosomes due to minimizing particles coalescence.61
Q24h
The in vitro drug release studies reflect the quality of nano-carriers. It can also predict the nano-carrier in vivo behaviour and performance.62,63 It was reported that nano-carriers intended for topical delivery may be embedded into the stratum corneum and drugs are supposed to be released and diffuse through the remaining deep skin layers.64 This shows how much the evaluation and determination of drug percent released is crucial. Accordingly, Q24h was selected to be the most important response incorporated into the design.
The response of Q24h is illustrated in Figure 5E and F. Generally, the increase of GMO or PVA amounts resulted in a decrease in Q24h. On the contrary the increase in PL-F68 led to an increase in Q24h. Because TAZA is a highly lipophilic drug (log P=5.96), it prefers to be retained into the lipophilic cubosomes rather than diffusing into aqueous release media. GMO was reported to cause release retardation for lipophilic drugs.65 So, increasing GMO led to a logic decrease in Q24h due to the elevation of hydrophobic portion of cubosomal dispersion. These findings were similar to those reported by Elgindy et al. as amounts of progesterone released after 24 hours from progesterone-loaded cubosomes decreased with increasing GMO amount.48 Similar results were mentioned by Sherif et al. where the percentage released of alpha lipoic acid from cubosomes decreased by increasing GMO amounts.66 The increase in Q24h with increasing PL-F68 may be due to increasing TAZA solubility in the release media with increasing PL-F68 proportion. This may help the drug diffusion through the medium and increase Q24h. This finding is contrary to Morsi et al., who found that elevated poloxamer-407 concentration led to decrease in percentage silver sulfadiazine released from the cubosomes. The explanation for this is that at low poloxamer concentrations, the polymer molecules adhere to the cubosomal surface and fewer are incorporated into its internal structure. This led to formation of cubosomes with double diamond (cD) patterns. But, at higher poloxamer concentrations, it participates in the internal cubic matrix leading to a primitive (cP) structure which is characterized by more restricted drug release than cD patterns.67 PVA, as previously mentioned, can make a coat surrounding the cubosomes. This may result in increasing the distance through which the drug diffuses. Therefore, at higher PVA amounts, fewer drug amounts are released. This is in agreement with the results found by Aboud et al. where the increase in PVA concentration decreased Sildenafil release rates from the prepared cubosomes.56
Optimization Based on EMD
Numerical optimization - giving higher importance of 3 to Q24h - based on the models derived for EMD was performed. This optimization resulted in a formulation having the components of the previously performed DP C13. This formulation (C13 = EMD-OF) resulted in EE of 82.1±1.1%, PS of 273.0±11.2 nm and Q24h of 68.8±6.6% and desirability of 0.650. EMD-OF is shown in Figure 1.
Investigation of Morphological Characters of EMD-OF
Morphological examination of stained EMD-OF using TEM - Figure 6 - showed the irregular angular cubic shapes of the prepared optimized formulation. PS was also in harmony with those measured by zetasizer.
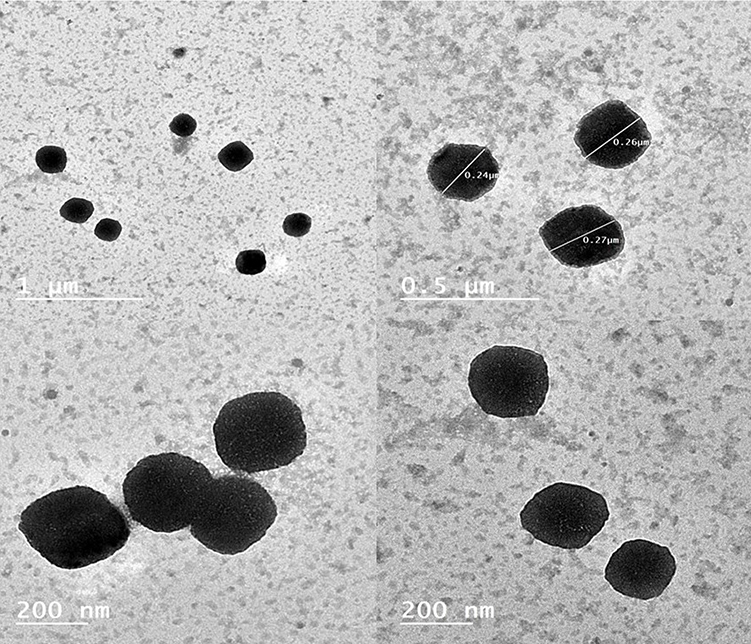 |
Figure 6 Transmission electron microscope morphological examination for stained expanded mixture design optimized formulation showing its cubic shape. |
Conclusion
Statistical sequential experimentation was adopted successfully in this research for optimizing Tazarotene cubosomes. This was done through three successive steps. First step: A preliminary mixed factorial design for stabilizer and surfactant choice. Second step: Construction of the main experimental design (I-optimal mixture design) (IOMD) in which amounts of chosen stabilizer and chosen surfactant were simultaneously changed with amount of lipid used. Optimization of a formulation with predetermined characters of different levels of importance was then performed over the IOMD. As this optimization did not result in a formulation with satisfying in-vitro release, we moved to the third step. Third step: Novel design space expansion was implemented. This design space expansion allows changing ranges of components to be used. Navigating the new expanded mixture design space led to finding a new optimized formulation with satisfying properties. Thus this sequence of work enabled re-optimization without re-building a new design from scratch. So, this epitome is expected to have promising future applications in various pharmaceutical formulations optimization.
Disclosure
The authors report no conflicts of interest in this work.
References
1. Singh Malik D, Mital N, Kaur G. Topical drug delivery systems: a patent review. Expert Opin Ther Pat. 2016;26(2):213–228. doi:10.1517/13543776.2016.1131267
2. Nene S, Shah S, Rangaraj N, Mehra NK, Singh PK, Srivastava S. Lipid based nanocarriers: a novel paradigm for topical antifungal therapy. J Drug Deliv Sci Technol. 2021;62:102397. doi:10.1016/J.JDDST.2021.102397
3. Castañeda-Reyes ED, Perea-Flores MDJ, Davila-Ortiz G, Lee Y, de Mejia EG. Development, characterization and use of liposomes as amphipathic transporters of bioactive compounds for melanoma treatment and reduction of skin inflammation: a review. Int J Nanomedicine. 2020;15:7627–7650. doi:10.2147/IJN.S263516
4. Goyal G, Garg T, Malik B, Chauhan G, Rath G, Goyal AK. Development and characterization of niosomal gel for topical delivery of benzoyl peroxide. Drug Deliv. 2015;22(8):1027–1042. doi:10.3109/10717544.2013.855277
5. Rahman SA, Abdelmalak NS, Badawi A, Elbayoumy T, Sabry N, El RA. Formulation of tretinoin-loaded topical proniosomes for treatment of acne: in-vitro characterization, skin irritation test and comparative clinical study. Drug Deliv. 2015;22(6):731–739. doi:10.3109/10717544.2014.896428
6. Abdelgawad R, Nasr M, Moftah NH, Hamza MY. Phospholipid membrane tubulation using ceramide doping “Cerosomes”: characterization and clinical application in psoriasis treatment. Eur J Pharm Sci. 2017;101:258–268. doi:10.1016/j.ejps.2017.02.030
7. Kang JH, Chon J, Il KY, et al. Preparation and evaluation of tacrolimus-loaded thermosensitive solid lipid nanoparticles for improved dermal distribution. Int J Nanomedicine. 2019;14:5381–5396. doi:10.2147/IJN.S215153
8. Gokce EH, Korkmaz E, Dellera E, Sandri G, Cristina Bonferoni M, Ozer O. Resveratrol-loaded solid lipid nanoparticles versus nanostructured lipid carriers: evaluation of antioxidant potential for dermal applications. Int J Nanomedicine. 2012;7:1841–1850. doi:10.2147/IJN.S29710
9. Zanela da silva Marques T, Santos-Oliveira R, De Siqueira LBDO, et al. Development and characterization of a nanoemulsion containing propranolol for topical delivery. Int J Nanomedicine. 2018;13:2827–2837. doi:10.2147/IJN.S164404
10. Patel MR, Patel RB, Parikh JR, Patel BG. Formulation consideration and skin retention study of microemulsion containing tazarotene for targeted therapy of acne. J Pharm Investig. 2016;46(1):55–66. doi:10.1007/s40005-015-0213-0
11. Nasr M, Abdel-Hamid S. Optimizing the dermal accumulation of a tazarotene microemulsion using skin deposition modeling. Drug Dev Ind Pharm. 2016;42(4):636–643. doi:10.3109/03639045.2015.1062512
12. Avantika D, Raj SD, Vinay P, Singh AM, Pravin K. Cubosomes: a novel carrier for transdermal drug delivery. J drug Deliv Ther. 2020;10(1):123–130. doi:10.22270/jddt.v10i1.3814
13. El-enin HA, Al-shanbari AH. Nanostructured liquid crystalline formulation as a remarkable new drug delivery system of anti-epileptic drugs for treating children patients. Saudi Pharm J. 2018;26(6):790–800. doi:10.1016/j.jsps.2018.04.004
14. Chong JYT, Mulet X, Boyd BJ, Drummond CJ. Steric stabilizers for cubic phase lyotropic liquid crystal nanodispersions (Cubosomes). Adv Planar Lipid Bilayers Liposomes. 2015;21:131–187. doi:10.1016/bs.adplan.2014.11.001
15. Eldeeb AE, Salah S, Ghorab M. Formulation and evaluation of cubosomes drug delivery system for treatment of glaucoma: ex-vivo permeation and in-vivo pharmacodynamic study. J Drug Deliv Sci Technol. 2019;52:236–247. doi:10.1016/j.jddst.2019.04.036
16. Younes NF, Abdel-halim SA, Elassasy AI. Corneal targeted Sertaconazole nitrate loaded cubosomes: preparation, statistical optimization, in vitro characterization, ex vivo permeation and in vivo studies. Int J Pharm. 2018;553(1–2):386–397. doi:10.1016/j.ijpharm.2018.10.057
17. Van De Kerkhof PCM. Update on retinoid therapy of psoriasis in: an update on the use of retinoids in dermatology. Dermatol Ther. 2006;19(5):252–263. doi:10.1111/j.1529-8019.2006.00082.x
18. Trials P, Shalita AR, Berson DS, et al. Effects of tazarotene 0.1 % cream in the treatment of facial acne vulgaris: pooled results from two multicenter, double-blind, randomized, vehicle-controlled, parallel-group trials. Clin Ther. 2004;26(11):1865–1873. doi:10.1016/j.clinthera.2004.11.012
19. Gregoriou S, Kritsotaki E, Katoulis A, Rigopoulos D. Use of tazarotene foam for the treatment of acne vulgaris. Clin Cosmet Investig Dermatol. 2014;7:165–170. doi:10.2147/CCID.S37327
20. Chiricozzi A, Chimenti S. Effective topical agents and emerging perspectives in the treatment of psoriasis. Expert Rev Dermatol. 2012;7(3):283–293. doi:10.1586/edm.12.18
21. Makky A, Mohamed M, Abdellatif M. Liposomal gels as carriers for safer topical delivery of Tazarotene. J Pharm Res Opin. 2014;3(12):82–90.
22. Prasad V, Chaurasia S. Performance evaluation of non-ionic surfactant based tazarotene encapsulated proniosomal gel for the treatment of psoriasis. Mater Sci Eng C. 2017;79:168–176. doi:10.1016/j.msec.2017.05.036
23. Patel MR, Patel RB, Parikh JR, Patel BG. Novel microemulsion-based gel formulation of tazarotene for therapy of acne. Pharm Dev Technol. 2015;21(8):1–12. doi:10.3109/10837450.2015.1081610
24. Elmowafy E, El-Gogary RI, Ragai MH, Nasr M. Novel antipsoriatic fluidized spanlastic nanovesicles: in vitro physicochemical characterization, ex vivo cutaneous retention and exploratory clinical therapeutic efficacy. Int J Pharm. 2019;568:118556. doi:10.1016/j.ijpharm.2019.118556
25. Liu P, Yang X, Han J, et al. Tazarotene-loaded PLGA nanoparticles potentiate deep tissue pressure injury healing via VEGF-Notch signaling. Mater Sci Eng C. 2020;114:111027. doi:10.1016/j.msec.2020.111027
26. Aggarwal G, Nagpal M. Development and comparison of nanosponge and niosome based gel for the topical delivery of Tazarotene. Pharmaceut nanotechnol. 2016;4(3):213–228. doi:10.2174/221173850466616080415
27. Erol İ, Üstündağ Okur N, Orak D, Sipahi H, Aydın A, Özer Ö. Tazarotene-loaded in situ gels for potential management of psoriasis: biocompatibility, anti-inflammatory and analgesic effect. Pharm Dev Technol. 2020;25(8):909–918. doi:10.1080/10837450.2020.1765180
28. Montgomery DC. Design and Analysis of Experiments Eighth Edition.
29. Habib BA, Abd El-Samiae AS, El-Houssieny BM, Tag R. Formulation, characterization, optimization, and in-vivo performance of febuxostat self-nano-emulsifying system loaded sublingual films. Drug Deliv. 2021;28(1):1321–1333. doi:10.1080/10717544.2021.1927247
30. Fahmy AM, El-Setouhy DA, Habib BA, Tayel SA. Enhancement of transdermal delivery of haloperidol via spanlastic dispersions: entrapment efficiency vs. particle size. AAPS PharmSciTech. 2019;20(3):1–13. doi:10.1208/s12249-019-1306-2
31. Nageeb El-Helaly S, Habib BA, Abd El-Rahman MK. Resolution V fractional factorial design for screening of factors affecting weakly basic drugs liposomal systems. Eur J Pharm Sci. 2018;119:249–258. doi:10.1016/j.ejps.2018.04.028
32. Said M, Elsayed I, Aboelwafa AA, Elshafeey AH. A novel concept of overcoming the skin barrier using augmented liquid nanocrystals: box-Behnken optimization, ex vivo and in vivo evaluation. Colloids Surf B Biointerfaces. 2018;170:258–265. doi:10.1016/j.colsurfb.2018.06.025
33. Naguib SS, Hathout RM, Mansour S. Optimizing novel penetration enhancing hybridized vesicles for augmenting the in-vivo effect of an anti-glaucoma drug. Drug Deliv. 2017;24(1):99–108. doi:10.1080/10717544.2016.1233588
34. Habib BA, Aboughaly MHH. Combined mixture-process variable approach: a suitable statistical tool for nanovesicular systems optimization. Expert Opin Drug Deliv. 2016;13(6):777–788. doi:10.1517/17425247.2016.1166202
35. Buruk Sahin Y, Aktar Demirtaş E, Burnak N. Mixture design: a review of recent applications in the food industry. J Eng Sci. 2016;22(4):297–304. doi:10.5505/pajes.2015.98598
36. Bezener M. Strategies for sequential experimentation; 2020. Available from: https://www.statease.com/webinars/strategies-sequentialexperimentation.
37. Siekmann B, Bunjes H, Koch MHJ, Westesen K. Preparation and structural investigations of colloidal dispersions prepared from cubic monoglyceride – water phases. Int J Pharm. 2002;244(1–2):33–43. doi:10.1016/s0378-5173(02)00298-3
38. Fouda NH, Abdelrehim RT, Hegazy DA, Habib BA. Sustained ocular delivery of dorzolamide-HCL via proniosomal gel formulation: in-vitro characterization, statistical optimization, and in-vivo pharmacodynamic evaluation in rabbits. Drug Deliv. 2018;25(1):1340–1349. doi:10.1080/10717544.2018.1477861
39. Kapoor K, Pandit V, Nagaich U. Development and characterization of sustained release methotrexate loaded cubosomes for topical delivery in rheumatoid arthritis. Int J Appl Pharm. 2020;12(3):33–39. doi:10.22159/ijap.2020v12i3.36863
40. Wu H, Li J, Zhang Q, et al. A novel small Odorranalectin-bearing cubosomes: preparation, brain delivery and pharmacodynamic study on amyloid-β 25–35-treated rats following intranasal administration. Eur J Pharm Biopharm. 2012;80(2):368–378. doi:10.1016/j.ejpb.2011.10.012
41. Al-Mahallawi AM, Khowessah OM, Shoukri RA. Nano-transfersomal ciprofloxacin loaded vesicles for non-invasive trans-tympanic ototopical delivery: in-vitro optimization, ex-vivo permeation studies, and in-vivo assessment. Int J Pharm. 2014;472(1–2):304–314. doi:10.1016/j.ijpharm.2014.06.041
42. Radwan SAA, El-Maadawy WH, Yousry C, Elmeshad AN, Shoukri RA. Zein/phospholipid composite nanoparticles for successful delivery of gallic acid into ahscs: influence of size, surface charge, and vitamin a coupling. Int J Nanomedicine. 2020;15:7995–8018. doi:10.2147/IJN.S270242
43. Patel MR, Patel RB, Parikh JR, Patel BG. HPTLC method for estimation of tazarotene in topical gel formulations and in vitro study. Anal Methods. 2010;2(3):275–281. doi:10.1039/b9ay00240e
44. Montenegro L, Panico AM, Ventimiglia A, Bonina FP. In vitro retinoic acid release and skin permeation from different liposome formulations. Int J Pharm. 1996;133(1–2):89–96. doi:10.1016/0378-5173(95)04422-1
45. Derringer G, Suich R. Simultaneous optimization of several response variables. J Qual Technol. 1980;12(4):214–219. doi:10.1080/00224065.1980.11980968
46. El Taweel MM, Aboul-einien MH, Kassem MA, Elkasabgy NA. Intranasal zolmitriptan-loaded bilosomes with extended nasal mucociliary transit time for direct nose to brain delivery. Pharmaceutics. 2021;13(11):1828. doi:10.3390/pharmaceutics13111828
47. Galisteo-González F, Molina-Bolívar JA. Systematic study on the preparation of BSA nanoparticles. Colloids Surf B Biointerfaces. 2014;123:286–292. doi:10.1016/j.colsurfb.2014.09.028
48. Elgindy NA, Mehanna MM, Mohyeldin SM. Self-assembled nano-architecture liquid crystalline particles as a promising carrier for progesterone transdermal delivery. Int J Pharm. 2016;501(1–2):167–179. doi:10.1016/j.ijpharm.2016.01.049
49. Mohyeldin SM, Mehanna MM, Elgindy NA. Superiority of liquid crystalline cubic nanocarriers as hormonal transdermal vehicle: comparative human skin permeation-supported evidence. Expert Opin Drug Deliv. 2016;13(8):1049–1064. doi:10.1080/17425247.2016.1182490
50. Vogel R, Pal AK, Jambhrunkar S, et al. High-resolution single particle zeta potential characterisation of biological nanoparticles using tunable resistive pulse sensing. Sci Rep. 2017;7(1):1–13. doi:10.1038/s41598-017-14981-x
51. Bergmeir C, Hyndman RJ, Benítez JM. Bagging exponential smoothing methods using STL decomposition and Box-Cox transformation. Int J Forecast. 2016;32(2):303–312. doi:10.1016/j.ijforecast.2015.07.002
52. Habib BA, Sayed S, Elsayed GM. Enhanced transdermal delivery of ondansetron using nanovesicular systems: fabrication, characterization, optimization and ex-vivo permeation study-Box-Cox transformation practical example. Eur J Pharm Sci. 2018;115:352–361. doi:10.1016/j.ejps.2018.01.044
53. Lv Y, He H, Qi J, et al. Visual validation of the measurement of entrapment efficiency of drug nanocarriers. Int J Pharm. 2018;547(1–2):395–403. doi:10.1016/j.ijpharm.2018.06.025
54. Agrawal U, Gupta M, Vyas SP. Capsaicin delivery into the skin with lipidic nanoparticles for the treatment of psoriasis. Artif Cells Nanomed Biotechnol. 2015;43(1):33–39. doi:10.3109/21691401.2013.832683
55. Liu J, Hu W, Chen H, Ni Q, Xu H, Yang X. Isotretinoin-loaded solid lipid nanoparticles with skin targeting for topical delivery. Int J Pharm. 2007;328(2):191–195. doi:10.1016/j.ijpharm.2006.08.007
56. Aboud HM, Hassan AH, Ali AA, Abdel-Razik ARH. Novel in situ gelling vaginal sponges of sildenafil citrate-based cubosomes for uterine targeting. Drug Deliv. 2018;25(1):1328–1339. doi:10.1080/10717544.2018.1477858
57. Abdelrahman FE, Elsayed I, Gad MK, Badr A, Mohamed MI. Investigating the cubosomal ability for transnasal brain targeting: in vitro optimization, ex vivo permeation and in vivo biodistribution. Int J Pharm. 2015;490(1–2):281–291. doi:10.1016/j.ijpharm.2015.05.064
58. Danaei M, Dehghankhold M, Ataei S, et al. Impact of particle size and polydispersity index on the clinical applications of lipidic nanocarrier systems. Pharmaceutics. 2018;10(2):1–17. doi:10.3390/pharmaceutics10020057
59. Bahari LAS, Hamishehkar H. The impact of variables on particle size of solid lipid nanoparticles and nanostructured lipid carriers; A comparative literature review. Adv Pharm Bull. 2016;6(2):143–151. doi:10.15171/apb.2016.021
60. Thakur R, Anwer MK, Shams MS, et al. Proniosomal transdermal therapeutic system of losartan potassium: development and pharmacokinetic evaluation. J Drug Target. 2009;17(6):442–449. doi:10.1080/10611860902963039
61. Esposito E, Eblovi N, Rasi S, et al. Lipid-based supramolecular systems for topical application: a preformulatory study. AAPS PharmSci. 2003;5(4):1–15. doi:10.1208/ps050430
62. Weng J, Tong HHY, Chow SF. In vitro release study of the polymeric drug nanoparticles: development and validation of a novel method. Pharmaceutics. 2020;12(8):1–18. doi:10.3390/pharmaceutics12080732
63. D’Souza S. A review of in vitro drug release test methods for nano-sized dosage forms. Adv Pharm. 2014;2014:1–12. doi:10.1155/2014/304757
64. Rapalli VK, Kaul V, Waghule T, et al. Curcumin loaded nanostructured lipid carriers for enhanced skin retained topical delivery: optimization, scale-up, in-vitro characterization and assessment of ex-vivo skin deposition. Eur J Pharm Sci. 2020;152:105438. doi:10.1016/j.ejps.2020.105438
65. Omar S, Ismail A, Hassanin K, Hamdy S. Formulation and evaluation of cubosomes as skin retentive system for topical delivery of clotrimazole. J Adv Pharm Res. 2019;3(2):68–82. doi:10.21608/aprh.2019.9839.1079
66. Sherif S, Bendas ER, Badawy S. The clinical efficacy of cosmeceutical application of liquid crystalline nanostructured dispersions of alpha lipoic acid as anti-wrinkle. Eur J Pharm Biopharm. 2014;86(2):251–259. doi:10.1016/j.ejpb.2013.09.008
67. Morsi NM, Abdelbary GA, Ahmed MA. Silver sulfadiazine based cubosome hydrogels for topical treatment of burns: development and in vitro/in vivo characterization. Eur J Pharm Biopharm. 2014;86(2):178–189. doi:10.1016/j.ejpb.2013.04.018
 © 2022 The Author(s). This work is published and licensed by Dove Medical Press Limited. The
full terms of this license are available at https://www.dovepress.com/terms
and incorporate the Creative Commons Attribution
- Non Commercial (unported, 3.0) License.
By accessing the work you hereby accept the Terms. Non-commercial uses of the work are permitted
without any further permission from Dove Medical Press Limited, provided the work is properly
attributed. For permission for commercial use of this work, please see paragraphs 4.2 and 5 of our Terms.
© 2022 The Author(s). This work is published and licensed by Dove Medical Press Limited. The
full terms of this license are available at https://www.dovepress.com/terms
and incorporate the Creative Commons Attribution
- Non Commercial (unported, 3.0) License.
By accessing the work you hereby accept the Terms. Non-commercial uses of the work are permitted
without any further permission from Dove Medical Press Limited, provided the work is properly
attributed. For permission for commercial use of this work, please see paragraphs 4.2 and 5 of our Terms.