Back to Journals » Journal of Hepatocellular Carcinoma » Volume 2
State-of-the-art cross-sectional liver imaging: beyond lesion detection and characterization
Authors Luersen G, Bhosale P, Szklaruk J ![]()
Received 21 March 2015
Accepted for publication 22 April 2015
Published 10 July 2015 Volume 2015:2 Pages 101—117
DOI https://doi.org/10.2147/JHC.S85201
Checked for plagiarism Yes
Review by Single anonymous peer review
Peer reviewer comments 3
Editor who approved publication: Dr Ahmed Kaseb
Gustavo Felipe Luersen, Priya Bhosale, Janio Szklaruk
Department of Diagnostic Radiology, The University of Texas MD Anderson Cancer Center, Houston, TX, USA
Abstract: Cross-sectional imaging with computed tomography or magnetic resonance imaging is routinely used to detect and diagnose liver lesions; however, these examinations can provide additional important information. The improvement of equipment and techniques has allowed outstanding evaluation of the vascular and biliary anatomy, which is practicable in most routine examinations. Anatomical variants may exclude patients from certain therapeutic options and may be the cause of morbidity or mortality after surgery or interventional procedures. Diffuse liver disease, such as steatosis, hemochromatosis, or fibrosis, must be diagnosed and quantified. Usually these conditions are silent until the late stages, and imaging plays an important role in detecting them early. Additionally, a background of diffuse disease may interfere in a focal lesion systematic reasoning. The diagnostic probability of a particular nodule varies according to the background liver disease. Nowadays, most diffuse liver diseases can be easily and accurately quantified by imaging, which has allowed better understanding of these diseases and improved patient management. Finally, cross-sectional imaging can calculate total and partial liver volumes and estimate the future liver remnant after hepatectomy. This information helps to select patients for portal vein embolization and reduces postoperative complications. Use of a specific hepatic contrast agent on magnetic resonance imaging, in addition to improving detection and characterization of focal lesions, provides functional global and segmental information about the liver parenchyma.
Keywords: cirrhosis, steatosis, iron overload, vascular anatomy, biliary anatomy, functional liver remnant
Introduction
Cross-sectional imaging with computed tomography (CT) or magnetic resonance imaging (MRI) is routinely used to detect and diagnose liver lesions. In addition to having this important role, CT and MRI provide a wealth of information that is valuable in the treatment of patients with liver disease. The goal of this review is to describe state-of-the-art advances, or the highest level of development, in CT and MRI, with special attention to recent technical innovations for evaluation of the liver beyond detection and characterization of liver lesions.
Hepatic vascular and biliary anatomical variants are very common. Classic arterial, portal venous, and hepatic venous anatomy is seen in only 35% of patients. The most common hepatic artery, portal venous, and hepatic vein patterns are seen in 55%–61%, 65%–80%, and 50%–60% of people, respectively (Figures 1 and 2).1–6 Arterial and hepatic venous variants are more frequent, and each one is present in approximately 40%–50% of people. The most common variant of the hepatic veins is the accessory right inferior hepatic vein, which is seen in 47% of people.1,2,6 Portal venous variants are seen in 20%–35% of cases.1–4 Similar to the vascular anatomy, the biliary system has anatomical variants. Normal biliary anatomy is present in approximately 56%–72% of patients. Common biliary variants of intrahepatic biliary ducts include draining of the right posterior duct to the left hepatic duct (12%–19%) or to the common hepatic duct (5%–10%), and trifurcation patterns (9%–11%).2,4,7
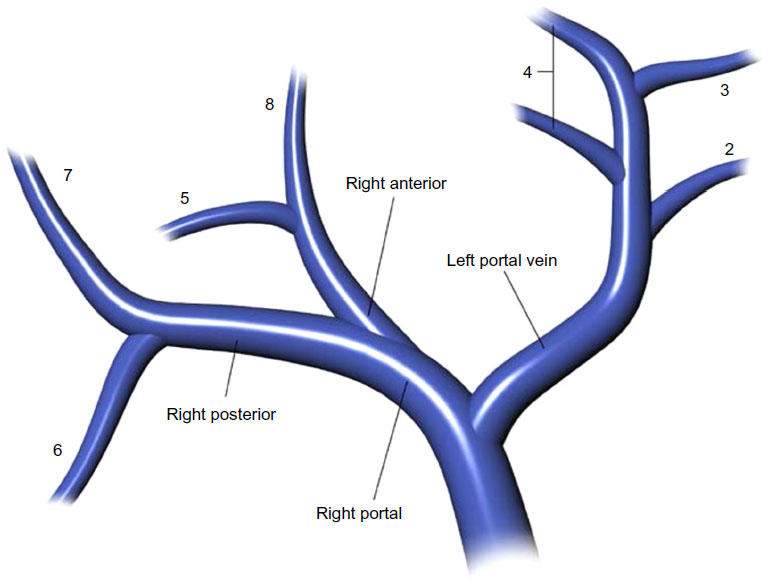 | Figure 1 Diagram of the portal venous anatomy to the liver. |
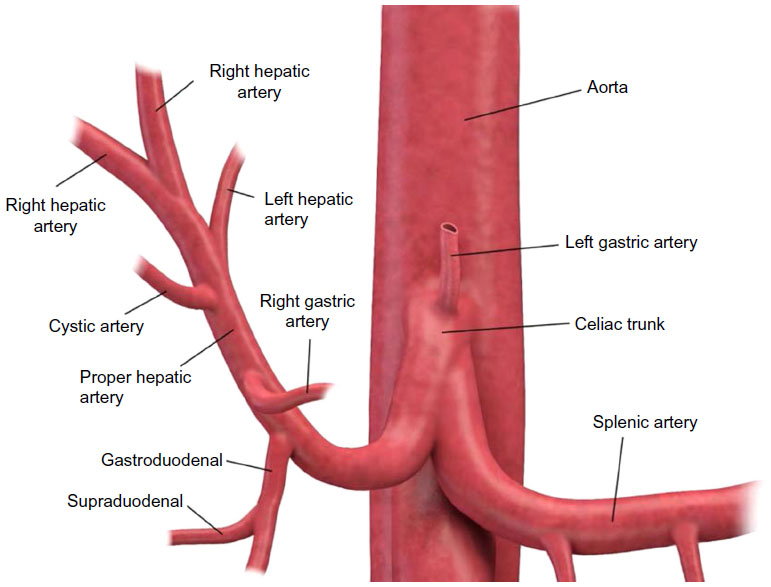 | Figure 2 Diagram of the arterial anatomy to the liver. |
Presurgical understanding of the vascular and biliary anatomy is essential. For example, when planning a partial hepatectomy, understanding the vascular supply of the remnant liver is required to preserve liver function. In the setting of vascular and biliary reconstruction, knowledge of this anatomy is critical.2,8 Finally, variations in vascular anatomy may result in denial of a life-saving liver transplant. Tsang et al evaluated the reasons for patient exclusion from adult living donor liver transplantation and found that anatomical variations were responsible for exclusion of 10% of potential donors (5% due to biliary system anatomy, 4% due to hepatic artery variations, and 1% due to portal vein alterations).9 Anatomical variants may also affect the delivery of chemotherapy (transarterial chemoembolization), portal vein embolization, and radioembolization (Y-90 transarterial embolization).4
Cross-sectional imaging with CT or MRI can provide information about a patient’s vascular and biliary system at the same time as evaluation of liver lesions; however, it requires appropriate techniques. Some anatomical variants need intravenous contrast agents to be depicted with CT or MRI. Most commonly, iodinated contrast agents are used on CT and gadolinium-based agents on MRI, both working in different ways; the former increases the density where it is present, resulting in a higher attenuation of the X-ray and a brighter point on CT image, and the latter causes a slight increase of the magnetic field adjacent to where it is present and changes the behavior of the closest water molecules, resulting in a brighter point on T1-weighted MRI sequences and a black point in some T2-weighted images. The several contrast agents available for CT and MRI contain different molecules with distinct characteristics, resulting in different behavior. For example, nonionic contrast agents are less allergenic than their ionic counterparts. Intravenous contrast agents have an intravascular, interstitial, and excretory phase. Most contrast agents used for CT and MRI are eliminated only or mainly by the kidneys, but some can also be eliminated via the biliary system, allowing enhancement of the biliary ducts.2,4,6,7
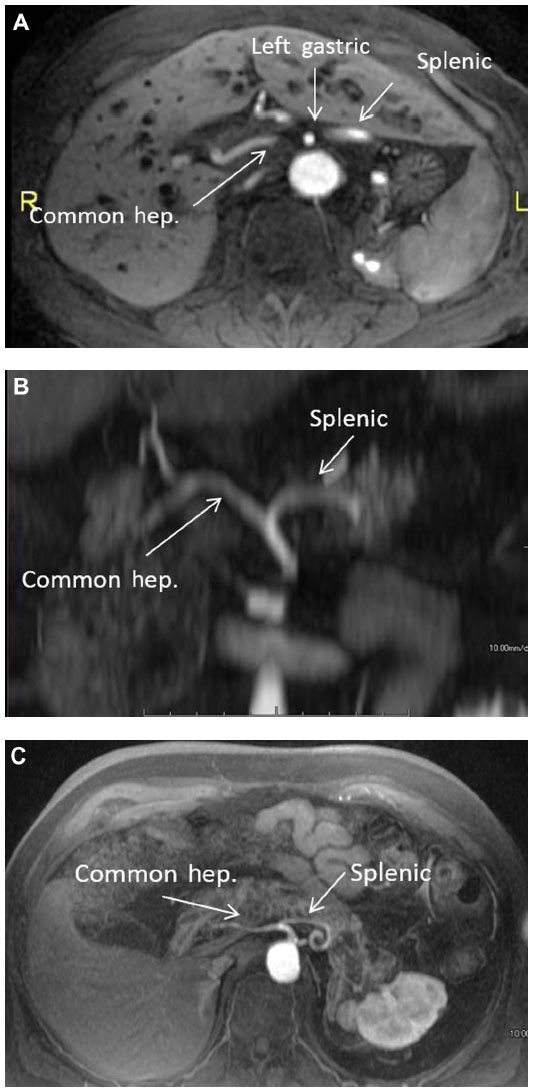
For many years, CT angiography with intravenous contrast has provided excellent images of the arterial and portal vascular system of the liver (Figure 3).4,6 Recent technical developments in CT include application of dual energy CT (DECT).10 The energy spectra of different materials can be used to obtain specific material images. In the evaluation of vessels, DECT with technical parameters set to iodine material can increase the contrast between the vessel and the background liver (Figure 3). These CT images, known as iodine-water images, are obtained with low keV (closer to 80 keV) imaging parameters. The lower keV results in increased intensity of iodine relative to other material.
 | Figure 3 (A) Axial maximum intensity projection image at the level of the celiac artery. The common hepatic (hep.), splenic, and right gastric arteries are identified. (B) Axial “iodine-material” image at the level of the celiac artery. The common hepatic, splenic, and right gastric arteries are identified. (C) Coronal “iodine-material” image at the level of the celiac and superior mesenteric arteries. The common hepatic, left gastric, splenic, and superior mesenteric arteries are identified. |
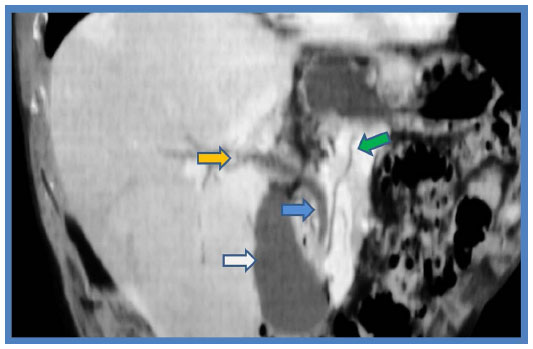
Magnetic resonance (MR) angiography has also played an important role in evaluation of the liver vasculature.4,6 Post-processing techniques, such as subtraction images, provide improved contrast between the vessel and the background liver (Figure 4). A technique that is seldom used in MRI for evaluation of the liver is phase-contrast imaging (Figure 5). However, phase-contrast images provide information on the direction of flow and can be very useful for diagnosis of portal hypertension and detection of hepatofugal flow.
 | Figure 4 (A) Post-gadolinium magnetic resonance axial images of the abdomen below the level of the celiac artery. The common hepatic (hep.), splenic, and right gastric arteries are identified. (B) Post-gadolinium magnetic resonance coronal maximum intensity projection of the abdomen. The common hepatic and splenic arteries are identified. (C) Post-gadolinium magnetic resonance axial maximum intensity projection of the abdomen. The common hepatic and splenic arteries are identified. |
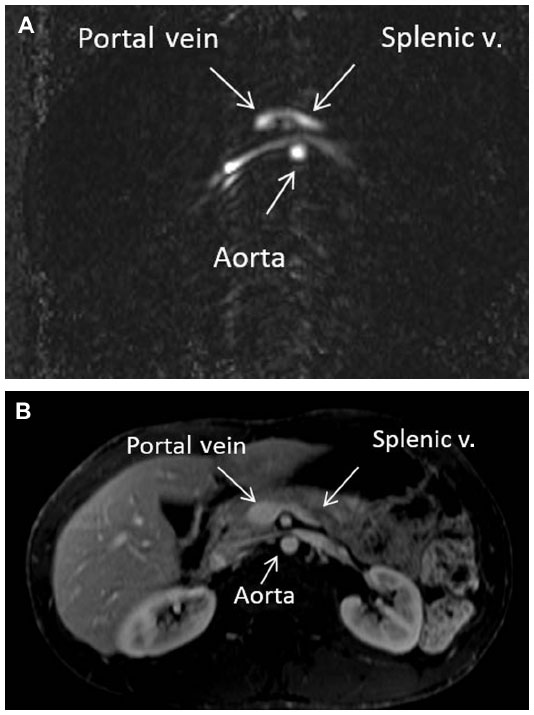 | Figure 5 (A) Phase contrast (nongadolinium) magnetic resonance axial images of the abdomen below the level of the celiac artery. The splenic vein (v.) and portal confluence are identified. The bright signal shows normal directional flow of the splenic vein. (B) Post-gadolinium magnetic resonance axial images of the abdomen below the level of the celiac artery. The splenic vein and portal confluence are identified. This corresponds to the anatomy seen in (A). |
CT angiography is faster than MR angiography and has higher special resolution; therefore, it is less motion-sensitive and allows better identification of small vessels. MR angiography does not require ionizing radiation and uses a gadolinium-based contrast agent, while CT angiography is performed with ionizing radiation and uses an iodine-based contrast agent, which is more allergenic and is reported to have a transient effect on the kidneys. CT angiography is better for claustrophobic patients and is more cost-effective than MR angiography. Contraindications of MR angiography include pacemakers and some metallic implants.4,6
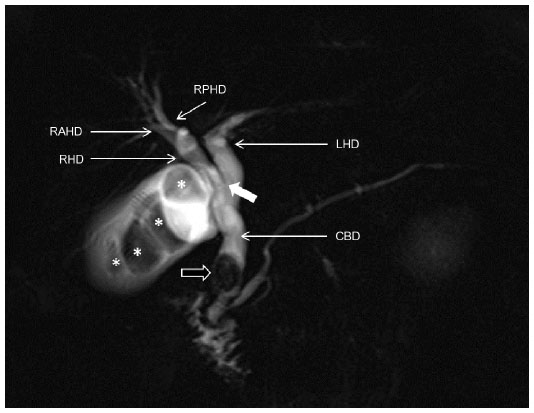
Noninvasive assessment of the biliary tree is possible by CT cholangiography or MR cholangiography (MRCP). CT cholangiography can be performed with or without a biliary-specific contrast agent; however, CT cholangiography with a biliary-specific agent is seldom performed due to technical challenges and the need for ionizing radiation.2,4,7 In CT cholangiography performed using only intravenous iodine contrast agent (ie, without biliary-specific contrast agent), minimum intensity projection reconstruction provides images that accentuate the voxels with the lowest attenuation (ie, water attenuation from bile), which are measured in Hounsfield units (HU, Figure 6). These images can be reconstructed using a 10 mm slab thickness, resulting in visualization of the anatomy similar to that of endoscopic retrograde cholangiopancreatography. MRCP yields fluid-sensitive (T2-weighted) images (Figure 7), and has been used for more than a decade to depict variants in the biliary tree.2,4 For differentiating benign from malignant biliary obstructions, MRCP has a sensitivity of 70%–87%, specificity of 90%–94%, and accuracy of 85%–91%.11 The addition of standard MRI sequences to MRCP increases accuracy and also improves the radiologist’s confidence.12 Recent studies showed similar diagnostic performance for CT cholangiography with minimum intensity projection (sensitivity of 72%–97%, specificity of 85%–95%, and accuracy of 82%–96%).13,14 For detecting choledocholithiasis, MRCP has a sensitivity of 89%–100% and specificity of 83%–100%, CT cholangiography with biliary-specific contrast has a sensitivity of 87%–89% and a sensitivity of 96%–98%, and CT cholangiography with minimum intensity projection has a sensitivity of 70% and specificity of 100%.13–16 MRCP can better detect gallstones than CT cholangiography with biliary-specific contrast (with sensitivity of 94% and 78% and specificity of 88% and 100%, respectively).15
 | Figure 6 CTCP with minimum intensity projection. |
 | Figure 7 MRCP. |
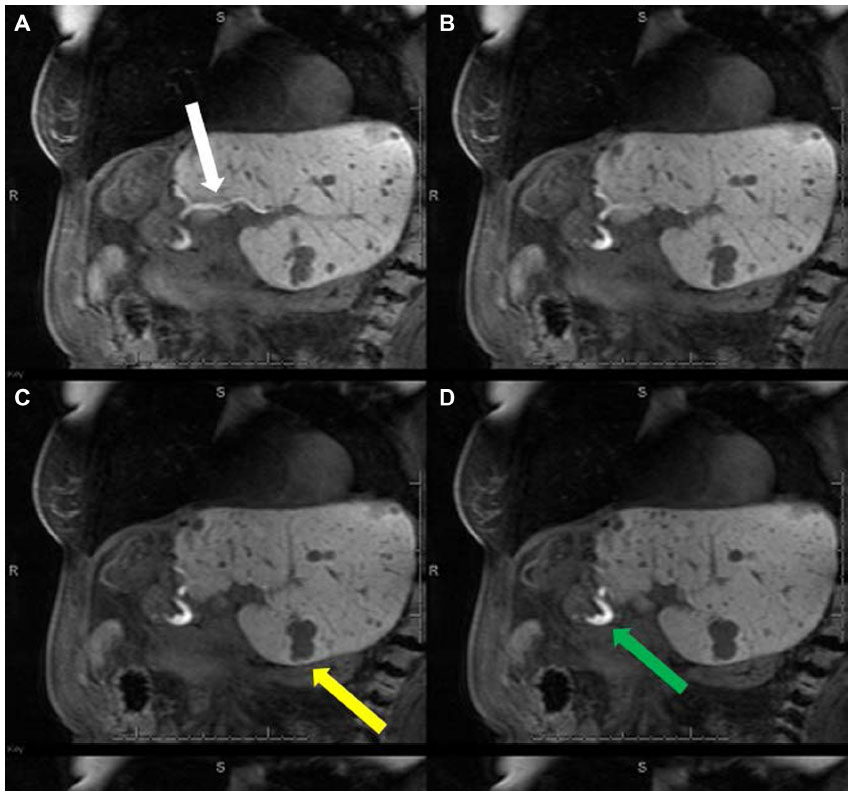
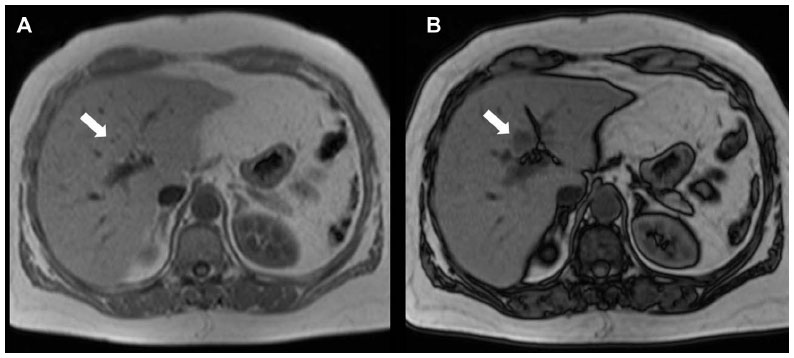
The most recent advances in MRI include novel applications of hepatobiliary agents to visualize the biliary tree.17–19 The use of these agents, ie, gadobenate dimeglumine or gadoxetate dimeglumine, can provide anatomical and functional information about the biliary tree (Figure 8). An obstruction of the bile ducts will result in nonexcretion of contrast through the bile ducts, and this obstruction may be segmental, subsegmental, or lobar (Figure 9). Excretion of biliary contrast is dependent on bile duct flow, functional hepatocytes, and renal function.17–19
 | Figure 8 MRCP with Gd-EOB-DTPA. |
 | Figure 9 MRCP with Gd-EOB-DTPA. |
Diffuse liver diseases
Diffuse liver diseases are common and, in most cases, can be identified by cross-sectional imaging. Diffuse liver diseases include a broad spectrum of pathologies, including steatosis, hemochromatosis, fibrosis, and cirrhosis. Imaging can detect some of these diseases before they become clinically apparent. Detection of these diseases has implications with regard to the morbidity and mortality of various treatments for liver disease.20–22 Nowadays, liver biopsy is considered the gold standard for diagnosis and quantification of most diffuse liver diseases, however, it has limitations that will be discussed below. These limitations of biopsy probably compromised the actual known accuracy data of cross-sectional imaging and should be considered when we compare imaging techniques to biopsy.
Fatty liver disease
Fatty liver disease or steatosis is the most common chronic liver disease in the USA, and is characterized by accumulation of triglycerides within the hepatocytes. Its common causes include obesity, alcohol consumption, and drugs.22,23 Fatty liver disease occurs in approximately 30% of the general population, but is more prevalent in obese individuals and in patients with diabetes or metabolic syndrome. There had been a recent unfortunate increase in the incidence of obesity and fatty liver disease in children.23–26 Fatty liver disease can range in severity from simple steatosis to steatohepatitis and cirrhosis, which confers a higher risk of liver failure and hepatocellular carcinoma (HCC).27–29 Adams et al have shown liver disease to be the third cause of death in patients with fatty liver disease, after malignancy and ischemic heart disease, and the increasing prevalence of fatty liver disease underscores the importance of this finding.24 Fatty liver disease has also been associated with 5-fluorouracil, irinotecan, platinum drugs, and taxanes. Other chemotherapeutic agents linked to fatty liver disease are L-asparaginase, dactinomycin, mitomycin C, bleomycin sulfate, and methotrexate.30–32
Liver biopsy is considered in many centers as the reference standard for diagnosis and quantification of fatty liver disease. However, this technique is invasive, may have sampling errors, and requires subjective visual grading, which can result in interobserver variation.22,24,33–36 Thus, liver biopsy is not appropriate for screening, longitudinal monitoring, or evaluation of the treatment response. El-Badry et al showed that quantification of fat on biopsy was strongly observer-dependent, was not reproducible, and did not correlate with computed estimations.33
Cross-sectional imaging has an important role in detection and quantification of fatty liver disease and also improves understanding of this condition. On CT, the diagnosis of fatty liver disease can be suggested by evaluating the liver attenuation on nonenhanced images, and this evaluation can be subjective or objective. Non-quantitative subjective analysis of the CT images is done by comparing the visual attenuation of the liver with that of the spleen (attenuation of the liver will be lower than that of the spleen) or comparing the visual attenuation of the liver with that of the hepatic vessels (the vessels will be brighter than the liver, Figure 10). This subjective technique has a sensitivity of 88%–95% and a specificity of 90%–99%.35,37–41
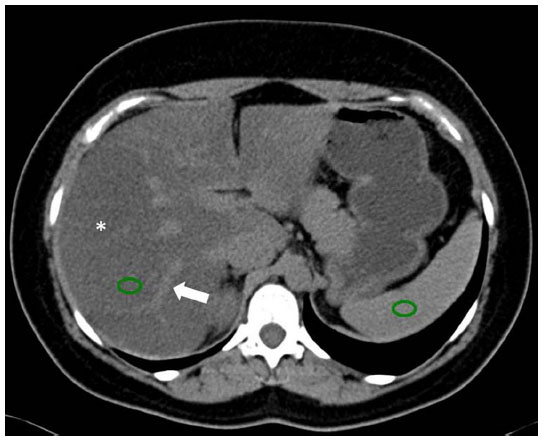 | Figure 10 CT image of fatty liver disease. |
A quantitative objective analysis of CT images can be performed to assess for steatosis by measuring the hepatic attenuation in HU. Hepatic attenuation below 48 HU is suggestive of liver steatosis.35,41 Kodama et al found associations between hepatic attenuation and fatty liver disease of 64.4 HU ± 3.1 for 0% steatosis, 59.1 HU ± 7.3 for 1%–25% steatosis, 41.9 HU ± 6.7 for 26%–50% steatosis, and 25.0±15.5 for more than 50% steatosis.37 The hepatic attenuation may be compared objectively with the spleen, where a liver-to-spleen attenuation ratio of less than 0.8 represents more than 30% steatosis, with a sensitivity of 73%–82% and specificity of 100%. A coexisting disease that increases liver density, like hemochromatosis, can hinder the effects of fat inside the liver parenchyma and limit the accuracy of CT.38–40 DECT has been used to evaluate steatosis in animal research, in which DECT indexes, especially fat (water) concentration, correlated with histological findings.42
MRI is one of the most sensitive imaging techniques for detecting fatty liver disease. Fat accumulation can be evaluated qualitatively or quantitatively, and the most common technique used is chemical shift imaging. The chemical shift technique provides images of the liver in which the signal intensity of the water and fat are added (in-phase) or subtracted (out-of-phase) from each other. There is a loss of signal intensity on out-of-phase images when fat and water are present in the same voxel (Figure 11).35,43–45 For example, in a voxel with 40% fat and 60% water, the signal will decrease from 100% (in-phase) to 20% (out-of-phase, Figure 11). This technique is limited to 50% fat. In a voxel with 60% fat and 40% water, the signal loss will also be to 20%, because the chemical shift technique does not differentiate which compound (fat or water) is predominating. This quantitative calculation is known as the fat signal fraction (FSF): FSF = (SIP – SOP)/2(SIP), where SIP is the hepatic signal intensity on in-phase images and SOP is the hepatic signal intensity on out-of-phase images.35,43 In a study of 2,349 patients, none had an FSF greater than 50%.26 It is important to mention that MRI evaluates the percentage of fat related to water, while biopsy estimates visually the percentage of hepatocytes with fat, regardless of the amount of fat or its relationship to water.33
 | Figure 11 MRI of fatty liver disease. |
An MRI technique that expands on the chemical shift technique is the Dixon method. This technique results in development of in-phase and out-of-phase images in addition to water-only and fat-only images (Figure 12).46 More recently, modified Dixon methods applied to fast gradient echo techniques have been used for evaluation of fatty liver disease.24,47–52 These new techniques allow correction of the iron overload (see the Iron in the liver section), which is a partial limitation of chemical shift imaging for detection and quantification of fatty liver disease.52
 | Figure 12 MRI of the abdomen with the Dixon technique. |
The accuracy of MRI for detection and quantification of fatty liver disease depends on the technique used and also on the reference standard (usually biopsy), which has intrinsic problems as already mentioned. In-phase and out-of-phase MRI techniques have demonstrated high accuracy for detection of fatty liver disease, with a positive correlation coefficient of 0.84 with biopsy grade.43,53,54 However, these techniques have limitations, especially in patients with iron overload and those with cirrhosis (r=0.25).43,55,56 More recent MRI techniques show fat values that are extremely close to the actual fat concentration in phantom models, despite the presence of iron. These techniques have shown a potential minimum error of less than 1% in comparison with the real concentration of fat; this potential for error is smaller than that of the subjective visual pathological scale.24,49–52
MR spectroscopy is the most accurate method for noninvasive evaluation of fatty liver disease. MR spectroscopy quantifies the chemical composition of the hepatic parenchyma, detecting fat quantities as low as 0.5%. However, the acquisition is limited to a localized single voxel, susceptible to field inhomogeneity, time-consuming, and very vulnerable to motion artifacts. This technique is not recommended in routine practice, and is reserved for quantification of small amounts of fat in selected patients.26,35,43
Iron in the liver
There are many causes of iron overload in the liver, which can be classified as primary (hereditary hemochromatosis) or secondary (other causes, especially repeated transfusions). Primary hemochromatosis is characterized by parenchymal iron storage, while secondary causes of iron overload are characterized by reticuloendothelial iron deposits first, and only later, parenchymal iron storage. An excess of iron in the parenchymal cells can lead to cellular toxicity and is a risk factor for cirrhosis and HCC, mainly in primary hemochromatosis. This risk is increased when there are additional hepatic risk factors. The signs and symptoms of iron overload might appear late and be nonspecific, delaying its diagnosis.20,57–62
Hepatic iron magnitude is considered to be the best measure of total body iron burden. There is a close relationship between the level of body iron overload and the presence and severity of organ damage. Patients with iron overload have a reduced life expectancy if not diagnosed and treated before organ damage, which is usually present during the clinical phase of the disease. Life expectancy can be brought back to normal if an early diagnosis is made and treatment is given, so early detection and quantification of liver iron overload is critical, especially before the disease is clinically evident.58,63
Liver biopsy remains the reference standard for the diagnosis and staging of liver iron overload; however, the procedure is invasive, evaluates small samples, and has variable results. This variability ranges from 19% in the healthy liver to 40% in cirrhosis. Further, distribution of iron in the liver may be irregular because of fibrosis.57–59,62–64
On nonenhanced CT examination, iron overload in the liver may increase the hepatic attenuation (in contrast with steatosis, in which it is reduced, Figure 13). With a threshold of 71 HU or more, nonenhanced CT has a sensitivity of 63% and a specificity of 96%. A limitation of nonenhanced CT is that other diffuse liver diseases (eg, Wilson’s disease) may also increase hepatic attenuation, as can long-term administration of amiodarone.60,62 Use of iodine-based contrast does not help in detection of iron in the liver. Finally, there are promising but limited reports on the use of DECT for evaluation of iron in the liver.65
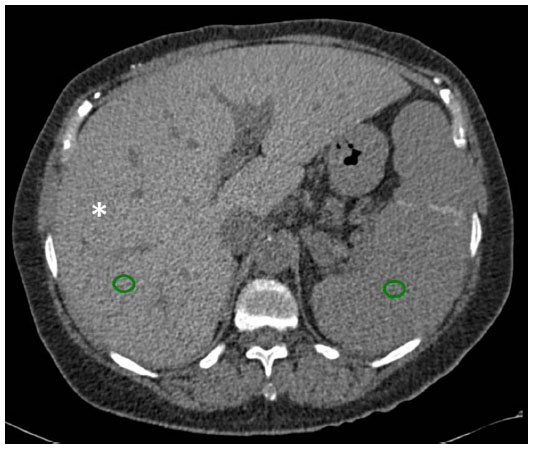 | Figure 13 CT image showing liver iron overload. |
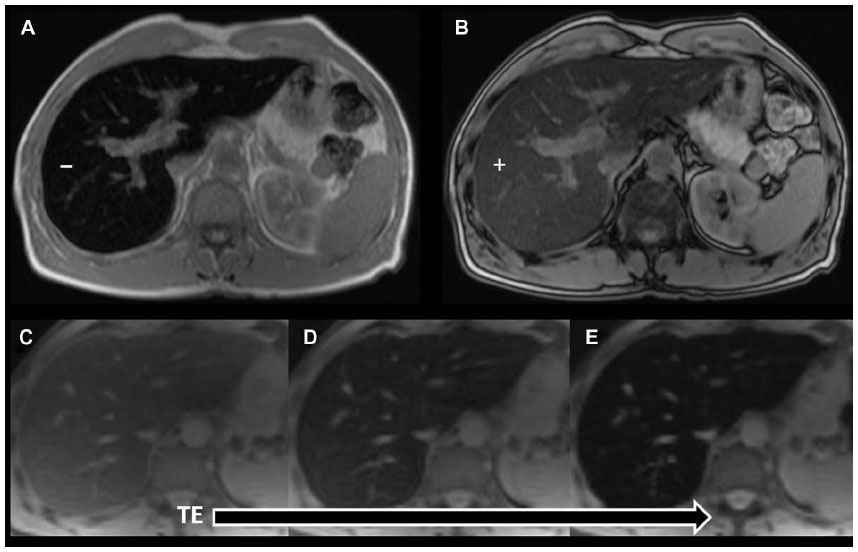
MRI is the best noninvasive method for detecting and quantifying liver iron overload. This may be due to the ferromagnetic properties of iron. The MRI technique is based on loss of signal in the liver on T2* sequences due to susceptibility effects from the iron. A higher iron overload results in greater signal loss. This can be evaluated by visual analysis or may be quantified by different MRI techniques (Figure 14).52,60–63,66–68 MRI with in-phase and out-of-phase sequences can provide a suggestion of iron overload in the liver. In most systems, the in-phase sequences will have a longer time of echo. This longer time to echo results in signal loss due to iron overload on in-phase images (Figure 15). This characteristic is in contrast to steatosis, where the out-of-phase image shows the signal loss, although it is due to a different mechanism. It is evident that a combination of steatosis and iron overload can be problematic using in-phase and out-of-phase series.56,62 However, there are more recent and better MRI techniques for iron detection and quantification.52,58,61,63,67–70 Alústiza el al compared two MRI techniques, with an area under the receiver operating characteristic (ROC) curve of 0.887 and 0.958, respectively.66 The results demonstrated different accuracy according to the level of iron overload with a sensitivity and specificity of 86% and 100%, respectively, for iron concentrations ≥85 μmol/g, and of 100% and 81%, respectively, for iron concentrations ≤40 μmol/g.66 MRI can also evaluate iron overload in other organs and confirm the diagnosis of primary hemochromatosis (Figure 15). The presence of iron overload in the liver and pancreas raises suspicion for primary hemochromatosis. The spleen is not involved in primary hemochromatosis unless the patient has received repeated transfusions.62
 | Figure 14 MRI showing iron overload. |
 | Figure 15 MRI showing iron overload in the liver and pancreas. |
Fibrosis and cirrhosis
Liver fibrosis is characterized by excess deposits of extracellular matrix, especially collagen, in response to repetitive liver injury from various causes. The main causes of liver fibrosis in the USA are viral infection, nonalcoholic fatty liver disease, and alcohol consumption. There is an increasing incidence of chronic liver disease and of liver fibrosis in the USA. Liver fibrosis tends to progress, leading to hepatic dysfunction, portal hypertension, and ultimately cirrhosis; and cirrhosis is a risk factor for HCC. This progression was once considered to be irreversible; however, it has been shown that liver fibrosis is a dynamic process that can regress or disappear, especially in early cases. Like the other diffuse liver diseases previously discussed, liver fibrosis remains asymptomatic or has mild and nonspecific symptoms over a long period of time, becoming evident later when there is cirrhosis and its complications.21,71–73
Biopsy is the current standard reference for diagnosing and staging liver fibrosis. However, liver biopsy is invasive and expensive, has poor patient acceptance, may have complications, evaluates small samples, and has sampling errors. A difference of at least one stage of fibrosis between the right and left lobe biopsies may be found in 33% of patients with chronic hepatitis C. The staging system for liver fibrosis is subjective and does not precisely measure the amount of fibrosis. Both fibrosis and inflammation have inhomogeneous distributions in the liver. These aspects make biopsy not ideal for screening, monitoring, evaluation of treatment response, or epidemiological research.21,71–74
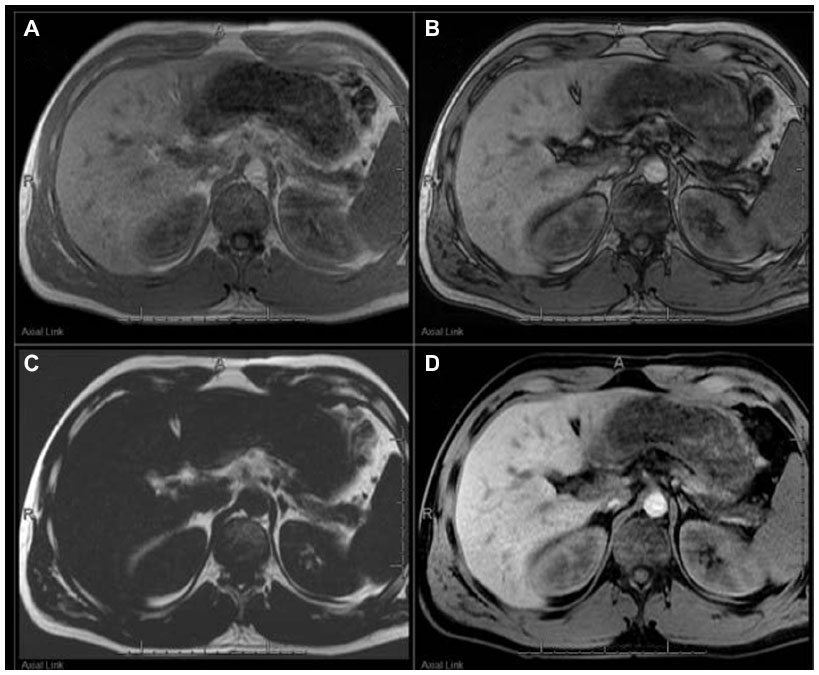
Use of CT for detection of liver fibrosis is limited to visualization of morphological changes in the liver parenchyma. For example, nodularity of the liver capsule or segmental or lobar atrophy suggests fibrosis (Figure 16).21,71 Conversely, MRI with hepatobiliary contrast agents can estimate the degree of fibrosis, reflecting loss of hepatocyte function. Liver fibrosis will result in a relative decrease in enhancement of the liver during the hepatobiliary phase (Figure 17), which is proportional to the degree of fibrosis; however, there is overlap between the stages of fibrosis (area under the ROC curve 0.85, sensitivity 73%, and specificity 87% for F3 and F4 fibrosis).75 Progressive reduction of contrast hepatocyte uptake according to the Child-Pugh classification has also been noted.76 Although the fibrosis-related decrease in contrast enhancement gives information about liver function and fibrosis, it may reduce the diagnostic efficacy of hepatocellular contrast agents.75,77 A recent meta-analysis evaluating the accuracy of MRI with gadoxetate dimeglumine for detection of HCC showed an area under the ROC curve of 0.98 for overall HCC, 0.98 for HCC in patients with cirrhosis, and 0.99 for HCC 2.0 cm or smaller in diameter.78
 | Figure 16 Axial post-contrast CT image in a patient with cirrhosis. |
 | Figure 17 MRIs showing cirrhosis. |
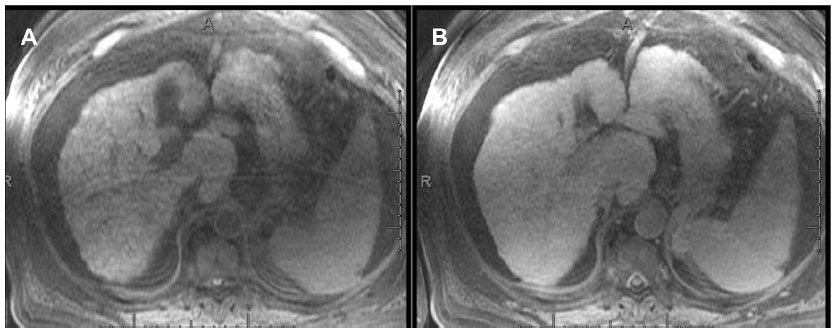
Elastography quantifies the stiffness of a tissue by analyzing the propagation of mechanical waves through it. There are two main imaging methods for measuring stiffness, ie, MR and ultrasound. In MR elastography, a driver device is placed on the abdominal wall adjacent to the liver. This driver device produces mechanical waves that propagate through the hepatic tissue, while images are acquired using gradient echo sequences. The velocity and wavelength of the propagating waves depend on the stiffness of the tissue. Stiffness in the liver increases according to the degree of fibrosis, so liver fibrosis can be quantified (Figure 18). Liver stiffness is measured in kilopascals (kPa), and normal liver stiffness usually is lower than 2.5 kPa.21,71–73,79–81
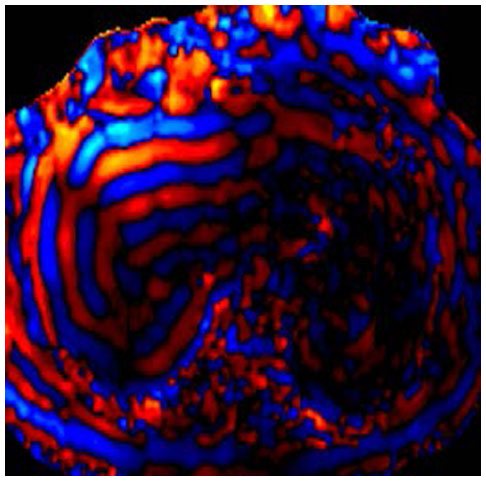 | Figure 18 MR elastography. |
MR elastography has a high accuracy for differentiating normal or F0 stage livers from those with other fibrous stages (≥F1) and also for differentiating between the stages of fibrosis. Clinically significant fibrosis (≥F2) can be diagnosed with accuracy exceeding 95%, and the differentiation of cirrhosis (F4) from lesser degrees of fibrosis has an accuracy exceeding 98%.74,81–85 Yin et al demonstrated a highly significant correlation (r2=0.94) between MR elastography and the stage of fibrosis, with a sensitivity of 98% and sensitivity of more than 99% for differentiating any stage of liver fibrosis from normal liver tissue, with an area under the ROC curve of 0.99.85 Venkatesh et al reported that MR elastography had a sensitivity of 96%–100%, a specificity of 92%–100%, and an area under the ROC curve of 0.98–0.99 for differentiating between the stages of fibrosis.74
Cutoff stiffness values for differentiating normal from fibrotic livers and the stages of fibrosis vary in the literature, possibly due to inclusion of patients with different etiologies of fibrosis in most studies.72,73 In patients with chronic hepatitis B, using a cutoff value of 2.74 kPa for ≥F1, 3.2 kPa for ≥F2, 3.7 kPa for ≥F3, and 4.33 kPa for F4, an area under the ROC curve of 0.98–0.99 was achieved.74 In patients with nonalcoholic fatty liver disease, both steatohepatitis and fibrosis cause an increase in liver stiffness. Patients with isolated fatty liver disease can be differentiated from those with steatohepatitis ± fibrosis with an accuracy of 93% using a cutoff value of 2.74 kPa.86 MR elastography can detect advanced fibrosis (F3–F4) in nonalcoholic fatty liver disease with an accuracy of 95% using a cutoff value of 4.15 kPa, and this information is very important for disease management.87
Focal liver disease, liver volumetry, and liver function
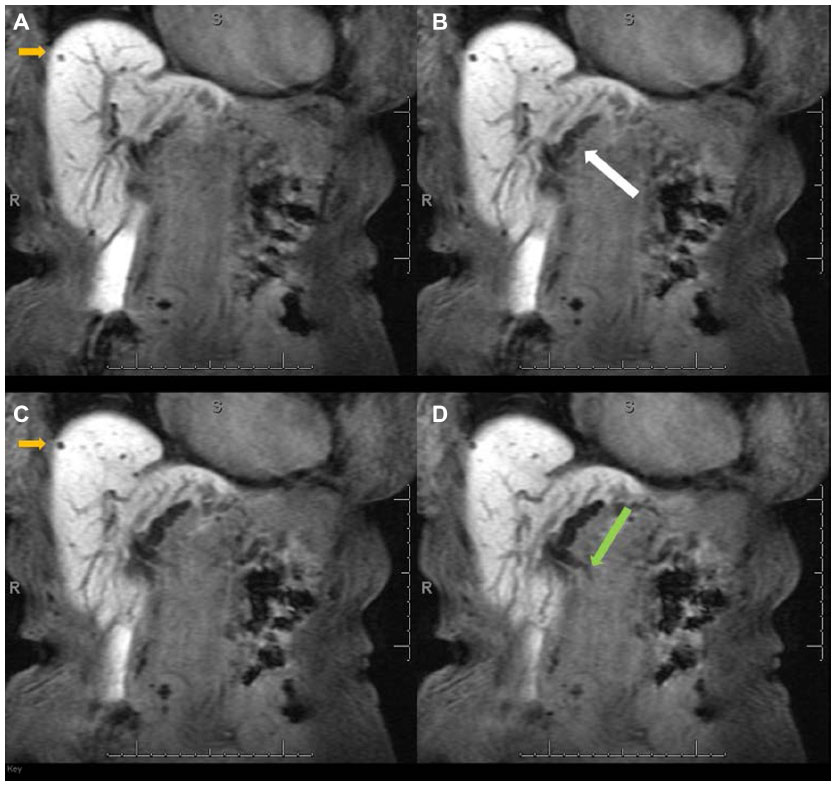
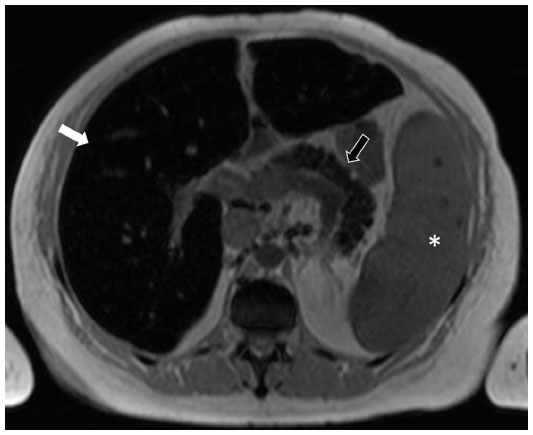
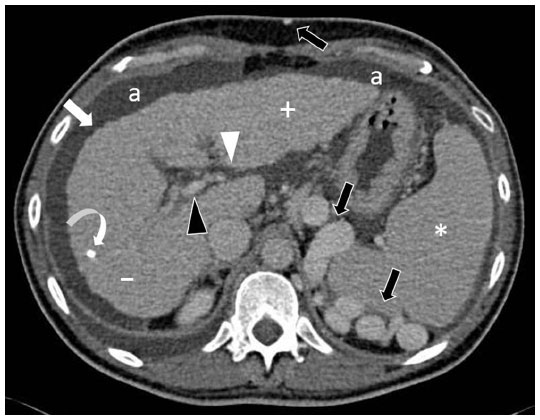
There are multiple focal pathological processes in the liver, besides liver lesions, that will result in decreased uptake of a hepatobiliary contrast agent. These include fat deposition (Figure 19), iron deposition (Figure 20), liver fibrosis, chemotherapy-induced fibrosis, and external radiation changes (Figure 21). These pathologies can be distinguished from an underlying liver lesion by combining the image features of the hepatobiliary images with the other MRI sequences.88–90
 | Figure 19 MRIs showing focal fat. |
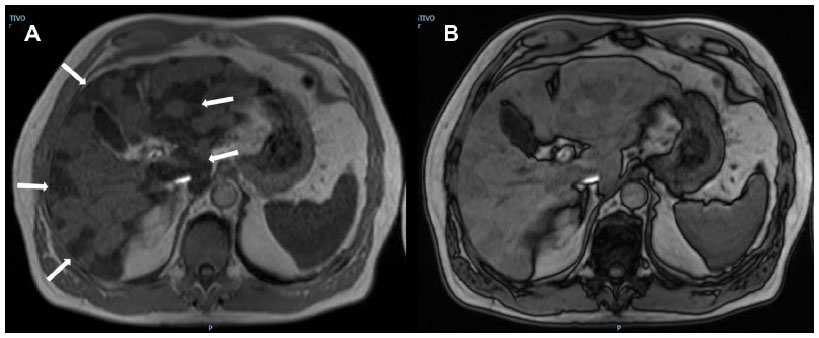 | Figure 20 MRI showing focal iron. |
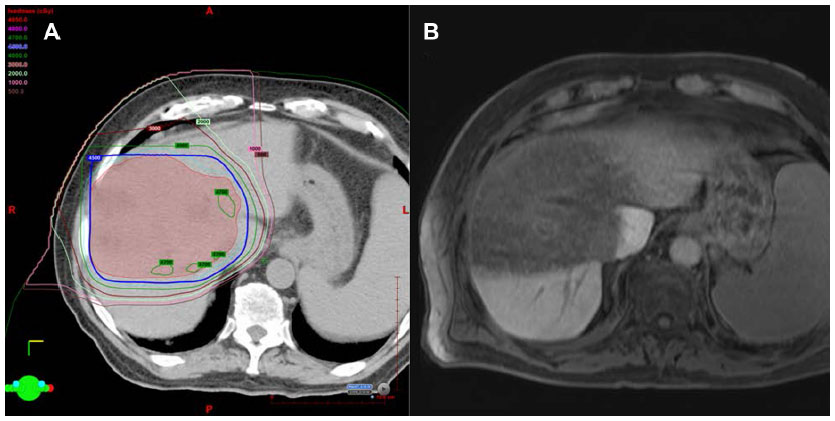 | Figure 21 Radiation changes in the liver. |
The presence and degree of liver disease has major implications in the setting of surgical management. Estimation of the future liver remnant requires measurement of liver segmental volumes prior to resection. A suboptimal future liver remnant may necessitate portal vein embolization before surgery. Routine post-contrast imaging can be used with the assistance of post-processing software to estimate the segmental liver volumes (Figure 22). A future liver remnant of less than 20% in a normal liver or less than 40% in a cirrhotic liver increases postsurgical morbidity.8,91,92 Many studies have shown high correlations between cross-sectional volumetry and actual liver volume. For example, in orthotopic liver transplantation, a high correlation was found between manual CT volumetry and liver volume (r=0.96).93 In living donor transplantation, a correlation coefficient of 0.92 was shown using manual CT volumetry.94 For partial hepatectomy, a correlation coefficient of 0.92 was found for MRI and 0.88 for CT using semiautomated software.95
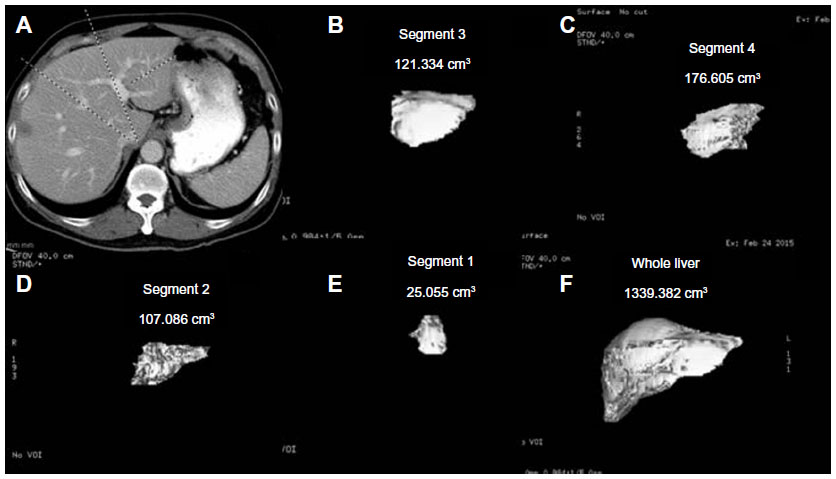 | Figure 22 Liver volumetry. |
Wibmer et al compared relative liver enhancement during the hepatobiliary phase of preoperative MRI examinations with the risk of liver failure after major liver resection.96 When using the 50-50 criteria for liver failure, the researchers found a lower median relative liver enhancement in patients with postoperative liver failure (54.5%) than in patients without liver failure (125.6%). When the International Study Group of Liver Surgery criteria for liver failure were used, the median relative liver enhancement was 136% in patients without liver failure, 112.5% in those with grade A liver failure, 88.4% in those with grade B liver failure, and 41.7% in those with grade C liver failure. These results suggest a relationship between the degree of enhancement during the hepatobiliary phase of preoperative MRI and the severity of postoperative liver failure.96
Conclusion
CT and MRI are routinely used for detection and characterization of liver lesions. In addition to routine examination, novel techniques such as hepatobiliary contrast agents, DECT, and elastography can provide a wealth of clinically relevant information that will affect disease management and potentially the morbidity and mortality of the therapeutic options used. CT and MRI also have an important role in the evaluation of vascular and biliary variant anatomy, steatosis, iron overload, fibrosis, and liver volumetry. The major challenges of these advanced examinations are standardization of technique, simplification of execution, and widespread dissemination. The combination of novel techniques with current examination techniques can provide a “one-stop shop” that can be completed within the time allotted for the MRI and CT examination.
Disclosure
The authors report no conflicts of interest in this work.
References
Erbay N, Raptopoulos V, Pomfret EA, Kamel IR, Kruskal JB. Living donor liver transplantation in adults: vascular variants important in surgical planning for donors and recipients. AJR Am J Roentgenol. 2003;181(1):109–114. | |
Catalano OA, Singh AH, Uppot RN, Hahn PF, Ferrone CR, Sahani DV. Vascular and biliary variants in the liver: implications for liver surgery. Radiographics. 2008;28(2):359–378. | |
Covey AM, Brody LA, Getrajdman GI, Sofocleous CT, Brown KT. Incidence, patterns, and clinical relevance of variant portal vein anatomy. AJR Am J Roentgenol. 2004;183(4):1055–1064. | |
Singh AK, Cronin CG, Verma HA, et al. Imaging of preoperative liver transplantation in adults: what radiologists should know. Radiographics. 2011;31(4):1017–1030. | |
Covey AM, Brody LA, Maluccio MA, Getrajdman GI, Brown KT. Variant hepatic arterial anatomy revisited: digital subtraction angiography performed in 600 patients. Radiology. 2002;224(2):542–547. | |
Sahani D, Mehta A, Blake M, Prasad S, Harris G, Saini S. Preoperative hepatic vascular evaluation with CT and MR angiography: implications for surgery. Radiographics. 2004;24(5):1367–1380. | |
Hyodo T, Kumano S, Kushihata F, et al. CT and MR cholangiography: advantages and pitfalls in perioperative evaluation of biliary tree. Br J Radiol. 2012;85(1015):887–896. | |
Shin DS, Ingraham CR, Dighe MK, et al. Surgical resection of a malignant liver lesion: what the surgeon wants the radiologist to know. AJR Am J Roentgenol. 2014;203(1):W21–W33. | |
Tsang LL, Chen CL, Huang TL, et al. Preoperative imaging evaluation of potential living liver donors: reasons for exclusion from donation in adult living donor liver transplantation. Transplant Proc. 2008;40(8):2460–2462. | |
Silva AC, Morse BG, Hara AK, Paden RG, Hongo N, Pavlicek W. Dual-energy (spectral) CT: applications in abdominal imaging. Radiographics. 2011;31(4):1031–1046. | |
Choi JY, Kim MJ, Lee JM, et al. Magnetic resonance cholangiography: comparison of two- and three-dimensional sequences for assessment of malignant biliary obstruction. Eur Radiol. 2008;18(1):78–86. | |
Kim MJ, Mitchell DG, Ito K, Outwater EK. Biliary dilatation: differentiation of benign from malignant causes – value of adding conventional MR imaging to MR cholangiopancreatography. Radiology. 2000;214(1):173–181. | |
Li B, Zhang L, Zhang ZY, et al. Differentiation of noncalculous periampullary obstruction: comparison of CT with negative-contrast CT cholangiopancreatography versus MRI with MR cholangiopancreatography. Eur Radiol. 2015;25(2):391–401. | |
Zhang ZY, Wang D, Ni JM, et al. Comparison of three-dimensional negative-contrast CT cholangiopancreatography with three-dimensional MR cholangiopancreatography for the diagnosis of obstructive biliary diseases. Eur J Radiol. 2012;81(5):830–837. | |
Okada M, Fukada J, Toya K, Ito R, Ohashi T, Yorozu A. The value of drip infusion cholangiography using multidetector-row helical CT in patients with choledocholithiasis. Eur Radiol. 2005;15(10):2140–2145. | |
Takahashi M, Saida Y, Itai Y, Gunji N, Orii K, Watanabe Y. Reevaluation of spiral CT cholangiography: basic considerations and reliability for detecting choledocholithiasis in 80 patients. J Comput Assist Tomogr. 2000;24(6):859–865. | |
Boraschi P, Donati F. Biliary-enteric anastomoses: spectrum of findings on Gd-EOB-DTPA-enhanced MR cholangiography. Abdom Imaging. 2013;38(6):1351–1359. | |
Gupta RT. Evaluation of the biliary tree and gallbladder with hepatocellular MR contrast agents. Curr Probl Diagn Radiol. 2013;42(2):67–76. | |
Lee NK, Kim S, Lee JW, et al. Biliary MR imaging with Gd-EOB-DTPA and its clinical applications. Radiographics. 2009;29(6):1707–1724. | |
Bacon BR, Adams PC, Kowdley KV, Powell LW, Tavill AS. Diagnosis and management of hemochromatosis: 2011 practice guideline by the American Association for the Study of Liver Diseases. Hepatology. 2011;54(1):328–343. | |
Faria SC, Ganesan K, Mwangi I, et al. MR imaging of liver fibrosis: current state of the art. Radiographics. 2009;29(6):1615–1635. | |
Vilgrain V, Ronot M, Abdel-Rehim M, et al. Hepatic steatosis: a major trap in liver imaging. Diagn Interv Imaging. 2013;94(7–8):713–727. | |
Angulo P. Nonalcoholic fatty liver disease. N Engl J Med. 2002;346(16):1221–1231. | |
Adams LA, Lymp JF, St Sauver J, et al. The natural history of nonalcoholic fatty liver disease: a population-based cohort study. Gastroenterology. 2005;129(1):113–121. | |
Browning JD, Szczepaniak LS, Dobbins R, et al. Prevalence of hepatic steatosis in an urban population in the United States: impact of ethnicity. Hepatology. 2004;40(6):1387–1395. | |
Szczepaniak LS, Nurenberg P, Leonard D, et al. Magnetic resonance spectroscopy to measure hepatic triglyceride content: prevalence of hepatic steatosis in the general population. Am J Physiol Endocrinol Metab. 2005;288(2):E462–E468. | |
Hossain N, Afendy A, Stepanova M, et al. Independent predictors of fibrosis in patients with nonalcoholic fatty liver disease. Clin Gastroenterol Hepatol. 2009;7(11):1224–1229. | |
Yeh MM, Brunt EM. Pathological features of fatty liver disease. Gastroenterology. 2014;147(4):754–764. | |
El-Serag HB. Hepatocellular carcinoma. N Engl J Med. 2011;365(12):1118–1127. | |
Reddy SK, Reilly C, Zhan M, et al. Long-term influence of chemotherapy on steatosis-associated advanced hepatic fibrosis. Med Oncol. 2014;31(6):971. | |
Sharma A, Houshyar R, Bhosale P, Choi JI, Gulati R, Lall C. Chemotherapy induced liver abnormalities: an imaging perspective. Clin Mol Hepatol. 2014;20(3):317–326. | |
Torrisi JM, Schwartz LH, Gollub MJ, Ginsberg MS, Bosl GJ, Hricak H. CT findings of chemotherapy-induced toxicity: what radiologists need to know about the clinical and radiologic manifestations of chemotherapy toxicity. Radiology. 2011;258(1):41–56. | |
El-Badry AM, Breitenstein S, Jochum W, et al. Assessment of hepatic steatosis by expert pathologists: the end of a gold standard. Ann Surg. 2009;250(5):691–697. | |
Kleiner DE, Brunt EM, Van Natta M, et al. Design and validation of a histological scoring system for nonalcoholic fatty liver disease. Hepatology. 2005;41(6):1313–1321. | |
Ma X, Holalkere NS, Kambadakone RA, Mino-Kenudson M, Hahn PF, Sahani DV. Imaging-based quantification of hepatic fat: methods and clinical applications. Radiographics. 2009;29(5):1253–1277. | |
Ratziu V, Charlotte F, Heurtier A, et al. Sampling variability of liver biopsy in nonalcoholic fatty liver disease. Gastroenterology. 2005; 128(7):1898–1906. | |
Kodama Y, Ng CS, Wu TT, et al. Comparison of CT methods for determining the fat content of the liver. AJR Am J Roentgenol. 2007;188(5):1307–1312. | |
Lee SW, Park SH, Kim KW, et al. Unenhanced CT for assessment of macrovesicular hepatic steatosis in living liver donors: comparison of visual grading with liver attenuation index. Radiology. 2007;244(2):479–485. | |
Limanond P, Raman SS, Lassman C, et al. Macrovesicular hepatic steatosis in living related liver donors: correlation between CT and histologic findings. Radiology. 2004;230(1):276–280. | |
Park SH, Kim PN, Kim KW, et al. Macrovesicular hepatic steatosis in living liver donors: use of CT for quantitative and qualitative assessment. Radiology. 2006;239(1):105–112. | |
Yajima Y, Narui T, Ishii M, et al. Computed tomography in the diagnosis of fatty liver: total lipid content and computed tomography number. Tohoku J Exp Med. 1982;136(3):337–342. | |
Sun T, Lin X, Chen K. Evaluation of hepatic steatosis using dual-energy CT with MR comparison. Front Biosci (Landmark Ed). 2014;19:1377–1385. | |
Cassidy FH, Yokoo T, Aganovic L, et al. Fatty liver disease: MR imaging techniques for the detection and quantification of liver steatosis. Radiographics. 2009;29(1):231–260. | |
Fishbein M, Castro F, Cheruku S, et al. Hepatic MRI for fat quantitation: its relationship to fat morphology, diagnosis, and ultrasound. J Clin Gastroenterol. 2005;39(7):619–625. | |
Schuchmann S, Weigel C, Albrecht L, et al. Non-invasive quantification of hepatic fat fraction by fast 1.0, 1.5 and 3.0 T MR imaging. Eur J Radiol. 2007;62(3):416–422. | |
Dixon WT. Simple proton spectroscopic imaging. Radiology. 1984;153(1):189–194. | |
Bernard CP, Liney GP, Manton DJ, Turnbull LW, Langton CM. Comparison of fat quantification methods: a phantom study at 3.0T. J Magn Reson Imaging. 2008;27(1):192–197. | |
Kim H, Taksali SE, Dufour S, et al. Comparative MR study of hepatic fat quantification using single-voxel proton spectroscopy, two-point dixon and three-point IDEAL. Magn Reson Med. 2008;59(3):521–527. | |
Liu CY, McKenzie CA, Yu H, Brittain JH, Reeder SB. Fat quantification with IDEAL gradient echo imaging: correction of bias from T(1) and noise. Magn Reson Med. 2007;58(2):354–364. | |
Reeder SB, McKenzie CA, Pineda AR, et al. Water-fat separation with IDEAL gradient-echo imaging. J Magn Reson Imaging. 2007;25(3):644–652. | |
Reeder SB, Pineda AR, Wen Z, et al. Iterative decomposition of water and fat with echo asymmetry and least-squares estimation (IDEAL): application with fast spin-echo imaging. Magn Reson Med. 2005;54(3):636–644. | |
Yu H, McKenzie CA, Shimakawa A, et al. Multiecho reconstruction for simultaneous water-fat decomposition and T2* estimation. J Magn Reson Imaging. 2007;26(4):1153–1161. | |
Mitchell DG, Kim I, Chang TS, et al. Fatty liver. Chemical shift phase-difference and suppression magnetic resonance imaging techniques in animals, phantoms, and humans. Invest Radiol. 1991;26(12):1041–1052. | |
Rinella ME, McCarthy R, Thakrar K, et al. Dual-echo, chemical shift gradient-echo magnetic resonance imaging to quantify hepatic steatosis: implications for living liver donation. Liver Transpl. 2003;9(8):851–856. | |
Qayyum A, Goh JS, Kakar S, Yeh BM, Merriman RB, Coakley FV. Accuracy of liver fat quantification at MR imaging: comparison of out-of-phase gradient-echo and fat-saturated fast spin-echo techniques – initial experience. Radiology. 2005;237(2):507–511. | |
Westphalen AC, Qayyum A, Yeh BM, et al. Liver fat: effect of hepatic iron deposition on evaluation with opposed-phase MR imaging. Radiology. 2007;242(2):450–455. | |
Adams P, Brissot P, Powell LW. EASL International Consensus Conference on Haemochromatosis. J Hepatol. 2000;33(3):485–504. | |
Alustiza JM, Castiella A, De Juan MD, Emparanza JI, Artetxe J, Uranga M. Iron overload in the liver diagnostic and quantification. Eur J Radiol. 2007;61(3):499–506. | |
Andrews NC. Disorders of iron metabolism. N Engl J Med. 1999; 341(26):1986–1995. | |
Gandon Y, Olivie D, Guyader D, et al. Non-invasive assessment of hepatic iron stores by MRI. Lancet. 2004;363(9406):357–362. | |
Kuhn JP, Hernando D, Munoz del Rio A, et al. Effect of multipeak spectral modeling of fat for liver iron and fat quantification: correlation of biopsy with MR imaging results. Radiology. 2012;265(1):133–142. | |
Queiroz-Andrade M, Blasbalg R, Ortega CD, et al. MR imaging findings of iron overload. Radiographics. 2009;29(6):1575–1589. | |
St Pierre TG, Clark PR, Chua-anusorn W, et al. Noninvasive measurement and imaging of liver iron concentrations using proton magnetic resonance. Blood. 2005;105(2):855–861. | |
Villeneuve JP, Bilodeau M, Lepage R, Cote J, Lefebvre M. Variability in hepatic iron concentration measurement from needle-biopsy specimens. J Hepatol. 1996;25(2):172–177. | |
Joe E, Kim SH, Lee KB, et al. Feasibility and accuracy of dual-source dual-energy CT for noninvasive determination of hepatic iron accumulation. Radiology. 2012;262(1):126–135. | |
Alustiza JM, Artetxe J, Castiella A, et al. MR quantification of hepatic iron concentration. Radiology. 2004;230(2):479–484. | |
Hankins JS, McCarville MB, Loeffler RB, et al. R2* magnetic resonance imaging of the liver in patients with iron overload. Blood. 2009;113(20):4853–4855. | |
Wood JC, Enriquez C, Ghugre N, et al. MRI R2 and R2* mapping accurately estimates hepatic iron concentration in transfusion-dependent thalassemia and sickle cell disease patients. Blood. 2005;106(4):1460–1465. | |
Anderson LJ, Holden S, Davis B, et al. Cardiovascular T2-star (T2*) magnetic resonance for the early diagnosis of myocardial iron overload. Eur Heart J. 2001;22(23):2171–2179. | |
St Pierre TG, El-Beshlawy A, Elalfy M, et al. Multicenter validation of spin-density projection-assisted R2-MRI for the noninvasive measurement of liver iron concentration. Magn Reson Med. 2014;71(6):2215–2223. | |
Venkatesh SK, Ehman RL. Magnetic resonance elastography of liver. Magn Reson Imaging Clin N Am. 2014;22(3):433–446. | |
Venkatesh SK, Yin M, Ehman RL. Magnetic resonance elastography of liver: technique, analysis, and clinical applications. J Magn Reson Imaging. 2013;37(3):544–555. | |
Venkatesh SK, Yin M, Ehman RL. Magnetic resonance elastography of liver: clinical applications. J Comput Assist Tomogr. 2013;37(6):887–896. | |
Venkatesh SK, Wang G, Lim SG, Wee A. Magnetic resonance elastography for the detection and staging of liver fibrosis in chronic hepatitis B. Eur Radiol. 2014;24(1):70–78. | |
Feier D, Balassy C, Bastati N, Stift J, Badea R, Ba-Ssalamah A. Liver fibrosis: histopathologic and biochemical influences on diagnostic efficacy of hepatobiliary contrast-enhanced MR imaging in staging. Radiology. 2013;269(2):460–468. | |
Haimerl M, Verloh N, Zeman F, et al. Assessment of clinical signs of liver cirrhosis using T1 mapping on Gd-EOB-DTPA-enhanced 3T MRI. PLoS One. 2013;8(12):e85658. | |
Verloh N, Haimerl M, Rennert J, et al. Impact of liver cirrhosis on liver enhancement at Gd-EOB-DTPA enhanced MRI at 3 Tesla. Eur J Radiol. 2013;82(10):1710–1715. | |
Liu X, Zou L, Liu F, Zhou Y, Song B. Gadoxetic acid disodium-enhanced magnetic resonance imaging for the detection of hepatocellular carcinoma: a meta-analysis. PLoS One. 2013;8(8):e70896. | |
Bensamoun SF, Wang L, Robert L, Charleux F, Latrive JP, Ho Ba Tho MC. Measurement of liver stiffness with two imaging techniques: magnetic resonance elastography and ultrasound elastometry. J Magn Reson Imaging. 2008;28(5):1287–1292. | |
Huwart L, Sempoux C, Vicaut E, et al. Magnetic resonance elastography for the noninvasive staging of liver fibrosis. Gastroenterology. 2008;135(1):32–40. | |
Kim BH, Lee JM, Lee YJ, et al. MR elastography for noninvasive assessment of hepatic fibrosis: experience from a tertiary center in Asia. J Magn Reson Imaging. 2011;34(5):1110–1116. | |
Huwart L, Salameh N, ter Beek L, et al. MR elastography of liver fibrosis: preliminary results comparing spin-echo and echo-planar imaging. Eur Radiol. 2008;18(11):2535–2541. | |
Huwart L, Sempoux C, Salameh N, et al. Liver fibrosis: noninvasive assessment with MR elastography versus aspartate aminotransferase-to-platelet ratio index. Radiology. 2007;245(2):458–466. | |
Ichikawa S, Motosugi U, Ichikawa T, et al. Magnetic resonance elastography for staging liver fibrosis in chronic hepatitis C. Magn Reson Med. 2012;11(4):291–297. | |
Yin M, Talwalkar JA, Glaser KJ, et al. Assessment of hepatic fibrosis with magnetic resonance elastography. Clin Gastroenterol Hepatol. 2007;5(10):1207–1213. | |
Chen J, Talwalkar JA, Yin M, Glaser KJ, Sanderson SO, Ehman RL. Early detection of nonalcoholic steatohepatitis in patients with nonalcoholic fatty liver disease by using MR elastography. Radiology. 2011;259(3):749–756. | |
Kim D, Kim WR, Talwalkar JA, Kim HJ, Ehman RL. Advanced fibrosis in nonalcoholic fatty liver disease: noninvasive assessment with MR elastography. Radiology. 2013;268(2):411–419. | |
Goodwin MD, Dobson JE, Sirlin CB, Lim BG, Stella DL. Diagnostic challenges and pitfalls in MR imaging with hepatocyte-specific contrast agents. Radiographics. 2011;31(6):1547–1568. | |
Sanuki N, Takeda A, Oku Y, et al. Threshold doses for focal liver reaction after stereotactic ablative body radiation therapy for small hepatocellular carcinoma depend on liver function: evaluation on magnetic resonance imaging with Gd-EOB-DTPA. Int J Radiat Oncol Biol Phys. 2014;88(2):306–311. | |
Yeom SK, Byun JH, Kim HJ, et al. Focal fat deposition at liver MRI with gadobenate dimeglumine and gadoxetic acid: quantitative and qualitative analysis. J Magn Reson Imaging. 2013;31(6):911–917. | |
D’Onofrio M, De Robertis R, Demozzi E, Crosara S, Canestrini S, Pozzi Mucelli R. Liver volumetry: is imaging reliable? Personal experience and review of the literature. World J Radiol. 2014;6(4):62–71. | |
Guglielmi A, Ruzzenente A, Conci S, Valdegamberi A, Iacono C. How much remnant is enough in liver resection? Dig Surg. 2012;29(1):6–17. | |
Luciani A, Rusko L, Baranes L, et al. Automated liver volumetry in orthotopic liver transplantation using multiphase acquisitions on MDCT. AJR Am J Roentgenol. 2012;198(6):W568–W574. | |
Wei L, Zhu ZJ, Lu Y, et al. Application of computer-assisted three-dimensional quantitative assessment and a surgical planning tool for living donor liver transplantation. Chin Med J. 2013;126(7):1288–1291. | |
Karlo C, Reiner CS, Stolzmann P, et al. CT- and MRI-based volumetry of resected liver specimen: comparison to intraoperative volume and weight measurements and calculation of conversion factors. Eur J Radiol. 2010;75(1):e107–e111. | |
Wibmer A, Prusa AM, Nolz R, Gruenberger T, Schindl M, Ba-Ssalamah A. Liver failure after major liver resection: risk assessment by using preoperative gadoxetic acid-enhanced 3-T MR imaging. Radiology. 2013;269(3):777–786. |
 © 2015 The Author(s). This work is published and licensed by Dove Medical Press Limited. The
full terms of this license are available at https://www.dovepress.com/terms
and incorporate the Creative Commons Attribution
- Non Commercial (unported, 3.0) License.
By accessing the work you hereby accept the Terms. Non-commercial uses of the work are permitted
without any further permission from Dove Medical Press Limited, provided the work is properly
attributed. For permission for commercial use of this work, please see paragraphs 4.2 and 5 of our Terms.
© 2015 The Author(s). This work is published and licensed by Dove Medical Press Limited. The
full terms of this license are available at https://www.dovepress.com/terms
and incorporate the Creative Commons Attribution
- Non Commercial (unported, 3.0) License.
By accessing the work you hereby accept the Terms. Non-commercial uses of the work are permitted
without any further permission from Dove Medical Press Limited, provided the work is properly
attributed. For permission for commercial use of this work, please see paragraphs 4.2 and 5 of our Terms.