Back to Journals » Substance Abuse and Rehabilitation » Volume 14
State and Service Estimates of Substance Use Treatment Facilities That Receive Public Funds in the United States
Authors Ware OD ![]()
Received 5 September 2023
Accepted for publication 13 December 2023
Published 20 December 2023 Volume 2023:14 Pages 173—182
DOI https://doi.org/10.2147/SAR.S438706
Checked for plagiarism Yes
Review by Single anonymous peer review
Peer reviewer comments 2
Editor who approved publication: Dr Rajendra Badgaiyan
Orrin D Ware
School of Social Work, University of North Carolina at Chapel Hill, Chapel Hill, NC, USA
Correspondence: Orrin D Ware, School of Social Work, University of North Carolina at Chapel Hill, Chapel Hill, NC, USA, Email [email protected]
Purpose: The Treatment Episode Data Set (TEDS) is a publicly available national dataset provided annually by the Substance Abuse and Mental Health Services Administration. TEDS contains sociodemographic and clinical characteristics of treatment episodes in substance use treatment facilities that receive public funds. Yet little is known about what proportion of facilities across states/jurisdictions and services/settings receive public funds to assist with interpreting TEDS.
Methods: This study uses the National Survey of Substance Abuse Treatment Services 2020. Descriptive statistics were used to estimate percentages of facilities that receive public funds at national and state/jurisdiction levels across all services/settings.
Results: In the full sample, 51.4% (n = 8262) of facilities received public funds, and in the sample of states/jurisdictions included in TEDS 2020 data, 52.3% (n = 7659) of facilities received public funds. Across services/settings, the proportion of facilities receiving public funds ranges from 27.1% in rehab/residential, hospital (non-detox) settings to 58.0% in rehab/residential, short-term (30 days or fewer) services/settings. Variability was also identified within states and services/settings from 0.0% to 100.0% of facilities that receive public funds.
Conclusion: This study estimates the proportions of substance use facilities that receive public funds to guide interpretations of TEDS. This study’s findings, combined with TEDS, may assist advocates, clinicians, policymakers, researchers, service providers, service recipients, and other key stakeholders in reaching a shared goal: improving the well-being of individuals living with substance use disorders.
Keywords: detoxification, outpatient, national survey of substance abuse treatment services, residential, substance use disorder, treatment episode dataset
Introduction
The Treatment Episode Data Set (TEDS) is a de-identified publicly available annual dataset provided by the Substance Abuse and Mental Health Services Administration (SAMHSA).1,2 TEDS consists of two datasets focusing on substance use disorder (SUD) treatment in the United States. One dataset focuses on treatment admissions, TEDS Admissions (TEDS-A).1 The other dataset focuses on treatment discharges, TEDS Discharges (TEDS-D).2 Because treatment episodes (not individuals) are the unit of analysis in TEDS, clinicians and researchers often use the dataset to publish pertinent treatment episode data about SUD treatment trends and outcomes.3–8
TEDS also categorizes facilities using eight types of treatment service/settings: (1) Detox, 24-hour, hospital inpatient; (2) Detox, 24-hour, free-standing residential; (3) Rehab/residential, hospital (non-detox); (4) Rehab/residential, short-term (30 days or fewer); (5) Rehab/residential, long-term (more than 30 days); (6) Ambulatory, intensive outpatient; (7) Ambulatory, non-intensive outpatient; and (8) Ambulatory, detoxification.1,2 Yet even these data do not capture the full treatment landscape in a given year because TEDS data pertain exclusively to SUD providers that receive public funding.1,2 Fortunately, SAMHSA also provides a dataset called the National Survey of Substance Abuse Treatment Services (N-SSATS) that describes all known US SUD treatment facilities, including the proportion of facilities that receive public funds in each state or jurisdiction.9 According to N-SSATS 2020, 51.4% of included facilities received public funds9 – a figure helpful for interpreting data from TEDS, which is focused on those facilities.
Having yearly, state-level estimates of the types and proportion of facilities that receive public funds would also provide crucial empirical context for interpreting TEDS data. Yet to this researcher’s knowledge, no study has made such estimates or estimated the proportion of facilities that receive public funds only in states included in TEDS. Doing so would allow for a more precise estimation of interpreting the proportion of facilities described by TEDS when analyzing data at the state and/or service level. Therefore, this descriptive study uses the N-SSATS 2020 to estimate the proportion of facilities receiving public funds across different SUD treatment services/settings in each state and jurisdiction.
Materials and Methods
Data Source
SAMHSA’s N-SSATS 2020 dataset was used to estimate state-level proportions of SUD treatment facilities that received public funds.9 The dataset contains 16,066 SUD treatment facilities that responded to a survey about their treatment facility characteristics.9 The dataset contains replies from 88.4% of all facilities considered by SAMHSA to be eligible to complete the survey.
Study Measures
Variables incorporated in this dataset include: (a) Receives public funds; (b) State/jurisdiction; (c) Detox, 24-hour, hospital inpatient; (d) Detox, 24-hour, free-standing residential; (e) Rehab/residential, hospital (non-detox); (f) Rehab/residential, short-term (30 days or fewer); (g) Rehab/residential, long term (more than 30 days); (h) Ambulatory, intensive outpatient; (i) Ambulatory, non-intensive outpatient; and (j) Ambulatory, detoxification.
Receives Public Funds
This variable was captured from the “EARMARK” variable. This binary Yes/No variable describes if a “[f]acility receives funding or grants from the federal government, or state, county, or local governments, to support its substance use treatment programs”.9 Only Yes values were examined to select facilities that receive public funds.
State/Jurisdiction
This variable was created using the “STATE” variable. This variable identifies in which of the fifty states, as well as the District of Columbia, Puerto Rico, and other jurisdictions, a facility is located.
Detox, 24-Hour, Hospital Inpatient
This variable was created using “CTYPEHI1”, a binary Yes/No variable that identifies if detox, 24-hour, hospital inpatient services/settings are available. The description of this variable in N-SSATS 2020 is “Facility offers hospital inpatient detoxification”.9
Detox, 24-Hour, Free-Standing Residential
This variable was created using “CTYPERC1”, a binary Yes/No variable that identifies if detox, 24-hour, free-standing residential services/settings are available. The description of this variable in N-SSATS 2020 is “Facility offers non-hospital residential detoxification”.9
Rehab/Residential, Hospital (Non-Detox)
This variable was created using “CTYPEHI2”, a binary Yes/No variable that identifies if rehab/residential, hospital (non-detox) services/settings are available. The description of this variable in N-SSATS 2020 is “Facility offers hospital inpatient treatment services”.9
Rehab/Residential, Short-Term (30 Days or Fewer)
This variable was created using “CTYPERC3”, a binary Yes/No variable that identifies if rehab/residential, short term (30 days or fewer) services/settings are available. The description of this variable in N-SSATS 2020 is “Facility offers non-hospital residential short-term treatment”.9
Rehab/Residential, Long-Term (More Than 30 Days)
This variable was created using “CTYPERC4”, a binary Yes/No variable that identifies if rehab/residential, long term (more than 30 days) services/settings are available. The description of this variable in N-SSATS 2020 is “Facility offers non-hospital residential long-term treatment”.9
Ambulatory, Intensive Outpatient
This variable was created using “CTYPE2”, a binary Yes/No variable that identifies if ambulatory, intensive outpatient services/settings are available. The description of this variable in N-SSATS 2020 is “Facility offers intensive outpatient treatment services”.9
Ambulatory, Non-Intensive Outpatient
This variable was created using “CTYPE3”, a binary Yes/No variable that identifies if ambulatory, non-intensive outpatient service/setting is available. The description of this variable in N-SSATS 2020 is “Facility offers regular outpatient treatment services”.9
Ambulatory, Detoxification
This variable was created using the “CTYPE6” which is a binary Yes/No variable that identifies if ambulatory, detoxification services/settings are available. The description of this variable in N-SSATS 2020 is “Facility offers outpatient detoxification”.9
Statistical Analyses
Using IBM SPSS Statistics, Version 28.0,10 descriptive statistics were used to estimate the proportions of facilities that receive public funds on a national and state/jurisdiction level across all SUD treatment services/settings. National estimates were provided across all states. Separate estimates were provided among states that were included in TEDS-A 2020 (excluding Idaho, Maryland, New Mexico, Oregon, and Washington [n = 1408; 8.8% facilities] for incomplete data submissions).1 Estimates among facilities included in TEDS-A 2020 were presented as proportions of the n = 14,658 facilities included across states. State level data were plotted using the package “usmap”11 in R.12 The University of North Carolina at Chapel Hill Institutional Review Board conducted an ethical review of the current study and assigned a designation of not human subjects research as de-identified publicly available data were used.
Results
All Facilities
Table 1 provides data about all state/jurisdiction that receive public funds regardless of specific services/settings. In the sample in N-SSATS 2020, 51.4% (n = 8262) of facilities received public funds and, in the sample of states/jurisdictions included in TEDS-A 2020, 52.3% (n = 7659) of facilities received public funds. Other jurisdictions, such as Puerto Rico (90.0%) had the highest proportion of facilities receiving public funds, and Maryland (22.5%) had the lowest. Table 2 provides state/jurisdiction level estimates of the proportion of facilities that receive public funds for specific services/settings. Figures displaying state level proportions across all services/settings may be found in Figures 1–4. Figure 1 shows the state level percentages in hospital services/settings. Figure 2 shows the state level percentages in non-hospital detoxification services/settings. Figure 3 shows the state level percentages in non-hospital residential services/settings. Figure 4 shows the state level percentages in outpatient services/settings.
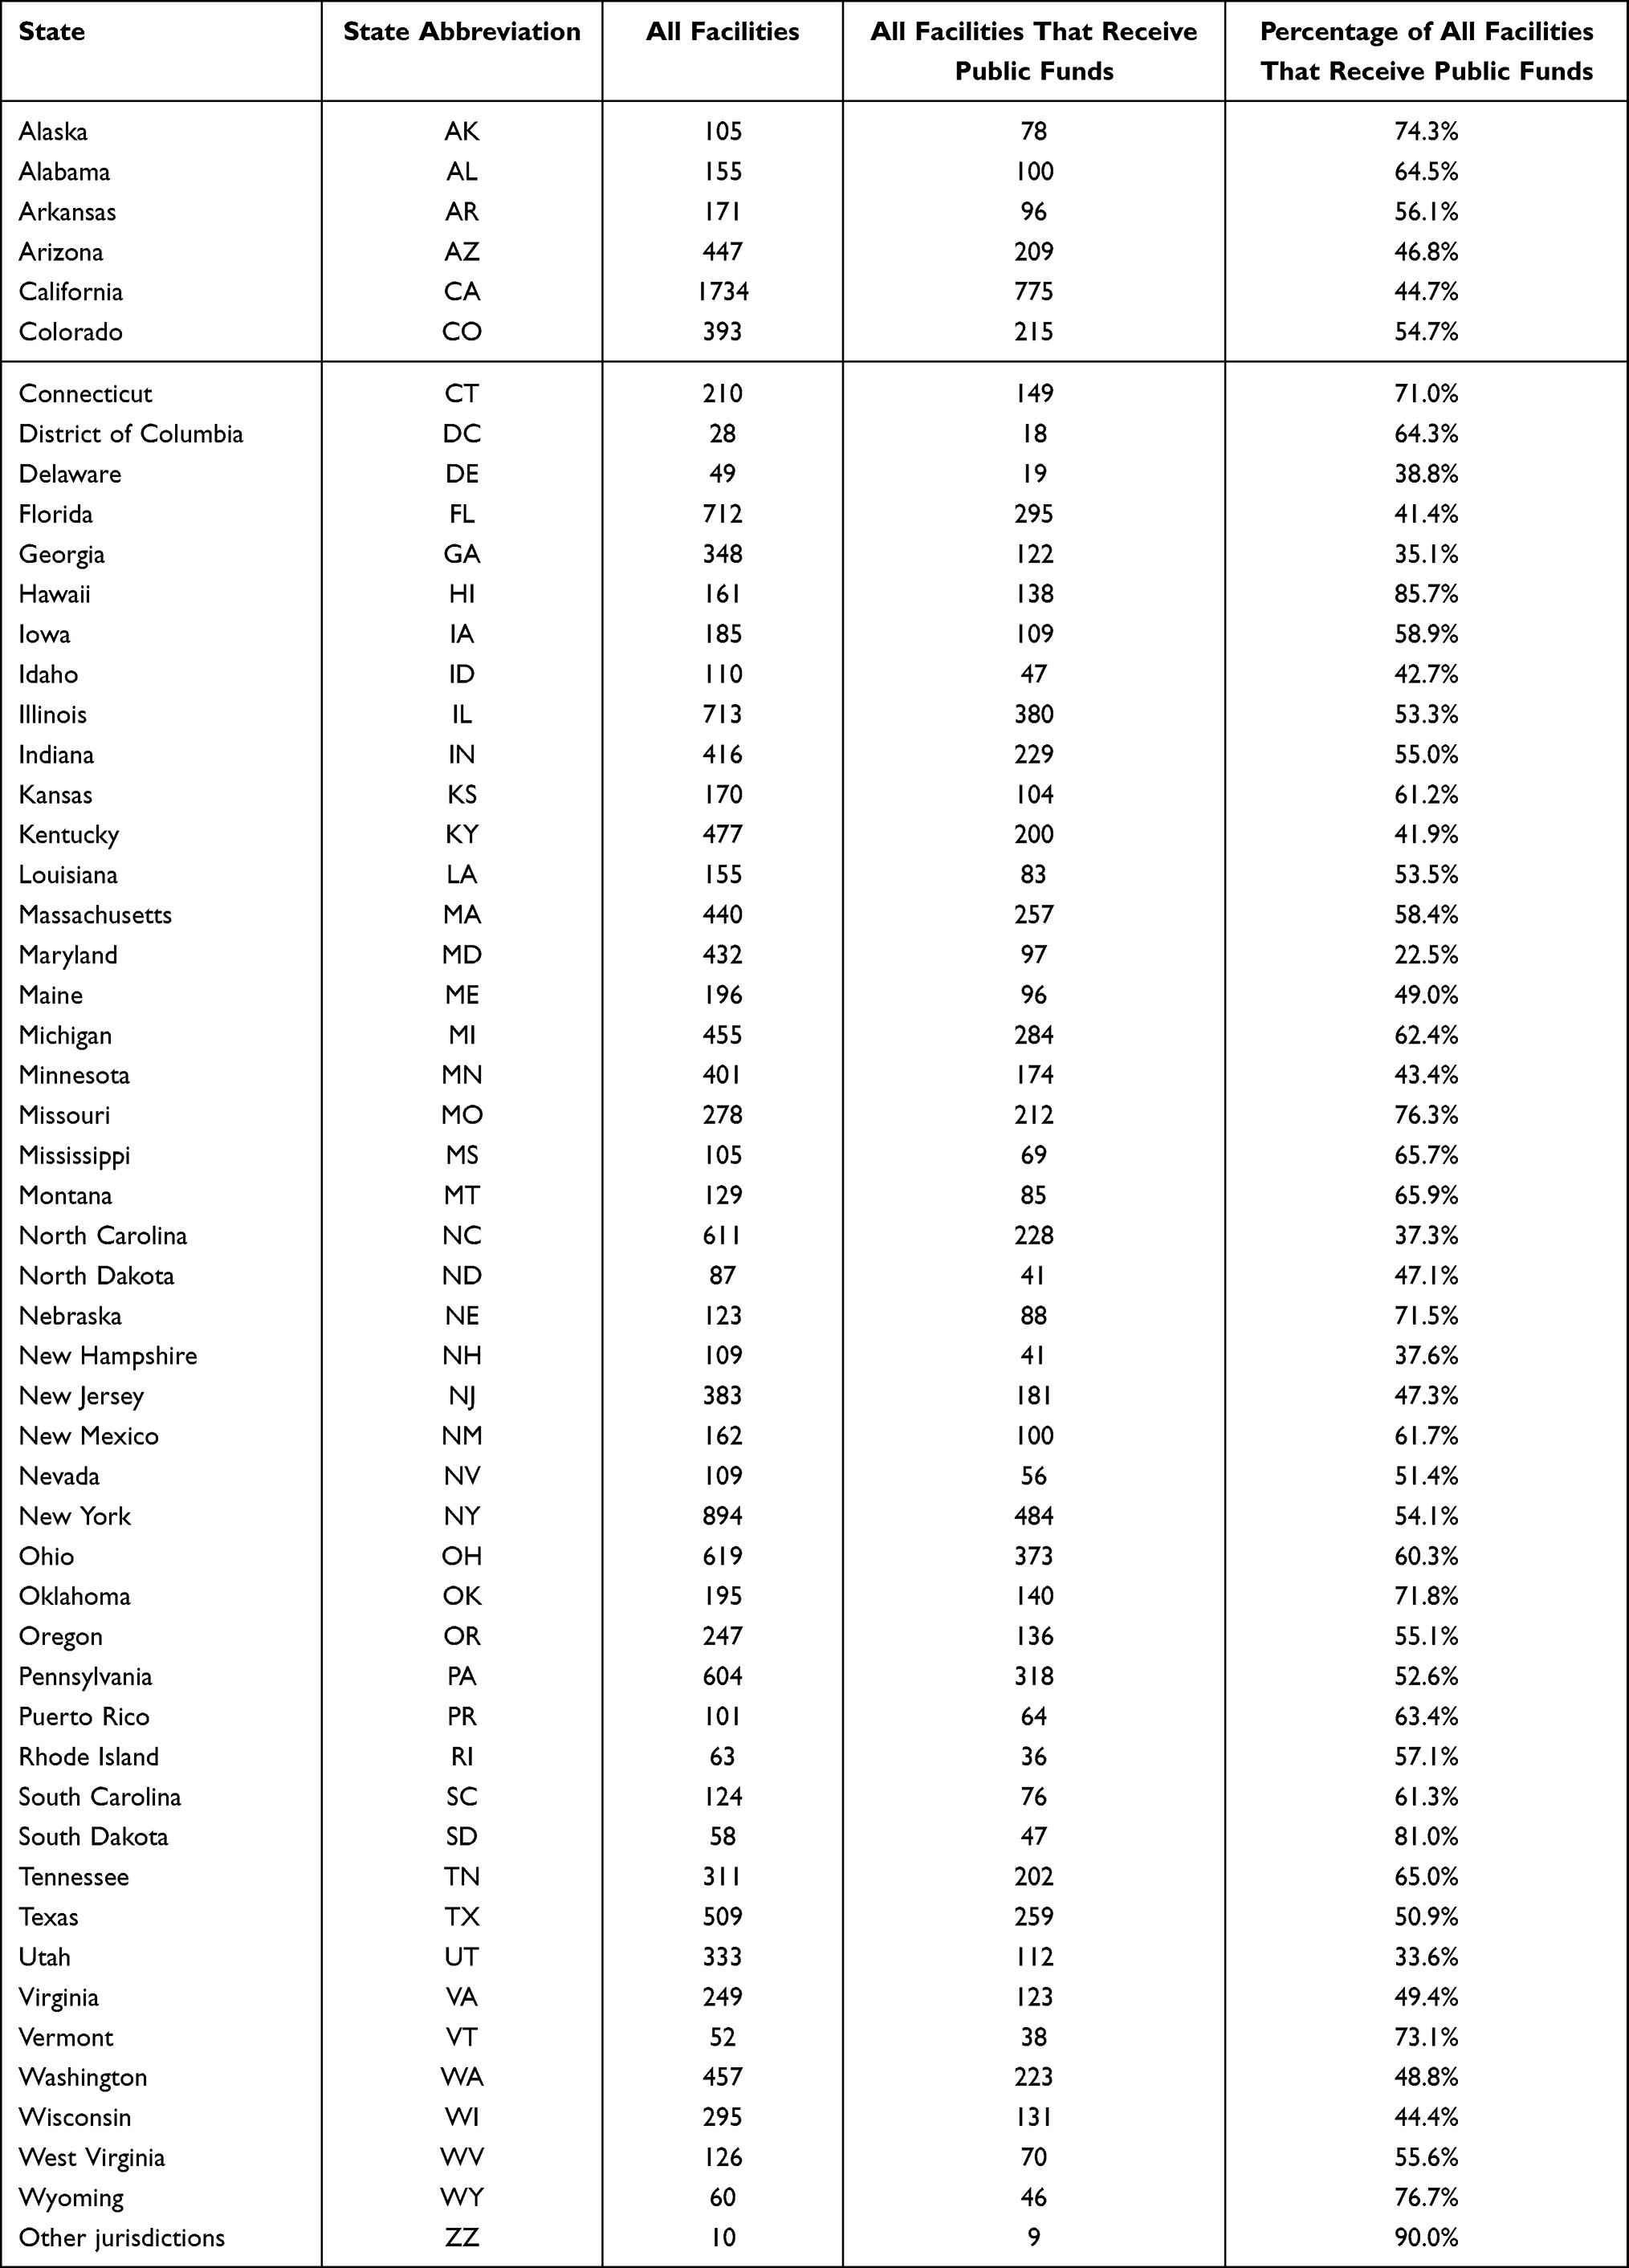 |
Table 1 State- and Jurisdiction-Level Counts and Percentages of Facilities That Receive Public Funds |
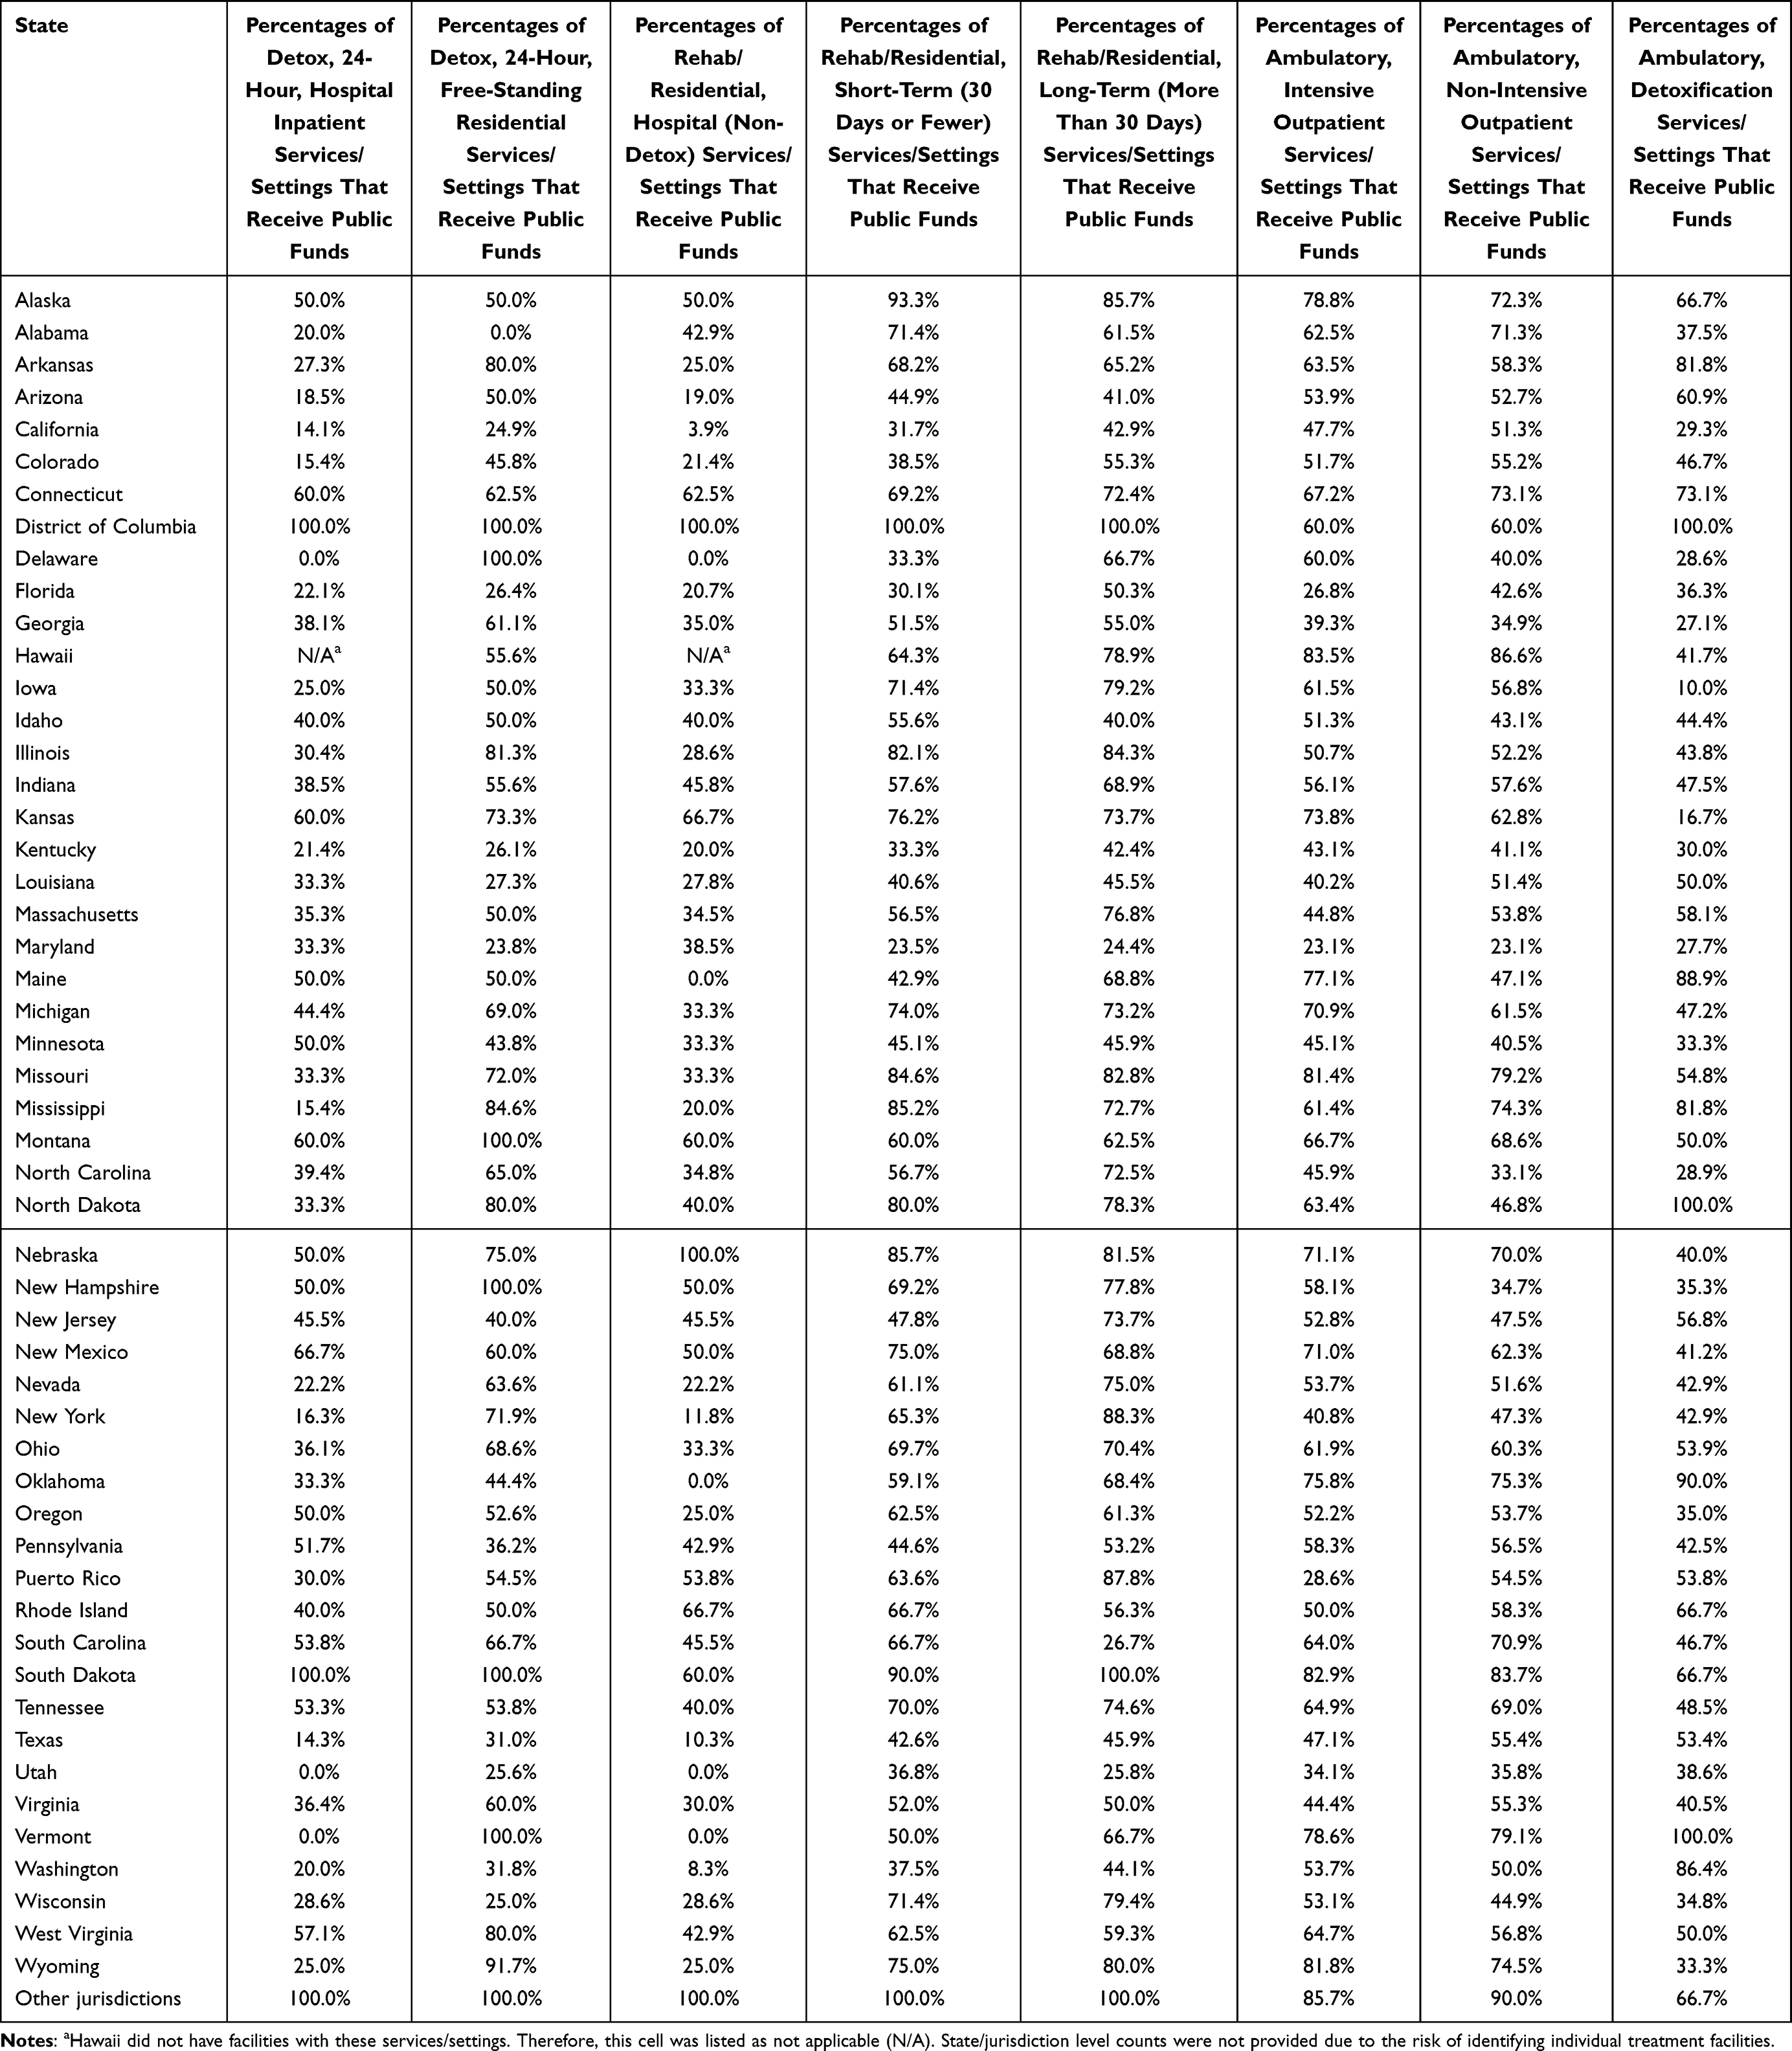 |
Table 2 State- and Jurisdiction-Level Percentages of Facility Treatment Services/Settings That Receive Public Funds |
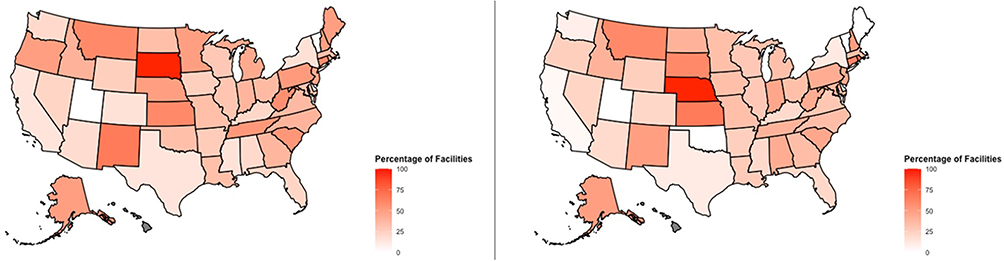 |
Figure 1 Hospital Services/Settings: State Level Proportions of Facilities that Receive Public Funds. Left Panel: Detox, 24-Hour, Hospital Inpatient Services/Settings that Receive Public Funds. Right Panel: Rehab/Residential, Hospital (non-Detox) Services/Settings that Receive Public Funds. |
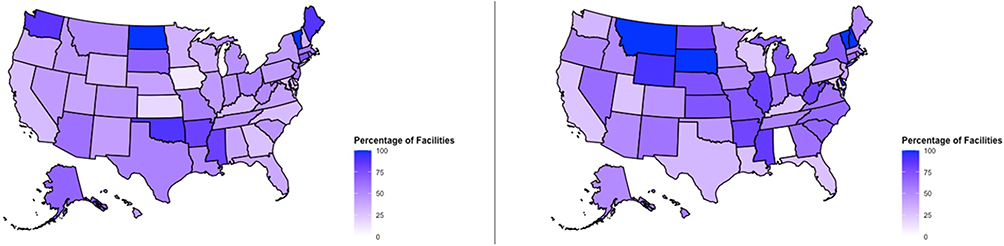 |
Figure 2 Non-Hospital Detoxification Services/Settings: State Level Proportions of Facilities that Receive Public Funds. Left Panel: Ambulatory, Detoxification Services/Settings that Receive Public Funds. Right Panel: Detox, 24-Hour, Free-Standing Residential Services/Settings that Receive Public Funds. |
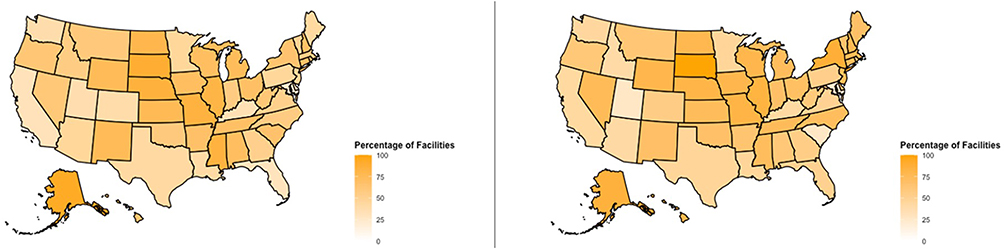 |
Figure 3 Non-Hospital Residential Services/Settings: State Level Proportions of Facilities that Receive Public Funds. Left Panel: Rehab/Residential, Short Term (30 Days or Fewer) Services/Settings that Receive Public Funds. Right Panel: Rehab/Residential, Long Term (More than 30 Days) Services/Settings that Receive Public Funds. |
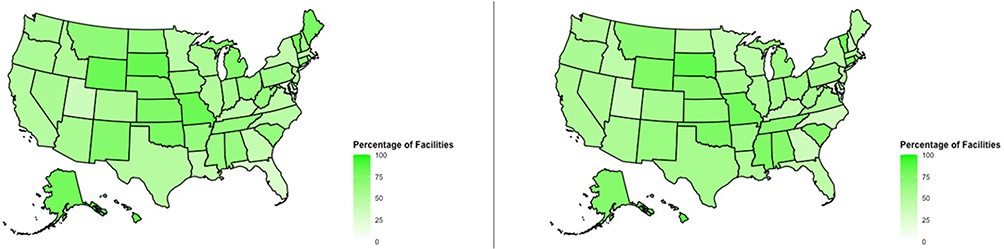 |
Figure 4 Outpatient Services/Settings: State Level Proportions of Facilities that Receive Public Funds. Left Panel: Ambulatory, Intensive Outpatient Services/Settings that Receive Public Funds. Right Panel: Ambulatory, non-Intensive Outpatient Services/Settings that Receive Public Funds. |
Detox, 24-Hour, Hospital Inpatient
Among the full sample of 784 facilities with detox, 24-hour, hospital inpatient services/settings, 30.1% (n = 236) receive public funds. Among the 738 such facilities in states/jurisdictions included in TEDS 2020, 29.8% (n = 220) receive public funds.
Detox, 24-Hour, Free-Standing Residential
Among the full sample of 1412 facilities with detox, 24-hour, free-standing residential services/settings, 42.9% (n = 606) receive public funds. Among the 1337 such facilities in states/jurisdictions included in TEDS-A 2020, 43.2% (n = 577) receive public funds.
Rehab/Residential, Hospital (Non-Detox)
Among the full sample of 658 facilities with rehab/residential, hospital (non-detox) services/settings, 27.1% (n = 178) receive public funds. Among the 622 such facilities in states/jurisdictions included in TEDS-A 2020, 27.0% (n = 168) receive public funds.
Rehab/Residential, Short-Term (30 Days or Fewer)
Among the full sample of 2427 facilities with rehab/residential, short-term (30 days or fewer) services/settings, 49.6% (n = 1203) receive public funds. Among the 2300 such facilities in states/jurisdictions included in TEDS-A 2020, 49.9% (n = 1148) receive public funds.
Rehab/Residential, Long-Term (More Than 30 Days)
Among the full sample of 2972 facilities with rehab/residential, long-term (more than 30 days) services/settings, 58.0% (n = 1725) receive public funds. Among the 2803 such facilities in states/jurisdictions included in TEDS-A 2020, 59.1% (n = 1657) receive public funds.
Ambulatory, Intensive Outpatient
Among the full sample of 7243 facilities with ambulatory, intensive outpatient services/settings, 52.5% (n = 3803) receive public funds. Among the 6385 such facilities in states/jurisdictions included in TEDS-A 2020, 53.5% (n = 3414) receive public funds.
Ambulatory, Non-Intensive Outpatient
Among the full sample of 12,249 facilities with ambulatory, non-intensive outpatient services/settings, 52.6% (n = 6445) receive public funds. Among the 11,037 such facilities in states/jurisdictions included in TEDS-A 2020, 53.6% (n = 5918) receive public funds.
Ambulatory, Detoxification
Among the full sample of 1869 facilities with ambulatory, detoxification services/settings, 44.0% (n = 823) receive public funds. Among the 1718 such facilities in states/jurisdictions included in TEDS-A 2020, 44.4% (n = 763) receive public funds.
Discussion
This study used the N-SSATS 2020 to estimate the proportions of SUD treatment facilities that receive public funds across states and services/settings. Because TEDS only captures sociodemographic and clinical characteristics of treatment episodes of individuals receiving SUD treatment in facilities that receive public funds, these study findings allow for a more precise estimation of interpreting the number of facilities described by TEDS when analyzing data at the state and/or service level. A key finding of this descriptive study is the vast variability of treatment availability across state/jurisdiction and service/setting. For example, of the facilities included in N-SSATS 2020, 0.0% of rehab/residential, hospital (non-detox) services/settings in the state of Delaware receive public funds, whereas 100.0% of the ambulatory, detoxification services/settings in North Dakota receive public funds.
Data presented in this paper provide a guide to interpret service/setting level and state level estimates of facilities that receive public funds. By using data presented in this paper, a researcher examining ambulatory, intensive outpatient services in Montana using TEDS may be able to report that their study findings are generalizable to 66.7% of facilities with this service/setting in the state receiving public funds. Similarly, another research using TEDS to examine rehab/residential, hospital (non-detox) services in Alaska may be able to report that their study findings are generalizable to 50.0% of facilities with this service/setting in the state received public funds. Table 1 provides pertinent details about the proportions of services/settings in specific states that receive public funds.
Findings from this study should also be interpreted in light of some limitations. The findings of this study are estimates, as 88.4% of eligible facilities responded to and were included in SAMHSA’s N-SSATS 2020 dataset. Therefore, this study was unable to determine whether the facilities that were not included in the N-SSATS 2020 dataset received public funds. Future follow-up studies will be needed to examine estimates for each year of cross-sectional TEDS data. Further, future studies are needed to examine annual trends in the estimates of SUD treatment facilities that receive public funds. Despite these limitations, this current study provides a much-needed guide for interpreting the estimated proportions of facilities included in TEDS. Findings from this study, combined with TEDS, will assist advocates, clinicians, policymakers, researchers, service providers, service recipients, and other key stakeholders in reaching a shared goal: improving the well-being of individuals living with substance use disorders.
Acknowledgments
Dr. Jordan Wingate, thank you for your thoughtful edits.
Funding
There is no funding to report.
Disclosure
There are no conflicts of interest to report.
References
1. Substance Abuse and Mental Health Services Administration: Center for Behavioral Health Statistics and Quality. Data from: Treatment Episode Data Set (TEDS) Admissions, 2020. Rockville, MD; 2022.
2. Substance Abuse and Mental Health Services Administration: Center for Behavioral Health Statistics and Quality. Data from: Treatment Episode Data Set (TEDS) Discharges, 2020. Rockville, MD; 2022.
3. Cantor JH, Whaley CM, Stein BD, Powell D. Analysis of substance use disorder treatment admissions in the US by sex and race and ethnicity before and during the COVID-19 pandemic. JAMA Network Open. 2022;5(9):e2232795. doi:10.1001/jamanetworkopen.2022.32795
4. Friesen EL, Kurdyak P. The impact of psychiatric comorbidity on treatment discontinuation among individuals receiving medications for opioid use disorder. Drug Alcohol Depend. 2020;216:108244. doi:10.1016/j.drugalcdep.2020.108244
5. Park E, Ware O, Cheon JH. Medications for opioid use disorder and retention in non-intensive outpatient treatment: the role of payment source. J Social Serv Res. 2023;49(1):54–66. doi:10.1080/01488376.2022.2156972
6. Stahler GJ, Mennis J. The effect of medications for opioid use disorder (MOUD) on residential treatment completion and retention in the US. Drug Alcohol Depend. 2020;212:108067. doi:10.1016/j.drugalcdep.2020.108067
7. Ware OD, Manuel JI, Huhn AS. Adults with opioid and methamphetamine co-use have lower odds of completing short-term residential treatment than Other Opioid Co-use Groups: a Retrospective Health Services Study. Front Psychiatry. 2021;12:784229. doi:10.3389/fpsyt.2021.784229
8. Welsh JW, Sitar SI, Hunter BD, Godley MD, Dennis ML. Substance use severity as a predictor for receiving medication for opioid use disorder among adolescents: an analysis of the 2019 TEDS. Drug Alcohol Depend. 2023;246:109850. doi:10.1016/j.drugalcdep.2023.109850
9. Substance Abuse and Mental Health Services Administration. National Survey of Substance Abuse Treatment Services (N-SSATS): 2020: data on substance abuse treatment facilities. Available from: https://www.samhsa.gov/data/sites/default/files/reports/rpt35313/2020_NSSATS_FINAL.pdf.
10. IBM Corp. IBM SPSS Statistics: version 28.0. Armonk, NY; 2021.
11. R Core Team. R: a language and environment for statistical computing. Available from: https://www.R-project.org/.
12. CRAN. Package usmap. Available from: https://cran.r-project.org/web/packages/usmap/index.html.
 © 2023 The Author(s). This work is published and licensed by Dove Medical Press Limited. The
full terms of this license are available at https://www.dovepress.com/terms
and incorporate the Creative Commons Attribution
- Non Commercial (unported, 3.0) License.
By accessing the work you hereby accept the Terms. Non-commercial uses of the work are permitted
without any further permission from Dove Medical Press Limited, provided the work is properly
attributed. For permission for commercial use of this work, please see paragraphs 4.2 and 5 of our Terms.
© 2023 The Author(s). This work is published and licensed by Dove Medical Press Limited. The
full terms of this license are available at https://www.dovepress.com/terms
and incorporate the Creative Commons Attribution
- Non Commercial (unported, 3.0) License.
By accessing the work you hereby accept the Terms. Non-commercial uses of the work are permitted
without any further permission from Dove Medical Press Limited, provided the work is properly
attributed. For permission for commercial use of this work, please see paragraphs 4.2 and 5 of our Terms.