Back to Journals » OncoTargets and Therapy » Volume 12
STAT gene family mRNA expression and prognostic value in hepatocellular carcinoma
Authors Dong Z, Chen Y, Yang C, Zhang M, Chen A, Yang J, Huang Y
Received 18 January 2019
Accepted for publication 14 August 2019
Published 3 September 2019 Volume 2019:12 Pages 7175—7191
DOI https://doi.org/10.2147/OTT.S202122
Checked for plagiarism Yes
Review by Single anonymous peer review
Peer reviewer comments 2
Editor who approved publication: Prof. Dr. Takuya Aoki
Zhitao Dong1,*, Yi Chen2,*, Cheng Yang1,*, Meng Zhang2, Aixue Chen2, Jiamei Yang1, Yangqing Huang2
1Department of Special Treatment, Shanghai Eastern Hepatobiliary Surgery Hospital, Shanghai, 200438, People’s Republic of China; 2Department of Hepatobiliary Surgery, Shanghai Public Health Clinical Center, Fudan University, Shanghai 200083, People’s Republic of China
*These authors contributed equally to this work
Correspondence: Jiamei Yang
Department of Special Treatment, Shanghai Eastern Hepatobiliary Surgery Hospital, Shanghai 200438, People’s Republic of China
Email [email protected]
Yangqing Huang
Department of Hepatobiliary Surgery, Shanghai Public Health Clinical Center, Fudan University, Shanghai 200083, People’s Republic of China
Email [email protected]
Background: Signal transducer and activator of transcription (STAT) proteins are well-known transcription factors that play an important role in the progression of cancer. However, the association between STAT family genes and hepatocellular carcinoma (HCC) remains unclear. This study investigates the expression level, the prognostic value and the potential mechanism of STAT family genes in HCC.
Methods: Data from 365 HCC patients in The Cancer Genome Atlas (TCGA) database and 241 HCC patients in the Gene Expression Omnibus (GEO) database were used to investigate the diagnostic and prognostic values of STAT genes by survival analysis and nomogram. Gene set enrichment analysis (GSEA) was used to investigate the potential mechanism of the STAT genes in the development of HCC.
Results: Our results showed that STAT4/5B mRNA expression levels in HCC tissues were lower than those in normal tissues. Importantly, our results indicated that high expression of STAT5A, STAT5B and STAT6 was associated with better overall survival in HCC patients. Joint effects analysis of STAT5A, STAT5B and STAT6 suggested that the prognosis difference for any combination of genes was more significant than that for any individual gene. Then, we developed a risk score model could predict HCC prognosis and the nomogram visualized gene expression and clinical factors of probability for HCC prognosis. The ROC and calibration curves showed good performance in survival prediction in both the TCGA and the GEO databases. GSEA suggested that high expression of STAT5A, STAT5B and STAT6 were involved in immune-related biological processes, drug metabolism cytochrome P450, JAK-STAT signalling pathway, and PPAR signalling pathways.
Conclusion: Our data suggest that STAT5A, STAT5B and STAT6 expression may be potential prognostic markers of HCC and, in combination, have a better predictive value for HCC prognosis.
Keywords: hepatocellular carcinoma, signal transducer and activator of transcription, prognosis, TCGA, GSEA
Introduction
Liver cancer is the second leading cause of cancer-related deaths worldwide, with an estimated 782,500 new diagnoses and 745,500 deaths occurring worldwide in 2012.1–3 Approximately 383,000 people die from liver cancer every year in China, accounting for 51% of the deaths from liver cancer worldwide.4 Hepatocellular carcinoma (HCC), the predominant form of liver cancer, can be triggered by a variety of causes, including hepatitis virus infections, alcohol abuse, autoimmune hepatitis, obesity, and several metabolic diseases.1,3,5 Although surgical resection, liver transplantation, percutaneous ablation, targeted therapy, and radiotherapy have been used as clinical treatments, the prognosis of HCC patients remains unsatisfactory due to the high postoperative recurrence rate and metastasis.6 Therefore, the identification of prognostic biomarkers and drug targets is crucial to provide better prognosis and more effective personalized treatments for HCC patients.
Signal transducer and activator of transcription (STAT) proteins are intracellular transcription factors that regulate the expression of genes related to cell cycle, cell survival, and immune response associated with cancer progression.7 Seven STAT family members have been identified as follows: STAT1, STAT2, STAT3, STAT4, STAT5A, STAT5B, and STAT6.8 Some studies have shown that STAT1 and STAT2 activated by IFN play a key role in inhibiting hepatitis C virus (HCV) replication.9 Enhancing activation of these STATs could be an attractive strategy to improve IFN-α therapy for the treatment of HCV. It has been demonstrated that STAT3 is a promising therapeutic target for converting cancer-promoting inflammation to anti-tumour immunity.10 STAT3 has hepatoprotective activities and prevents liver injury-associated HCC initiation during the early stage of chronic liver injury; however, STAT3 also promotes liver tumour cell survival and proliferation when tumour cells have developed during the end-stage of liver cirrhosis and HCC.11,12 Hennighausen Lother, et al found that liver-specific STAT5 knockout mice were more susceptible to chronic CCl4-induced liver fibrosis and HCC development.13 These studies suggested that STAT genes play an important role in the development and progression of HCC. However, the potential application value and mechanism of STAT genes for the prognostic prediction of HCC patients remains unclear.
In this study, the HCC mRNA expression data were downloaded from The Cancer Genome Atlas (TCGA) and Gene Expression Omnibus (GEO) databases. The corresponding clinical information was downloaded from the University of California, Santa Cruz Xena (UCSC Xena) browser. Survival analysis, risk score model, nomogram, and gene set enrichment analysis (GSEA) were used to investigate the prediction value and potential mechanism of STAT genes in HCC prognosis.
Materials and methods
Public database mining of STAT genes
First, the Genotype-Tissue Expression (GTEx) website was used to investigate the mRNA expression distribution of STAT genes in normal organ tissues. Then, we used the Metabolic gEneRApid Visualizer (MERAV) to study the expression distribution of STAT genes between HCC and adjacent normal tissues. Alteration of the status of STAT genes in HCC patients was obtained from the online cBioPortal for Cancer Genomics database.
Then, the level 3 mRNA expression data of HCC was downloaded from The Cancer Genome Atlas (TCGA) database, and the gene expression data were normalized by the edgeR package according to the user guide. The corresponding clinical information was downloaded from the UCSC Xena database, which included race, gender, age, body mass index (BMI), TNM stage, survival time (days), and survival status. In addition, the gene expression dataset (GSE14520) of HCC was also downloaded from the Gene Expression Omnibus (GEO) database. The GSE14520 dataset contained expression profiles generated from [HT_HG-U133A] Affymetrix HT Human Genome U133A and [HT_HG-U133A_2] Affymetrix HT Human Genome U133A_2.0 arrays. To avoid a batch effect, we selected a profile from the former array that had more patients (n=241 HCC patients) than the latter array.
Expression and association analysis
The comparison of STAT gene expression between tumour tissue and adjacent normal tissues was done by an analysis using TCGA and GEO databases, respectively. Pearson correlation coefficient was used to evaluate correlations among genes in coexpression analysis.
Survival analysis
In order to evaluate the prognostic value of a specific gene, the patients were divided into two groups according to the median expression of the gene (high vs low expression) in the TCGA and GEO database, respectively. The median survival time (MST) was used to evaluate the prognosis of HCC patients in TCGA database, whereas overall survival (OS) and recurrence‐free survival (RFS) were used to assess that of patients in the GEO database. Survival analysis was carried out using the Kaplan–Meier method with the log-rank test to compare clinical factors and gene expression groups. Univariate and multivariate Cox proportional hazards regression analysis was conducted to further calculate the crude or adjusted hazard ratio (HR), 95% confidence interval (CI) and P-value. In addition, clinical characteristics of HCC patients were also analysed by Kaplan–Meier method in TCGA and GEO database, respectively.
Joint effects analysis of STAT5A, STAT5B, and STAT6
On the basis of the results of survival analysis, we also investigated the joint effects of significant prognostic-related STAT genes in HCC. Joint effects analysis was conducted with the following combinations: (1) STAT5A and STAT5B; (2) STAT5A and STAT6; (3) STAT5B and STAT6; and (4) STAT5A, STAT5B, and STAT6. The combinations of STAT5A and STAT5B were composed of four groups as follows: group 1 (low STAT5A and low STAT5B expression), group 2 (low STAT5A and high STAT5B expression), group 3 (high STAT5A and low STAT5B expression), and group 4 (high STAT5A and high STAT5B expression).
The combinations of STAT5A and STAT6 were composed of four groups as follows: group I (low STAT5A and low STAT6 expression), group II (low STAT5A and high STAT6 expression), group III (high STAT5A and low STAT6 expression), and group IV (high STAT5A and high STAT6 expression).
The combinations of STAT5B and STAT6 were composed of four groups as follows: group a (low STAT5B and low STAT6 expression), group b (low STAT5B and high STAT6 expression), group c (high STAT5B and low STAT6 expression), and group d (high STAT5B and high STAT6 expression).
The combinations of STAT5A, STAT5B and STAT6 were composed of four groups as follows: group A (low STAT5A, low STAT5B, and low STAT6 expression); group B (high STAT5A, low STAT5B, and low STAT6 expression; low STAT5A, high STAT5B, and low STAT6 expression; and low STAT5A, low STAT5B, and high STAT6 expression); group C (high STAT5A, high STAT5B, and low STAT6 expression; high STAT5A, low STAT5B, and high STAT6 expression; and low STAT5A, high STAT5B, and high STAT6 expression); and group D (high STAT5A, high STAT5B, and high STAT6 expression).
Construction of risk score model and nomogram
A risk score model was constructed based on the expression levels of prognosis-associated genes and the contribution coefficient (β) of the multivariate Cox proportional hazards regression model. The formula of the model was as follows: risk score = expression of STAT5A×β of STAT5A + expression of STAT5B×β of STAT5B + expression of STAT6×β of STAT6. The risk score was then divided into high and low risk groups with the optimal cut-off value of gene expression. The time-dependent receiver operating characteristic (ROC) curve was drawn to evaluate the predictive value of the prognostic gene signature for overall survival. The Kaplan–Meier survival curve combined with a log-rank test was used to predict patient survival in the high- and low-risk group.
Nomogram is widely applied to predict cancer patients’ prognoses. The nomogram was developed by the rms R package to assess the probability of the 3-, and 5-year OS rates for HCC patients, which was based on prognostic clinical indicators and prognostic-related STAT genes. Validation of the nomogram was assessed by discrimination and calibration. The discrimination of the nomogram was calculated using the concordance index (C-index) by a bootstrap method with 500 resamples. The calibration curve of the nomogram was evaluated graphically by plotting the nomogram prediction probabilities against the observed rates. Overlapping with the reference line demonstrated that the model was in perfect agreement.
Gene set enrichment analysis (GSEA)
Differences of biological process and pathways in transcriptome levels between high and low STAT5A, STAT5B and STAT6 genes expression were analysed using GSEA, with reference to gene sets from the Molecular Signatures Database (MSigDB) of GO gene sets and KEGG gene sets, respectively. The number of permutations was set at 1,000. Enrichment results satisfying a nominal P-value <0.05 and a false discovery rate (FDR) <0.25 were considered statistically significant.
Statistical analysis
Kaplan-Meier survival analysis by log rank test was used to calculate the median survival time (MST). Univariate and multivariate Cox proportional hazards models were used to calculate the HR and 95% CI. Statistical analyses were performed using R software v3.5.0 (R Foundation for Statistical Computing, Vienna, Austria) and GraphPad Prism v7.00 (GraphPad Software Inc., USA). P<0.05 was considered statistically significant.
Results
Public database mining of STAT genes
To make a complete analysis of the distribution and function of STAT genes in humans, the distribution of STAT genes in human normal organ tissues was investigated by GTEx. As shown in Figure 1A–G, the results suggested that the expression level of STAT1-6 genes was median in human liver tissues compared to other organ tissues. Then, the MERAV database showed that STAT1 and STAT5B were upregulated in liver tumour tissue, whereas STAT2, STAT3, STAT4, STAT5A, and STAT6 were downregulated in tumour tissue (Figure 2A–G). Furthermore, the protein expression of STAT genes obtained similar results by using clinical specimens from the Human Protein Profiles (Figure 2H). Finally, we investigated the alteration percentage of STAT1-6 genes in HCC patients using the cBioPortal website (Figure 2I). The alteration percentage of the STAT genes signature in HCC varied from 2.9 to 13% (STAT1, 4%; STAT2, 6%; STAT3, 7%; STAT4, 6%; STAT5A, 2.9%; STAT5B, 13%; and STAT6, 7%).
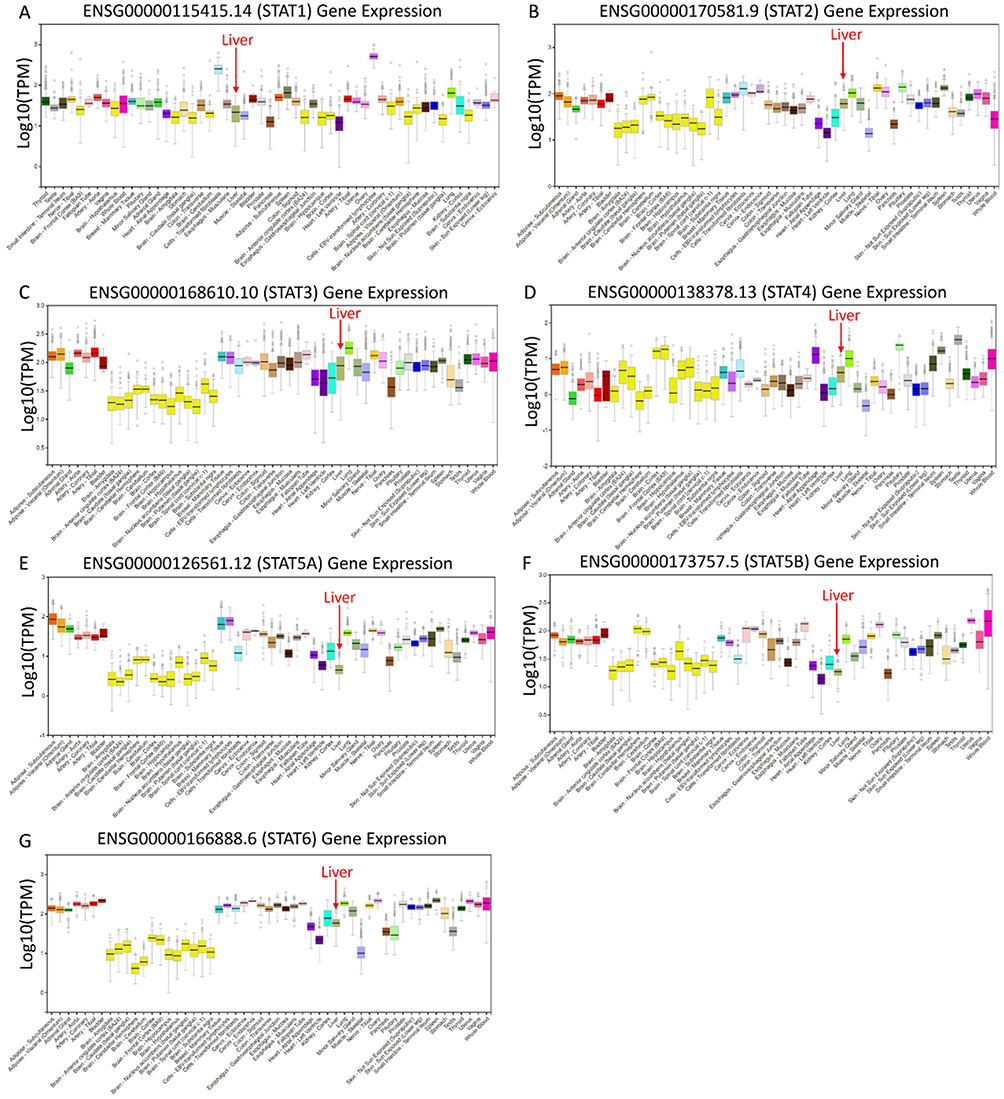 |
Figure 1 Expression distribution of STAT1-6 genes in human normal organ tissues. (A) STAT1; (B) STAT2; (C) STAT3; (D) STAT4; (E) STAT5A; (F) STAT5B; (G) STAT6. |
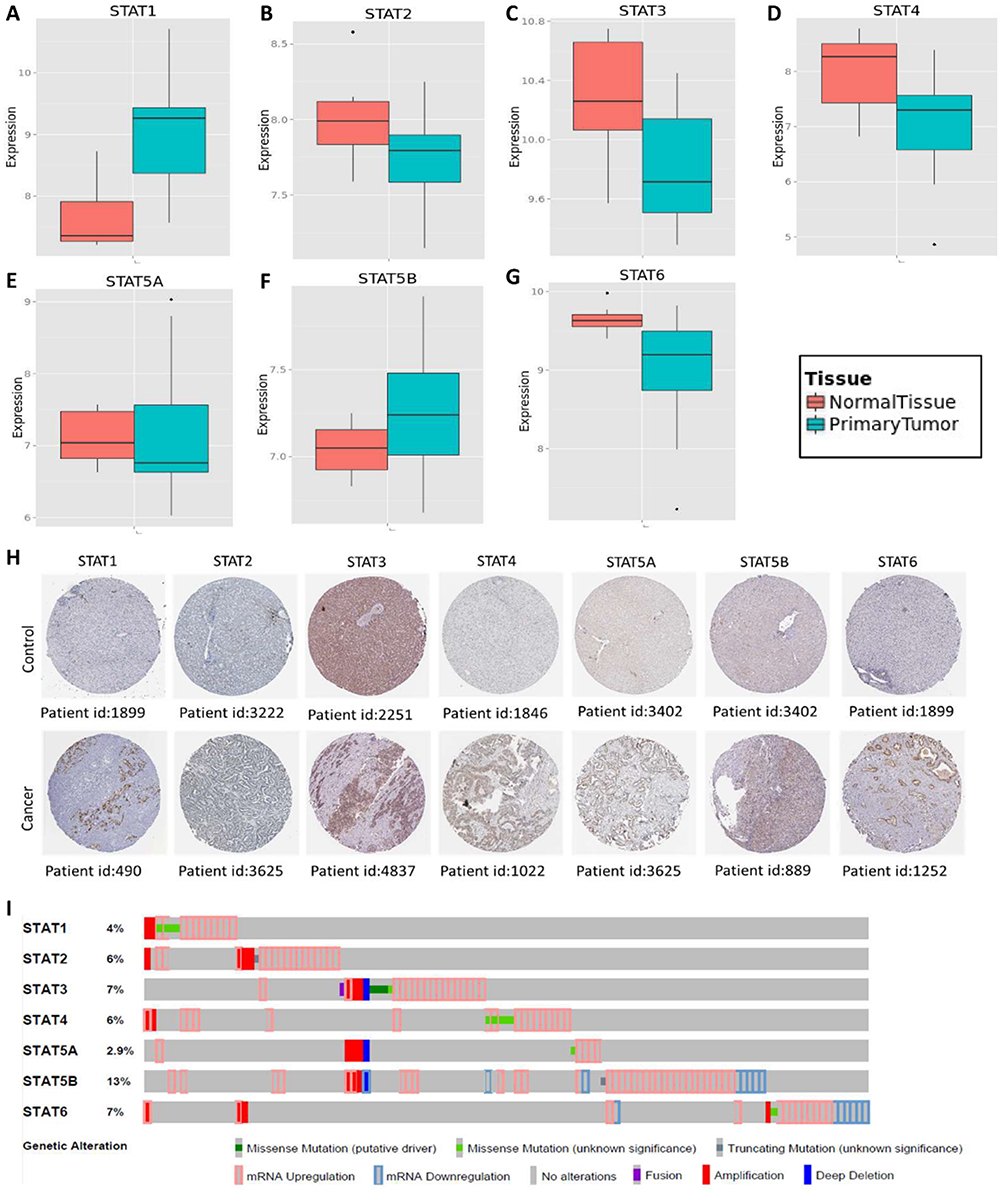 |
Figure 2 Gene expression and genetic alteration of STAT genes in HCC. (A–G) Comparison of STAT1, STAT2, STAT3, STAT4, STAT5A, STAT5B and STAT6 mRNA expression in HCC and normal tissues using MERAV; (H) The protein expression of STAT genes in HCC using human protein atlas database; (I) Alteration frequency analysis of STAT genes in HCC using cBioPortal. |
Analysis of the expression of STAT genes and correlation in TCGA and GEO databases
To better understand the expression and clinical significance of STAT genes in HCC, the RNA-Seq dataset of HCC was downloaded from TCGA and GEO databases. After normalization of the RNA sequencing data, we found that the expression level of STAT3, STAT4 and STAT5B were significantly lower in HCC tumour tissue than in normal tissue, but the differences in expression in the other genes did not reach statistical significance in the TCGA database (Figure 3A). As shown in Figure 3B, the expression levels of STAT4, STAT5A, STAT5B, and STAT6 were significantly lower in HCC tissue than in non-tumour tissue. In addition, the Pearson correlation coefficients of the seven STAT genes were also calculated. In the TCGA database, STAT5B was negatively correlated with STAT1 (r=−0.10, P<0.05) and STAT4 (r=−0.20, P<0.05), but not significantly associated with STAT5A (r=−0.03, P>0.05). The other genes were positively and significantly correlated with each other (all P<0.05, Figure 3C). In the GEO database, STAT5A (r=0.05, P<0.05) and STAT5B ((r=0.31, P<0.05)) had a significantly positive correlation with STAT6 (Figure 3D).
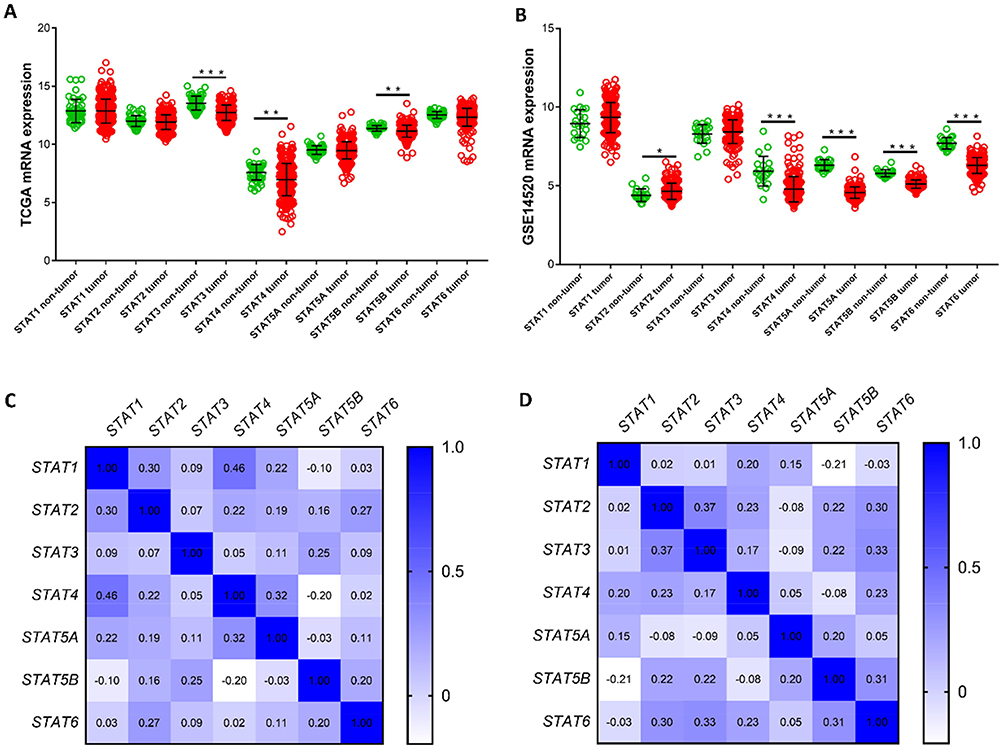 |
Figure 3 Gene expression distribution and coexpression heat map of STAT genes in the TCGA and GEO dataset. (A–B) Distribution of STAT genes expression between tumour tissue and adjacent normal tissue using the TCGA and GEO dataset, respectively. (C–D) Coexpression heat map of STAT genes in HCC tissue using the TCGA and GEO dataset, respectively. *P<0.05, **P<0.01 and ***P<0.001. |
Survival analysis of STAT genes in TCGA and GEO databases
he clinical characteristics of HCC patients in the TCGA and GEO databases are summarized in Tables 1 and 2, respectively. As shown in Table 1, we found that tumour stage, and TNM stage were significantly associated with MST (P<0.05). In the GEO database, tumour size, cirrhosis, TNM stage, BCLC stage, and AFP level were related to OS (all P<0.05), while gender, TNM stage, and BCLC stage were related to RFS (all P<0.05). Furthermore, we analysed the relationship between STAT genes and the OS of HCC patients. The prognostic-related characteristics in the TCGA database were analysed by univariate and multivariate Cox regression analysis, and the results revealed that low expression of STAT5A (P=0.009, HR=1.60, 95% CI=1.13–2.27), STAT5B (P=0.006, HR=1.64, 95% CI=1.15–2.33) and STAT6 (P=0.007, HR=1.61, 95% CI=1.14–2.29) were significantly associated with a significantly increased risk of death (Table 3). Cox regression model adjusted for prognostic-related characteristics in the GEO database showed that low expression of STAT1 (P=0.047, HR=1.55, 95% CI=1.01–2.38), STAT5A (P=0.011, HR=1.76, 95% CI=1.14–2.72), STAT5B (P=0.015, HR=1.71, 95% CI=1.11–2.64) and STAT6 (P=0.041, HR=1.57, 95% CI=1.02–2.43) was significantly associated with OS (Table 4). In addition, Kaplan-Meier survival curves of STAT genes in the TCGA database are presented in Figure 4A–G, and survival curves of these genes in the GEO database are shown in Figure 4H–N.
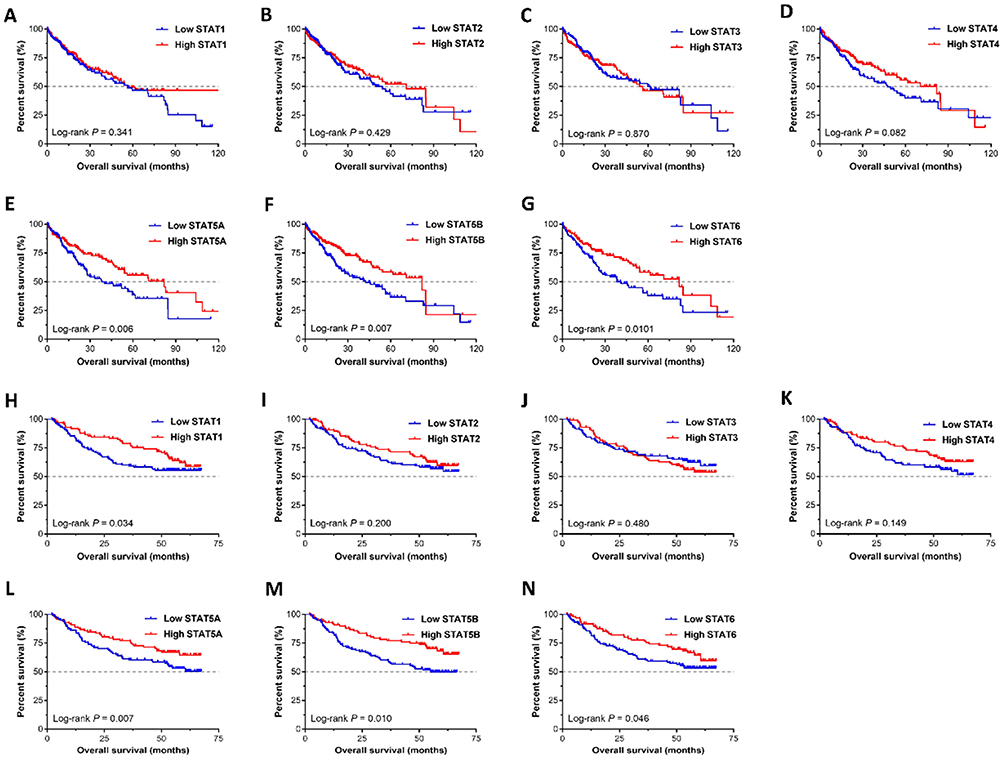 |
Figure 4 Survival analysis of STAT genes in HCC. (A–G) Kaplan-Meier survival curves of the STAT1, STAT2, STAT3, STAT4, STAT5A, STAT5B, and STAT6 in the TCGA database; (H–N) Kaplan-Meier survival curves of the STAT1, STAT2, STAT3, STAT4, STAT5A, STAT5B, and STAT6 in the GEO database. |
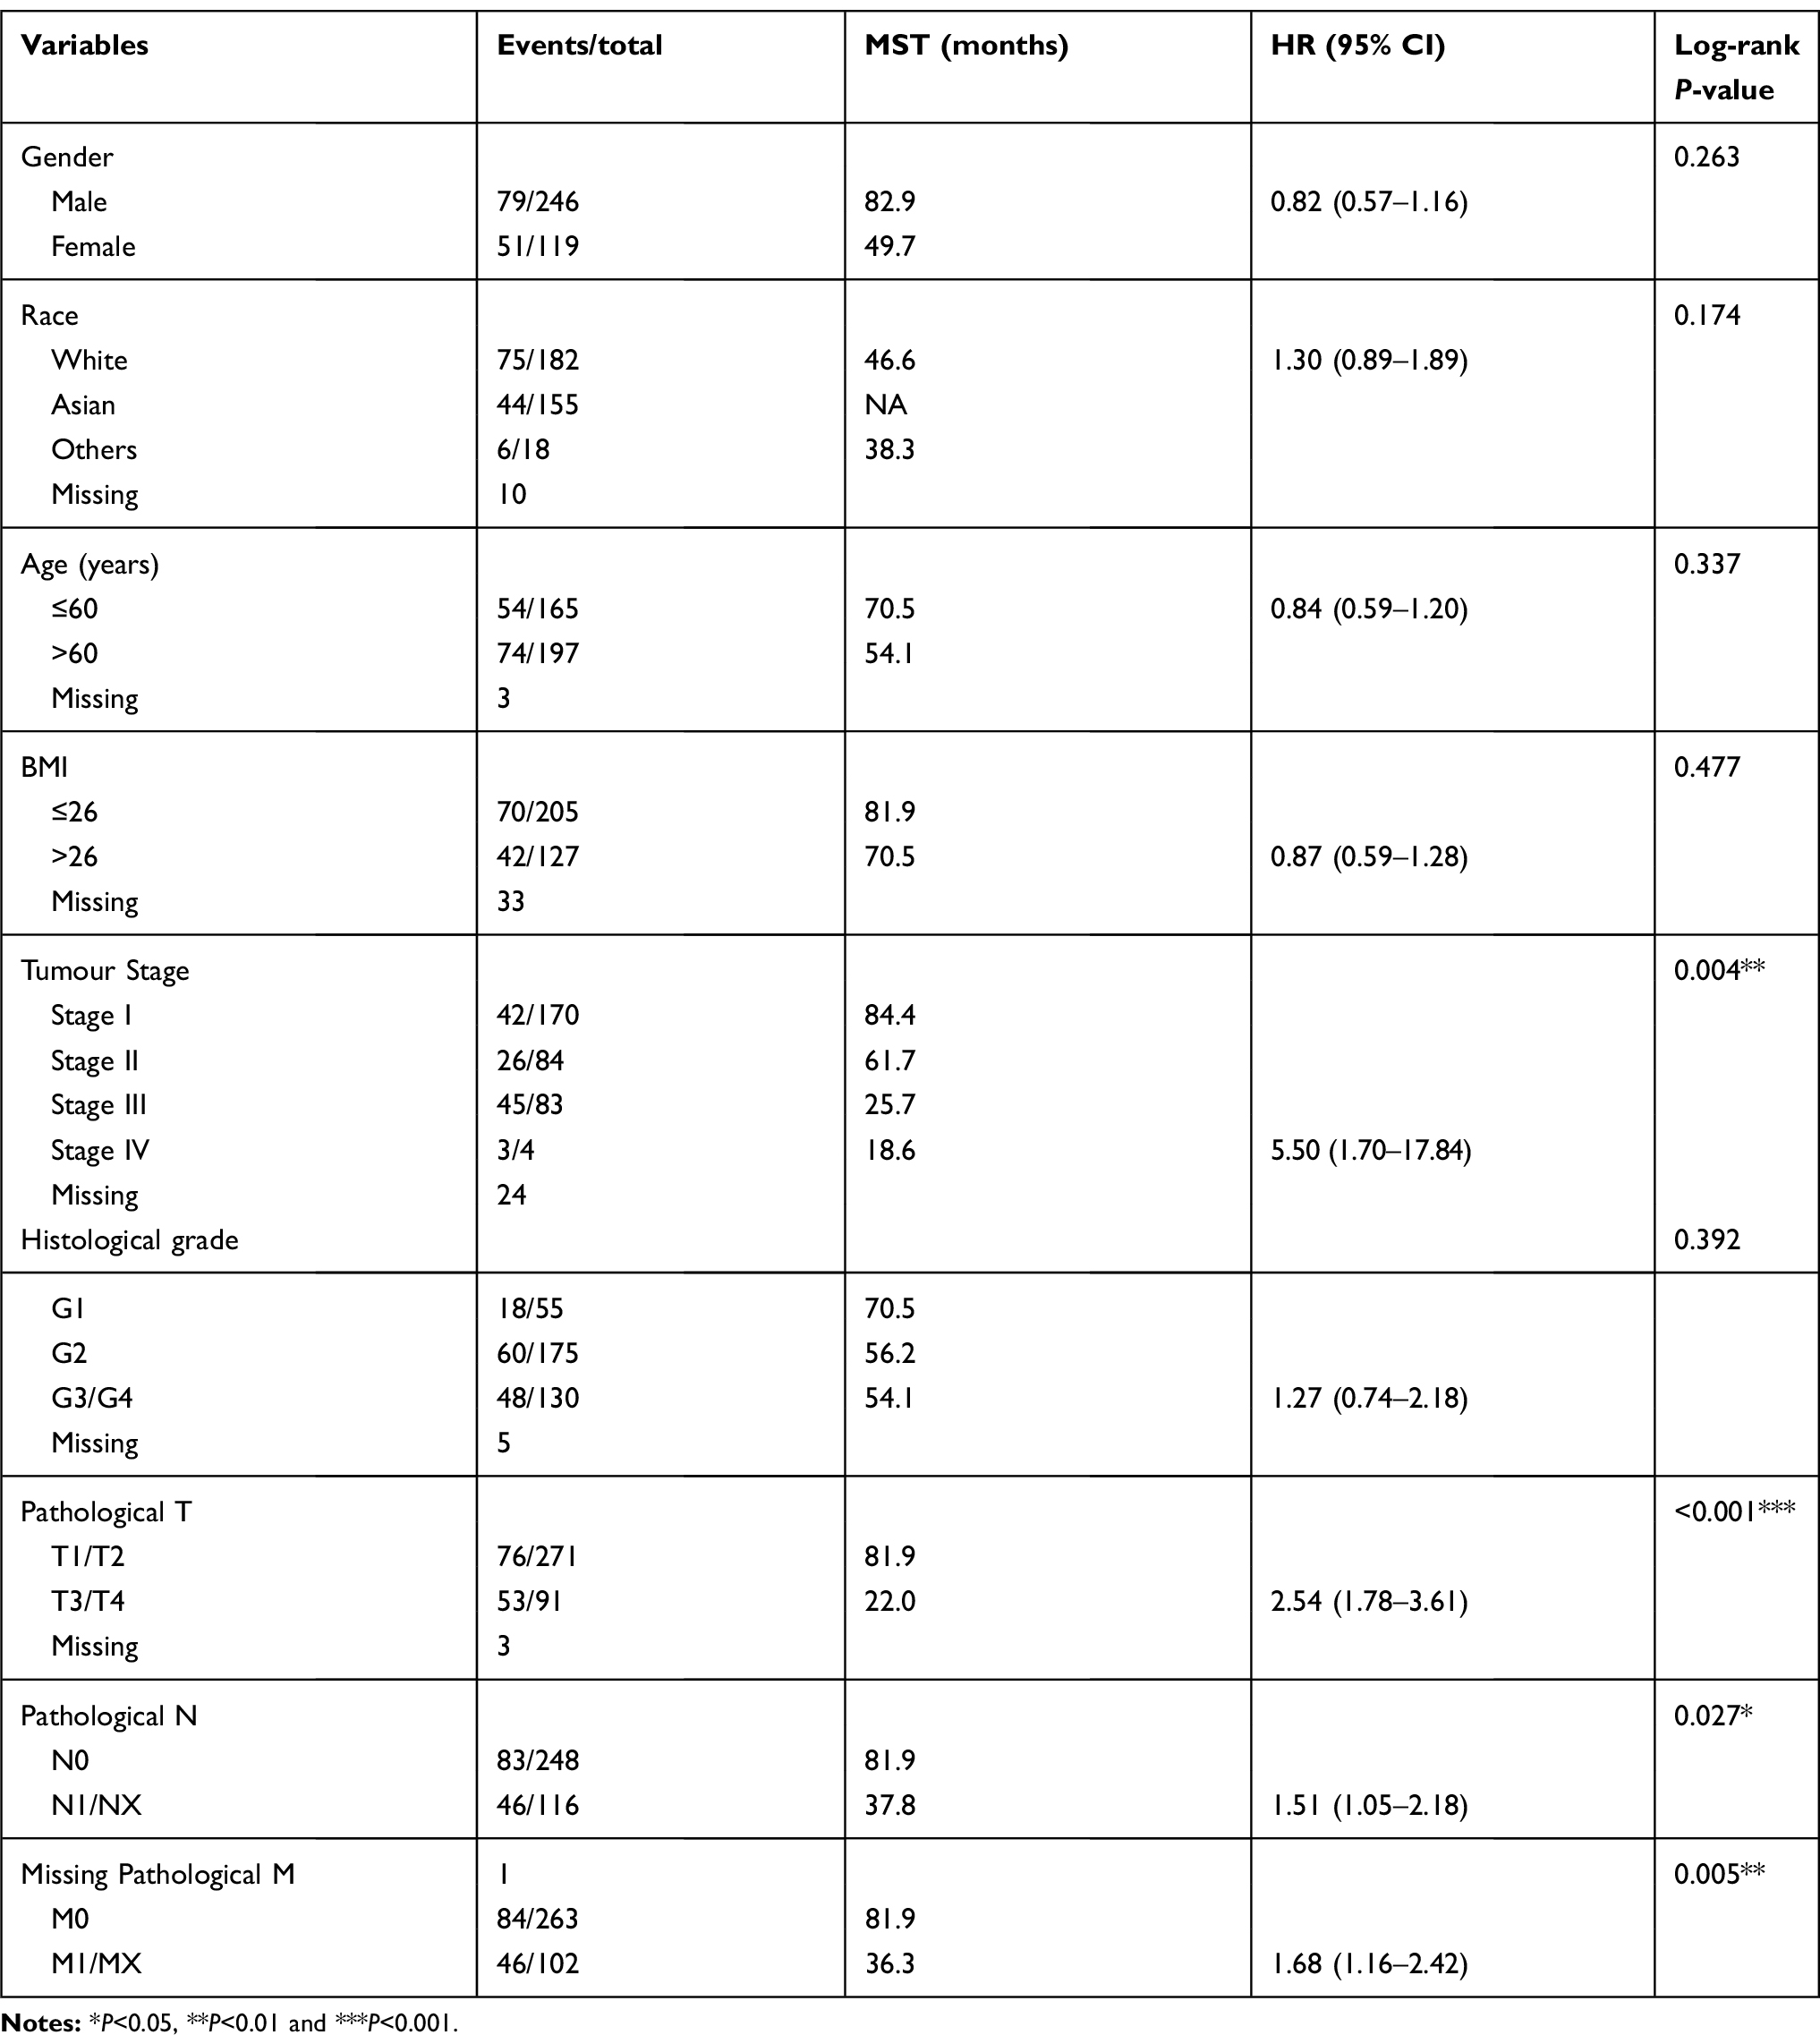 |
Table 1 Clinical characteristics of 365 HCC patients in TCGA database |
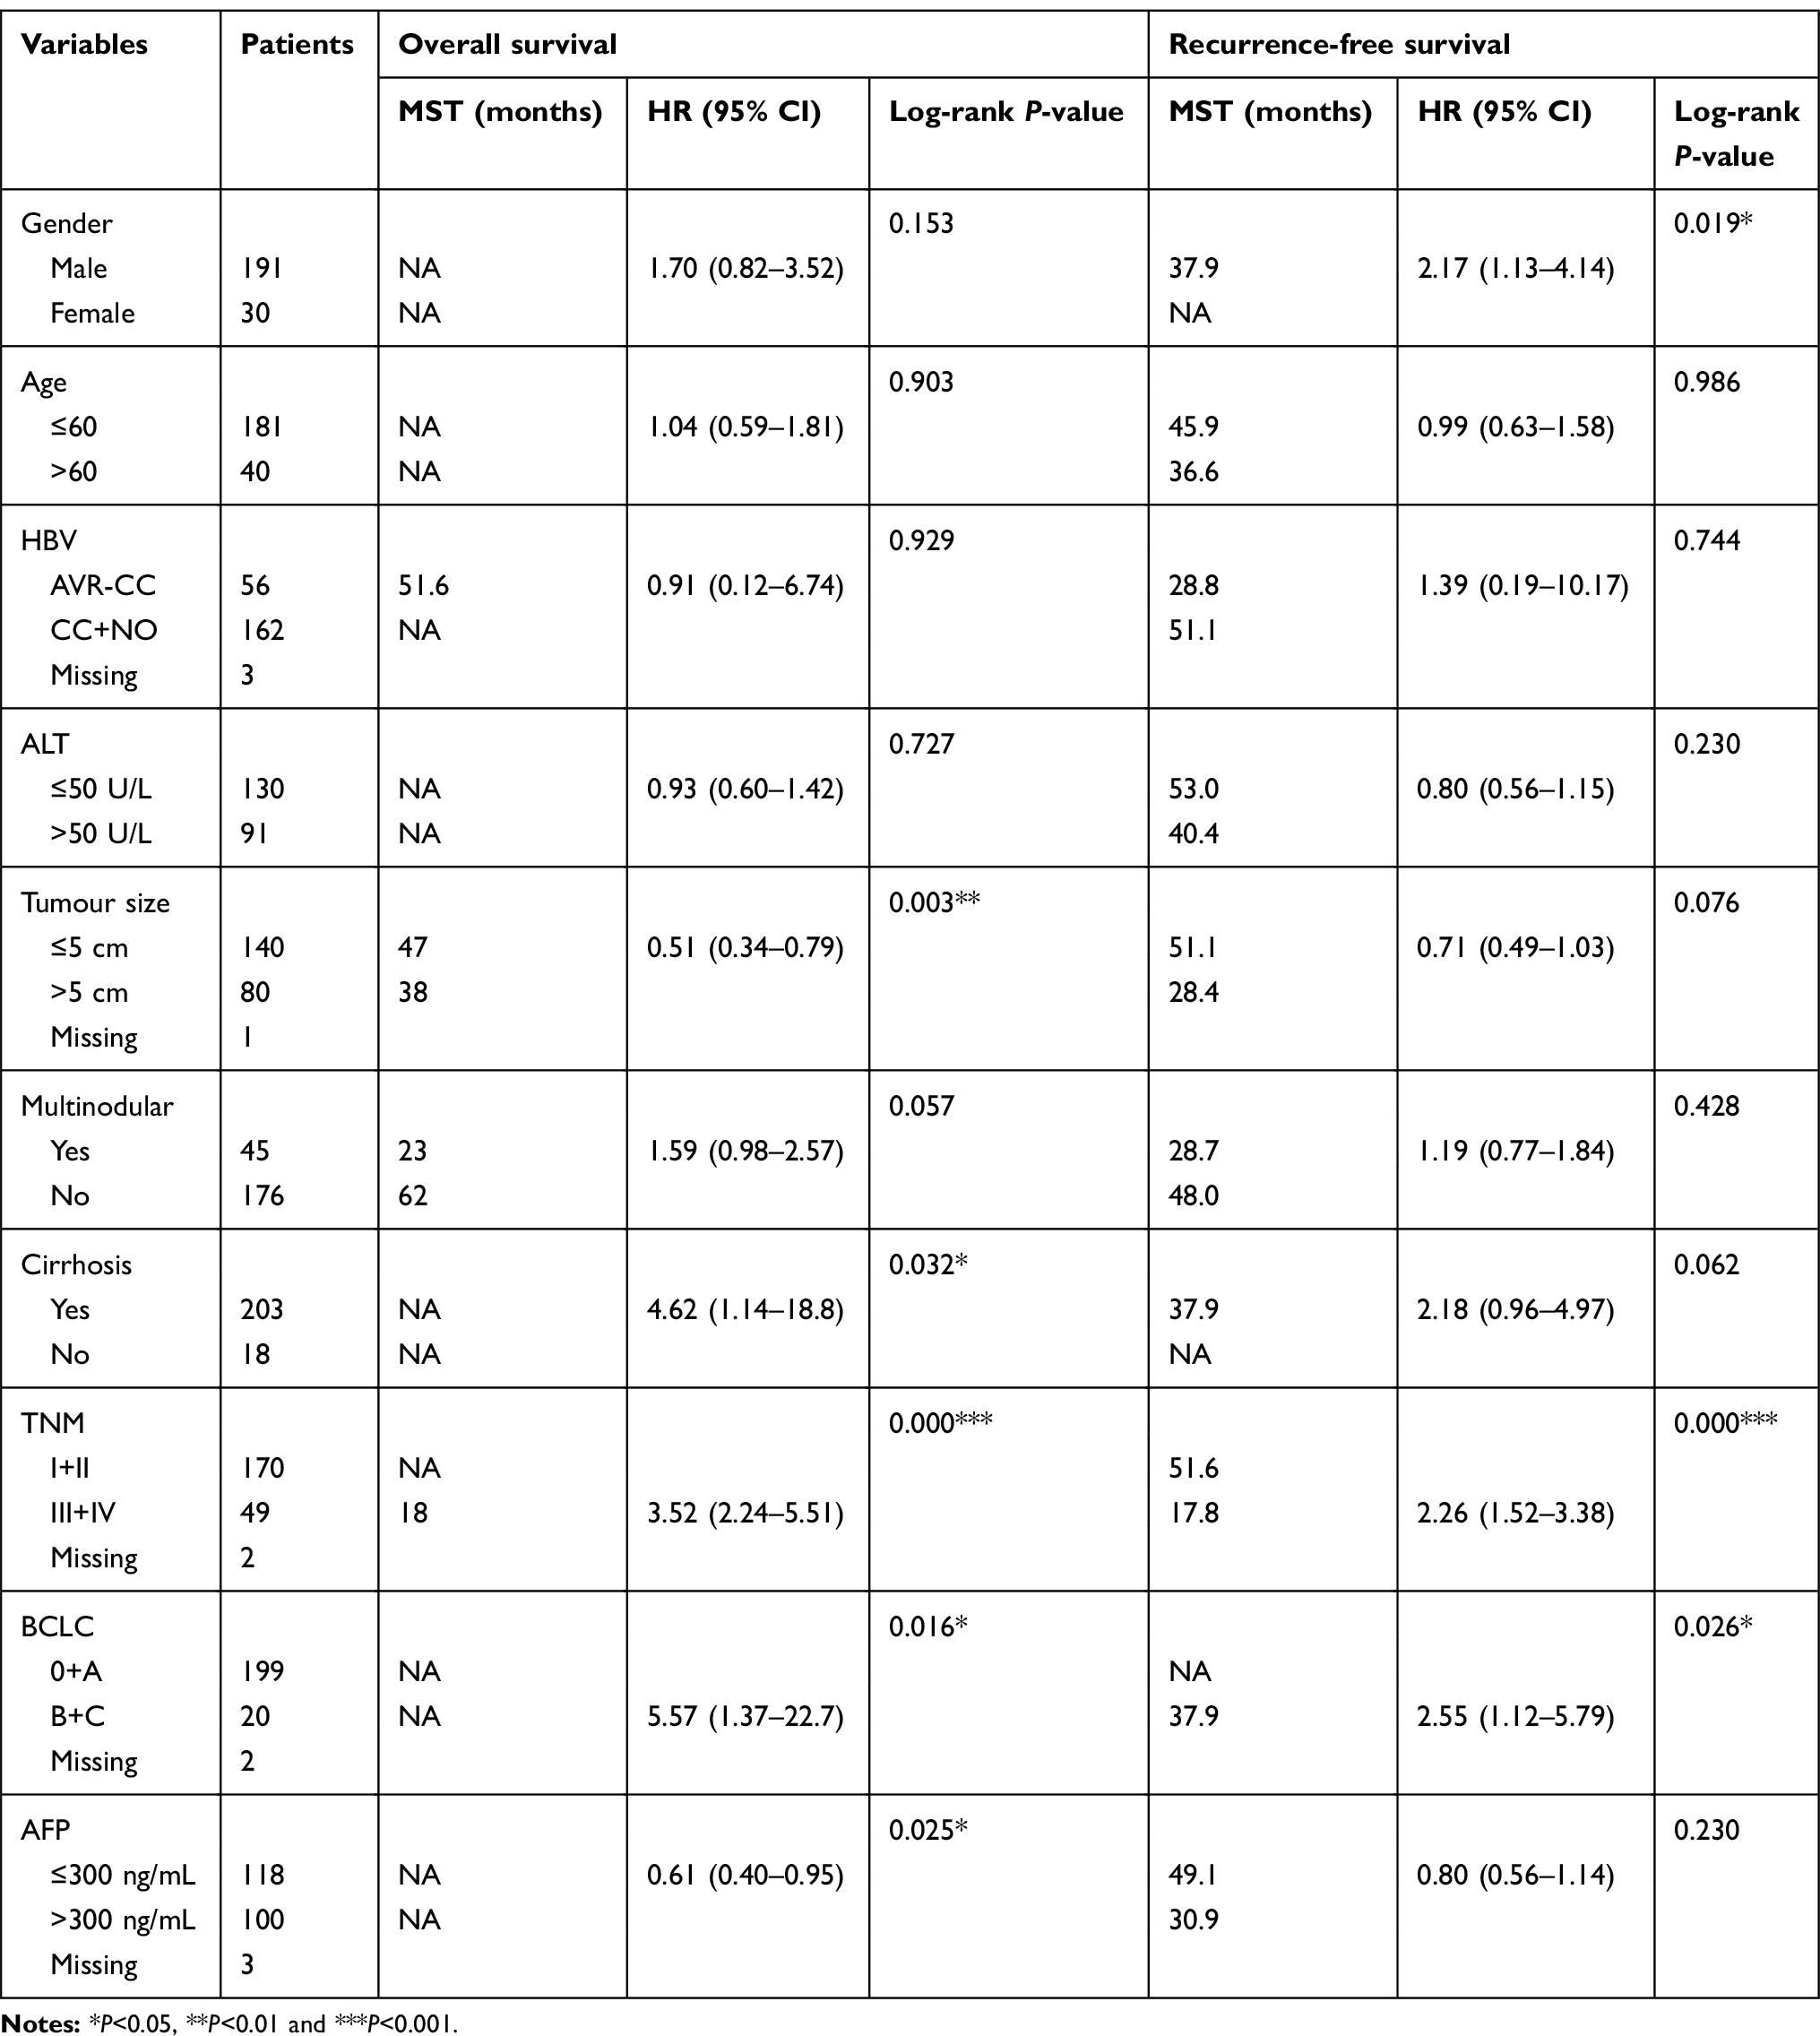 |
Table 2 Clinical characteristics of 241 HCC patients in GEO database |
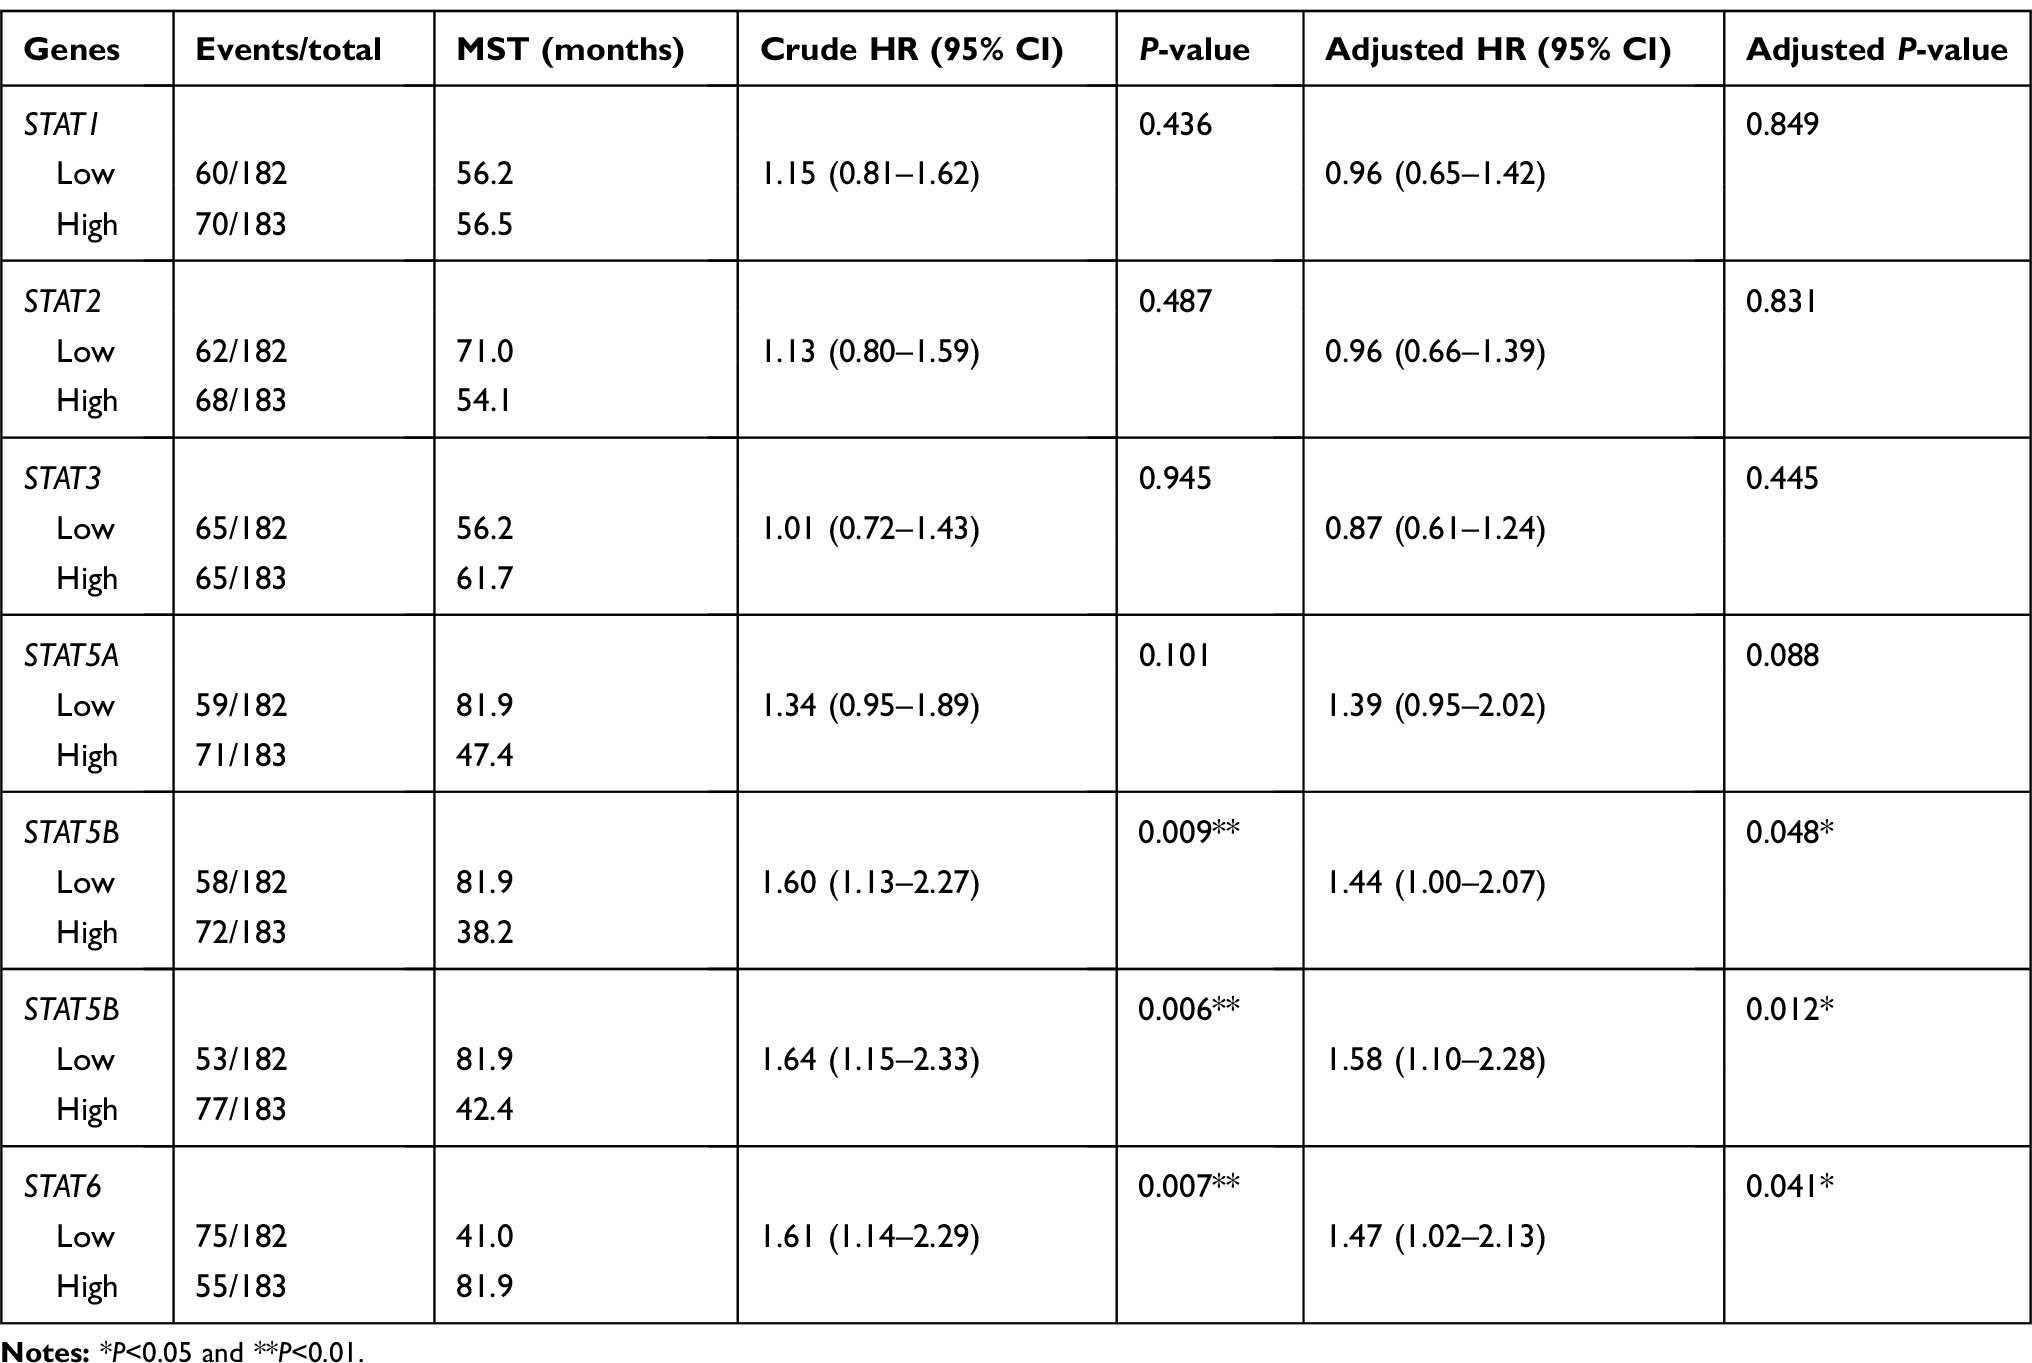 |
Table 3 Prognostic survival analysis of STATs genes and HCC patients in TCGA database |
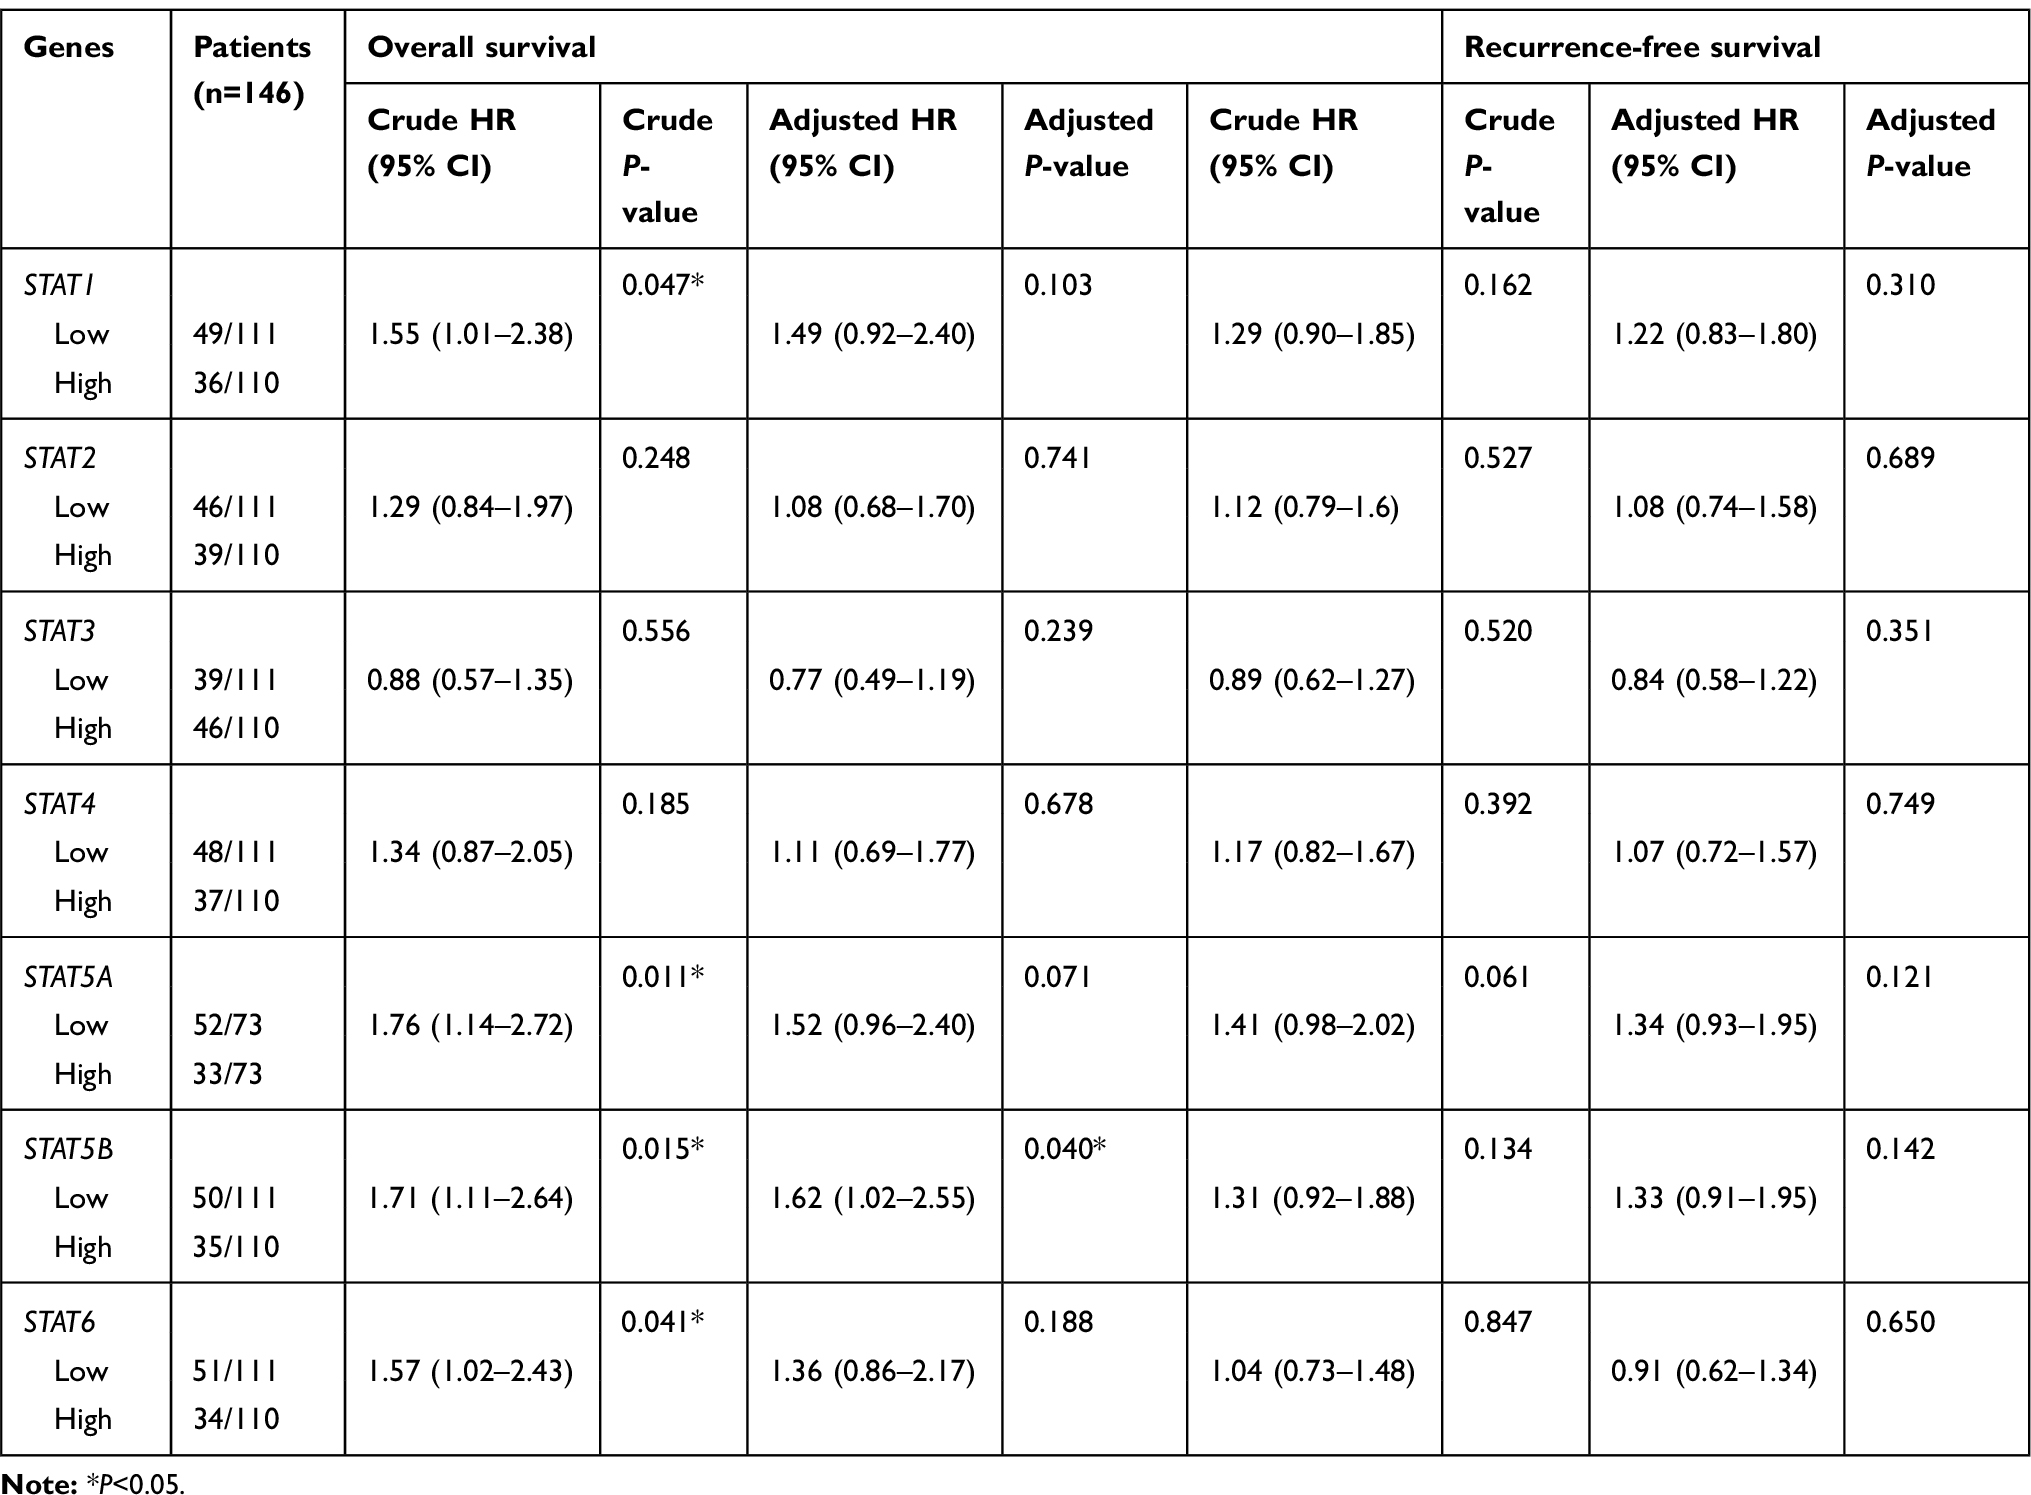 |
Table 4 Prognostic survival analysis of STATs genes and HCC patients in GEO database |
Joint effects analysis of STAT5A, STAT5B and STAT6 genes
We further investigated the joint effects of STAT5A, STAT5B and STAT6 in the prediction of HCC patient prognosis. In the TCGA database, joint effects analysis of the STAT5A and STAT5B combinations showed that group 1 (low STAT5A and low STAT5B expression) and group 2 (low STAT5A and high STAT5B expression) were associated with a significantly increased risk of death in HCC compared to group 4 (high STAT5A and high STAT5B expression; Figure 5A). Meanwhile, analysis of the STAT5A and STAT6 combinations showed that MST was best in group IV (high STAT5A and high STAT6 expression; 81.9 months; P=0.001; Figure 5B) and that of the STAT5B and STAT6 combinations showed the poorest MST in group a (low STAT5B and low STAT6 expression; 38.3 months; P<0.001) and the best MST in group c (high STAT5B and low STAT6 expression; 54.1 months; P<0.001; Figure 5C). Finally, joint effects analysis of the STAT5A, STAT5B, and STAT6 combinations showed that MST was poorest in group B (high STAT5A, low STAT5B, and low STAT6 expression; low STAT5A, high STAT5B, and low STAT6 expression; and low STAT5A, low STAT5B, and high STAT6 expression; 27.9 months; P<0.001) and best in group C (high STAT5A, high STAT5B, and low STAT6 expression; high STAT5A, low STAT5B, and high STAT6 expression; and low STAT5A, high STAT5B, and high STAT6 expression; 82.9 months; P<0.001; Figure 5D). Surprisingly, the MST could not be determined for group D, which contained the best factors for patients, possibly due to the sample size in our study was relatively small. In addition, similar results were obtained in the GEO database (Figure 5E–H). Our joint effects analysis of three STAT genes as prognostic markers suggested that the prognosis difference for any marker combination was more significant than that for any individual marker.
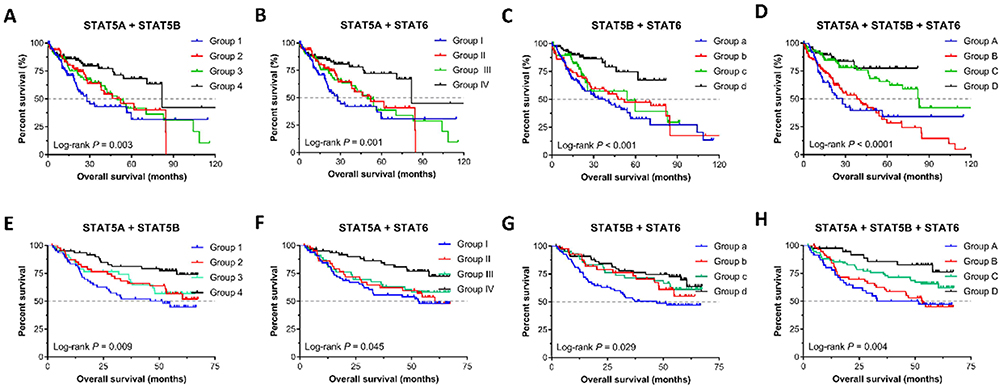 |
Figure 5 Kaplan-Meier survival curves for joint effects analysis among STAT5A, STAT5B, and STAT6 in HCC. (A–D) Joint effects analysis of STAT5A, STAT5B, and STAT6 in the TCGA database; (E–F) Joint effects analysis of STAT5A, STAT5B, and STAT6 in the GEO database. |
Construction of a prognostic gene signature based on STAT5A, STAT5B and STAT6 genes
A prognostic gene signature model was constructed based on STAT5A, STAT5B and STAT6, which contained risk score ranking, survival status and heat maps of gene expressions (Figure 6A). Time-dependent ROC and Kaplan–Meier curve were used to assess the prognostic values of the model. The AUCs (Area under the ROC curve) for 1-year, 3-year, and 5-year OS were 0.586, 0.671, 0.697, respectively (Figure 6B). Patients in the high-risk group shown significantly poorer OS than patients in the low-risk group (P = 0.001) (Figure 6C). To validate the predictive value of the model, we calculated risk score with the same formula for patients in GSE14520 (Figure 6D). Consistent with the results in the TCGA cohort, patients in the high-risk group shown significantly poorer OS than patients in the low-risk group (P = 0.009; Figure 6E). The AUCs for 1-year, 3-year, and 5-year OS were 0.678, 0.643, and 0.633, respectively (Figure 6F). Collectively, our results indicated a good performance of the prognostic gene signature for HCC survival prediction.
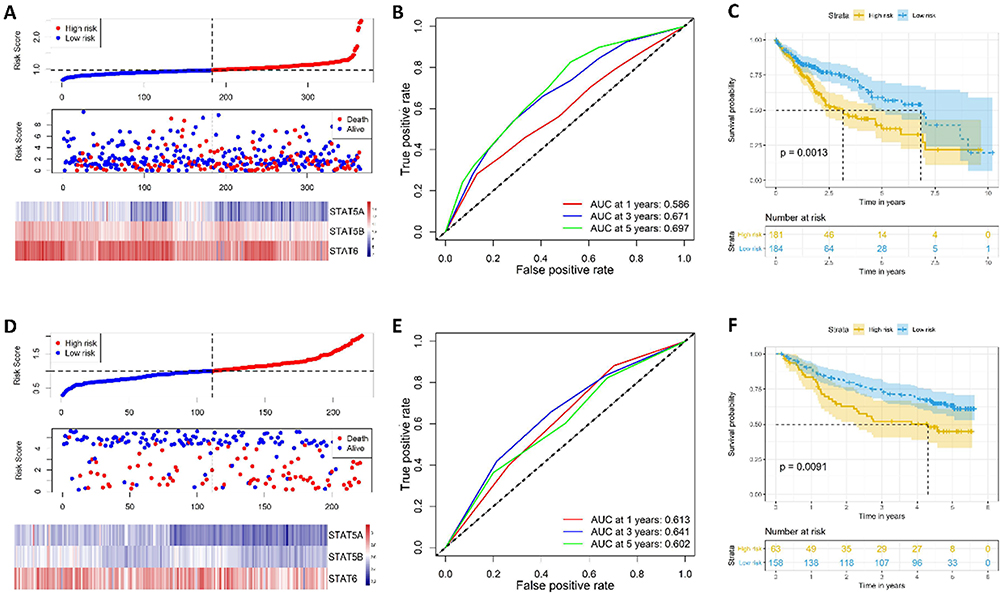 |
Figure 6 Risk score model, time-dependent ROC analysis, and survival analysis for the STAT5A, STAT5B and STAT6 signature in HCC. (A–C) Risk score model, time-dependent ROC analysis, and survival analysis in the TCGA database, respectively. (D–F) Risk score model, time-dependent ROC analysis, and survival analysis in GSE14520 cohort, respectively. |
Construction of a predictive nomogram based on STAT5A, STAT5B and STAT6 genes
We then built a nomogram to predict 3-year, and 5-year OS for HCC patients. The prognostic nomograms were developed based on STAT5A, STAT5B, STAT6, and independent prognostic factors in the TCGA database and GEO database, respectively (Figure 7A–B). The C-index of TCGA database and GEO database were 0.65 (95% CI, 0.59–0.71) and 0.71 (95% CI, 0.65–0.76), respectively. The calibration plot for the probability of survival at 3 and 5 years showed good agreement between the prediction by nomogram and actual observations (Figure 7C–F). These findings demonstrated that the nomogram based on STAT genes is a good nomogram for predicting survival for HCC patients.
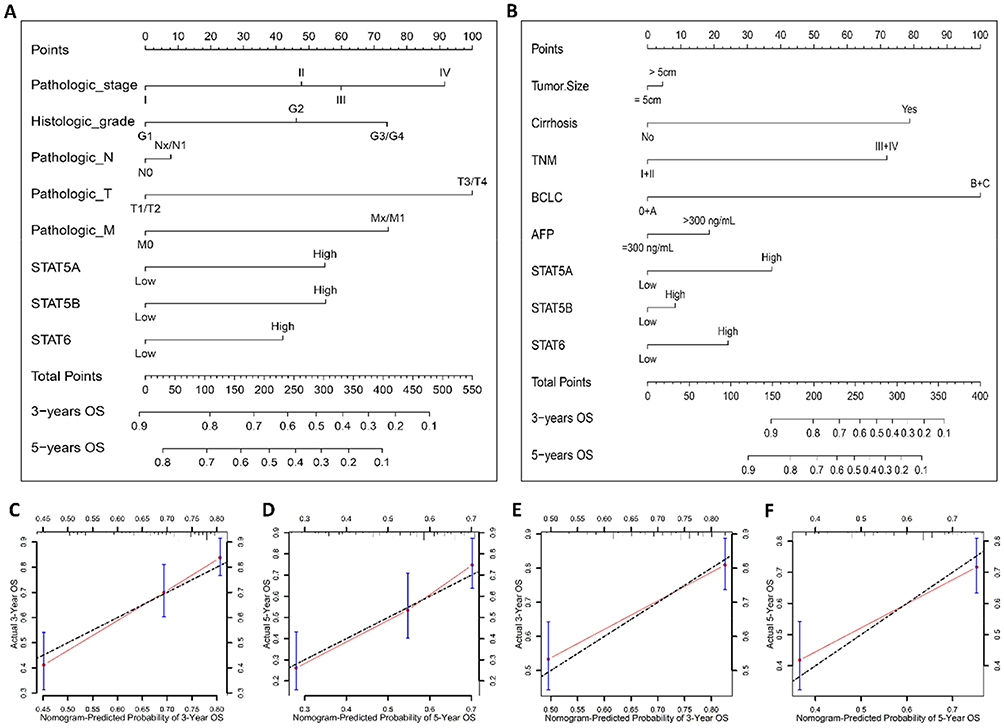 |
Figure 7 Nomogram for predicting HCC patient overall survival with STAT5A, STAT5B and STAT6 and clinical information. (A–B) Nomogram to predict the 3-, and 5-year overall survival in the TCGA database and GSE14520 cohort, respectively. (C–F) The calibration curve of overall survival at 3, and 5 years for HCC patient in the TCGA database and GSE14520 cohort, respectively. |
GSEA investigation of STAT genes in HCC
To further explore the potential mechanism of STAT5A, STAT5B and STAT6 in HCC, we also developed a single-gene GSEA to investigate potential biological processes and pathways. The enrichment of c5 suggested that high expression of STAT5A may be involved in biologic processes, such as activation immune response, immune effector process, and lymphocyte activation (Figure 8A–C), whereas the enrichment of c2 indicated that high expression of STAT5A may participate in the chemokine signalling pathway, natural killer cell mediated cytotoxicity, and T cell receptor signalling pathways (Figure 8D–F). The enrichment of c5 suggested that high expression of STAT5B may be involved in biologic processes, such as drug metabolic process, bile acid metabolic process, and viral life cycle (Figure 9A–C), whereas the enrichment of c2 indicated that high expression of STAT5B may participate in the drug metabolism cytochrome P450, TGF-beta signalling pathway, and JAK-STAT signalling pathways (Figure 9D–F). The enrichment of c5 suggested that high expression of STAT6 may be involved in response to biologic processes, such as type I interferon, drug metabolic process, and defence response to virus (Figure 10A–C), whereas the enrichment of c2 indicated that high expression of STAT6 may participate in the JAK-STAT signalling pathway, drug metabolism cytochrome P450, and PPAR signalling pathways (Figure 10D–F).
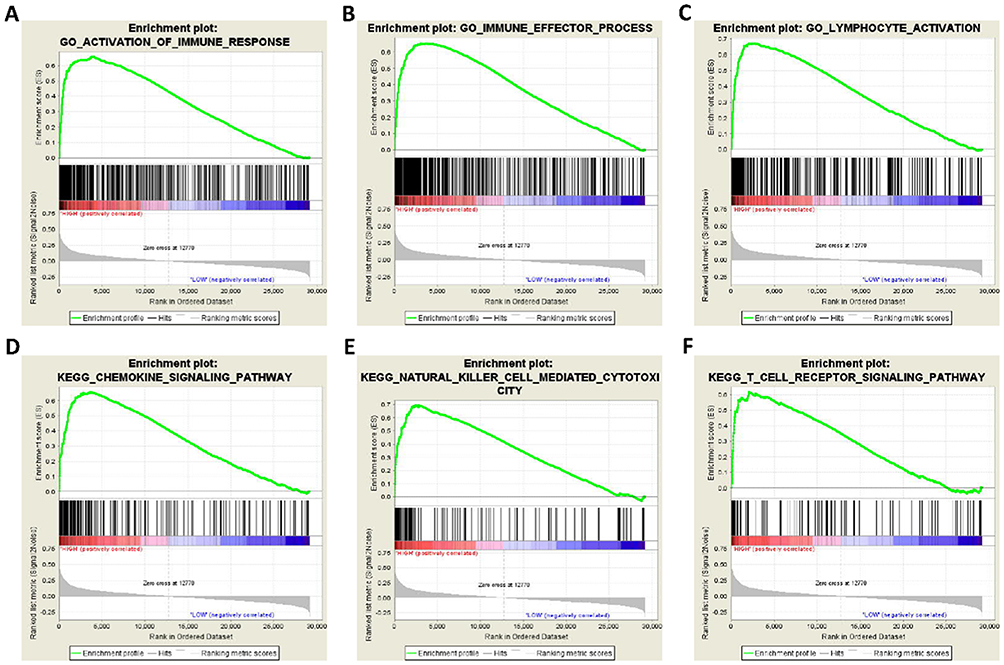 |
Figure 8 GSEA results of STAT5A expressed in HCC patients. (A–C) GSEA results of c5 reference gene sets for high STAT5A expression groups; (D–F) GSEA results of c2 reference gene sets for high STAT5A expression groups. |
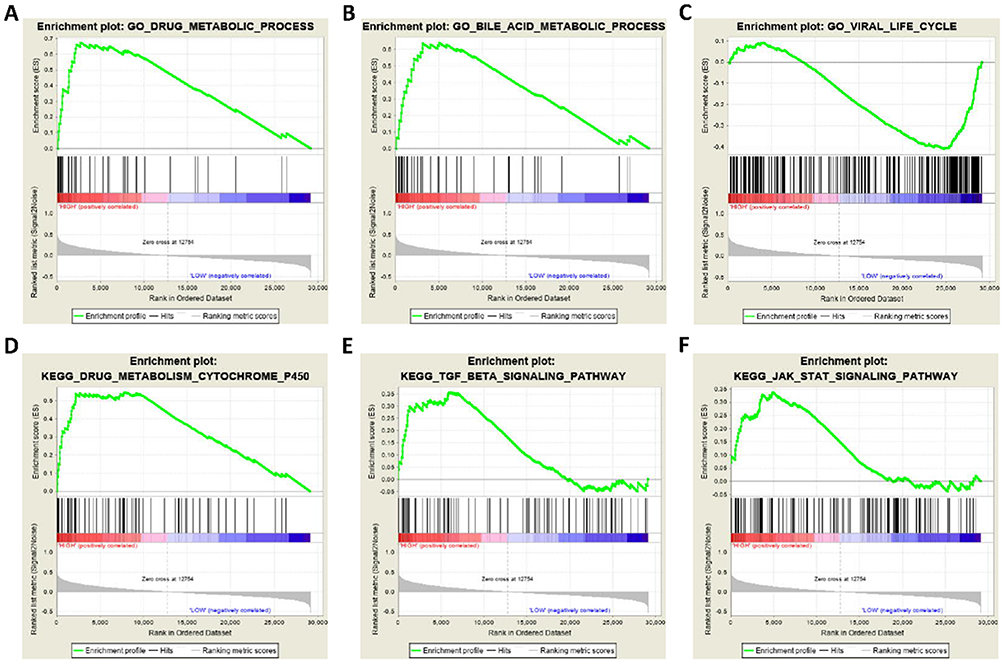 |
Figure 9 GSEA results of STAT5B expressed in HCC patients. (A–C) GSEA results of c5 reference gene sets for high STAT5B expression groups; (D–F) GSEA results of c2 reference gene sets for high STAT5B expression groups. |
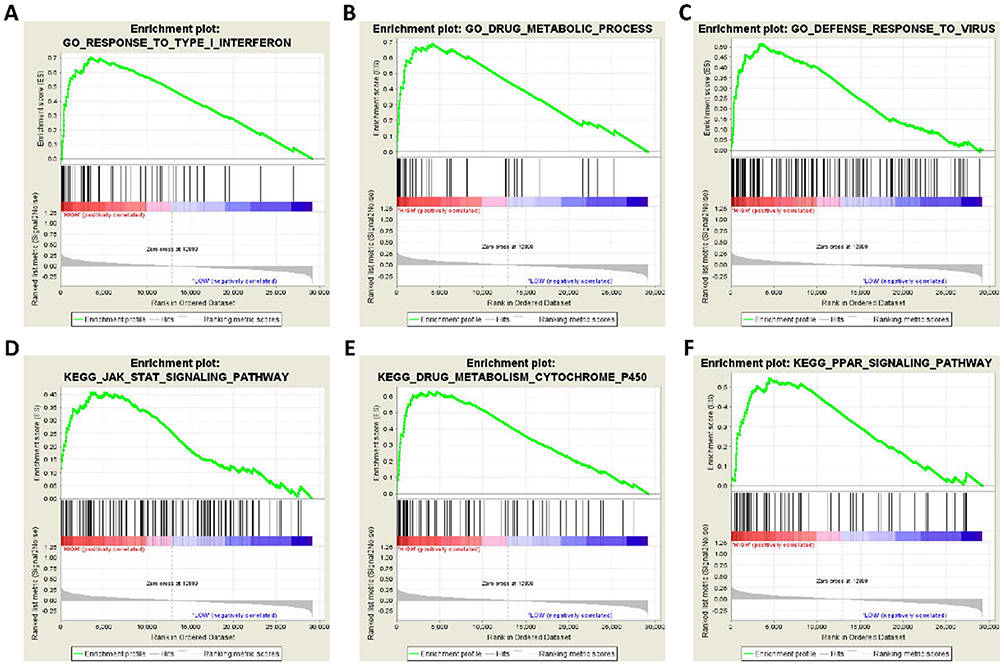 |
Figure 10 GSEA results of STAT6 expressed in HCC patients. (A–C) GSEA results of c5 reference gene sets for high STAT6 expression groups; (D–F) GSEA results of c2 reference gene sets for high STAT6 expression groups. |
Discussion
The STAT gene family is an intracellular transcription factor that mediates many biological processes, such as cellular immunity, proliferation, apoptosis, and differentiation.14 Extensive studies have shown that dysregulation of STAT1-6 family proteins can be observed in a variety of cancer types and indicate that STAT1-6 may play an important role in cancer progression.15,16 In this study, the association between STAT family genes and HCC was investigated in both the TCGA and GEO databases. The results showed that low expression levels of STAT5A, STAT5B, and STAT6 were associated with a poor prognosis of HCC patients in both the TCGA and GEO databases. Moreover, the combination of STAT5A, STAT5B, and STAT6 had good prediction values for HCC patients. Thus, our findings imply that the combination of STAT5A, STAT5B, and STAT6 may serve as a potential prognostic biomarker for HCC.
It is well known that STAT signalling can be activated by diverse cytokines that are involved in many biological processes, such as immunity, cell division, cell death, and cancer development.17 Previous studies have shown that STAT1 acts as a tumour suppressor via multiple mechanisms, including the downregulation of caspases, Fas, FasL, TRAIL, and p21.18,19 However, polymorphisms of the STAT1 gene at rs867637, rs3771300, and rs2280235 are significantly associated with the risk of HCC patients with viral hepatitis.19 STAT3 protein expression and phosphorylation are elevated in human HCC tissues compared with normal healthy liver tissues.20 Importantly, inhibition of STAT3 activation by STAT3 inhibitors could suppress HCC growth in vitro and in vivo, while activation of STAT3 by HBX or HCV core protein promoted HCC development.21,22 Therefore, STAT3 acts as an oncogenic factor that promotes tumourigenesis and is a potential target for HCC targeted therapy. Recent studies have shown that high STAT5A expression is a better prognostic indicator in patients with HCC after hepatectomy.23,24 Many studies have suggested that STAT5 acts as a tumour suppressor in liver tumourigenesis via its anti-steatogenic and hepatoprotective effects and through the upregulation of cell cycle inhibitors Cdkn2b and Cdkn1a.25 These results suggest that STAT1-6 play an important role in the development and progression of HCC.
Despite numerous reports on the role of the STAT gene family in the development of HCC, the prognostic value of STAT genes has rarely been investigated. Previous studies indicated that STAT5A might act as a potential prognostic marker for HCC patients, and lower expression of STAT5A may be associated with worse survival.23,26 In the current study, our results demonstrate that STAT5A, STAT5B, and STAT6 were expressed at low levels in HCC tissues, which was associated with an unfavourable prognosis. We constructed a prognostic gene signature model based on STAT5A, STAT5B, and STAT6, and time-dependent ROC and Kaplan–Meier curve indicated a good performance of this model for HCC survival prediction. In addition, we also constructed a nomogram based on clinical parameters and STAT5A, STAT5B and STAT6 mRNA expression levels. The calibration plots indicated that actual survival corresponded closely with predicted survival, suggesting that the predictive performance of the nomogram was good and indicating that the combination of STAT5A, STAT5B, and STAT6 may be an independent prognostic indicator for HCC.
Finally, GSEA analysis was performed to investigate the potential mechanism of STAT genes in HCC prognosis. The results showed that STAT5A, STAT5B and STAT6 were involved in immune-related biological processes, such as JAK-STAT, PPAR and P450-related signalling pathways. The JAK-STAT signalling pathway can be activated by many cytokines, growth factors, and hormones, which play a critical role in HCC.24 Recent studies have demonstrated that liver-specific STAT5 knockout mice were more susceptible to chronic CCl4-induced liver fibrosis and HCC development.27 PPARs are ligand-activated transcription factors that belong to the nuclear hormone receptor superfamily, which play a role in the regulation of cancer cell growth.28,29 Indeed, PPARγ-null mice displayed a higher susceptibility to the development of HCC induced by the carcinogen diethylnitrosamine (DEN).30 The administration of PPARγ agonists (rosiglitazone) also reduced HCC development induced by DEN in rats or by hepatoma cell xenografts in mice.31 In contrast to PPARγ, activation of PPARα in the liver leads to carcinogenesis in rodents. P450 enzymes also play a key role in cancer formation and cancer treatment and mediate the metabolic activation of anticancer drugs and precarcinogens, as well as anticancer drug inactivation.32 Based on GSEA results, we deduced that the potential mechanism of STAT genes in HCC prognosis may be involvement in multiple biological processes and signalling pathways that are related to HCC development, immune response, and survival.
There were some limitations to our study that need to be recognized. First, the sample size in our study was relatively small, and larger sample sizes are needed to increase the reliability of our findings. Second, the clinical information from the TCGA database was not comprehensive, and more clinical data concerning tumour progression and prognosis, such as smoking and drinking status, Child–Pugh scoring, presence of cirrhosis, transarterial chemoembolization, antitherapy status, radical resection status, pathological differentiation diagnosis, main tumour size, number of tumours, status of tumour capsules, regional invasion, intrahepatic metastasis, and vascular invasion, should be included to better evaluate the relationship between the STAT family genes and HCC. Third, our current study based on the public databases to analyse the prognosis prediction of the mRNA expression level of STAT genes lacks verification at the protein level. Therefore, future research is still needed to address these issues. Due to the small sample size and incomplete clinical information in the current study, further well-designed and larger sample size studies are necessary to validate our results.
In this study, we investigated the association between the expression of individual STAT genes and overall survival in HCC patients. Furthermore, we studied the joint effects of three STAT genes and constructed a nomogram for the prediction of HCC patient prognosis. In addition, we also investigated the potential mechanism of STAT genes in HCC patient prognostics using the GSEA approach. These results provide insight into STAT genes for cancer clinical outcomes, and these genes may serve as biomarkers for the prediction of HCC patient prognosis.
Conclusion
Our data suggest that STAT5A, STAT5B, and STAT6 may be potential prognostic biomarkers of HCC, and their combination showed a strong interaction and better predictive value for HCC prognosis. The potential mechanism of these three STAT genes in HCC prognosis may be through participating in the biologic processes and pathways of immune-related biological processes, JAK-STAT, PPAR and P450-related signaling pathways. However, these results still need further validation and investigation in the future.
Acknowledgment
This work was financially supported by the Fund of Shanghai Municipal Commission of Health and Family Planning (NO. 201840128).
Disclosure
The authors declare that there are no conflicts of interest regarding the publication of this article.
References
1. Forner A, Reig M, Bruix J. Hepatocellular carcinoma. Lancet (London, England). 2018;391(10127):1301–1314. doi:10.1016/S0140-6736(18)30010-2
2. Siegel RL, Miller KD. Cancer statistics, 2019. CA Cancer J Clin. 2019;69(1):7–34. doi:10.3322/caac.21551
3. Forner A, Llovet JM, Bruix J. Hepatocellular carcinoma. Lancet (London, England). 2012;379(9822):1245–1255. doi:10.1016/S0140-6736(11)61347-0
4. Wang FS, Fan JG, Zhang Z, Gao B, Wang HY. The global burden of liver disease: the major impact of China. Hepatology (Baltimore, Md). 2014;60(6):2099–2108. doi:10.1002/hep.27406
5. Bruix J, Gores GJ, Mazzaferro V. Hepatocellular carcinoma: clinical frontiers and perspectives. Gut. 2014;63(5):844–855. doi:10.1136/gutjnl-2013-306627
6. Zhang X, Li J, Shen F. Significance of presence of microvascular invasion in specimens obtained after surgical treatment of hepatocellular carcinoma. J Gastroenterol Hepatol. 2018;33(2):347–354. doi:10.1111/jgh.13843
7. Villarino AV, Kanno Y, O’Shea JJ. Mechanisms and consequences of Jak-STAT signaling in the immune system. Nat Immunol. 2017;18(4):374–384. doi:10.1038/ni.3691
8. Gao B, Wang H, Lafdil F, Feng D. STAT proteins - key regulators of anti-viral responses, inflammation, and tumourigenesis in the liver. J Hepatol. 2012;57(2):430–441. doi:10.1016/j.jhep.2012.01.029
9. Rehermann B. Hepatitis C virus versus innate and adaptive immune responses: a tale of coevolution and coexistence. J Clin Invest. 2009;119(7):1745–1754. doi:10.1172/JCI39133
10. Wang H, Lafdil F, Kong X, Gao B. Signal transducer and activator of transcription 3 in liver diseases: a novel therapeutic target. Int J Biol Sci. 2011;7(5):536–550. doi:10.7150/ijbs.7.536
11. Mair M, Zollner G, Schneller D, et al. Signal transducer and activator of transcription 3 protects from liver injury and fibrosis in a mouse model of sclerosing cholangitis. Gastroenterology. 2010;138(7):2499–2508. doi:10.1053/j.gastro.2010.02.049
12. Haga S, Terui K, Zhang HQ, et al. Stat3 protects against Fas-induced liver injury by redox-dependent and -independent mechanisms. J Clin Invest. 2003;112(7):989–998. doi:10.1172/JCI17970
13. Hosui A, Kimura A, Yamaji D, Zhu BM, Na R, Hennighausen L. Loss of STAT5 causes liver fibrosis and cancer development through increased TGF-{beta} and STAT3 activation. J Exp Med. 2009;206(4):819–831. doi:10.1084/jem.20080003
14. Gao B. Cytokines, STATs and liver disease. Cell Mol Immunol. 2005;2(2):92–100.
15. O’Shea JJ, Holland SM, Staudt LM. JAKs and STATs in immunity, immunodeficiency, and cancer. N Engl J Med. 2013;368(2):161–170. doi:10.1056/NEJMra1202117
16. Groner B, von Manstein V. Jak stat signaling and cancer: opportunities, benefits and side effects of targeted inhibition. Mol Cell Endocrinol. 2017;451:1–14. doi:10.1016/j.mce.2017.05.033
17. Pencik J, Pham HT, Schmoellerl J, et al. JAK-STAT signaling in cancer: from cytokines to non-coding genome. Cytokine. 2016;87:26–36. doi:10.1016/j.cyto.2016.06.017
18. Chin YE, Kitagawa M, Su WC, You ZH, Iwamoto Y, Fu XY. Cell growth arrest and induction of cyclin-dependent kinase inhibitor p21 WAF1/CIP1 mediated by STAT1. Science (New York, NY). 1996;272(5262):719–722. doi:10.1126/science.272.5262.719
19. Chen B, He L, Savell VH, Jenkins JJ, Parham DM. Inhibition of the interferon-gamma/signal transducers and activators of transcription (STAT) pathway by hypermethylation at a STAT-binding site in the p21WAF1 promoter region. Cancer Res. 2000;60(12):3290–3298.
20. Liang C, Xu Y, Ge H, Li G, Wu J. Clinicopathological significance and prognostic role of p-STAT3 in patients with hepatocellular carcinoma. Onco Targets Ther. 2018;11:1203–1214. doi:10.2147/OTT.S156198
21. Jung KH, Yoo W, Stevenson HL, et al. Multifunctional effects of a small-molecule STAT3 inhibitor on nash and hepatocellular carcinoma in mice. Clin Cancer Res. 2017;23(18):5537–5546. doi:10.1158/1078-0432.CCR-16-2253
22. Quetier I, Brezillon N, Duriez M, et al. Hepatitis B virus HBx protein impairs liver regeneration through enhanced expression of IL-6 in transgenic mice. J Hepatol. 2013;59(2):285–291. doi:10.1016/j.jhep.2013.03.021
23. Wubetu GY, Utsunomiya T, Ishikawa D, et al. High STAT5A expression is a better prognostic indicator in patients with hepatocellular carcinoma after hepatectomy. Ann Surg Oncol. 2014;21(Suppl 4):S721–S728. doi:10.1245/s10434-014-3861-9
24. Calvisi DF, Ladu S, Gorden A, et al. Ubiquitous activation of Ras and Jak/Stat pathways in human HCC. Gastroenterology. 2006;130(4):1117–1128. doi:10.1053/j.gastro.2006.01.006
25. Yu JH, Zhu BM, Wickre M, et al. The transcription factors signal transducer and activator of transcription 5A (STAT5B) and STAT5B negatively regulate cell proliferation through the activation of cyclin-dependent kinase inhibitor 2b (Cdkn2b) and Cdkn1a expression. Hepatology (Baltimore, Md). 2010;52(5):1808–1818. doi:10.1002/hep.23882
26. Wang G, Chen JH, Qiang Y, Wang DZ, Chen Z. Decreased STAT5A indicates poor prognosis and enhanced cell proliferation in hepatocellular carcinoma. World J Gastroenterol. 2015;21(13):3983–3993. doi:10.3748/wjg.v21.i13.3983
27. Kaltenecker D, Themanns M, Mueller KM, et al. STAT5 deficiency in hepatocytes reduces diethylnitrosamine-induced liver tumourigenesis in mice. Cytokine. 2018. doi:10.1016/j.cyto.2018.10.014
28. Zardi EM, Navarini L, Sambataro G, et al. Hepatic PPARs: their role in liver physiology, fibrosis and treatment. Curr Med Chem. 2013;20(27):3370–3396.
29. Kimura O, Kondo Y, Shimosegawa T. PPAR could contribute to the pathogenesis of hepatocellular carcinoma. PPAR Res. 2012;2012:574180. doi:10.1155/2012/574180
30. Shen B, Chu ES, Zhao G, et al. PPARgamma inhibits hepatocellular carcinoma metastases in vitro and in mice. Br J Cancer. 2012;106(9):1486–1494. doi:10.1038/bjc.2012.130
31. Yu J, Shen B, Chu ES, et al. Inhibitory role of peroxisome proliferator-activated receptor gamma in hepatocarcinogenesis in mice and in vitro. Hepatology (Baltimore, Md). 2010;51(6):2008–2019. doi:10.1002/hep.23550
32. Villeneuve JP, Pichette V. Cytochrome P450 and liver diseases. Curr Drug Metab. 2004;5(3):273–282.
 © 2019 The Author(s). This work is published and licensed by Dove Medical Press Limited. The
full terms of this license are available at https://www.dovepress.com/terms
and incorporate the Creative Commons Attribution
- Non Commercial (unported, 3.0) License.
By accessing the work you hereby accept the Terms. Non-commercial uses of the work are permitted
without any further permission from Dove Medical Press Limited, provided the work is properly
attributed. For permission for commercial use of this work, please see paragraphs 4.2 and 5 of our Terms.
© 2019 The Author(s). This work is published and licensed by Dove Medical Press Limited. The
full terms of this license are available at https://www.dovepress.com/terms
and incorporate the Creative Commons Attribution
- Non Commercial (unported, 3.0) License.
By accessing the work you hereby accept the Terms. Non-commercial uses of the work are permitted
without any further permission from Dove Medical Press Limited, provided the work is properly
attributed. For permission for commercial use of this work, please see paragraphs 4.2 and 5 of our Terms.