Back to Journals » Journal of Pain Research » Volume 11
Spotlight on topographical pressure pain sensitivity maps: a review
Authors Alburquerque-Sendín F ![]() , Madeleine P
, Madeleine P ![]() , Fernández-de-las-Peñas C, Camargo PR, Salvini TF
, Fernández-de-las-Peñas C, Camargo PR, Salvini TF
Received 28 August 2017
Accepted for publication 2 November 2017
Published 18 January 2018 Volume 2018:11 Pages 215—225
DOI https://doi.org/10.2147/JPR.S135769
Checked for plagiarism Yes
Review by Single anonymous peer review
Peer reviewer comments 2
Editor who approved publication: Dr Katherine Hanlon
Francisco Alburquerque-Sendín,1 Pascal Madeleine,2 César Fernández-de-las-Peñas,3 Paula Rezende Camargo,4 Tania Fátima Salvini4
1Department of Socio-Sanitary Sciences, Radiology and Physical Medicine, Universidad de Córdoba, Córdoba, Spain; 2Physical Activity and Human Performance Group, SMI, Department of Health Science and Technology, Faculty of Medicine, Aalborg University, Aalborg, Denmark; 3Department of Physical Therapy, Occupational Therapy, Physical Medicine and Rehabilitation, Universidad Rey Juan Carlos, Madrid, Spain; 4Department of Physical Therapy, Federal University of São Carlos, São Carlos, SP, Brazil
Abstract: Mechanical hyperalgesia defined as decreased pressure pain thresholds (PPTs) is commonly associated with pain. In this narrative review, we report the current state of the art within topographical pressure sensitivity maps. Such maps are based on multiple PPT assessments. The PPTs are assessed by an a priori defined grid with special focus on both spatial and temporal summation issues. The grid covers the muscle or the body region of interest using absolute or relative values determined from anatomical landmarks or anthropometric values. The collected PPTs are interpolated by Shepard or Franke and Nielson interpolation methods to create topographical pressure sensitivity maps. This new imaging technique has proven to be valuable in various disciplines including exercise physiology, neurology, physical therapy, occupational medicine, oncology, orthopedics, and sport sciences. The reviewed papers have targeted different body regions like the scalp, low back, neck–shoulder, and upper and lower extremities. The maps have delineated spatial heterogeneity in the pressure pain sensitivity underlining the different extents of pressure pain hyperalgesia in both experimentally induced and disease-associated pain conditions. Furthermore, various intervention studies have proven the utility of topographical pressure pain sensitivity maps. Topographical pressure pain sensitivity maps have contributed to revealing the efficacy of therapeutic, ergonomic, or training interventions that aim at reducing pain.
Keywords: pressure pain, topographical, muscle, musculo-tendinous, hyperalgesia
Introduction
Pain is defined as “an unpleasant sensory and emotional experience associated with actual or potential tissue damage, or described in terms of such damage”.1 Pain is often associated with mechanical hyperalgesia, expressed as decreased pressure pain threshold (PPT). Mechanical hyperalgesia is a common manifestation of sensitization of nociceptive pain pathways, and it can be associated with peripheral or central sensitization mechanisms. For instance, peripheral sensitization (defined as increased responsiveness and reduced threshold of peripheral nociceptors to stimulation of their receptive fields) is usually characterized by a localized decrease in response threshold to different noxious stimuli, increased responsiveness to a nociceptive stimulus, and increased receptive field sizes.2 Central sensitization (defined as an increased response to pain stimulation mediated by amplification of signaling to the central nervous system) may occur as a result of two mechanisms: long-lasting increased peripheral excitation (sensitization) or decreased pain inhibition. Regardless of the mechanism involved, mechanical sensitization is clinically manifested as hypersensitivity over distant pain-free areas, that is, generalized and/or widespread pain hypersensitivity to pressure.2
Most commonly, pressure pain sensitivity is assessed by means of an electronic algometer. The person tested is carefully instructed to press a stop button as soon as the perception of the stimulus changes from pressure to pain (defined as the PPT) or when he or she no longer can tolerate the pressure (pressure pain tolerance). The mean of three trials on each assessed point, with a 30–60 seconds resting period between each trial to avoid temporal summation, is usually derived. Nevertheless, recent studies have observed that reliable measurements (intraclass correlation coefficient ranging from 0.86 to 0.99) can also be achieved with two3 or one4 repetition.
Some systematic reviews and meta-analyses have reported moderate to large differences in PPT between adults with headache5 and adults with knee osteoarthritis6 compared with asymptomatic controls. These reviews concluded that patients experienced lower PPTs (hyperalgesia to pressure pain) as a manifestation of sensitization mechanisms. However, most studies included in the reviews analyzed PPT over a single standardized point, usually within the symptomatic area (eg, the head or the knee) or over a single standardized point in a distant pain-free area (eg, the tibialis anterior or the hand).5,6
In clinical practice, it is commonly observed that the same anatomical area does not exhibit the same mechanical sensitivity to pressure. Over the last two decades, we have extensively developed and demonstrated the utility of multiple site assessments of PPT. As such, PPT recordings enable the mapping over an area, that is, portion or entire muscle or anatomical body area, leading to a new imaging modality for assessment distribution of sensitivity to pain: the topographical pressure pain sensitivity map.7 The application of topographical pressure sensitivity maps has widely contributed to a better understanding of manifestations of pain processing in several domains, including, for instance, experimentally induced or disease-associated pain conditions, sport sciences, and ergonomics interventions. To the best of the authors’ knowledge, to date no review paper has addressed this topic in the available scientific literature. Therefore, this narrative review will describe the current data on topographical pressure pain sensitivity maps from methodological and scientific points of view. First, we present the methodological aspects behind the generation of the pressure pain sensitivity maps and then the scientific achievements in relation to the investigated muscles or body regions, that is, trapezius, temporalis, scalp, shoulder, elbow, hand, low back, knee, foot, and lower extremity in both experimentally induced and disease-associated pain conditions.
Methodology of topographical pressure pain maps
Recording grid and spatial considerations
In order to generate topographical pressure pain sensitivity maps, a grid to be used during PPT assessments is to be defined. Until now, two different types of grids have been applied:
- grids using absolute values based on determined anatomic landmarks to assess PPTs, for example, the study by Fernández-de-las-Peñas et al8 investigating changes in pain sensitivity in tension-type headache (TTH) on the temporalis muscle; and
- grids using relative values based on anatomic landmarks and anthropometric values to locate areas for determining the PPTs, for example, the study by Binderup et al9 analyzing changes on trapezius muscle sensitivity to pressure after eccentric exercise.
The second aspect to take into consideration is the number of assessed PPT points. This is important for two main reasons: the spatial resolution (distance between two adjacent locations) and the spatial summation of pain. Pain summation can actually occur in case of repeated stimulations close to one another.10,11 In fact, PPTs are generally assessed with 20–60 second intervals between trials to avoid temporal summation.10,11 The assessment order can be selected either column wise/row wise or randomly to avoid spatial temporization.10 Finally, the number of PPT points is to be adjusted with respect to the time allowed for the assessments. In general, we have considered that the PPT recordings should not last more than 1 hour to avoid boredom or a lack of alertness.7
Topographical mapping by muscle
The third aspect is the anatomical body region of interest. It should be noted that current topographical pressure pain sensitivity maps have been empirically constructed based on clinical aspects of the conditions associated with the body area of interest. In fact, topographical pain maps have been created for individual, for example, temporalis, trapezius, or infraspinatus, and for body regions, for example, shoulder, elbow, head, or lower limbs.
For the neck–shoulder region, the trapezius muscle has attracted a lot of attention. To the best of the authors’ knowledge, the first study reporting topographical pressure pain sensitivity maps was conducted in 2005.12 For the trapezius, the following 11 points were originally used: 1) suboccipital musculature, 2) transverse process of C5, 3) transverse process of C7, 4) middle point between the spinous process of C7 and the acromion, 5) 2 cm superior to the superior angle of the scapula, 6) superior angle of the scapulae, 7) 1 cm medial to the acromion–clavicular joint, 8) 3 cm superior to the middle of the spinae of the scapula, 9) 2 cm distal to the middle of the spinae of the scapula, 10) middle point between the spinous process of T4 and medial border of the spinae of the scapula, and 11) middle point between spinous process of T6 and medial border of the spinae of the scapula13 (Figure 1A). The topographical map of the trapezius has been extended to 32, 36, and 48 points, respectively, covering the sole trapezius, the trapezius including the postural neck region and the trapezius, the postural neck region and the spinal processes.14 In these alternative maps, the distance between C7 and the acromion was used to define the PPT maps. A distance of one sixth of the C7–acromion distance was used with the exception of the four points located over the posterior–lateral part of the neck (here the horizontal distance was set to one seventh of the C7–acromion distance). The distance between the adjacent point and the acromion and the distance between the points over the spinal processes and the muscle points were set to one twelfth of the C7–acromion distance.14
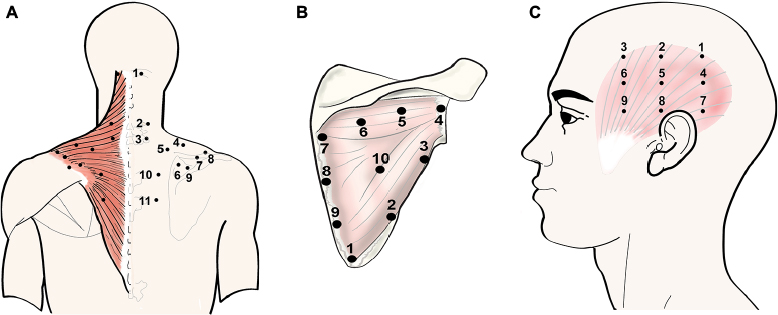 | Figure 1 Points of assessment for topographical pressure pain sensitivity maps in the trapezius (A), infraspinatus (B), and temporalis (C) muscles. Notes: (A) Adapted from Fernández-de-las-Peñas C, Madeleine P, Caminero AB, Cuadrado ML, Arendt-Nielsen L, Pareja JA. Generalized neck-shoulder hyperalgesia in chronic tension-type headache and unilateral migraine assessed by pressure pain sensitivity topographical maps of the trapezius muscle. Cephalalgia. 2010;30(1):77–86. Copyright © 2010, © SAGE Publications.13 (C) Adapted from Fernández-de-las-Peñas C, Caminero AB, Madeleine P, et al. Multiple active myofascial trigger points and pressure pain sensitivity maps in the temporalis muscle are related in chronic tension type headache. Clin J Pain. 2009;25:506–512. Copyright © 2009, © 2099 Lippincott Williams.35 |
For the infraspinatus muscle, 10 points were used considering the triangular shape of the muscle.15 Each point was a circular subarea with an area of 1.0 cm2 (area of the probe of a pressure algometer) (Figure 1B). With a similar approach, Ge et al used 13 points to cover the upper part of the trapezius muscle corresponding to 13 circular points with an area of 1.0 cm2 each.16 In another study, 14 points were used to determine maps in the clavicular portion of the trapezius muscle; three rows of 4 and 5 points separated by 2 cm.17
For topographical pain maps on the temporalis muscle, nine points covering the entire muscle have been used.8,18 The nine points forming a rectangle were localized based on the ear of each participant (anatomical reference point). The vertical line of the ear was used to define the central column and considered as the center of the muscle belly. Then, three vertical points separated by 1.5 cm were marked. Finally, these points were used to define the anterior and posterior columns. The vertical distance between the assessed points was set to 1 cm (Figure 1C).
In another study, 12 points forming a 3×4 matrix (separated by one sixth of the C7–acromion distance) were used to determine maps in the deltoid and the pectoralis major muscles in patients with post-mastectomy pain.19
Finally, the tibialis anterior muscle was mapped using five sites equally interspaced between the distal and proximal musculotendinous junction of the muscle.20
Topographical mapping by anatomical area
Pressure pain sensitivity maps of the low-back region used the spinous processes from L1 to L5 vertebra to generate a map of 14 points. The distance between spinous processes from L1 to L5 was used to define the distance between adjacent points. A column of 5 points was placed bilaterally at one fourth of the L1–L5 distance from a fictive line joining L1–L5 spinous process. A second column of two points was set bilaterally at one half of the L1–L5 distance at L2 and L3 level21 (Figure 2).
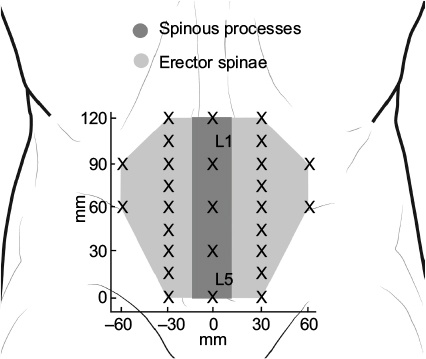 | Figure 2 Points of assessment for topographical pressure pain sensitivity maps of the low back region. |
For pressure pain sensitivity maps of the scalp, 21 points have been used. The location and the nomenclature of these points were based on standard positioning using the international 10/20 and 10/10 systems for electroencephalogram recordings.22 Therefore, eight points on the right (Fp2, F4, F8, C4, T4, P4, T6, and O2), eight points on the left (Fp1, F3, F7, C3, T3, P3, T5, and O1), and five points along the mid-sagittal curve (Fpz, Fz, Cz, Pz, and Oz) were marked in the scalp (Figure 3).
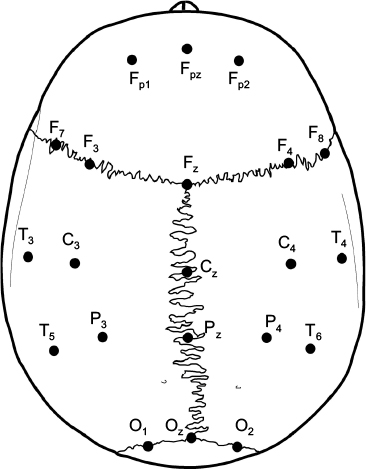 | Figure 3 Points of assessment for topographical pressure pain sensitivity maps of the scalp based on the International 10/20 and 10/10 systems for electroencephalogram recordings. |
More recently, the following anatomical landmarks (the acromion, C7, and the insertion of the deltoid muscle) were used to define a map of 33 points in the shoulder region.23 In this map, a compass was used to define a Cartesian plane and determine the position of equidistant points covering the anterior, medial, and posterior part of the shoulder (Figure 4).
 | Figure 4 Points of assessment for topographical pressure pain sensitivity maps of the shoulder region based on a Cartesian plane.
|
For the upper extremities, pressure pain maps of the palm of the hand and the dorsal aspect of the elbow covering wrist extensors have been generated. For the hand, 2324 or 3025 points covering the volar side of the hand have been used. The phalanxes have been assessed. Four points have been located over the thenar muscles, the lower end of the hypo-thenar, head of second metacarpal bone, and head of fifth metacarpal bone. Points in the middle of these landmark points have also been assessed (Figure 5).
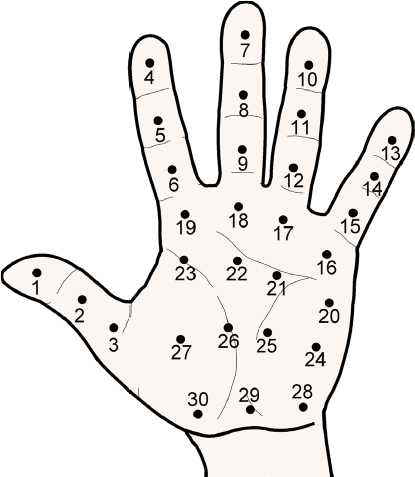 | Figure 5 Points of assessment for topographical pressure pain sensitivity maps of the hand. Note: Adapted from Fernández-de-las-Peñas C, Madeleine P, Martinez-Perez A, Arendt-Nielsen L, Jimenez-Garcia R, Pareja JA. Pressure pain sensitivity topographical maps reveal bilateral hyperalgesia of the hands in patients with unilateral carpal tunnel syndrome. Arthritis Care Res. 2010;62(8):1055–1064. Copyright © 2010 by the American College of Rheumatology.25 |
For the elbow area, PPT maps have been assessed using a 3×4 matrix (separated by 2 cm)26 – four points in the superior part, four points in the middle part, and four points in the lower part around the lateral epicondyle. The lateral epicondyle was used as the reference point. Then, a downward line from the lateral epicondyle was defined as the central column of the map and used to define the position of the anterior and posterior columns. Interestingly, a cadaveric study showed an association between the assessed PPT points over the elbow area and wrist extensor musculature.27
Concerning the lower extremities, topographical pressure pain sensitivity maps of the foot,28 the knee,29 and the entire lower limb30 have been generated. For the foot, seven anatomical locations including the first, third, and fifth metatarsal bones, the belly of the abductor digiti minimi muscle, the belly of the flexor digitorum brevis muscle, the belly of the abductor hallucis muscle, and the calcaneus bone were used to form the PPT maps of the plantar region of the foot (Figure 6).28 For the knee, eight points over the peri-patellar region related to anatomical bony landmarks were used:29 1) 2 cm distal to the inferior medial edge of patella, 2) 2 cm distal to the inferior lateral edge of patella, 3) 3 cm lateral to the mid-point on the lateral edge of patella, 4) 2 cm proximal to the superior lateral edge of patella, 5) 2 cm proximal to the superior edge of patella, 6) 2 cm proximal to the superior medial edge of patella; 7) 3 cm medial to the mid-point on the medial edge of patella; and 8) the center of patella (Figure 7).
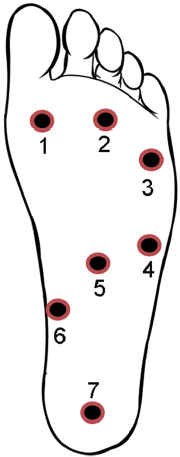 | Figure 6 Points of assessment for topographical pressure pain sensitivity maps of the foot. Note: Adapted from Tornero-Caballero MC, Salom-Moreno J, Cigarán-Méndez M, Morales-Cabezas M, Madeleine P, Fernández-de-las-Peñas C. Muscle trigger points and pressure pain sensitivity maps of the feet in women with fibromyalgia syndrome. Pain Med. 2016;17(10):1923–1932. Copyright © 2016, Oxford University Press.28 |
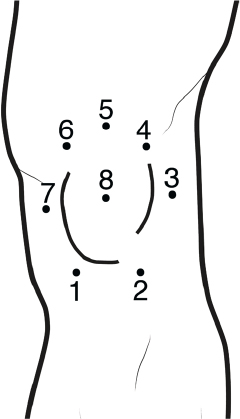 | Figure 7 Points of assessment for topographical pressure pain sensitivity maps of the knee. |
For the entire lower extremity, the maps were based on 23 points,30 including two points for the rectus femoris, one for the tensor fasciae latae, three points for vastus lateralis, one point for vastus medialis, four points for biceps femoris, four points for semimembranosus and semitendinosus, one point for tibialis anterior, two points for peroneus, four points for gastrocnemius, and one point for soleus muscles (Figure 8).
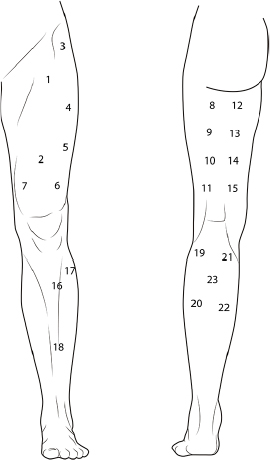 | Figure 8 Points of assessment for topographical pressure pain sensitivity maps of the lower extremity. |
In conclusion, the proposed recording grid setups provide adequate coverage of the regions of interest. Furthermore, the grid setups are simple and rather quick to measure up, and they provide a good basis for the PPT maps.
Interpolation methods
Estimation through interpolation of the PPT values between the recording points is necessary to visualize topographical pressure pain maps. The most simple and commonly used way of interpolation between two known values is the linear interpolation. It can only interpolate in two dimensions and is not of interest when interpolating PPT data using the selected grids. A more appropriate method is the inverse distance interpolation where the unknown values of any point are computed as a summation of all assessed point values multiplied with an adjustment factor representing the distance between every known and unknown PPT point.7 This is expressed by the following mathematical formula:
|
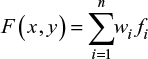
where n is the number of recorded points, fi the value of the recorded point and wi is the weighting coefficient of the recorded point. In the classical form given by Shepard,31 the weighting coefficient value is computed as:
|
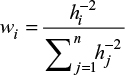
where hi is the distance between the interpolated point and the recorded point given by:
|
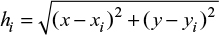
where (x,y) are the coordinates for the interpolated point and (xi,yi) are the coordinates of each assessed point. A somehow improved method of inversed weighted interpolation was proposed by Franke and Nielson32 where the weighting coefficient is computed as:
|
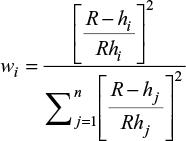
where R is the distance from the interpolated point to the most distant recorded point.
Both the methods have relevant properties, that is, the values of the interpolated points are all within the boundaries set by the assessed PPT values. Of note, this property is not considered when using the Clough and Tocher interpolation.33 A possible problematic issue is that the interpolated points are somewhat symmetric around the assessed points. Binderup et al showed the non-linearity of the inversed distance interpolation method using Franke and Nielson weighting coefficients.7 In conclusion, the presented interpolation method enables the generation of the PPT maps in a representative way allowing for meaningful interpretation based on the visual inspection alone. The topographical pressure pain sensitivity maps display the topography of pressure pain sensitivity between the deep structures of the same muscle and between different muscles.
Studies reporting topographical pressure pain maps
In this section, we present papers reporting topographical pressure pain sensitivity maps in various experimentally induced and disease-associated pain conditions covering very distinct fields like pain in various body regions englobing neck–shoulder, low back, headache, and migraine as well as the effects of eccentric training, turf type, and ergonomics interventions. In general, decreased PPTs highlighting hyperalgesia were found in experimentally induced and disease-associated pain conditions. Interestingly, the topographical pressure pain sensitivity maps enable detection of heterogeneity in pressure pain sensitivity, offering a way to picture the extent of hyperalgesia as well as the effects of various interventions.
The muscle that is most often investigated is probably the trapezius. Topographical pressure pain sensitivity maps have been created covering the muscle partially or entirely using different grids in asymptomatic adults and patients.12–14 Binderup et al have even used a cluster analysis to determine the number and location of trapezius regions based on PPT values, confirming that three distinct portions corresponding to the upper, middle, and lower trapezius can be detected.14 Topographical pressure pain sensitivity maps of the trapezius have revealed that the upper portion is more sensitive to pressure than the middle and lower portions of the muscle and that muscle belly areas are also more sensitive than musculo-tendinous areas in both asymptomatic adults and patients with TTH and migraine and in breast cancer survivors.12–14,19 Furthermore, the topographical pressure pain sensitivity maps that have been generated for the upper portion of the trapezius have revealed that the mid-region of the upper trapezius shows the lowest PPTs as well as the largest number of active trigger points (TrPs) in women suffering from fibromyalgia syndrome and the largest number of latent TrPs in asymptomatic controls.16
Similarly, topographical pressure pain sensitivity maps of the temporalis muscle have revealed a heterogeneous distribution of the pressure pain sensitivity in adults with chronic or frequent episodic TTH8,34 and migraine18 but not in asymptomatic adults. In these studies, the anterior column of the temporalis is the most sensitive part of the muscle in adults with TTH or migraine. However, this has not been shown in asymptomatic controls in whom the center of the muscle belly was the most sensitive part.8,18 In agreement with findings concerning the upper trapezius muscle, the anterior-to-posterior gradient on pressure pain sensitivity is related to the presence of active TrPs in a sample of patients with TTH, suggesting that the heterogeneous distribution of the sensitivity to pressure within a muscle may be related to the presence of TrPs.35 As depicted by topographical pressure pain sensitivity maps within the same muscle, the hypothesis that the presence of TrPs may be associated with areas exhibiting lower PPT, which has also been proposed by Ge et al.15 In this study, active TrPs on the painful side and latent TrPs on the non-symptomatic side were located in the mid-region of the infraspinatus and visualized in the topographical pressure pain sensitivity maps.15 Furthermore, a topographical pressure pain sensitivity map of the wrist extensor muscles has also been applied in an experimentally induced pain study in which a glutamate injection into latent TrPs was reported to induce an early occurrence of a locally enlarged area of pressure hyperalgesia associated with spreading central sensitization.36
Topographical pressure pain sensitivity maps have also been applied to investigate spatial changes in sensitivity to pressure; not just within the same muscle, but also in a particular anatomical area including the scalp,37,38 shoulder,19,23 elbow,26 hand,25 low back,21 knee,29 foot,28 and the entire lower extremity.30 These studies included different pain populations such as nummular headache,37 migraine,38 breast cancer survivors,19 subacromial pain syndrome,23 lateral elbow pain,26 carpal tunnel syndrome,25 knee osteoarthritis,29 fibromyalgia syndrome,28 and in asymptomatic adults21 or soccer players.30
All studies have revealed heterogeneous distribution of pressure pain in the anatomical areas investigated. In general, topographical pressure pain sensitivity maps have shown that muscle belly areas are the most sensitive to pressure, whereas bony areas are less sensitive to pressure. In addition, particular spatial differences have also been noted in some areas. For instance, it has been found that the anterior part of the scalp is more sensitive to pressure than the middle and posterior parts in both headache patients and asymptomatic controls.37,38 In the elbow area, topographical pressure pain sensitivity maps have shown that the extensor carpi radialis brevis is the most sensitive muscle of the wrist extensors in both adults with unilateral epicondylalgia and asymptomatic controls.26 Similarly, topographical pressure pain sensitivity maps supported that the medial side of the knee joint29 or the vastus medialis muscle30 are the most sensitive areas of the lower extremity in both patients with painful knee osteoarthritis and professional soccer players. The papers reporting topographical pressure pain sensitivity maps support a heterogeneous distribution of sensitivity to pressure within the same muscle and within the same body area in both patients with different chronic pain conditions and asymptomatic adults.
Topographical pressure pain sensitivity maps have also determined spatial changes in pressure pain sensitivity after the application of eccentric exercise inducing delayed muscle onset soreness (DOMS) in one muscle, for example, upper trapezius,12,17,39 the whole trapezius9 or the tibialis anterior20 as well as in an agonist-synergist group of muscles such as the wrist extensor muscles.40,41 Among these investigations, two studies have shown that DOMS induced in the shoulder results in a heterogeneous development of muscle hyperalgesia throughout the whole trapezius muscle with a developed mechanical hyperalgesia more marked in the muscle belly sites compared with musculo-tendinous sites.9,12 Another study has found that application of a bout of high-level unaccustomed eccentric exercise causing DOMS within the tibialis anterior muscle provokes pressure hyperalgesia in the muscle belly and lower nociceptive withdrawal reflex threshold.20 Interestingly, no changes in pressure pain sensitivity have been observed after a second bout of eccentric exercise, suggesting a protective effect (hypoalgesia) named repetitive bout effect.20 Similar results have also been reported in the upper trapezius muscle in which a generally increased sensitivity was found after the first session, but with no subsequent sessions, of eccentric exercise inducing DOMS.39 Kawczynski et al have applied topographical pressure sensitivity maps of the lower extremity among professional soccer players before, 24 hours, and 48 hours after a soccer game to report the development of DOMS in the lower limbs, particularly the quadriceps muscle.42 On the contrary, Andersen et al did not report significant changes in pressure pain sensitivity in the upper trapezius after 20 minutes of static or dynamic exercise.17 The authors justified this lack of hyperalgesia with the short duration of the exercise program applied in their study.17
Two studies have also used repetitive high-level eccentric contractions of the wrist extensor muscles to induce DOMS and/or study the repetitive bout effect.40,41 In these studies, topographical pressure sensitivity maps of the elbow revealed heterogeneous distribution of mechanical sensitivity before and after eccentric exercise with the extensor carpi radialis brevis muscle being the most sensitive.40,41 Again, a second bout of eccentric exercise did not result in significant changes in pressure pain sensitivity41 similar to previous findings revealing a hypoalgesic effect of repeated bouts of eccentric contractions in the tibialis anterior20 and upper trapezius39 muscles.
Potential applications of topographical pressure sensitivity maps
The application of topographical pressure pain sensitivity maps has provided a new understanding of potential mechanisms underlying mechanical pain sensitivity and their modulation. First, based on the current data, it clearly seems that sensitivity to pressure is not distributed uniformly within the same muscle/portion or body area as depicted by topographical pressure pain sensitivity maps. A different distribution of nociceptors within the cutaneous, sub-cutaneous, or muscular tissues is mostly responsible for these differences in pressure pain gradient. In fact, pressure pain hyperalgesia has been related to particular anatomic locations, for example, muscle belly, rather than others, for example, musculo-tendinous junction. Spatial differences in mechanical sensitivity could be explained by the fact that muscle belly sites have differences in blood flow and greater thickness than musculo-tendinous sites.43,44 In parallel, underlying bony structures in the musculo-tendinous junctions may provide increased tissue hardness resulting in higher PPT than in the muscle belly. Interestingly, topographical pressure pain maps have also revealed that pressure pain hyperalgesia associated with experimentally induced DOMS is higher in the muscle belly than in musculo-tendinous junctions. This new information is crucial for future studies investigating differences in pressure pain sensitivity among adults suffering from musculoskeletal pain.
Second, it has also been hypothesized that heterogeneous distribution of sensitivity to pressure may contribute to a better understanding of the pain sensitisation mechanisms associated with some chronic pain conditions. For instance, topographical pressure pain sensitivity maps have revealed similar spatial heterogeneity in mechanical sensitivity among cleaners. Furthermore, cleaners with long-term sickness absence are characterized by significant pressure hyperalgesia compared with cleaners with no long-term sickness absence.45 Ge et al did not find significant differences in topographical pressure pain sensitivity maps in the neck–shoulder and elbow regions between computer users with and without neck pain symptoms.46 Topographical pressure pain sensitivity maps of the knee joint have also been used for the classification of patients with knee osteoarthritis, suggesting that patients with high levels of knee pain associated with low X-ray changes showed particular signs of sensitization such as generalized pressure pain hyperalgesia around the knee, facilitation of temporal summation, reduction of conditioned pain modulation function, and high pain sensitivity index.47 Finally, it has previously been suggested that the extensor carpi radialis brevis muscle can play an important role in the pathogenesis of lateral epicondylalgia. The studies using topographical pressure sensitivity maps have confirmed that this muscle is the most sensitive to pressure but not to thermal stimuli in adults with lateral epicondylalgia26 and in asymptomatic adults before and after eccentric exercise,40,41 supporting that DOMS can be used as a proper experimentally induced model of lateral epicondylalgia. Therefore, topographical pressure sensitivity maps have provided new information related to sensitization mechanisms in chronic pain conditions, which could also be related to different therapeutic approaches.
As such, a small number of clinical trials have investigated changes in topographical pressure pain sensitivity maps. Madeleine et al observed that the use of shock-absorbing insoles in young soccer players training on artificial turf resulted in a large increase in PPTs in the plantar surface of the foot as depicted by topographical pressure pain sensitivity maps of the foot.48 These authors also showed that ergonomics interventions can be monitored using pressure pain sensitivity maps.48 Recently, Balaguier et al reported that a program of adapted physical activity applied to vineyard workers experiencing low back pain decreased the mechanical pain sensitivity in the low back as depicted by topographical pressure sensitivity maps.49 Addressing translational changes, Kawczynski et al showed that specific DOMS reduction training decreased mechanical pain hyperalgesia in the lower extremity 48 hours after a game in professional soccer players as compared with standard recovery training or no physical activity.50 Another study related to sport sciences addressed the long-term effect of artificial turf among soccer players delineating a long-term favorable trait of artificial turf.30
In summary, the application of topographical pressure pain sensitivity maps enables benchmarking of the efficacy of therapeutic, ergonomics, or training interventions. Furthermore, experimentally induced pain studies and clinical trials are warranted.
Conclusion
This narrative review presents a new imaging modality, that is, topographical pressure pain sensitivity maps. Pain is associated with various extents of hyperalgesia spreading over different body regions. These differences in sensitivity can be monitored using topographical pressure pain sensitivity maps. For this purpose, researchers need to define a grid covering the region of interest and, therefore, use anatomical markers or anthropometric values. Then, the assessed PPTs over the possible locations of interest are interpolated in order to generate topographical pressure pain sensitivity maps. This imaging technique has been used in different disciplines like exercise physiology, neurology, physical therapy, occupational medicine, oncology, orthopedics, and sport sciences targeting various body regions like the scalp, low back, neck–shoulder, and upper and lower extremities. The reviewed studies have shown that topographical pressure pain sensitivity maps can be used to assess the extent of hyperalgesia in clinical populations and monitor the changes in pain sensitivity following interventions. Future development may include the standardization of pressure pain sensitivity maps to specific muscles or body regions. Moreover, a better understanding of the underlying structures of the assessed PPTs may contribute to explain the varying extent of hyperalgesia in both experimentally induced and disease-associated pain conditions.
Acknowledgment
This work is dedicated to the memory of Dr Hong-You Ge for his contribution to research in pain imaging techniques.
Author contributions
All authors contributed toward the literature search and review, data analysis, drafting and revising the paper, gave final approval of the version to be published, and agree to be accountable for all aspects of the work.
Disclosure
The authors report no conflicts of interest in this work.
References
International Association for the Study of Pain. IASP Taxonomy. Available at: https://www.iasp-pain.org/Taxonomy#Pain. Accessed January 1, 2017. | ||
Graven-Nielsen T, Arendt-Nielsen L. Assessment of mechanisms in localized and widespread musculoskeletal pain. Nat Rev Rheumatol. 2010;6:599–606. | ||
Balaguier R, Madeleine P, Vuillerme N. Is one trial sufficient to obtain excellent pressure pain threshold reliability in the low back of asymptomatic individuals? A test-retest study. PLoS One. 2016;11:e0160866. | ||
Balaguier R, Madeleine P, Vuillerme N. Intra-session absolute and relative reliability of pressure pain thresholds in the low back region of vine-workers: effect of the number of trials. BMC Musculoskelet Disord. 2016;17:350. | ||
Andersen S, Petersen MW, Svendsen AS, Gazerani P. Pressure pain thresholds assessed over temporalis, masseter, and frontalis muscles in healthy individuals, patients with tension-type headache, and those with migraine: a systematic review. Pain. 2015;156:1409–1423. | ||
Fingleton C, Smart K, Moloney N, Fullen BM, Doody C. Pain sensitization in people with knee osteoarthritis: a systematic review and meta-analysis. Osteoarthritis Cartilage. 2015;23:1043–1056. | ||
Binderup A, Arendt-Nielsen L, Madeleine P. Pressure pain threshold mapping: a new imaging modality of muscle sensitivity to pain. IEEExplore. 2008;1–4. DOI 10.1109/AISPC.2008.4460549. | ||
Fernández-de-las-Peñas C, Ge HY, Cuadrado ML, Madeleine P, Pareja JA, Arendt-Nielsen L. Bilateral pressure pain sensitivity mapping of the temporalis muscle in chronic tension type headache. Headache. 2008;48(7):1067–1075. | ||
Binderup AT, Arendt-Nielsen L, Madeleine P. Pressure pain threshold mapping of the trapezius muscle reveals heterogeneity in the distribution of muscular hyperalgesia after eccentric exercise. Eur J Pain. 2010;14:705–712. | ||
Nie HL, Graven-Nielsen T, Arendt-Nielsen L. Spatial and temporal summation of pain evoked by mechanical pressure stimulation. Eur J Pain. 2009;13:592–599. | ||
Nie HL, Madeleine P, Arendt-Nielsen L, Graven-Nielsen T. Temporal summation of pressure pain during muscle hyperalgesia evoked by nerve growth factor and eccentric contractions. Eur J Pain. 2009;13:704–710. | ||
Nie HL, Kawczynski A, Madeleine P, Arendt-Nielsen L. Delayed onset muscle soreness in neck/shoulder muscles. Eur J Pain. 2005;9:653–660. | ||
Fernández-de-las-Peñas C, Madeleine P, Caminero AB, Cuadrado ML, Arendt-Nielsen L, Pareja JA. Generalized neck-shoulder hyperalgesia in chronic tension-type headache and unilateral migraine assessed by pressure pain sensitivity topographical maps of the trapezius muscle. Cephalalgia. 2010;30(1):77–86. | ||
Binderup AT, Arendt-Nielsen L, Madeleine P. Cluster analysis of pressure pain threshold maps from the trapezius muscle. Comput Methods Biomech Biom Engin. 2010;13:677–683. | ||
Ge HY, Fernández-de-las-Peñas C, Madeleine P, Arendt-Nielsen L. Topographical mapping and mechanical pain sensitivity of myofascial trigger points in the infraspinatus muscle. Eur J Pain. 2008;12(7):859–865. | ||
Ge HY, Nie H, Madeleine P, Danneskiold-Samsoe B, Graven-Nielsen T, Arendt-Nielsen L. Contribution of the local and referred pain from active myofascial trigger points in fibromyalgia syndrome. Pain. 2009;147:233–240. | ||
Andersen H, Ge HY, Arendt-Nielsen L, Danneskiold-Samsoe B, Graven-Nielsen T. Increased trapezius pain sensitivity is not associated with increased tissue hardness. J Pain. 2010;11:491–499. | ||
Fernandez-de-las-Peñas C, Madeleine P, Cuadrado ML, Ge HY, Arendt-Nielsen L, Pareja JA. Pressure pain sensitivity mapping of the temporalis muscle revealed bilateral pressure hyperalgesia in patients with strictly unilateral migraine. Cephalalgia. 2009;29:670–676. | ||
Caro-Moran E, Fernandez-Lao C, Diaz-Rodriguez L, Cantarero-Villanueva I, Madeleine P, Arroyo-Morales M. Pressure pain sensitivity maps of the neck-shoulder region in breast cancer survivors. Pain Med. 2016;17:1942–1952. | ||
Hosseinzadeh M, Andersen OK, Arendt-Nielsen L, Madeleine P. Pain sensitivity is normalized after a repeated bout of eccentric exercise. Eur J Appl Physiol. 2013;113:2595–2602. | ||
Binderup AT, Arendt-Nielsen L, Madeleine P. Pressure pain sensitivity maps of the neck-shoulder and the low back regions in men and women. BMC Musculoskelet Disord. 2010;11:234. | ||
Jurcak V, Tsuzuki D, Dan I. 10/20, 10/10, and 10/5 systems revisited: Their validity as relative head-surface-based positioning systems. Neuroimage. 2007;34(4):1600–1611. | ||
Ribeiro IL, Camargo PR, Alburquerque-Sendín F, Madeleine P, Fernández-de-las-Peñas C, Salvini TF. Topographical pressure pain sensitivity maps of the shoulder region in individuals with subacromial pain syndrome. Man Ther. 2016;21:134–143. | ||
Li X, Petrini L, Defrin R, Madeleine P, Arendt-Nielsen L. High resolution topographical mapping of warm and cold sensitivities. Clin Neurophysiol. 2008;119:2641–2646. | ||
Fernández-de-las-Peñas C, Madeleine P, Martinez-Perez A, Arendt-Nielsen L, Jimenez-Garcia R, Pareja JA. Pressure pain sensitivity topographical maps reveal bilateral hyperalgesia of the hands in patients with unilateral carpal tunnel syndrome. Arthritis Care Res. 2010;62(8):1055–1064. | ||
Ruiz-Ruiz B, Fernández-de-las-Peñas C, Ortega-Santiago R, Arendt-Nielsen L, Madeleine P. Topographical pressure and thermal pain sensitivity mapping in patients with unilateral lateral epicondylalgia. J Pain. 2011;12:1040–1048. | ||
Prados-Frutos JC, Ruiz-Ruiz B, De-la-Llave-Rincon AI, Arendt-Nielsen L, Madeleine P, Fernandez-de-las-Peñas C. Anatomical association between wrist extensor musculature and topographical pain sensitivity maps of the elbow area. J Manipulative Physiol Ther. 2012;35:402–406. | ||
Tornero-Caballero MC, Salom-Moreno J, Cigarán-Méndez M, Morales-Cabezas M, Madeleine P, Fernández-de-las-Peñas C. Muscle trigger points and pressure pain sensitivity maps of the feet in women with fibromyalgia syndrome. Pain Med. 2016;17(10):1923–1932. | ||
Arendt-Nielsen L, Nie HL, Laursen MB, et al. Sensitization in patients with painful knee osteoarthritis. Pain. 2010;149(3):573–581. | ||
Domínguez-Martin MA, López-Ruiz F, Valenza G, Fernández-de-las-Peñas C, Madeleine P. Differences in pressure pain sensitivity of elite male soccer players on artificial turf and natural grass. Sports Tech. 2013;6(1):22–28. | ||
Shepard DL. A two-dimensional interpolation function of irregularly-spaced data. In: Proceedings of the 23rd National Conference of the Association for Computing Machinery. Princeton, NJ: ACM; 1968:517–524. | ||
Franke R, Nielson G. Smooth interpolation of large sets of scattered data. Int J Numer Methods Eng. 1980;15:1691–1704. | ||
Clough RW, Tocher JL. Finite element stiffness matrices for analysis of plates in bending. In: Proceedings of Conference on Matrix Methods in Structural Analysis. Ohio: Air Force Institute of Technology; 1965. | ||
Palacios-Ceña M, Castaldo M, Wang K, et al. Topographical pressure pain sensitivity maps of the temporalis muscle in people with frequent episodic and chronic tension-type headache. Pain Pract. 2017 Epub Feb 22. | ||
Fernández-de-las-Peñas C, Caminero AB, Madeleine P, et al. Multiple active myofascial trigger points and pressure pain sensitivity maps in the temporalis muscle are related in chronic tension type headache. Clin J Pain. 2009;25:506–512. | ||
Wang C, Ge HY, Ibarra JM, Yue SW, Madeleine P, Arendt-Nielsen, L. Spatial pain propagation over time following painful glutamate activation of latent myofascial trigger points in humans. J Pain. 2012;13:537–545. | ||
Cuadrado ML, Valle B, Fernández-de- las-Peñas C, et al. Pressure pain sensitivity of the scalp in patients with nummular headache: a cartographic study. Cephalalgia. 2010;30:200–206. | ||
Barón J, Ruíz M, Palacios-Ceña M, et al. Differences in topographical pressure pain sensitivity maps of the scalp between patients with migraine and healthy controls. Headache. 2017;57:226–235. | ||
Kawczyński A, Samani A, Fernández-de-las-Peñas C, Chmura J, Madeleine P. Sensory mapping of the upper trapezius and consecutive sessions of eccentric exercise. J Strength Cond Res. 2012;26:1577–1583. | ||
Fernández-Carnero J, Binderup AT, Ge HY, Fernández-de-las-Peñas C, Arendt-Nielsen L, Madeleine P. Pressure pain sensitivity mapping in experimentally induced lateral epicondylalgia. Med Sci Sports Exerc. 2010;42:922–927. | ||
Delfa-de-la-Morena JM, Samani A, Fernández-Carnero J, Hansen EA, Madeleine P. Pressure pain mapping of the wrist extensors after repeated eccentric exercise at high intensity. J Strength Cond Res. 2013;27:3045–3052. | ||
Kawczynski A, Mroczek D, Chmura P, Madeleine P, Chmura J. Influence of a professional football game on delayed onset muscle soreness development in dominant and non-dominant legs. Polish J Sport Med. 2013;29:55–61. | ||
Andersen H, Arendt-Nielsen L, Daneskiold-Sansoe B, Graven- Nielsen T. Pressure pain sensitivity and hardness along human normal and sensitized muscle. Somatosens Mot Res. 2006;23:97–109. | ||
Adigozali H, Shadmehr A, Ebrahimi E, Rezasoltani A, Naderi F. Ultrasonography for the assessment of the upper trapezius properties in healthy females: a reliability study. Muscles Ligaments Tendons J. 2016;6:167–172. | ||
Binderup AT, Holtermann A, Søgaard K, Madeleine P. Pressure pain sensitivity maps, self-reported musculoskeletal disorders and sickness absence among cleaners. Int Arch Occup Environ Health. 2011;84:647–654. | ||
Ge HY, Vangsgaard S, Omland Ø, Madeleine P, Arendt-Nielsen L. Mechanistic experimental pain assessment in computer users with and without chronic musculoskeletal pain. BMC Musculoskelet Disord. 2014;15:412. | ||
Arendt-Nielsen L, Egsgaard LL, Petersen KK, et al. A mechanism-based pain sensitivity index to characterize knee osteoarthritis patients with different disease stages and pain levels. Eur J Pain. 2015;19:1406–1417. | ||
Madeleine P, Hoej B, Fernández-de-las-Peñas C, Rathleff M, Kaalund S. Pressure pain sensitivity changes after usage of shock-absorbing insoles among young soccer players training on artificial turf: a randomized controlled trial. J Orthop Sports Phys Ther. 2014;44:587–594. | ||
Balaguier R, Madeleine P, Vuillerme N. Effects of a worksite supervised adapted physical activity program on trunk muscle endurance, flexibility and pain sensitivity among vineyard workers. J Agromedicine. 2017;22:200–214. | ||
Kawczynski A, Mroczek D, Frąckiewicz D, et al. Effects of two recovery procedures after a football game on sensory and biochemical markers. J Sports Med Phys Fitness. 2014;54:394–402. |
 © 2018 The Author(s). This work is published and licensed by Dove Medical Press Limited. The
full terms of this license are available at https://www.dovepress.com/terms
and incorporate the Creative Commons Attribution
- Non Commercial (unported, 3.0) License.
By accessing the work you hereby accept the Terms. Non-commercial uses of the work are permitted
without any further permission from Dove Medical Press Limited, provided the work is properly
attributed. For permission for commercial use of this work, please see paragraphs 4.2 and 5 of our Terms.
© 2018 The Author(s). This work is published and licensed by Dove Medical Press Limited. The
full terms of this license are available at https://www.dovepress.com/terms
and incorporate the Creative Commons Attribution
- Non Commercial (unported, 3.0) License.
By accessing the work you hereby accept the Terms. Non-commercial uses of the work are permitted
without any further permission from Dove Medical Press Limited, provided the work is properly
attributed. For permission for commercial use of this work, please see paragraphs 4.2 and 5 of our Terms.