Back to Archived Journals » Reports in Medical Imaging » Volume 9
Spotlight on multiparametric magnetic resonance imaging in prostate cancer management: current perspectives
Authors Hassanzadeh E, Tempany CM
Received 28 May 2016
Accepted for publication 17 September 2016
Published 22 November 2016 Volume 2016:9 Pages 7—16
DOI https://doi.org/10.2147/RMI.S104611
Checked for plagiarism Yes
Review by Single anonymous peer review
Peer reviewer comments 2
Editor who approved publication: Professor Tarik Massoud
Elmira Hassanzadeh, Clare M Tempany
Division of Abdominal Imaging and Intervention, Department of Radiology, Brigham and Women’s Hospital, Harvard Medical School, Boston, MA, USA
Abstract: Clinical behavior of prostate cancer, the most common noncutaneous cancer in men, ranges from a nonsignificant indolent tumor to an aggressive cancer. Prostate cancer is subject to overdiagnosis and overtreatment, making screening, diagnosis, and treatment planning a controversial issue. Recently, even noninvasive simple screening methods such as prostate-specific antigen level and digital rectal examination are no longer recommended for screening as it has resulted in no reduction in mortality. Diagnosis and further treatment planning, however, are still based on a random transrectal ultrasound-guided biopsy, an invasive method with controversial efficacy that has been deemed as unnecessarily revealing nonsignificant tumors. Magnetic resonance (MR)-based techniques are emerging that provide noninvasive tools that are promising in the detection of clinically significant lesions and accurate staging. Moreover, MR imaging improves the performance of image-guided procedures, both in diagnosis and therapy. We focus here on recent advances in multiparametric MR imaging in prostate cancer diagnosis and provide a brief overview of other emerging techniques.
Keywords: multiparametric MRI, prostate cancer, image-guided intervention, PIRADS
Introduction
Prostate cancer is the most common noncutaneous cancer and the second most common cause of death due to cancer in men in USA.1 The clinical behavior of prostate cancer ranges from an aggressive tumor with high mortality to an indolent lesion that seldom becomes significant. The challenge is to detect and promptly treat the aggressive tumors while maintaining a noninvasive or observational approach to indolent ones. Based on the current guidelines, men with clinical suspicion of prostate cancer based on an abnormal physical examination or high or rising prostate-specific antigen undergo random systematic transrectal ultrasound (TRUS)-guided biopsies.2 The nontargeted nature of this approach raises concerns as to its accuracy and efficacy.
Magnetic resonance (MR)-based techniques have high soft tissue resolution and the ability to visualize the functional parameters. They have long been used in certain cases for pretreatment staging and surgical or radiation therapy planning. The most promising approach to prostate cancer detection in vivo is a multiparametric MR imaging (mpMRI), including anatomical and functional sequences. It is specifically useful for the detection of clinically significant disease or one containing Gleason pattern 4. mpMRI has become very significant in targeted biopsy of the prostate. It is now possible to move beyond the systematic, nontargeted approach using TRUS, which has been the standard for so many years. New biopsy approaches include MR integration with cognitive, fusion, or in-bore techniques. It is also trending to integrate MRI into image-guided focal therapy for index lesions with imaging to guide, target, and monitor therapies, such as laser, cryotherapy, or MR-guided focused ultrasound ablation. As the accuracy of mpMRI increases with better MR techniques and improved interpretative skills, the role will expand. Newer techniques tend to be based more on quantitative metrics. Other MR-based modalities are also emerging and include, but are not limited to, hyperpolarized 13C MR and MR elastography (MRE).
We provide here an overview of mpMRI and other emerging techniques.
Multiparametric MRI
mpMRI combines functional imaging sequences including dynamic IV contrast enhanced, and in some cases, spectroscopic imaging with the diffusion-weighted and T2-weighted (T2W) anatomical sequences. Meta-analyses support the high diagnostic accuracy of mpMRI at both 1.5 and 3 T, particularly in the detection of “clinically significant” cancers that merit further investigations and treatments.3,4 Generally, a lesion with a Gleason score ≥7, volume >0.5 cc, or extraprostatic extension is considered “clinically significant”.5 In order to systemize the MR imaging techniques and their interpretation, to provide uniform mpMRI evaluation, the Prostate Imaging Report And Data System (PIRADS) has been developed based on expert consensus.2 The latest version of PIRADS, Version 2 (v2), is based on the combination of T1-weighted (T1W), T2W, diffusion-weighted image (DWI)/apparent diffusion coefficient (ADC) map, and dynamic contrast-enhanced (DCE) imaging.5 MR spectroscopy (MRSI) is not included in PIRADS version 2, in contradistinction to version 1. MRSI techniques were deemed too demanding and lacking in reliability and reproducibility to allow inclusion. The technique adds 15–20 minutes to the scanning time and requires postprocessing with dedicated software. These issues led the leadership committee to exclude MRSI form PIRADS v2. Table 1 gives an example of a prostate mpMRI protocol that is generally in line with PIRADS v2 recommendations.
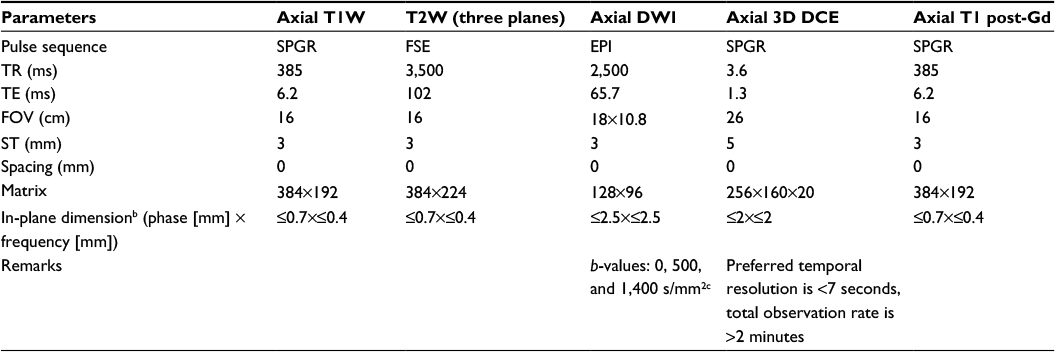 | Table 1 Suggested multiparametric prostate MRI protocol at 3 Ta Notes: aAll sequences utilize a body array coil and an ERC, except for the DWI, which uses only the ERC; bPIRADS v2 recommendations; cPIRADS v2: lowest 50–100, highest 800–1,000. Abbreviations: MRI, magnetic resonance imaging; T1W, T1 weighted; T2W, T2 weighted; DWI, diffusion-weighted imaging; 3D DCE, three-dimensional dynamic contrast enhanced; Gd, gadolinium; FSE, fast spin echo; EPI, single-shot echo planar imaging; SPGR, spoiled gradient echo; TR, repetition time; TE, echo time; ms, millisecond; FOV, field of view; ST, slice thickness; PIRADS v2, Prostate – Imaging Reporting and Data System Version 2; ERC, endorectal coil. |
Increasing the magnetic field strength from 1.5 to 3 T improves signal to noise ratio (SNR) and can be used to increase spatial and/or temporal resolutions. However stronger magnetic fields introduce susceptibility artifacts and signal heterogeneity. PIRADS v2 mostly favors imaging at 3 T than 1.5 T as the technical advances of current scanners have overcome the limitations at 3 T. The use of endorectal coil (ERC) at any given magnetic field strength increases the SNR, which is mostly helpful in inherently low SNR sequences such as DWI and DCE. However ERC may deform the gland, introduce artifact, and may be uncomfortable to use, all of which make it less favorable for use. There are measures other than ERC that can increase the SNR, including the increasing the receiver bandwidth, the number of external phased array coil elements, and radiofrequency channels. Therefore, PIRADS v2 recommends that each practice decide on the use of ERC based on their scanners specifications, patient preference, cost, and availability, with the goal of optimizing imaging protocol.5
T2 weighted imaging
T2W images (T2WIs) demonstrate the anatomy of prostate gland with a high SNR. It provides a definition of the zonal anatomy: the peripheral and transition zones (TZs) and fibromuscular stroma (Figure 1). Peripheral zone (PZ) tumors typically appear as hypointense (low signal) foci against the uniform hyperintensity of surrounding healthy glandular tissue (Figure 2B). Centrally located tumors include lesions in the TZ, anterior fibromuscular stroma, and central zone. TZ tumors are characterized as ill-defined amorphous or lenticular-shaped lesions that are hypointense against the background of intermediate heterogeneous signal intensity of the TZ, which may decrease lesion conspicuity compared to PZ lesions. PIRADS v2 uses a 5-score rating scale to describe the suspicious areas within the prostate, from 1, considered as benign, to 5, considered as the most suspicious of cancer. According to PIRADS v2, in the PZ, a circumscribed, homogenous moderately hypointense focus/mass receives a score of 4 if it is <1.5 cm in its greatest dimension and is confined to the prostate; definite extraprostatic extension/invasive behavior or a greatest dimension of ≥1.5 cm is an indication for a score of 5. In the TZ, the description for a high score lesion (4 or 5) is a lenticular or noncircumscribed, homogeneous, moderately hypointense area. Again, a cutoff of 1.5 cm for the greatest dimension or extraprostatic extension differentiates between scores 4 and 5.5
 | Figure 1 PIRADS v2. Notes: (A) Thirty-nine zones of prostate; Reproduced from Weinreb JC, Barentsz JO, Choyke PL et al. PI-RADS Prostate Imaging-Reporting and Data System: 2015, Version 2. Abbreviations: PIRADS v2, Prostate – Imaging Reporting and Data System Version 2; DWI, diffusion-weighted imaging; DCE, dynamic contrast enhanced; T2W, T2 weighted; PZ, peripheral zone; TZ, transition zone; CZ, central zone; US, urethra; AFS, anterior fibromuscular stroma. |
Low-signal intensity lesions that are well encapsulated on T2WIs are considered benign and are most commonly due to benign prostatic hyperplasia.6 Prostatitis can also be a focal area of low signal, typically with a linear, wedge shape, or can be ill-defined and is seen only on T2W. Hemorrhage can appear as a low-signal lesion of T2W and will have a hyperintense signal in the corresponding location on T1W images. Therefore, simultaneous T1W evaluation is recommended for detecting evidence of previous hemorrhage, which is typically seen after a core needle biopsy (Figure 2A).5 Generally, an interval of six to ten weeks between the biopsy and MRI can be recommended so as to eliminate the postbiopsy hemorrhage artifact. Some centers find this delay impractical and do not comply with the recommended protocol. Visual qualitative assessment is the standard method for T2WI interpretation. Quantitative methods for mapping T2 values are also available and seem promising for differentiating between healthy and malignant structures.7
 | Figure 2 A Gleason grade 4+4 prostate cancer in the right mid-gland at posterolateral and posteromedial of the PZ (chevron) in a 55-year-old man. Notes: The lesion measures 2.11 cm in its greatest dimension. (A) T1-weighted image. No hemorrhage seen; (B) T2-weighted image; (C) diffusion-weighted image, b=1,400 s/mm2; Abbreviation: PIRADS v2, Prostate – Imaging Reporting and Data System Version 2; DWI, diffusion-weighted imaging; DCE, dynamic contrast enhanced; T2W, T2 weighted; ADC, apparent diffusion coefficient; PZ, peripheral zone. |
Multiplanar T2WI acquisition allows accurate staging evaluation for assessing extracapsular involvement.8 By applying the current acquisition techniques at 3T, T2WI can detect lesions as small as 3 mm. Three-dimensional (3D) T2W can offer a shortened exam time with one acquisition replacing the multiple 2D acquisitions.9,10 The downside has been the lack of adequate spatial resolution; however, these techniques continue to evolve and may indeed be applicable in the future.
According to PIRADS v2, T2WIs are the primary sequence for assessment of TZ lesions.5 This is the optimal approach when assessing the gland in a treatment-naive patient. However, in men who have had prior treatment, when assessing for tumor recurrence (as in postradiation), there may be gland atrophy and fibrosis. T2WI should be evaluated in combination with functional sequences in order to reach acceptable diagnostic accuracy.
DWI
The most important sequence for MR imaging of the prostate is DWI, which quantifies the diffusion pattern of water molecules in regard to tissue substructures in different degrees of diffusion weighting that are known as b-values in s/mm2 unit.11 A normal prostate gland allows free diffusion of water molecules whereas densely packed tissue does not; therefore, a tumor appears as the high intensity focus (Figure 2C). In addition, a growing body of literature suggests that DWI signal also relates closely with epithelial gland volume as well as cell density.12
DWI-derived ADC maps will show a corresponding lesion as an area of low signal representing restricted diffusion. These images are less likely to be affected by residual T2W data and depict the diffusion restriction of the tumor as hypointensity (Figure 2D). Quantitative ADC values can be measured to aid in detecting suspicious regions and correlate with tumor aggressiveness.13 Studies have demonstrated an inverse relationship between ADC values and the Gleason grade of a tumor.13–16 ADC values can differentiate low grade tumors (Gleason <6) from intermediate–high grade tumors (Gleason ≥3+4).17 ADCratio (ADCtumor divided by ADCbenign) is another measure that significantly improves the accuracy of Gleason grade discrimination compared with that of using ADCtumor alone.18–20 In addition, the utility of ADC entropy for characterizing the Gleason 4 component of an overall Gleason 7 lesion seems to be promising.21 Results of a very recent meta-analysis reveal moderate accuracy of ADC values in differentiating high-risk form low-risk prostate cancer.22 ADC also seems to improve the accuracy of detecting an extracapsular extension of the tumor compared with using T2W alone.23
The recently published results of a 9-year follow-up in patients under active surveillance suggest that ADC is a useful marker in selecting patients for active surveillance and may in fact replace the repeated biopsy in this population.24
However, PIRADS v2 relies only on visual evaluation of ADC maps as defining the optimal ADC value cutoff may be challenging.5 A focus with the greatest dimension of <1.5 cm that is confined to the prostate, and is markedly hypointense on ADC, and markedly hyperintense on high b-value DWI receives a PIRADS v2 score of 4. Definite extraprostatic extension/invasive behavior or a greatest dimension of ≥1.5 cm is an indication of a PIRADS v2 score of 5.5 Lower b-value DW images hold additional T2W data that may obscure the lesion’s conspicuity, requiring higher b-values for higher tumor to tissue contrast.25 The application of ultrahigh b-values (>1,500) can have some technical difficulties; as the b-value increases, the SNR decreases in a given magnetic field strength. Alternatively, various models of computed high b-value DWI using multiple acquired low b-value images that are comparable to acquired high b-value images have been introduced and are superior to standard ADC maps in terms of lesion conspicuity. It is of note that the computed images contain no information that is not present on the low b-value-acquired scans.26
The ADC is calculated with a monoexponential decay model that assumes a free/Gaussian diffusion pattern of molecules. As the b-value exceeds 1,000 s/mm2, the diffusion reveals non-Gaussian behavior and other models are needed for analysis. Diffusion kurtosis imaging is one of the successful non-Guassian diffusion weighted models that reveals the diffusion coefficient and apparent diffusion kurtosis. Recent studies suggest the better performance of diffusion kurtosis imaging in detection of prostate cancer and better correlation with aggressiveness compared to standard DWI.27
One DWI challenge is the inherent susceptibility of the DW images to distortion. This issue is most prominent when either the rectum is filled with air/stool or when using air-inflated ERC, and this can be addressed in several ways, including preimaging enemas, acquiring multiple b-values, higher b-values, and not using ERC.28 Rigid reusable ERC and reduced field of view excitation techniques are among recent promising solutions.29 DWI improves the diagnostic performance alone or when added to T2W.30,31 The most recent meta-analysis of DWI performance, consistent with previous studies, revealed an area under the receiver operating characteristic curve (AUROC) of 0.89 based on a 95% confidence interval (CI), a sensitivity of 62%, and a specificity of 90%; pooled positive likelihood ratio and negative likelihood ratio were 5.83 and 0.3, respectively.30,31 T2WI alone has an AUROC, sensitivity, and specificity of 0.75, 0.6, and 0.76, respectively.30 Moreover, DWI is superior to T2W and DCE for the measurement of cancer volume, which is an important indicator of cancer significance.32
DCE
Dynamic contrast enhancement MRI following IV administration of a gadolinium contrast agent assesses tissue perfusion over time.33 Due to neovascularization, cancerous tissue will typically show early enhancement and washout compared to that of adjacent healthy tissue. DCE images can be evaluated visually or by enhancement curve type analysis. There are three curve patterns: type 1, steady enhancement, usually benign; type 2, plateau of signal intensity, suspicious lesion; and type 3, early enhancement and washout of signal intensity, a pattern most commonly associated with cancer.34 A few semiquantitative parameters can be derived from curve analysis: time to peak, max slope, and area under the curve (AUC). Typically, tumors have decreased time to peak, increased max slope, and increased AUC. There are debates as to the superiority of curve typing over simple visual evaluation. In fact, a meta-analysis failed to find a significant difference between visual and nonvisual analysis,35 and a recent study showed poor performance of curve type analysis in detection of prostate cancer.36
Quantitative parameters can also be calculated from DCE-derived pharmacokinetic maps. Typical parameters include: ktrans, representing forward transfer of the contrast agent from vasculature to the interstitial space; Kep, representing backward leakage of contrast from interstitial space to vasculature; and ve, fractional volume of the interstitial space per tissue volume.37 Color-coded visualization is available using commercial software; however, the lack of the clear cutoffs for these parameters make them less incorporable in clinical practice. PIRADS v1 did include enhancement curve analyses, without including the pharmacokinetic metrics.
PIRADS v2 steering team expert consensus favors including DCE in the mpMRI protocol although interpretational value (only the visual assessment) would be secondary to that of T2WI and DWI (Figure 2E). PIRADS v2 positive-DCE is defined as a visual focal enhancement earlier than or contemporaneously with enhancement of adjacent normal prostatic tissues and should correspond to suspicious finding on T2W and/or DWI. A negative DCE is characterized by no early enhancement, or diffuse enhancement not corresponding to a focal finding on T2 and/or DWI, or focal enhancement corresponding to a lesion demonstrating features of benign prostatic hyperplasia on T2W.5
MRSI
Altered metabolism in prostate cancer is the basis for differentiating healthy versus cancerous tissue using magnetic resonance spectroscopic imaging (MRSI). Normal prostate tissue has a high citrate (Cit) concentration, whereas tumors typically demonstrate increased choline (Cho) levels.38
A noninvasive method for evaluating the chemical compositions of a tissue, 1H-MRSI, is based on quantification of 1H resonance of a few metabolites that accumulate at high concentration in a tissue. To interpret prostate 1H MRSI spectra, qualitative or quantitative approaches have been used. Qualitative methods visually compare the choline and citrate peaks,2 whereas qualitative approaches generate metabolite ratios such as choline/creatine or (Cho + Cr)/Cit.39 Performance of MRSI seems dependent on the approach selected for data evaluation. Prospective multicenter studies using qualitative methods failed to show additional value of MRSI to T2W sequence in prostate cancer detection.40 The same disappointing results have been observed in a newer investigation of the role of MRSI in mpMRI.41 However, quantitative metabolite ratio analysis has been successfully used in tumor aggressiveness assessment and has shown a performance comparable to that of DWI and DCE (Figure 3).42 The method’s performance has been limited to research studies.
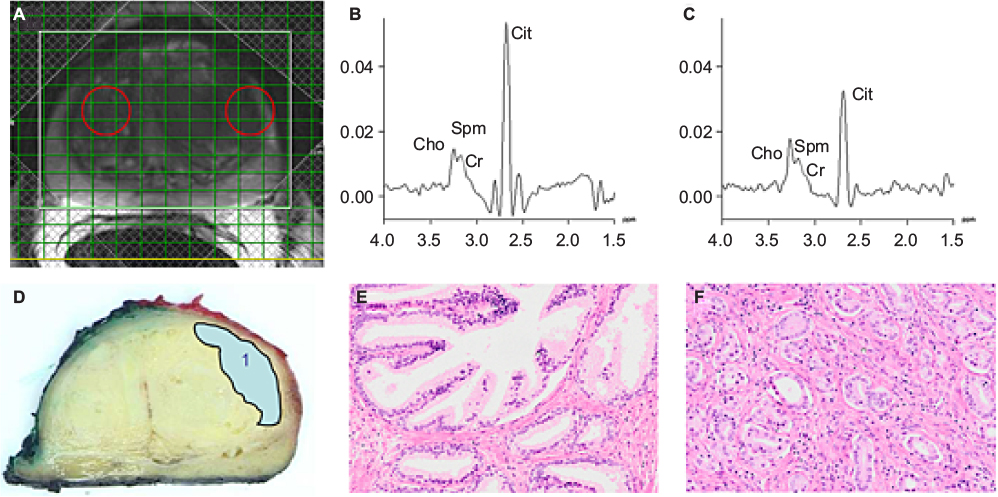 | Figure 3 (A) T2-weighted image of the prostate of a 53-year-old man with biopsy-proven prostate cancer in the left TZ; (B) spectrum of normal PZ tissue (left sphere in [A]) containing Cho, Cr, Spm, and Cit resonances; (C) spectrum of tumor tissue (right sphere in [A]) showing increased Cho and decreased Cit levels compared with (B). The spectra were acquired on a 3-T system using TE = 145 ms and TR = 750 ms; (D) corresponding slice of the excised prostate indicating the tumor. Hematoxylin and eosin-stained normal tissue (E) and tumor tissue (F) of the patient. Note: Copyright © 2014. John Wiley and Sons. Reproduced from Kobus T, Wright AJ, Scheenen TWJ, Heerschap A. Mapping of prostate cancer by 1H MRSI. NMR Biomed. 2014;27:39–52.69 Abbreviations: TR, repetition time; TE, echo time; Cho, choline; Cr, creatine; Spm, spermine; Cit, citrate; PZ, peripheral zone; TZ, transition zone. |
Seeking standardized cutoffs for data evaluation is a promising, yet challenging, issue. The latest standardized cutoff values are still dependent on the acquisition protocol. Developing generalizable methods to take acquisition parameters into account is a challenging process.39 The need for extra equipment, postprocessing expertise, and long scan time is the common drawback of MRSI. The European version of PIRADS considered MRSI as an optional sequence in mpMRI and recommended a scoring based on either qualitative or quantitative evaluation.2 In PIRADS v2, however, expert consensus refrained from including MRSI in the mpMRI protocol.5
The role of mpMRI in prostate cancer
Prostate mpMRI is the optimal imaging modality for tumor detection, localization, aggressiveness evaluation, staging, and treatment planning. Meta-analyses on prostate cancer detection by mpMRI revealed a specificity of 0.88 (95% CI, 0.82–0.92) and sensitivity of 0.74 (95% CI, 0.66–0.81), with negative predictive values ranging from 0.65 to 0.94.3 The negative predictive values for excluding significant disease ranged from 63% to 98% that, although variable, is considered high.4 MRI is promising in the initial evaluation of the patients with clinical suspicion of prostate cancer who are considered to undergo active surveillance. It is under investigation as a replacement for repeat biopsies in patients on AS with stable prostate-specific antigen measurements;24 however, there is currently no robust evidence to support this recommendation.43 MRI can be used to increase the efficacy and accuracy of invasive methods such as biopsy or therapeutic interventions.44,45 MR can guide a biopsy by providing targets for sampling and can be performed in one of several ways. In-bore techniques use direct intraprocedural MR guidance,46,47 and out-of-bore techniques use preprocedural mpMRI to target the suspected regions.48 Preprocedural mpMRI can be translated into intraprocedural images either cognitively or using registration or “fusion” tools to allow target display on ultrasound images in a TRUS biopsy approach. A growing body of literature demonstrated that MR-targeted biopsy (MRTB) improves the diagnostic accuracy of detection of significant prostate cancer in comparison to standard TRUS biopsy.45,48 The overall prostate cancer detection rate using MRTB did not differ from that of random TRUS-guided biopsy. However, MRTB detected more clinically significant cancers (Gleason ≥7) and fewer low-grade cancers.45 Subgroup analysis revealed that mpMRTB detects more significant prostate cancer than TRUS-guided biopsy in men with prior negative biopsy results; however, mpMRTB and TRUS-guided biopsy detect significant prostate cancer equally in biopsy native patients.49–51
Proceeding a biopsy based on the presence of a suspicious region on prebiopsy, mpMRI can increase efficiency: fewer men undergo biopsy and fewer cores are biopsied per gland while maintaining the same significant cancer detection rate.52 Obtaining biopsies representative of true Gleason grade improved the pretreatment risk stratification.46 Yet, the replacement of TRUS biopsy with MRTB cannot be recommended with certitude at this time because of methodological flaws in the studies comparing the two methods.45 The results of two ongoing trials – PICTURE and PROMIS –will reveal level 1 evidence for diagnostic accuracy and thus the role of mpMRI in detection of prostate cancer in men with a clinical suspicion for prostate cancer in the near future.53,54
Recently, there have been substantial improvements in image registration tools. Software such as 3Dslicer (www.slicer.org) efficiently registers/fuses previously acquired mpMRI data on intraprocedural images and improves the accuracy of the biopsy targeting.47
Focal ablative therapies use image guidance to ablate focal areas of prostate cancer within the gland with either heat (laser, high-frequency ultrasound) or cold temperature (cryo), and can be used to treat localized prostate cancer. mpMRI is the most reliable modality for image-guided focal therapies because of its high spatial resolution and accurate tumor detection. In-bore MR-guided therapies include thermal/cryoablation and radioactive seed implantation (brachytherapy).55 Laser ablation is an MR-compatible thermoablation technique and has distinct advantages over other sources of thermal energy: predictability, precision, and low cost. Laser fiber placement in the targeted lesion follows the same steps as MR-guided transperineal biopsy needle placement. The beam intensity can be modified in real time using MR thermal monitoring. The extent of tumor ablation can be assessed with multiplanar anatomical and functional MR sequences.56 MR-guided focused ultrasound is another noninvasive tumor ablation technique. An ultrasound beam can be delivered via transrectal or transurethral transducers. The latter provide more flexibility in targeting the anterior zone lesions.57 mpMRI can also guide cryoablation, a method that was conventionally performed under ultrasound guidance. MR guidance can evaluate the growing ice ball from every anatomical aspect without the shadowing artifact that obscured the visualization using ultrasound. However, MR thermography is less accurate at cold temperatures. Feasibility and efficacy of these techniques have been demonstrated in preliminary studies, and efforts are now focused on reducing the cost and the procedure time that is currently more than three hours.58
MRI has also a role in recurrence detection after therapy. DCE is found to be the best sequence to detect recurrence after radical prostatectomy, focal ablation therapies, as well as external beam radiation therapy.59–61 There is also evidence supporting the utility of DWI plus T2W in detecting recurrence after external beam radiation therapy.62
There are also early indications that MR combined with positron emission tomography imaging with the new second generation prostate-specific membrane antigen agent can help to detect early metastatic disease and may allow for early indication of failing androgen therapy, seen in casteration resistant prostate cancer.63
Emerging MR based techniques for prostate cancer
MRE is a rapidly progressing technique for prostate cancer detection. MRE depicts the mechanical properties of a tissue by evaluating the propagation of the shear wave in it.64 In vivo studies consider MRE as a possible addition to mpMRI performance of prostate cancer detection, and feasibility of the incorporation of MRE in mpMRI has been demonstrated in volunteers.65 Advances in technical aspects of MRI acquisition at higher field strength continue to be achieved. MRI at 7 T is feasible, and image quality is acceptable.66 Hyperpolarized 13C MR also shows great promise allowing assessment of the locoregional metabolism with assessment of aerobic and anaerobic glycolysis.67 Further studies are needed to enable these advances to be incorporated into clinical routines.
Conclusion
mpMRI is the optimal imaging modality for prostate cancer detection, staging, and risk stratification. Based on the major advances in MRI, new applications in image-guided interventions are being tested and applied in the clinic. Technical advances are aimed at reducing acquisition time, improving image resolution, and increasing accessibility and availability. MR has become a robust, reliable, and valuable imaging test in men with or suspected of having prostate cancer.
Acknowledgments
The authors wish to thank Drs Fiona Fennessy and Robert Mulkern for their intellectual contribution to the manuscript. Dr CMT is supported by the following NIH grants: P41-EB015898 and R01-CA111288. Dr EH and CMT are supported by Massachusetts Prostate Cancer Research Grant, Department of Public Health #403516 and AdMeTech foundation.
Author contributions
Both authors have made substantial contributions in the definition of the research line and in the preparation of the manuscript. All authors contributed toward data analysis, drafting and critically revising the paper and agree to be accountable for all aspects of the work.
Disclosure
The authors report no conflicts of interest in this work
References
Siegel RL, Miller KD, Jemal A. Cancer statistics, 2015. CA Cancer J Clin. 2015;65(1):5–29. | ||
Barentsz J, Richenberg J, Clements R, et al. ESUR prostate MR guidelines 2012. Eur Radiol. 2012;22(4):746–757. | ||
de Rooij M, Hamoen EHJ, Fütterer JJ, Barentsz JO, Rovers MM. Accuracy of multiparametric mri for prostate cancer detection: a meta-analysis. Am J Roentgenol. 2014;202(2):343–351. | ||
Fütterer JJ, Briganti A, De Visschere P, et al. Can clinically significant prostate cancer be detected with multiparametric magnetic resonance imaging? A systematic review of the literature. Eur Urol. 2015;68(6):1045–1053. | ||
The American College of Radiology. Prostate Imaging Reporting and Data System (PI-RADS), 2015. Available from: http://www.acr.org/Quality-Safety/Resources/PIRADS. Accessed August 9, 2015. | ||
Hegde JV, Mulkern RV, Panych LP, et al. Multiparametric MRI of prostate cancer: an update on state-of-the-art techniques and their performance in detecting and localizing prostate cancer. J Magn Reson Imaging. 2013;37(5):1035–1054. | ||
Yamauchi FI, Penzkofer T, Fedorov A, et al. Prostate cancer discrimination in the peripheral zone with a reduced field-of-view T2-mapping MRI sequence. Magn Reson Imaging. 2015;33(5):525–530. | ||
Hegde JV, Chen M-H, Mulkern RV, Fennessy FM, D’Amico AV, Tempany CMC. Preoperative 3-Tesla multiparametric endorectal magnetic resonance imaging findings and the odds of upgrading and upstaging at radical prostatectomy in men with clinically localized prostate cancer. Int J Radiat Oncol Biol Phys. 2013;85(2):e101–e107. | ||
Itatani R, Namimoto T, Takaoka H, et al. Extracapsular extension of prostate cancer: diagnostic value of combined multiparametric magnetic resonance imaging and isovoxel 3-dimensional T2-weighted imaging at 1.5 T. J Comput Assist Tomogr. 2015;39(1):37–43. | ||
Rosenkrantz AB, Neil J, Kong X, et al. Prostate cancer: Comparison of 3D T2-weighted with conventional 2D T2-weighted imaging for image quality and tumor detection. AJR Am J Roentgenol. 2010;194(2):446–452. | ||
Le Bihan D, Breton E, Lallemand D, Grenier P, Cabanis E, Laval-Jeantet M. MR imaging of intravoxel incoherent motions: application to diffusion and perfusion in neurologic disorders. Radiology. 1986;161(2):401–407. | ||
Chatterjee A, Watson G, Myint E, Sved P, McEntee M, Bourne R. Changes in epithelium, stroma, and lumen space correlate more strongly with Gleason pattern and are stronger predictors of prostate ADC changes than cellularity metrics. Radiology. 2015;277(3):751–762. | ||
Hambrock T, Somford DM, Huisman HJ, et al. Relationship between apparent diffusion coefficients at 3.0-T MR imaging and Gleason grade in peripheral zone prostate cancer. Radiology. 2011;259(2):453–461. | ||
Vargas HA, Akin O, Franiel T, et al. Diffusion-weighted endorectal MR imaging at 3 T for prostate cancer: tumor detection and assessment of aggressiveness. Radiology. 2011;259(3):775–784. | ||
Wu CJ, Wang Q, Li H, et al. DWI-associated entire-tumor histogram analysis for the differentiation of low-grade prostate cancer from intermediate-high-grade prostate cancer. Abdom Imaging. 2015;40(8):3214–3221. | ||
Somford DM, Hambrock T, Hulsbergen-van de Kaa CA, et al. Initial experience with identifying high-grade prostate cancer using diffusion-weighted mr imaging (dwi) in patients with a Gleason score ≤3 + 3 = 6 upon schematic TRUS-guided biopsy: a radical prostatectomy correlated series. Invest Radiol. 2012;47(3):153–158. | ||
Woodfield CA, Tung GA, Grand DJ, Pezzullo JA, Machan JT, Renzulli JF 2nd. Diffusion-weighted MRI of peripheral zone prostate cancer: comparison of tumor apparent diffusion coefficient with Gleason score and percentage of tumor on core biopsy. AJR Am J Roentgenol. 2010;194(4):W316–W322. | ||
Boesen L, Chabanova E, Logager V, Balslev I, Thomsen HS. Apparent diffusion coefficient ratio correlates significantly with prostate cancer gleason score at final pathology. J Magn Reson Imaging. 2015;42(2):446–453. | ||
Rosenkrantz AB, Khalef V, Xu W, Babb JS, Taneja SS, Doshi AM. Does normalisation improve the diagnostic performance of apparent diffusion coefficient values for prostate cancer assessment? A blinded independent-observer evaluation. Clin Radiol. 2015;70(9):1032–1037. | ||
Barrett T, Priest AN, Lawrence EM, et al. Ratio of tumor to normal prostate tissue apparent diffusion coefficient as a method for quantifying DWI of the prostate. AJR Am J Roentgenol. 2015;205(6):W585–W593. | ||
Rosenkrantz AB, Triolo MJ, Melamed J, Rusinek H, Taneja SS, Deng FM. Whole-lesion apparent diffusion coefficient metrics as a marker of percentage Gleason 4 component within Gleason 7 prostate cancer at radical prostatectomy. J Magn Reson Imaging. 2015;41(3):708–714. | ||
Shaish H, Kang SK, Rosenkrantz AB. The utility of quantitative ADC values for differentiating high-risk from low-risk prostate cancer: a systematic review and meta-analysis. Abdom Radiology (NY). Epub August 25, 2016. | ||
Kim CK, Park SY, Park JJ, Park BK. Diffusion-weighted MRI as a predictor of extracapsular extension in prostate cancer. AJR Am J Roentgenol. 2014;202(3):W270–W276. | ||
Henderson DR, de Souza NM, Thomas K, et al. Nine-year follow-up for a study of diffusion-weighted magnetic resonance imaging in a prospective prostate cancer active surveillance cohort. Eur Urol. 2016;69(6):1028–1033. | ||
Padhani AR. Integrating multiparametric prostate MRI into clinical practice. Cancer Imaging. 2011(A):S27–S37. | ||
Maas MC, Futterer JJ, Scheenen TW. Quantitative evaluation of computed high B value diffusion-weighted magnetic resonance imaging of the prostate. Invest Radiol. 2013;48(11):779–786. | ||
Rosenkrantz AB, Padhani AR, Chenevert TL, et al. Body diffusion kurtosis imaging: basic principles, applications, and considerations for clinical practice. J Magn Reson Imaging. 2015;42(5):1190–1202. | ||
Rakow-Penner RA, White NS, Margolis DJ, et al. Prostate diffusion imaging with distortion correction. Magn Reson Imaging. 2015;33(9):1178–1181. | ||
Korn N, Kurhanewicz J, Banerjee S, Starobinets O, Saritas E, Noworolski S. Reduced-FOV excitation decreases susceptibility artifact in diffusion-weighted MRI with endorectal coil for prostate cancer detection. Magn Reson Imaging. 2015;33(1):56–62. | ||
Tan CH, Wei W, Johnson V, Kundra V. Diffusion weighted magnetic resonance imaging in prostate cancer: meta-analysis. AJR Am J Roentgenol. 2012;199(4):822–829. | ||
Jie C, Rongbo L, Ping T. The value of diffusion-weighted imaging in the detection of prostate cancer: a meta-analysis. Eur Radiol. 2014;24(8):1929–1941. | ||
Isebaert S, Van den Bergh L, Haustermans K, et al. Multiparametric MRI for prostate cancer localization in correlation to whole-mount histopathology. J Magn Reson Imaging. 2013;37(6):1392–1401. | ||
Verma S, Turkbey B, Muradyan N, et al. Overview of dynamic contrast-enhanced MRI in prostate cancer diagnosis and management. AJR Am J Roentgenol. 2012;198(6):1277–1288. | ||
Jackson AS, Reinsberg SA, Sohaib SA, et al. Dynamic contrast-enhanced MRI for prostate cancer localization. Br J Radiol. 2009;82(974):148–156. | ||
Tan CH, Paul Hobbs B, Wei W, Kundra V. Dynamic contrast-enhanced MRI for the detection of prostate cancer: meta-analysis. Am J Roentgenol. 2015;204(4):W439–W448. | ||
Hansford BG, Peng Y, Jiang Y, et al. Dynamic contrast-enhanced MR imaging curve-type analysis: is it helpful in the differentiation of prostate cancer from healthy peripheral zone? Radiology. 2015;275(2):448–457. | ||
Tofts PS, Brix G, Buckley DL, et al. Estimating kinetic parameters from dynamic contrast-enhanced T(1)-weighted MRI of a diffusable tracer: standardized quantities and symbols. J Magn Reson Imaging. 1999;10(3):223–232. | ||
Heerschap A, Jager GJ, van der Graaf M, et al. In vivo proton MR spectroscopy reveals altered metabolite content in malignant prostate tissue. Anticancer Res. 1997;17(3A):1455–1460. | ||
Kobus T, Wright AJ, Weiland E, Heerschap A, Scheenen TWJ. Metabolite ratios in 1H MR spectroscopic imaging of the prostate. Magn Reson Med. 2015;73(1):1–12. | ||
Weinreb JC, Blume JD, Coakley FV, et al. Prostate cancer: sextant localization at MR imaging and MR spectroscopic imaging before prostatectomy – results of ACRIN prospective multi-institutional clinicopathologic study. Radiology. 2009;251(1):122–133. | ||
Platzek I, Borkowetz A, Toma M, et al. Multiparametric prostate magnetic resonance imaging at 3 T: failure of magnetic resonance spectroscopy to provide added value. J Comput Assist Tomogr. 2015;39(5):674–680. | ||
Turkbey B, Pinto PA, Mani H, et al. Prostate cancer: value of multiparametric MR imaging at 3 T for detection – histopathologic correlation. Radiology. 2010;255(1):89–99. | ||
Schoots IG, Petrides N, Giganti F, et al. Magnetic resonance imaging in active surveillance of prostate cancer: a systematic review. Eur Urol. 2015;67(4):627–636. | ||
Tempany C, Straus S, Hata N, Haker S. MR-guided prostate interventions. J Magn Reson Imaging. 2008;27(2):356–367. | ||
Schoots IG, Roobol MJ, Nieboer D, Bangma CH, Steyerberg EW, Hunink MG. Magnetic resonance imaging-targeted biopsy may enhance the diagnostic accuracy of significant prostate cancer detection compared to standard transrectal ultrasound-guided biopsy: a systematic review and meta-analysis. Eur Urol. 2015;68(3):438–450. | ||
Hambrock T, Hoeks C, Hulsbergen-van de Kaa C, et al. Prospective assessment of prostate cancer aggressiveness using 3-T diffusion-weighted magnetic resonance imaging-guided biopsies versus a systematic 10-core transrectal ultrasound prostate biopsy cohort. Eur Urol. 2012;61(1):177–184. | ||
Penzkofer T, Tuncali K, Fedorov A, et al. Transperineal in-bore 3-T MR imaging-guided prostate biopsy: a prospective clinical observational study. Radiology. 2015;274(1):170–180. | ||
Siddiqui MM, Rais-Bahrami S, Truong H, et al. Magnetic resonance imaging/ultrasound–fusion biopsy significantly upgrades prostate cancer versus systematic 12-core transrectal ultrasound biopsy. Eur Urol. 2013;64(5):713–719. | ||
Tonttila PP, Lantto J, Pääkkö E, et al. Prebiopsy multiparametric magnetic resonance imaging for prostate cancer diagnosis in biopsy-naive men with suspected prostate cancer based on elevated prostate-specific antigen values: results from a randomized prospective blinded controlled trial. Eur Urol. 2016;69(3):419–425. | ||
Haider MA, Yao X, Loblaw A, Finelli A. Multiparametric magnetic resonance imaging in the diagnosis of prostate cancer: a systematic review. Clin Oncol (R Coll Radiol). 2016;28(9):550–567. | ||
Abdi H, Zargar H, Goldenberg SL, et al. Multiparametric magnetic resonance imaging-targeted biopsy for the detection of prostate cancer in patients with prior negative biopsy results. Urol Oncol. 2015;33(4):165.e161–e167. | ||
Moore CM, Robertson NL, Arsanious N, et al. Image-guided prostate biopsy using magnetic resonance imaging-derived targets: a systematic review. Eur Urol. 2013;63(1):125–140. | ||
El-Shater Bosaily A, Parker C, Brown LC, et al. PROMIS – Prostate MR imaging study: a paired validating cohort study evaluating the role of multi-parametric MRI in men with clinical suspicion of prostate cancer. Contemp Clin Trials. 2015;42:26–40. | ||
Simmons LA, Ahmed HU, Moore CM, et al. The PICTURE study – prostate imaging (multi-parametric MRI and Prostate HistoScanning) compared to transperineal ultrasound guided biopsy for significant prostate cancer risk evaluation. Contemp Clin Trials. 2014;37(1):69–83. | ||
D’Amico AV, Cormack R, Tempany CM, et al. Real-time magnetic resonance image-guided interstitial brachytherapy in the treatment of select patients with clinically localized prostate cancer. Int J Radiat Oncol Biol Phys. 1998;42(3):507–515. | ||
Oto A, Sethi I, Karczmar G, et al. MR imaging–guided focal laser ablation for prostate cancer: Phase I trial. Radiology. 2013;267(3):932–940. | ||
Chopra R, Colquhoun A, Burtnyk M, et al. MR imaging–controlled transurethral ultrasound therapy for conformal treatment of prostate tissue: initial feasibility in humans. Radiology. 2012;265(1):303–313. | ||
Ghai S, Trachtenberg J. In-bore MRI interventions: current status and future applications. Curr Opin Urol. 2015;25(3):205–211. | ||
Oppenheimer DC, Weinberg EP, Hollenberg GM, Meyers SP. Multiparametric magnetic resonance imaging of recurrent prostate cancer. J Clin Imaging Sci. 2016;6:18. | ||
Roy C, Foudi F, Charton J, et al. Comparative sensitivities of functional MRI sequences in detection of local recurrence of prostate carcinoma after radical prostatectomy or external-beam radiotherapy. AJR Am J Roentgenol. 2013;200(4):W361–W368. | ||
Panebianco V, Barchetti F, Sciarra A, et al. Prostate cancer recurrence after radical prostatectomy: the role of 3-T diffusion imaging in multi-parametric magnetic resonance imaging. Eur Radiol. 2013;23(6):1745–1752. | ||
Donati OF, Jung SI, Vargas HA, et al. Multiparametric prostate MR imaging with T2-weighted, diffusion-weighted, and dynamic contrast-enhanced sequences: are all pulse sequences necessary to detect locally recurrent prostate cancer after radiation therapy? Radiology. 2013;268(2):440–450. | ||
Afshar-Oromieh A, Avtzi E, Giesel FL, et al. The diagnostic value of PET/CT imaging with the (68)Ga-labelled PSMA ligand HBED-CC in the diagnosis of recurrent prostate cancer. Eur J Nucl Med Mol Imaging. 2015;42(2):197–209. | ||
Mariappan YK, Glaser KJ, Ehman RL. Magnetic resonance elastography: a review. Clin Anat. 2010;23(5):497–511. | ||
Arani A, Da Rosa M, Ramsay E, Plewes DB, Haider MA, Chopra R. Incorporating endorectal MR elastography into multi-parametric MRI for prostate cancer imaging: initial feasibility in volunteers. J Magn Reson Imaging. 2013;38(5):1251–1260. | ||
Vos EK, Lagemaat MW, Barentsz JO, et al. Image quality and cancer visibility of T2-weighted magnetic resonance imaging of the prostate at 7 Tesla. Eur Radiol. 2014;24(8):1950–1958. | ||
Kumar D, Gupta A, Nath K. NMR-based metabolomics of prostate cancer: a protagonist in clinical diagnostics. Expert Rev Mol Diagn. 2016;16(6):651–661. | ||
Weinreb JC, Barentsz JO, Choyke PL et al. PI-RADS Prostate Imaging-Reporting and Data System: 2015, Version 2. Eur Urol. 2016;69(1):16–40. | ||
Kobus T, Wright AJ, Scheenen TWJ, Heerschap A. Mapping of prostate cancer by 1H MRSI. NMR Biomed. 2014;27:39–52. |
 © 2016 The Author(s). This work is published and licensed by Dove Medical Press Limited. The
full terms of this license are available at https://www.dovepress.com/terms
and incorporate the Creative Commons Attribution
- Non Commercial (unported, 3.0) License.
By accessing the work you hereby accept the Terms. Non-commercial uses of the work are permitted
without any further permission from Dove Medical Press Limited, provided the work is properly
attributed. For permission for commercial use of this work, please see paragraphs 4.2 and 5 of our Terms.
© 2016 The Author(s). This work is published and licensed by Dove Medical Press Limited. The
full terms of this license are available at https://www.dovepress.com/terms
and incorporate the Creative Commons Attribution
- Non Commercial (unported, 3.0) License.
By accessing the work you hereby accept the Terms. Non-commercial uses of the work are permitted
without any further permission from Dove Medical Press Limited, provided the work is properly
attributed. For permission for commercial use of this work, please see paragraphs 4.2 and 5 of our Terms.