Back to Journals » Drug Design, Development and Therapy » Volume 12
Spectroscopic and molecular modeling studies of binding interaction between bovine serum albumin and roflumilast
Authors Wani TA, Bakheit AH, Ansari MN ![]() , Al-Majed ARA, Al-Qahtani BM, Zargar S
, Al-Majed ARA, Al-Qahtani BM, Zargar S ![]()
Received 29 March 2018
Accepted for publication 26 May 2018
Published 28 August 2018 Volume 2018:12 Pages 2627—2634
DOI https://doi.org/10.2147/DDDT.S169697
Checked for plagiarism Yes
Review by Single anonymous peer review
Peer reviewer comments 3
Editor who approved publication: Professor Manfred Ogris
Tanveer A Wani,1 Ahmed H Bakheit,1,2 Mohammed Nazam Ansari,3 Abdul-Rahman A Al-Majed,1 Bakr M Al-Qahtani,1,4 Seema Zargar5
1Department of Pharmaceutical Chemistry, College of Pharmacy, King Saud University, Riyadh, Saudi Arabia; 2Department of Chemistry, Faculty of Science and Technology, Al-Neelain University, Khartoum, Sudan; 3Department of Pharmacology, College of Pharmacy, Prince Sattam Bin Abdulaziz University, Al Kharj, Saudi Arabia; 4Drug Sector, Saudi Food and Drug Authority, Dammam, Saudi Arabia; 5Department of Biochemistry, College of Science, King Saud University, Riyadh, Saudi Arabia
Background: The binding interaction between bovine serum albumin (BSA) and roflumilast (ROF) was explored in this study. The binding of drugs to albumin plays a vital role in their pharmacokinetics and pharmacodynamics in vivo. The mechanisms involved in the interaction between BSA and ROF was studied using multi-spectroscopic experimental and computational approaches.
Materials and methods: Spectrofluorometric experiments were used to determine the method of quenching involved and the conformational changes in the BSA. UV–visible spectroscopy synchronous and three-dimensional fluorescence spectroscopy were used to further explore the binding interaction mechanism.
Results: The results suggested that the intrinsic fluorescence of BSA was quenched due to the formation of a static complex between ROF and BSA. Conformational changes in BSA were determined based on its interaction with ROF. The thermodynamic results suggested that the interaction between ROF and BSA was spontaneous and a hydrophobic interaction occurred between them. Site I of BSA was suggested as the site of interaction between ROF and BSA based on the site marker experiments.
Conclusion: The molecular simulation results and the experimental outcomes were complimentary to each other and helped to identify the binding site and nature of bonds involved in the interaction between ROF and BSA.
Keywords: roflumilast, bovine serum albumin, COPD, fluorescence, quenching
Introduction
COPD is a pulmonary disorder that is progressive and causes deterioration in lung function.1 Patients with severe COPD along with chronic bronchitis and exacerbations are treated with roflumilast (ROF), a potent and selective PDE4 inhibitor (Figure 1).2,3 Patients with COPD exacerbation have higher levels of inflammatory and cytokine markers than patients without exacerbations. The selective inhibition of PDE4 by ROF causes suppression of these inflammatory and cytokine markers in addition to allergen-induced inflammation.4 ROF is also known to suppress lipopolysaccharide-induced systemic inflammation.2
 | Figure 1 Chemical structure of ROF. |
A major proportion of serum albumin is comprised of extracellular plasma proteins (approximately 60%).5 Serum albumin binds to various ligands (hormones, fatty acids, drugs etc), thus playing a significant role in the pharmacokinetic behavior of these ligands.6 The therapeutic efficiency of the ligands depend on their ability to bind to BSA and the mechanism involved in the binding.7–11 Bovine serum albumin is commonly substituted for human serum albumin due to its structural similarity, low procurement cost, and availability. The similarity between BSA and human serum albumin is 76% in terms of identity and 88% in terms of amino acid sequences.12,13 Several studies have explored the interactions between ligands and serum albumin.13–19 These binding studies are useful in obtaining information about possible drug–drug interactions, drug: protein resistance, drug side effects, and dosage information.19–21
In this study, the mechanism involved in the interaction between ROF and BSA was analyzed. The interaction between ROF and BSA was studied in terms of calculation of binding constants, binding site identification for ROF on BSA, and conformational change in BSA upon interaction with ROF. Ultraviolet–visible (UV–vis) absorption, fluorescence, synchronous fluorescence (SF), and three-dimensional fluorescence spectroscopy studies were conducted to understand the binding interaction. In addition to these spectroscopic studies, molecular simulation studies were also conducted. This study will be useful in understanding the in vivo metabolism, distribution, and pharmacokinetics of ROF.
Materials and methods
Materials
ROF was obtained from Beijing Mesochem Technology Limited (Beijing, China). BSA was obtained from Sisco Research Laboratories (Mumbai, India), and phenylbutazone (≥99.9%) and ibuprofen (≥99.9%) were procured from National Scientific Company (Jeddah, Saudi Arabia). All other materials used including those used to prepare buffers were of analytical grade.
Sample preparation
ROF was dissolved in dimethyl sulfoxide (500 μL) and its stock (1.15×10⁻⁴ M) was prepared in phosphate buffer (pH 7.4). The working standards were in the range of 7.46×10⁻⁷–1.19×10⁻⁵ M. BSA stock (1.5×10⁻⁶ M) was also prepared in phosphate buffer (pH 7.4). The sample solutions were prepared using deionized water from Flex Type-IV instrument (Elga Lab Water, Lane End, UK). The stock solutions were stored in refrigerator and fresh working standards were prepared for analysis from the stock solution.
Fluorescence measurements
The amino acids tryptophan (Trp), tyrosine (Tyr), and phenylalanine (Phe) are fluorescent in nature, thus contributing to the fluorescence of the protein in which they are present.22 Among the three amino acid residues, Trp is highly fluorescent and sensitive to the microenvironmental changes that might occur in its vicinity whereas Phe does not get excited (for the most part) easily and has a low quantum yield. Owing to these reasons, Trp is usually used in quenching studies. The two Trp residues found in BSA are Trp-134 and Trp-213, and the intrinsic fluorescence of BSA is dominated by the Trp residues with high quantum yield. Trp-134 is present on BSA surface, whereas Trp-213 is present inside the BSA hydrophobic pocket. A JASCO FP-8200 spectrofluorometer was utilized to measure the fluorescence spectrum. The fluorescence quenching spectra were recorded at λex (excitation wavelength) of 280 nm and λem (emission wavelength) of 300–500 nm. The fluorescence spectra were recorded at temperatures of 298, 303, and 308 K. BSA spectra were attained in the presence and absence of ROF. A reduction in fluorescence intensity of the sample solution can occur because of inner filter effects and, therefore, needs to be corrected. The effect was corrected as follows:
|
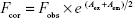
where Fcor and Fobs represent the corrected and observed fluorescence intensity, respectively. Aex and Aem are the modified absorbance values post ligand binding to BSA at λex and λem, respectively. The fluorescence quenching is broadly divided into two categories, dynamic and static quenching.23 Dynamic quenching is due to collisions, and static quenching due to complex formation between the quencher and fluorophore. Several studies have shown that the dynamic quenching constant is expected to increase with a rise in temperature due to increased diffusion rates, whereas a decrease in the static quenching constant is observed with increasing temperatures.24,25 Therefore, the behavior observed with increased temperatures helped us to conclude the type of quenching involved in this interaction.
SF and 3D fluorescence measurements
SF spectra for BSA and ROF–BSA complexes were recorded at room temperature. The scanning intervals Δλ =15 and 60 nm (Δλ = λem − λex) were used for the SF measurements. The amino acid Tyr was characterized at 15 nm, whereas 60 nm characterized the Trp residues. The SF spectral data provided information regarding the conformational changes that might have occurred in BSA after interaction with ROF.
3D-fluorescence spectra were also recorded, which aided in concluding any changes in the BSA conformation postinteraction with ROF.
UV absorption measurements
Shimadzu UV-1800 spectrophotometer was used to carry out UV–vis absorbance spectral measurements. The spectra for BSA and BSA–ROF complexes using the UV spectrophotometer were recorded at room temperature. The concentration of BSA in the samples was maintained constant for all measurements.
Molecular docking
Docking studies were carried out to understand the ROF–BSA interaction. The MOE-2014 (Molecular Operating Environment), a cocrystallized structure of BSA in complex with naproxen; pdb Code No 4OR0, acquired from Protein Data Bank, was used for docking studies. BSA exists as homodimer of two chains A and B. For the molecular simulation study, we selected chain B of the homodimer. The ligands and the protein receptors were prepared by protonation and the energy minimization using default force field parameters (MMFF94X). Default values (Triangle Matcher) were selected for the remaining docking parameters. London dG and GBVI/WSA dG were used for rescoring function 1 and 2, respectively. The binding site on BSA for ROF was selected as per the results obtained from the site probe experiments.
Results and discussion
BSA fluorescence quenching
The interaction between the ligands and the BSA leads to fluorescence quenching. The fluorescence spectrum obtained post the interaction of BSA and ROF is presented in Figure 2. In Figure 2, a reduction in fluorescence intensity can be observed with increasing concentrations of ROF, indicating BSA fluorescence quenching by ROF. The Stern–Volmer equation was used to determine quenching constants at different temperatures and understand the quenching mechanism between ROF and BSA.21
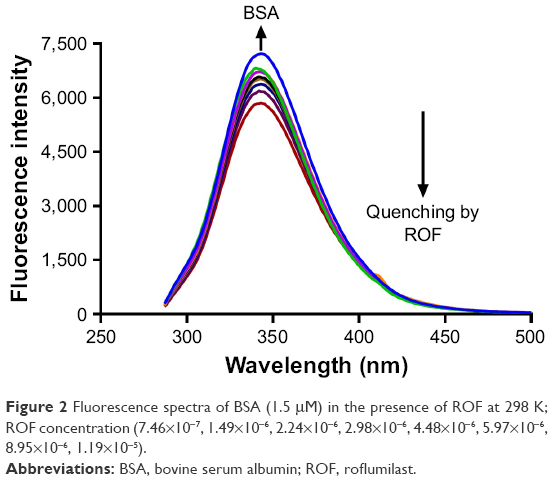 | Figure 2 Fluorescence spectra of BSA (1.5 μM) in the presence of ROF at 298 K; ROF concentration (7.46×10⁻⁷, 1.49×10⁻⁶, 2.24×10⁻⁶, 2.98×10⁻⁶, 4.48×10⁻⁶, 5.97×10⁻⁶, 8.95×10⁻⁶, 1.19×10⁻⁵). |
|
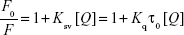
In the above equation, F0 and F are the fluorescence intensities in the absence and presence of ROF, respectively. Ksv (Stern–Volmer constant), [Q] quencher concentration, and Kq the quenching rate constant. τ0 is valued at 10−8 s and represents the average fluorescence lifetime of BSA. As shown in Figure 3A and Table 1, a strong linear relationship between F/F0 and [Q] can be observed for the Stern–Volmer plot demonstrating the contribution of a single quenching mechanism.
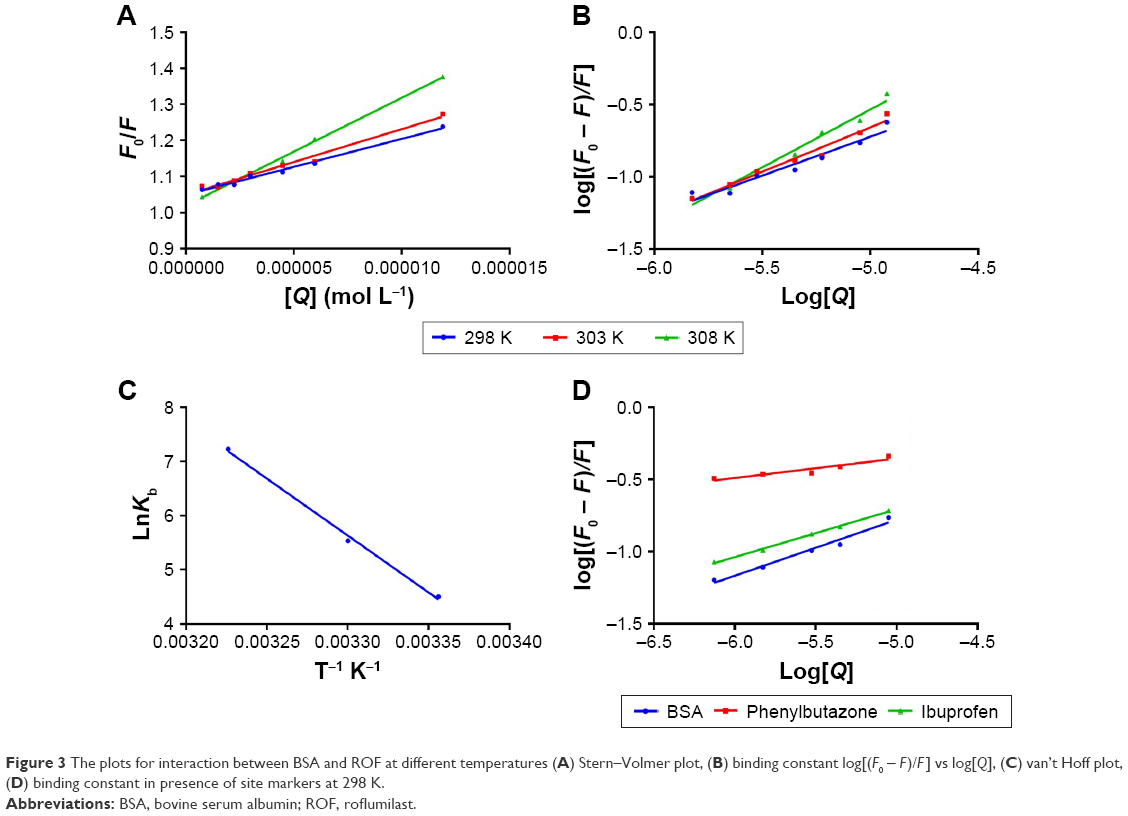 | Figure 3 The plots for interaction between BSA and ROF at different temperatures (A) Stern–Volmer plot, (B) binding constant log[(F0 - F)/F] vs log[Q], (C) van’t Hoff plot, (D) binding constant in presence of site markers at 298 K. |
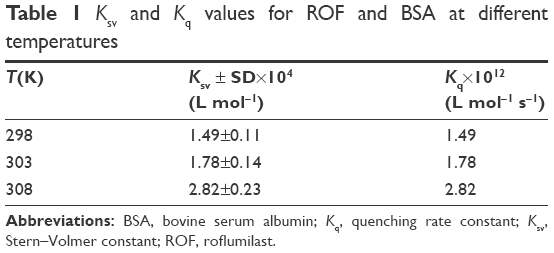 | Table 1 Ksv and Kq values for ROF and BSA at different temperatures |
The value for Ksv and Kq increased with the rise in temperature, indicative of the involvement of dynamic quenching in the ROF–BSA interaction. However, the Kq values attained were more than the maximum rate constant (2×10¹⁰ L M−1 S−1) that can be attained for scattering collision quenching (Table 2). The higher Kq values suggest a complex formation between ROF and BSA. The BSA spectra (UV absorption) helped in further elucidation of the development of a nonfluorescent complex between BSA and ROF. The noninvolvement of dynamic quenching in the quenching process is indicated by the fact that the absorption spectra of BSA showed an increase after interaction with ROF. This increased absorption was possibly because of a complex formation between ROF and BSA, whereas in dynamic quenching the excited state of quencher is liable to the quenching process. As is shown in Figure 4, the UV absorption spectra of BSA increased after addition of ROF, indicating the formation of a nonfluorescent complex (static quenching).23
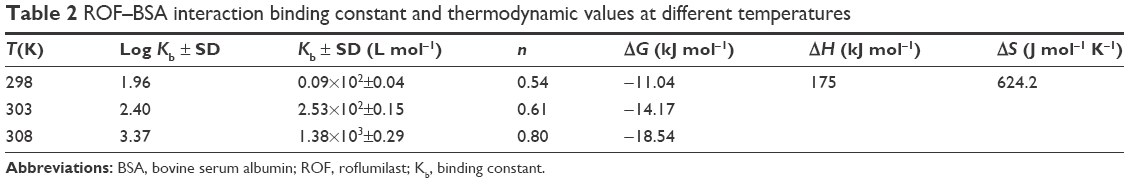 | Table 2 ROF–BSA interaction binding constant and thermodynamic values at different temperatures |
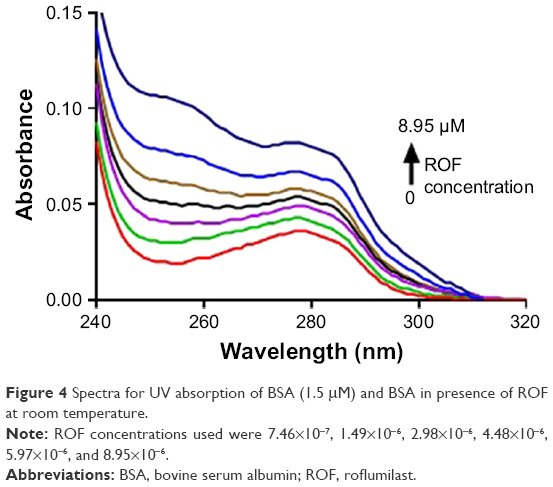 | Figure 4 Spectra for UV absorption of BSA (1.5 μM) and BSA in presence of ROF at room temperature. |
Binding constants of ROF with BSA
The binding constant (Kb) was determined for the ROF–BSA complex to obtain information regarding the binding between BSA and ROF. The binding constant and number of binding sites (n) were determined using the equation:24
|
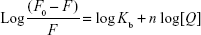
A plot between log[(F0 - F)/F] versus log[Q] (Figure 3B) was used calculate the Kb and n values, are presented in Table 2. Over the studied range of temperature, the number of binding sites (n) was unity, suggesting that only one type of binding site was present on BSA that could bind to ROF. A higher Kb value indicates a stronger binding interaction between the protein and the ligand. The Kb values showed an increase in binding strength with increasing temperatures in interaction of ROF and BSA.
SF spectra
Δλ values of 15 or 60 nm were used to record the SF spectra of both BSA and BSA–ROF complex. These spectra provided characteristic evidence about the microenvironment of Tyr and Trp residues of BSA.13 A red shift in the SF spectra indicates a decreased hydrophobicity around the Tyr and Trp residues and increased stretching capacity of the peptide chain. A blue shift in the emission spectra indicates increased hydrophobicity in the Tyr and Trp microenvironments and increased folding capacity for the biomolecule. The spectra (Figure 5) clearly show a decrease in the fluorescence intensity after ROF addition. There was shift of 1 nm (red shift) at both Δλ =15 and 60 nm specifying certain microenvironmental changes for Tyr and Trp upon binding to ROF.
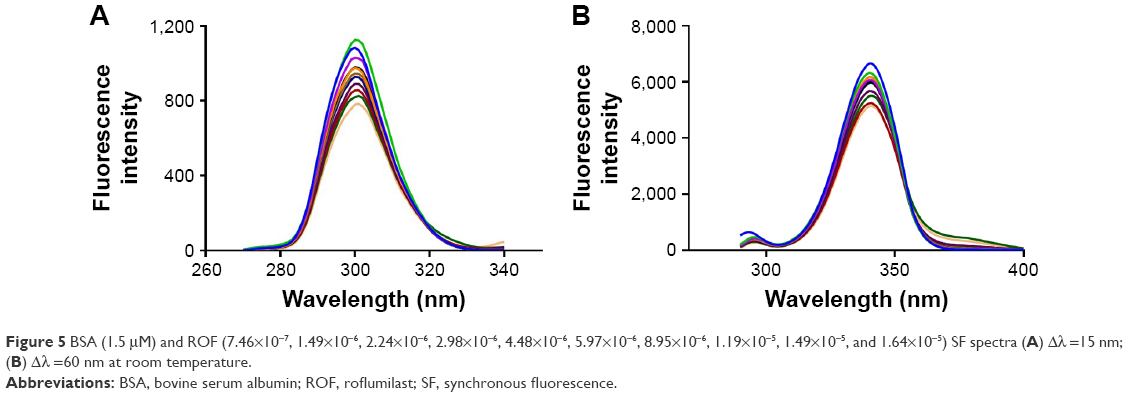 | Figure 5 BSA (1.5 μM) and ROF (7.46×10⁻⁷, 1.49×10⁻⁶, 2.24×10⁻⁶, 2.98×10⁻⁶, 4.48×10⁻⁶, 5.97×10⁻⁶, 8.95×10⁻⁶, 1.19×10⁻⁵, 1.49×10⁻⁵, and 1.64×10⁻⁵) SF spectra (A) Δλ =15 nm; (B) Δλ =60 nm at room temperature. |
Three-dimensional fluorescence spectroscopy
The three-dimensional fluorescence spectral analyses of BSA and BSA–ROF are presented in Figure 6. Two emission peaks were observed for the analyzed BSA solutions denoted by Peak I (Rayleigh scattering peak) and Peak II (characterizes Trp and Tyr residues of BSA).6,9 The intensity and positioning of Peak II are dependent on the microenvironment of Tyr and Trp residues, and any change in this microenvironment can induce some sort of conformational change in BSA. The Peak I in the BSA is formed as a result of π–π* transition of polypeptide structures and is also related to the particle size of the protein. There was decrease in the intensity of Peak II of BSA suggesting fluorescence quenching by ROF, and thus the change in the microenvironmental vicinity might have caused conformational changes in BSA. Moreover, a decrease in the Peak I suggests that ROF addition to BSA might have decreased its diameter, reflecting a conformational change in BSA.
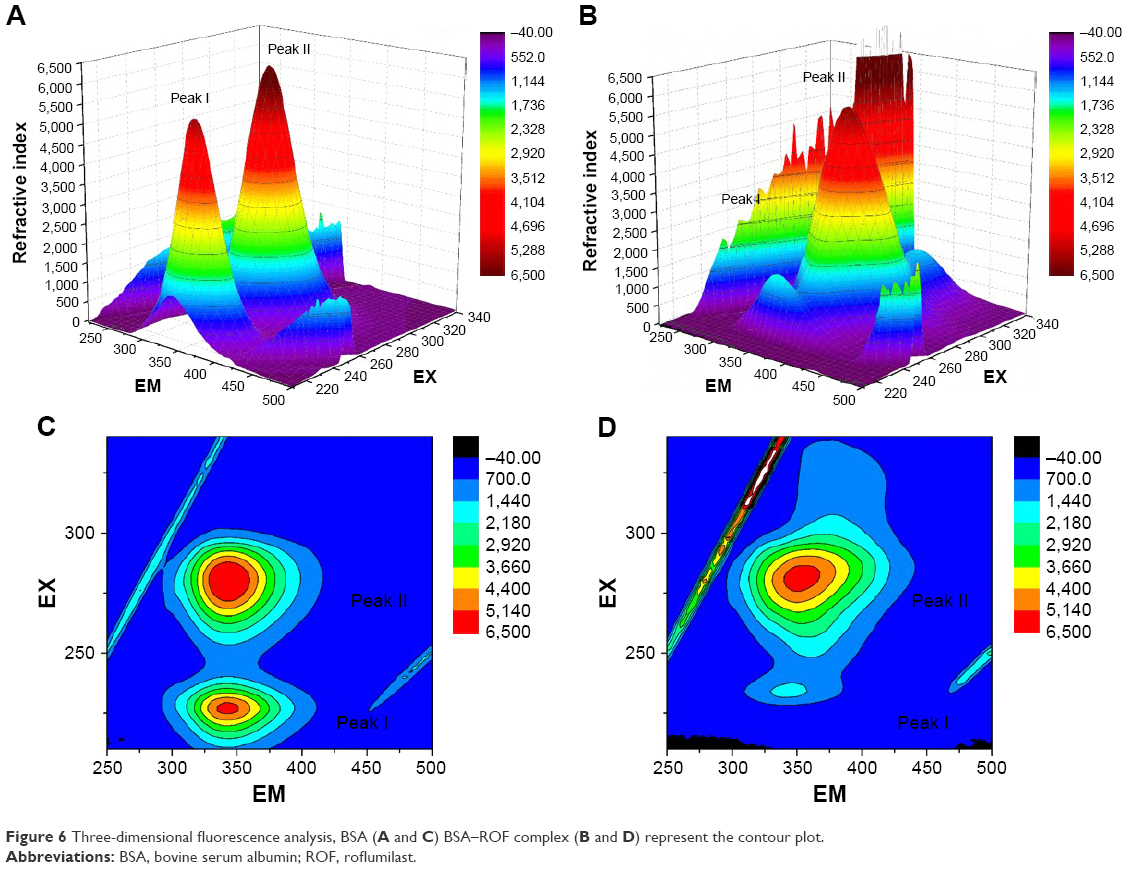 | Figure 6 Three-dimensional fluorescence analysis, BSA (A and C) BSA–ROF complex (B and D) represent the contour plot. |
Thermodynamic parameters and binding model
The major intramolecular interaction forces that are involved in binding proteins to drug ligand include the hydrogen bond, van der Waals forces, and hydrophobic interactions. Thermodynamic parameters including Gibbs free energy change (ΔG0), enthalpy change (ΔH0), and entropy change (ΔS0) help in establishing the type of forces involved in the binding interaction.26 ΔH0 and ΔS0<0 specify contributions of van der Waals force and/or hydrogen bonding, whereas ΔH0>0 and ΔS0>0 specify a hydrophobic interaction. In case, where ΔH0~0 and ΔS0>0, the involvement of electrostatic force is expected. Similarly, ΔG0<0 specified a spontaneous binding process.
Hydrophobic interaction between BSA and ROF was suggested on the basis of positive values of ΔH0 and ΔS0. The negative ΔG0 specified a spontaneous binding process between ROF and BSA (Table 2). Figure 3C represents the van’t Hoff plot for BSA–ROF interaction.
Binding site identification of ROF
The site for binding of ROF to BSA was identified using site competition. Phenylbutazone and ibuprofen (Figure 7), which act as markers for Site I and Site II, respectively, were used the identification of the binding site in this study.27 The fluorescence spectra were recorded for BSA site marker complexes and ROF. Binding constants for the ROF with BSA were calculated in the presence of site markers using double logarithmic plots of log[(F0-F)/F] versus log[Q] (Figure 3D). The binding constant (Kb) of BSA with ROF decreased significantly in the presence of phenylbutazone compared to Kb in absence of phenylbutazone. A slight change was observed in the Kb of BSA with ROF in the presence of ibuprofen, indicating a competition between ROF and phenylbutazone for binding to BSA Site I. A molecular simulation program (MOE) was used for the simulation of ROF and BSA interactions. The docking experiments (Figure 8A) further revealed that ROF binds to Site I (subdomain IIA) of BSA within a hydrophobic cavity.28 The docking results were supported by the binding site probe experimental results. Both the experiments showed that phenylbutazone and ROF bind to the same site on BSA, inferring Site I (subdomain IIA) hydrophobic pocket of BSA as the binding site for ROF. The free energy change (ΔG0) calculated from the molecular docking simulation was determined to be −6.43 kcal mol−1 and was lower than the ΔG0 found experimentally (3.39 kcal mol−1).
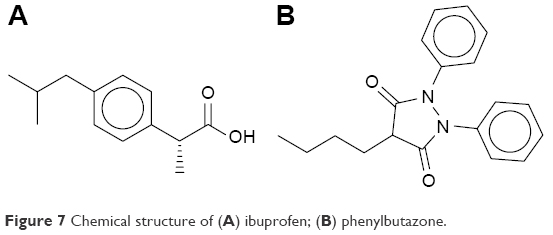 | Figure 7 Chemical structure of (A) ibuprofen; (B) phenylbutazone. |
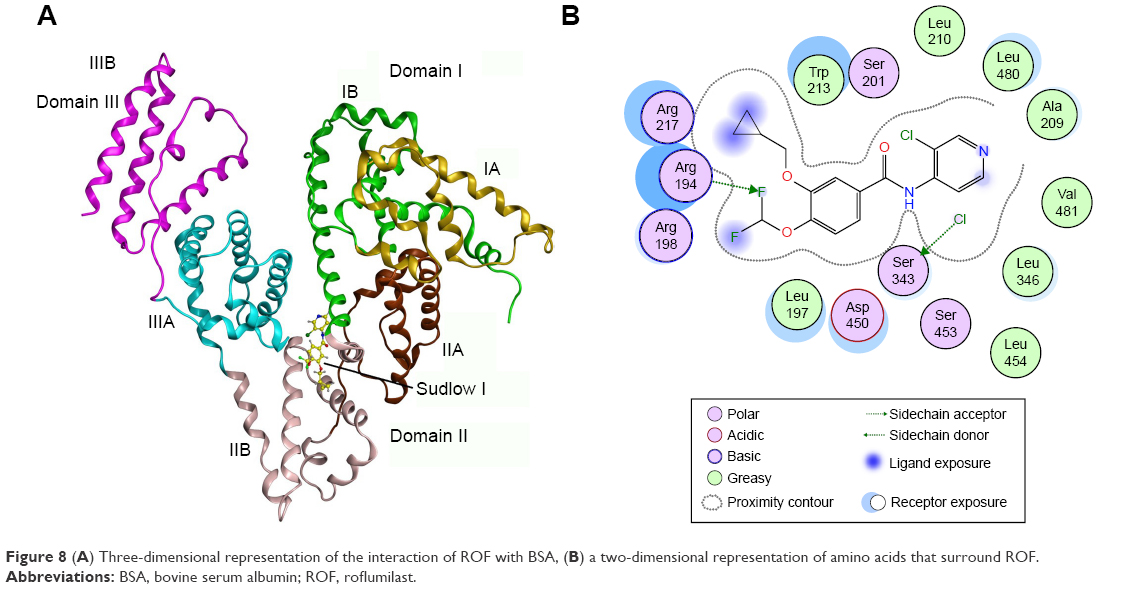 | Figure 8 (A) Three-dimensional representation of the interaction of ROF with BSA, (B) a two-dimensional representation of amino acids that surround ROF. |
The binding mode study further revealed that ROF interacts with the BSA subdomain IIA hydrophobic region. The hydrophobic amino acids (Val-342, Ala-209, Leu-210, Leu-480, Leu-197, Leu-346, Leu-454), polar residues (Trp-213, Ser-201, Ser-343, Ser-453), and charged residues (Arg-217, Arg-198, Arg-194, Asp-450) surround the embedded ROF. The amino acid residues Arg-194 and Ser-343 formed hydrogen bonds between ROF and BSA (Figure 8B).
BSA conformational changes
The conformational changes in BSA after interaction with ROF were investigated with UV absorption spectroscopy. The absorption spectra for BSA and BSA–ROF are presented in Figure 4. An increase in the absorption intensity was observed with gradual addition of ROF. The intensity of the peak at 280 nm is because of π–π* transition of aromatic amino acids (Trp, Tyr, and Phe). A complex formation between BSA and ROF is further suggested based on the fact that a blue shift was also observed for the λmax of BSA.29
Conclusion
The BSA and ROF binding interaction was explored in this study using different methodologies at the molecular structural level. ROF quenched the fluorescence of BSA by forming a complex with BSA. ROF was also found to bind with BSA at subdomain IIA (Site I) leading to conformational changes in BSA. The contribution of hydrophobic forces in the binding process of ROF with BSA was indicated by the positive enthalpy and entropy values. The UV–vis and SF spectroscopic data indicated that the interaction between ROF and BSA caused alterations in the BSA conformation. Our study will help in further investigation of the pharmacological behavior of ROF.
Acknowledgment
The authors extend their sincere appreciation to the Deanship of Scientific Research, King Saud University, for funding the research group no. RG-1435-073.
Disclosure
The authors report no conflicts of interest in this work.
References
Halbert R, Natoli J, Gano A, Badamgarav E, Buist AS, Mannino D. Global burden of COPD: systematic review and meta-analysis. Eur Respir J. 2006;28(3):523–532. | ||
Wedzicha JA, Calverley PM, Rabe KF. Roflumilast: a review of its use in the treatment of COPD. Int J Chron Obstruct Pulmon Dis. 2016;11:81–90. | ||
Garnock-Jones KP. Roflumilast: a review in COPD. Drugs. 2015;75(14):1645–1656. | ||
Boswell-Smith V, Spina D. PDE4 inhibitors as potential therapeutic agents in the treatment of COPD-focus on roflumilast. Int J Chron Obstruct Pulmon Dis. 2007;2(2):121–129. | ||
Sułkowska A. Interaction of drugs with bovine and human serum albumin. J Mol Struct. 2002;614(1–3):227–232. | ||
Shi JH, Pan DQ, Jiang M, Liu TT, Wang Q. Binding interaction of ramipril with bovine serum albumin (BSA): insights from multi-spectroscopy and molecular docking methods. J Photochem Photobiol. 2016;164:103–111. | ||
Shi JH, Pan DQ, Wang XX, Liu TT, Jiang M, Wang Q. Characterizing the binding interaction between antimalarial artemether (AMT) and bovine serum albumin (BSA): Spectroscopic and molecular docking methods. J Photochem Photobiol. 2016;162:14–23. | ||
Karthikeyan S, Bharanidharan G, Kesherwani M, et al. Insights into the binding of thiosemicarbazone derivatives with human serum albumin: spectroscopy and molecular modelling studies. J Biomol Struct Dyn. 2016;34(6):1264–1281. | ||
Wani TA, AlRabiah H, Bakheit AH, Kalam MA, Zargar S. Study of binding interaction of rivaroxaban with bovine serum albumin using multi-spectroscopic and molecular docking approach. Chem Cent J. 2017;11(1):134. | ||
Suryawanshi VD, Walekar LS, Gore AH, Anbhule PV, Kolekar GB. Spectroscopic analysis on the binding interaction of biologically active pyrimidine derivative with bovine serum albumin. J Pharm Anal. 2016;6(1):56–63. | ||
Wani TA, Bakheit AH, Al-Majed AA, Bhat MA, Zargar S. Study of the interactions of bovine serum albumin with the new anti-inflammatory agent 4-(1, 3-dioxo-1, 3-dihydro-2H-isoindol-2-yl)-N′-([4-ethoxy-phenyl] methylidene) benzohydrazide using a multi-spectroscopic approach and molecular docking. Molecules. 2017;22(8):1258. | ||
Steinhardt J, Krijn J, Leidy JG. Differences between bovine and human serum albumins. Binding isotherms, optical rotatory dispersion, viscosity, hydrogen ion titration, and fluorescence effects. Biochemistry. 1971;10(22):4005–4015. | ||
Majorek KA, Porebski PJ, Dayal A, et al. Structural and immunologic characterization of bovine, horse, and rabbit serum albumins. Mol Immunol. 2012;52(3–4):174–182. | ||
Wani TA, Bakheit AH, Abounassif M, Zargar S. Study of interactions of an anticancer drug neratinib with bovine serum albumin: spectroscopic and molecular docking approach. Front Chem. 2018;6:47. | ||
Wani TA, Bakheit AH, Zargar S, Hamidaddin MA, Darwish IA. Spectrophotometric and molecular modelling studies on in vitro interaction of tyrosine kinase inhibitor linifanib with bovine serum albumin. PLoS One. 2017;12(4):e0176015. | ||
Shahabadi N, Fili SM. Molecular modeling and multispectroscopic studies of the interaction of mesalamine with bovine serum albumin. Spectrochim Acta A Mol Biomol Spectrosc. 2014;118:422–429. | ||
Jahanban-Esfahlan A, Panahi-Azar V, Sajedi S. Spectroscopic and molecular docking studies on the interaction between N-acetyl cysteine and bovine serum albumin. Biopolymers. 2015;103(11):638–645. | ||
Kandagal P, Ashoka S, Seetharamappa J, Shaikh S, Jadegoud Y, Ijare O. Study of the interaction of an anticancer drug with human and bovine serum albumin: spectroscopic approach. J Pharm Biomed Anal. 2006;41(2):393–399. | ||
Khorsand Ahmadi S, Mahmoodian Moghadam M, Mokaberi P, Reza Saberi M, Chamani J. A comparison study of the interaction between β-lactoglobulin and retinol at two different conditions: spectroscopic and molecular modeling approaches. J Biomol Struct Dyn. 2015;33(9):1880–1898. | ||
Chamani J, Vahedian-Movahed H, Saberi MR. Lomefloxacin promotes the interaction between human serum albumin and transferrin: a mechanistic insight into the emergence of antibiotic’s side effects. J Pharm Biomed Anal. 2011;55(1):114–124. | ||
Sattar Z, Saberi MR, Chamani J. Determination of LMF binding site on a HSA-PPIX complex in the presence of human holo transferrin from the viewpoint of drug loading on proteins. PLoS One. 2014;9(1):e84045. | ||
Lakowicz JR. Introduction to fluorescence. Principles of Fluorescence Spectroscopy. Berlin: Springer; 1999:1–23. | ||
Grigoryan K, Ghazaryan A. Quenching mechanism of human serum albumin fluorescence by gangleron. Chem Biol. 2013;2:6–10. | ||
Shahabadi N, Hadidi S, Feizi F. Study on the interaction of antiviral drug “Tenofovir” with human serum albumin by spectral and molecular modeling methods. Spectrochim Acta A Mol Biomol Spectrosc. 2015;138:169–175. | ||
Min J, Meng-Xia X, Dong Z, Yuan L, Xiao-Yu L, Xing C. Spectroscopic studies on the interaction of cinnamic acid and its hydroxyl derivatives with human serum albumin. J Mol Struct. 2004;692(1–3):71–80. | ||
Ross PD, Subramanian S. Thermodynamics of protein association reactions: forces contributing to stability. Biochemistry. 1981;20(11):3096–3102. | ||
Zhang Q, Ni Y, Kokot S. Molecular spectroscopic studies on the interaction between ractopamine and bovine serum albumin. J Pharm Biomed Anal. 2010;52(2):280–288. | ||
Sudlow G, Birkett D, Wade D. Further characterization of specific drug binding sites on human serum albumin. Mol Pharmacol. 1976;12(6):1052–1061. | ||
Cui FL, Fan J, Li JP, Hu ZD. Interactions between 1-benzoyl-4-p-chlorophenyl thiosemicarbazide and serum albumin: investigation by fluorescence spectroscopy. Bioorg Med Chem. 2004;12(1):151–157. |
 © 2018 The Author(s). This work is published and licensed by Dove Medical Press Limited. The
full terms of this license are available at https://www.dovepress.com/terms
and incorporate the Creative Commons Attribution
- Non Commercial (unported, 3.0) License.
By accessing the work you hereby accept the Terms. Non-commercial uses of the work are permitted
without any further permission from Dove Medical Press Limited, provided the work is properly
attributed. For permission for commercial use of this work, please see paragraphs 4.2 and 5 of our Terms.
© 2018 The Author(s). This work is published and licensed by Dove Medical Press Limited. The
full terms of this license are available at https://www.dovepress.com/terms
and incorporate the Creative Commons Attribution
- Non Commercial (unported, 3.0) License.
By accessing the work you hereby accept the Terms. Non-commercial uses of the work are permitted
without any further permission from Dove Medical Press Limited, provided the work is properly
attributed. For permission for commercial use of this work, please see paragraphs 4.2 and 5 of our Terms.