Back to Journals » Journal of Pain Research » Volume 10
Spatial–temporal signature of resting-state BOLD signals in classic trigeminal neuralgia
Authors Wang Y, Xu C, Zhai L, Lu X, Wu X, Yi Y, Liu Z, Guan Q, Zhang X
Received 11 June 2017
Accepted for publication 9 November 2017
Published 5 December 2017 Volume 2017:10 Pages 2741—2750
DOI https://doi.org/10.2147/JPR.S143734
Checked for plagiarism Yes
Review by Single anonymous peer review
Peer reviewer comments 3
Editor who approved publication: Professor E Alfonso Romero-Sandoval
Yanping Wang,1 Congying Xu,1 Liping Zhai,1 Xudong Lu,1 Xiaoqiang Wu,1 Yahui Yi,2 Ziyun Liu,1 Qiaobing Guan,1 Xiaoling Zhang1
1Department of Neurology, the Second Hospital of Jiaxing City, Jiaxing, Zhejiang, 2Department of Radiology, the Second Hospital of Jiaxing City, Jiaxing, Zhejiang, China
Abstract: Resting-state functional magnetic resonance imaging (R-fMRI) signals are spatiotemporally organized. R-fMRI studies in patients with classic trigeminal neuralgia (CTN) have suggested alterations in functional connectivity. However, far less attention has been given to investigations of the local oscillations and their frequency-specific changes in these patients. The objective of this study was to address this issue in patients with CTN. R-fMRI data from 17 patients with CTN and 19 age- and gender-matched healthy controls (HCs) were analyzed using amplitude of low-frequency fluctuation (ALFF). The ALFF was computed across different frequencies (slow-4: 0.027–0.073 Hz; slow-5: 0.01–0.027 Hz; and typical band: 0.01–0.08 Hz) in patients with CTN compared to HCs. In the typical band, patients with CTN showed increases of ALFF in bilateral temporal, occipital, and left middle frontal regions and in the left middle cingulate gyrus, as well as decreases of ALFF in the right inferior temporal region and in regions (medial prefrontal regions) of default mode network. These significant group differences were identified in different sub-bands, with greater brainstem findings in higher frequencies (slow-4) and extensive default mode network and right postparietal results in lower frequencies (slow-5). Furthermore, significant relationships were found between subjective pain ratings and both amplitudes of higher frequency (slow-4) blood oxygen level-dependent (BOLD) signals in pain localization brain regions and lower frequencies (slow-5) in pain signaling/modulating brain regions in the patients, and decreased ALFF within the prefrontal regions was significantly correlated with pain duration in the patients. This result supports our hypothesis that trigeminal pain has a characteristic spatiotemporal distribution of low-frequency BOLD signals. These findings might contribute to a better understanding of the impact of CTN on the brain’s intrinsic architecture. Future studies should take the frequencies into account when measuring brain resting BOLD signals of patients with CTN.
Keywords: frequency dependent, resting fMRI, slow-4, slow-5
Introduction
Classic trigeminal neuralgia (CTN) is a unique pain disorder that is characterized by paroxysmal, electric-lancinating-like pain. It is estimated that the annual incidence is 4–5 in 100,000. It affects >360,000 people worldwide and most frequently affects individuals >50 years of age.1,2 With the aggravating aging problem, the proportion of the affected persons with CTN is gradually increasing. Despite its prevalence and potential public burden, the changes in brain underlying CTN remain poorly understood.
Neuroimaging research has greatly improved our understanding of the impact of CTN on brain. An important proportion of these studies stands for task functional magnetic resonance imaging (fMRI), which measures stimuli-evoked brain activation.3 Previous studies of task fMRI in CTN have examined whether this syndrome stems from the central mechanism of a “pain matrix”.3,4 However, variabilities in the activation results obtained by these task-related fMRI studies are quite large. One important reason may be that patients with CTN continuously process dull pain, therefore trigeminal neuralgia is easily concealed by these background activities, leading to greater variations in the functional activation.
During the past two decades, resting-state fMRI (R-fMRI), or task-free fMRI, has become an increasingly popular research paradigm in the human brain research community and an important modality in the human brain project.5–7 R-fMRI does not require specific behavioral inputs and can be obtained in the task fMRI. During the R-fMRI scan, a subject is generally informed to stay awake, to “not think about special things” or “engage in day dreaming/mind wandering”, and to keep his/her eyes open or closed. Studies from R-fMRI have revealed some basic features of the human brain’s intrinsic functional architecture, of which one important facet is the spatiotemporal structure.8 These spatial distributions are characterized by coherent oscillations of the low-frequency band of about <0.1 Hz in resting state blood oxygen level-dependent (BOLD) data. Zang et al9,10 have developed an index termed as amplitude of low-frequency fluctuation (ALFF) to measure the extent, or amplitude, of the low-frequency oscillations.
So far, many studies have shown that ALFF can serve as a potential biomarker in different neurologic diseases,11–13 physiologic phenotypes,14,15 and so on. Moreover, the brain’s oscillatory activity measured by resting BOLD signals is suitable for the investigation of alterations in spontaneous brain activity in patients with CTN. Our recent study2 also found that patients with CTN showed a disrupted local homogeneity of the resting BOLD signals across the distributed brain regions. However, due to the limitations of the local coherence of resting BOLD signals (i.e., regional homogeneity [ReHo]), the measure only reflects the similarity of local adjacent voxels in time series and cannot reflect the amplitude or intensity of local spontaneous activity.16 ALFF needs no a priori and offers a valuable tool to investigate the local features of brain oscillatory activity.
In this study, we used the ALFF to investigate the amplitude of spontaneous activity and its frequency-dependent characteristics in CTN patients. We examined changes in ALFF across different frequencies (slow-4: 0.027–0.073 Hz; slow-5: 0.01–0.027 Hz; and typical band: 0.01–0.08 Hz). We hypothesized that the patterns of low-frequency brain activities would be altered in the patients, and these alterations may be frequency-specific and related to pain behaviors.
Materials and methods
Participants
Between February 2014 and March 2015, 17 preoperative outpatients with CTN (10 females and 7 males, mean age 63.41±7.25 years) from our hospital were included for study entry. The diagnoses of CTN were based on the International Classification of Headache Disorders-3 and confirmed by experienced neurologists (Yanping Wang and Xiaoling Zhang). The inclusion criteria as defined by Headache Classification Subcommittee, 2004 were: 1) unilateral pain, within the distribution of one or more branches of the trigeminal nerve; 2) stereotyped attacks, and characteristic (intense, sharp, superficial, or stabbing paroxysmal) pains precipitated from trigger areas or by trigger factors; 3) no additional neurologic or sensory deficits; and 4) no previous surgical or other invasive procedures for CTN. Additional neurologic examination was unremarkable in all patients. All patients were given carbamazepine 300–900 mg daily. In addition, 19 age- and gender-matched healthy subjects (11 females and 8 males, mean age 61.75±6.02 years) were also recruited. All of the participants were right-handed according to their self-reports.
The exclusion criteria for both groups were: 1) related neurologic conditions or chronic pains other than CTN (for the patients with CTN); 2) current chronic pains, or family history of neuralgia (for the healthy controls [HCs]); 3) history of substance abuse, systemic, psychiatric, or neurologic disorders; 4) hypertension, diabetes, a history of brain surgery; and 5) participants unable to undergo magnetic resonance imaging (MRI) scanning. The Institutional Review Board of the Second Hospital of Jiaxing City approved the study, and all participants provided written informed consent before participation. Table 1 lists the demographics of the participants.
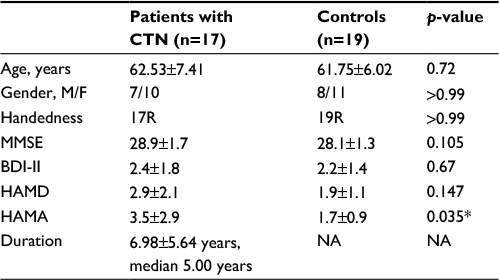 | Table 1 Demographics Notes: Data are presented as mean ± SD unless otherwise specified. *Statistically significant differences (p<0.05). Abbreviations: BDI-II, Beck’s Depression Inventory-II; CTN, classic trigeminal neuralgia; HAMD/HAMA, Hamilton Depression/Anxiety Rating Scale; M/F, male/female; MMSE, Mini-Mental Status Examination; NA, not applicable; R, right. |
Questionnaires
Before brain imaging, we asked all patients of CTN to complete the following questionnaires based on his or her current pain. Pain severity was measured by using visual analog pain scales. This scale, widely used in neuropsychology studies, provides ratings of subjective pain on 10 grades. Depression, anxiety, and general cognitive abilities were assessed by the Beck Depression Inventory-II,17 the Hamilton Depression/Anxiety Rating Scale (HAMD/A),18 and the Mini-Mental State Examination.19 Details are shown in Table 1.
MRI image acquisition
Details of MRI data acquisition are as described in our previous work.2 Briefly, T1-weighted (field of view=25.6 cm, 140 axial slices with slices thickness=1 mm, no gap) anatomic and resting-state functional (30 axial slices, TR=2 s, field of view=24 cm, 200 volumes) datasets were acquired on a 1.5 T MRI scanner (GE Medical Systems, Milwaukee, WI, USA) using a standard GE whole-head coil. Each subject was laid supine, with the head in a neutral position and fixed comfortably by a belt and foam pads during the test.
Data processing
R-fMRI data were preprocessed and analyzed using DPARSFA (http://www.restfmri.net), SPM8 (http://www.fil.ion.ucl.ac.uk/spm), and MATLAB.20 The preprocessing of R-fMRI data included exclusion of the first 10 dummy scans, slice-timing correction, within-subject realignment, co-registration to the T1 structural image with diffeomorphic anatomic registration through exponentiated lie algebra,21 nuisance regression (white matter, cerebrospinal fluid, and the 24 Friston head motion parameters22 as covariates), spatial normalization of the functional images to the Montreal Neurological Institute space, smoothing using an isotropic 6 mm3 full-width at half maximum Gaussian kernel, and low-frequency filtering (0.01–0.08 Hz). No subject of this study showed head motion with >2.0 mm maximum displacement or 2.0° of any angular motion.
ALFF calculation
On the basis of the aforementioned preprocessing, the low-frequency filtered data were then calculated for the ALFF values of all voxels in the whole brain at each individual level. Briefly, for the four-dimensional fMRI data filtered by different low frequencies (i.e., the typical, slow-4, and slow-5), the time series were first converted to the frequency domain using Fast Fourier Transform, and then the square root of the power spectrum was calculated. The average root mean square is termed as ALFF; ALFF can reflect the absolute strength of the low-frequency oscillation signal.9 To improve normality of the ALFF, we also performed Fisher Z-transform.
Statistical analyses
Clinical variables were analyzed using SPSS 16 (SPSS Inc., Chicago, IL, USA). Statistical significance was set at p<0.05.
For brain metrics of ALFF, statistics were adjusted for HAMA score and completed with SPM8. First, one-sample t-test for each group and independent two-sample t-tests for intergroups in the typical frequency band (0.01–0.08 Hz) were performed. Then, for the main effects of groups (CTN and HC) and frequencies (slow-4 and slow-5) and their interactions, a 2×2 analysis of variance model was used via SPM8’s second full factorial analysis. The regions that showed significant main effects for groups were then used for a post hoc analysis. All results were corrected by Gaussian random field cluster level p<0.05, which corresponded to a voxel p<0.001 and cluster level with a p<0.05.
Results
Demographic and clinical data
There was no significant between-group difference in gender, age, handedness, Mini-Mental State Examination, Beck Depression Inventory or HDMA (p>0.05), except for HAMA (p<0.05). Table 1 shows the demographics of the two groups. Table 2 shows the clinical variables of the CTN patients.
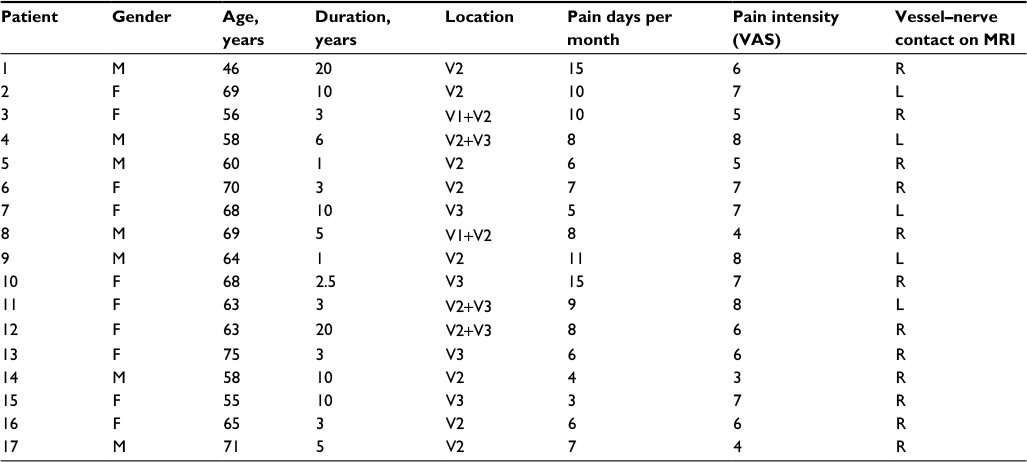 | Table 2 Clinical variables of the patients Abbreviations: F, female; L, left; M, male; MRI, magnetic resonance imaging; R, right; V2, the second branch of the trigeminal nerve; V3, the third branch of the trigeminal nerve; VAS, visual analog scale. |
ALFF in the typical band (0.01–0.08 Hz)
We started by calculating within-group ALFF results from the typical frequency band (0.01–0.08 Hz) with two-tailed one-sample t-tests. Both the CTN and HC groups exhibited a similar spatial topography, with significantly higher ALFF intensity than the whole brain mean in the default mode systems, bilateral visual cortices, bilateral middle temporal gyri, and dorsolateral prefrontal cortices. These results are compatible with the published findings and empirical data (Figure 1).
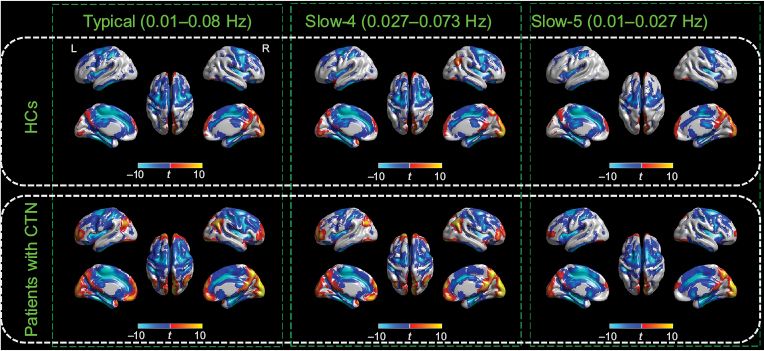 | Figure 1 Within-group effects of the ALFF. Notes: Regions of significant ALFF in the CTN and HC groups in the typical frequency band (0.01–0.08 Hz), slow-4 band (0.027–0.073 Hz), and slow-5 band (0.01–0.027 Hz) are shown separately. The effects are significant at p<0.05, FDR corrected, ≥100 contiguous voxels for one-sample t-tests. A cool color indicates that the CTN group had decreased ALFF compared with the controls and a hot color indicates the opposite. This result is rendered by using the BrainNet Viewer (https://www.nitrc.org/projects/bnv/). Abbreviations: ALFF, amplitude of low-frequency fluctuation; CTN, classic trigeminal neuralgia; FDR, false discovery rate; HC, healthy control; L, left; R, right. |
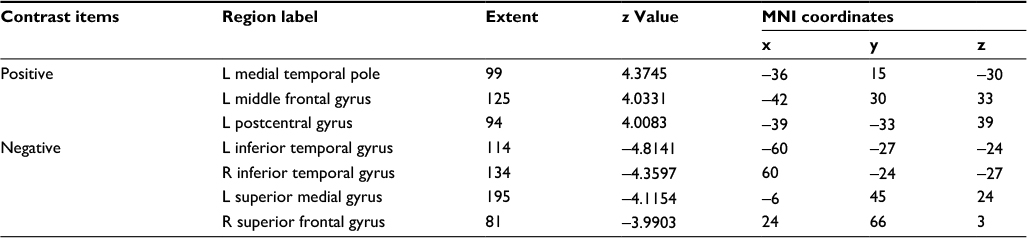
We then contrasted these ALFF patterns between the two groups. Patients with CTN showed significant ALFF increases in the left middle occipital gyrus, left middle frontal gyrus, right middle cingulate gyrus, right cerebellum (Crus 2), and bilateral temporal cortices. We also found significant ALFF decreases in the right inferior temporal and left superior medial gyri in the CTN group compared with the HC group (Figure 2; Table 3).
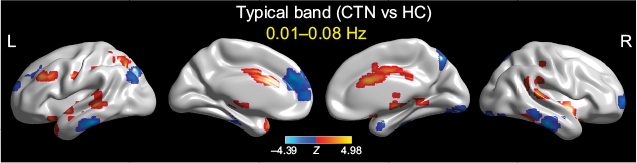 | Figure 2 Between-group differences of the ALFF in the typical frequency band (0.01–0.08 Hz). Notes: The effects are significant at voxel p<0.001, and cluster level p<0.05, GRF corrected for two-sample t-tests. A cool color indicates that the CTN group had decreased ALFF compared with the controls and a hot color indicates the opposite. This result is rendered by using the BrainNet Viewer (https://www.nitrc.org/projects/bnv/). Abbreviations: ALFF, amplitude of low-frequency fluctuation; CTN, classic trigeminal neuralgia; GRF, Gaussian random field; HC, healthy control; L, left; R, right. |
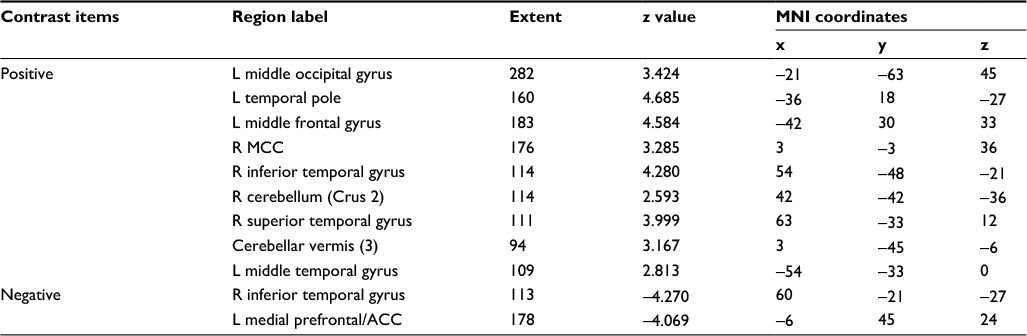 | Table 3 In the typical frequency band, detailed information for clusters showing group ALFF differences at the given threshold (p<0.05, GRF cluster corrected) Notes: Regions were automatically reported and labeled using bspmview (http://www.bobspunt.com/software/bspmview) and AnatomyToolbox atlas (http://www.fz-juelich.de/inm/inm1/DE/Forschung/_docs/SPMAnatomyToolbox/SPMAnatomyToolbox_node.html). x, y, and z=MNI coordinates in the left–right, anterior–posterior, and inferior–superior dimensions, respectively. Abbreviations: ACC, anterior cingulate cortex ALFF, amplitude of low-frequency fluctuation; GRF, Gaussian random field; L, left; MCC middle cingulate cortex; MNI, Montreal Neurological Institute; R, right. |
Recent studies utilizing a R-fMRI scheme have demonstrated frequency-dependent changes of intrinsic architecture of BOLD signals in chronic back pain, which indicate different low frequencies may be distinct across different brain parcellations.23,24 To explore the frequency-specific alterations of CTN, a special type of pain syndrome, we also divided the low-frequency range into sub-bands as previously defined: slow-5 (0.01–0.027 Hz) and slow-4 (0.027–0.073 Hz). To test for the presence of main effects and interactions, we carried out a 2×2 analysis of variance.
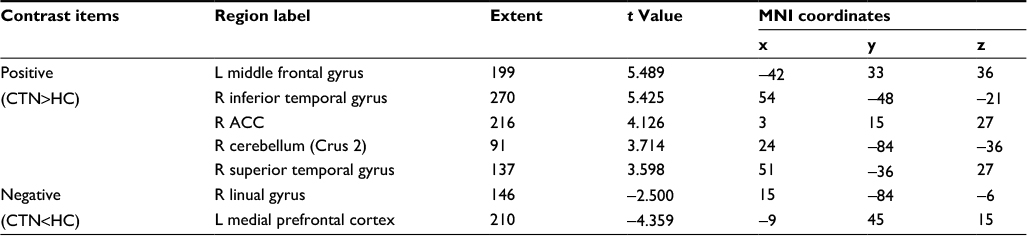
Brain areas displaying a significant main effect for group were found in the bilateral cerebellum, middle frontal gyri, lateral temporal regions, and the left insula (slow-4 > slow-5), as shown in Figure 3A and Table 4, as well as in the bilateral precuneus, the left superior/medial frontal gyrus, and the right fusiform (slow-4 < slow-5), as shown in Figure 3A and Table 4. Brain areas displaying a significant main effect for frequencies were found in the bilateral brainstem (slow-4 > slow-5), as shown in Figure 3B and Table 5, as well as in the bilateral superior orbital gyri, right postparietal region, and right precuneus (slow-4 < slow-5), as shown in Figure 3B and Table 5. There was no significant interaction between frequencies and groups.
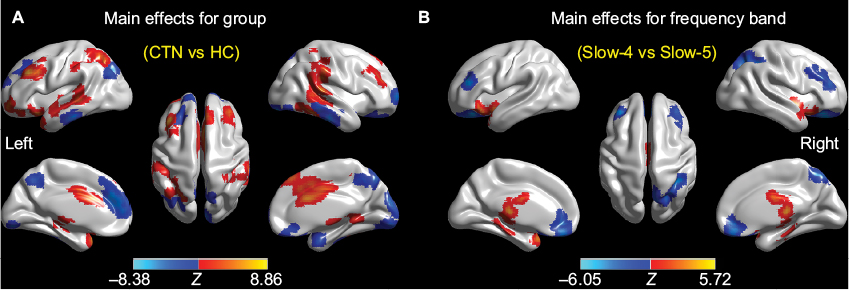 | Figure 3 Main effects for group (A) and frequency band (B) from the 2×2 ANOVA analysis. Notes: Hot color represents higher ALFF in the CTN group (or slow-4 frequency band) than in the control group (or slow-5 frequency band), respectively, whereas cool color represents the opposite. This result is rendered by using the BrainNet Viewer (https://www.nitrc.org/projects/bnv/). Abbreviations: ALFF, amplitude of low-frequency fluctuation; ANOVA, analysis of variance; CTN, classic trigeminal neuralgia; HC, healthy control; L, left; R, right. |
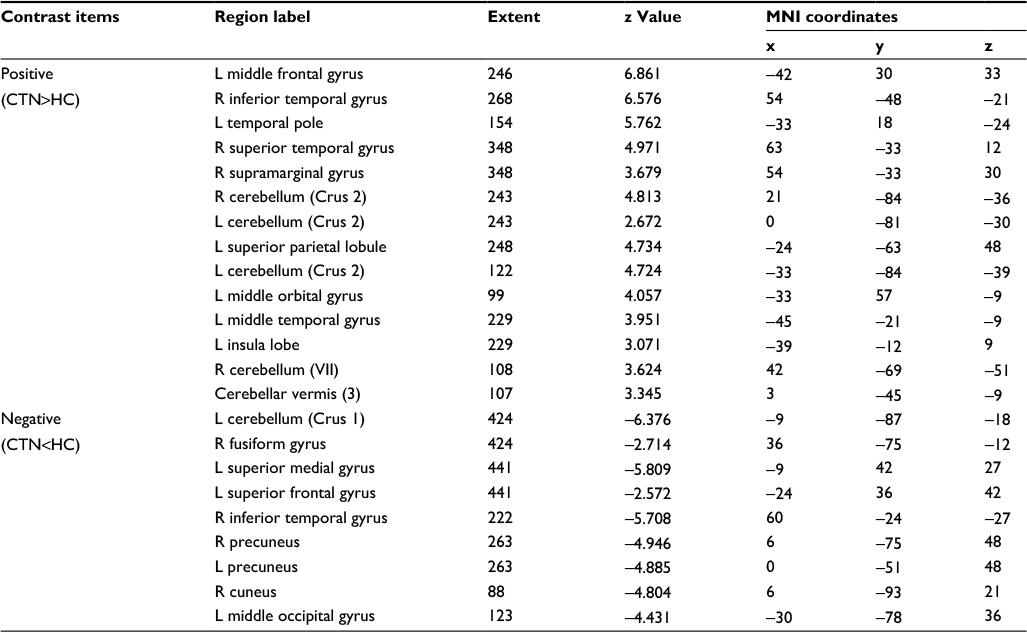 | Table 4 Main effects for groupa Notes: Regions were automatically reported and labeled using bspmview (http://www.bobspunt.com/software/bspmview) and AnatomyToolbox atlas (http://www.fz-juelich.de/inm/inm-1/EN/Forschung/_docs/SPMAnatomyToolbox/SPMAnatomyToolbox_node.html). x, y, and z=MNI coordinates in the left–right, anterior–posterior, and inferior–superior dimensions, respectively. aPositive and negative effects at a given threshold (cluster p<0.05, GRF corrected) are shown. Abbreviations: CTN, classic trigeminal neuralgia; GRF, Gaussian random field; HC, healthy control; L, left; MNI, Montreal Neurological Institute; R, right. |
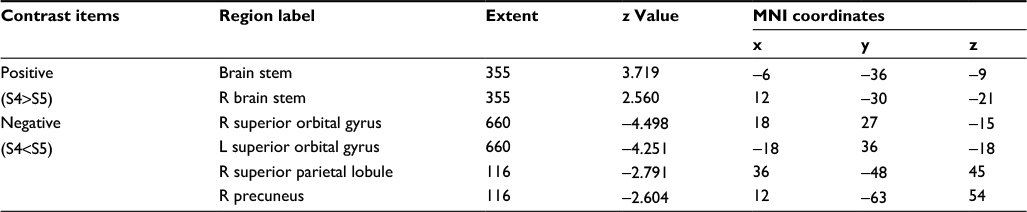 | Table 5 Main effects for frequency bandsa Notes: Regions were automatically reported and labeled using bspmview (http://www.bobspunt.com/software/bspmview) and AnatomyToolbox atlas (http://www.fz-juelich.de/inm/inm-1/EN/Forschung/_docs/SPMAnatomyToolbox/SPMAnatomyToolbox_node.html). x, y, and z=MNI coordinates in the left–right, anterior–posterior, and inferior–superior dimensions, respectively. aPositive and negative effects at a given threshold (cluster p<0.05, GRF corrected) are shown. Abbreviations: GRF, Gaussian random field; L, left; MNI, Montreal Neurological Institute; R, right; S4, slow-4; S5, slow-5. |
ALFF changes in different frequency bands (slow-4 and slow-5)
Further post hoc t-tests revealed that the group differences in ALFF in the slow-4 band were greater than those in the slow-5 band (Figure 4; Tables 6 and 7).
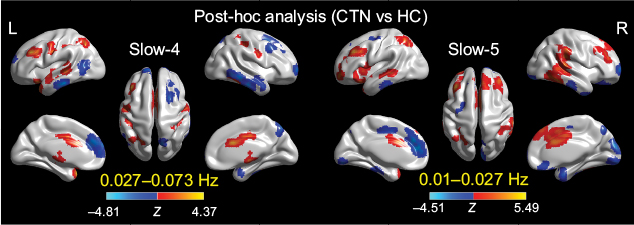 | Figure 4 Two-sample t-tests for the slow-4 (0.027–0.073 Hz) and slow-5 (0.01–0.027 Hz) frequency bands at voxel-level p<0.001 and cluster-level p<0.05, GRF corrected. Notes: Cool color indicates that the CTN group had decreased ALFF compared with the controls and hot color indicates the opposite. This result is rendered by using the BrainNet Viewer (https://www.nitrc.org/projects/bnv/). Abbreviations: ALFF, amplitude of low-frequency fluctuation; CTN, classic trigeminal neuralgia; GRF, Gaussian random field; HC, healthy control; L, left; R, right. |
 | Table 6 In the slow-4 (0.027–0.073 Hz) frequency band, detailed information for clusters showing group ALFF differences at a given threshold (cluster p<0.05, GRF corrected) Notes: Regions were automatically reported and labeled using bspmview (http://www.bobspunt.com/software/bspmview) and AnatomyToolbox atlas (http://www.fz-juelich.de/inm/inm-1/EN/Forschung/_docs/SPMAnatomyToolbox/SPMAnatomyToolbox_node.html). x, y, and z=MNI coordinates in the left–right, anterior–posterior, and inferior–superior dimensions, respectively. Abbreviations: ALFF, amplitude of low-frequency fluctuation; GRF, Gaussian random field; L, left; MNI, Montreal Neurological Institute; R, right. |
 | Table 7 In the slow-5 (0.01–0.027 Hz) frequency band, detailed information for clusters showing group ALFF differences at a given threshold (cluster p<0.05, GRF corrected) Notes: Regions were automatically reported and labeled using bspmview (http://www.bobspunt.com/software/bspmview) and AnatomyToolbox atlas (http://www.fz-juelich.de/inm/inm-1/EN/Forschung/_docs/SPMAnatomyToolbox/SPMAnatomyToolbox_node.html). x, y, and z=MNI coordinates in the left–right, anterior–posterior, and inferior–superior dimensions, respectively. Abbreviations: ACC, anterior cingulate cortex; ALFF, amplitude of low-frequency fluctuation; CTN, classic trigeminal neuralgia; GRF, Gaussian random field; HC, healthy control; L, left; MNI, Montreal Neurological Institute; R, right. |
Correlations between ALFF and neurobehavior variables
On evaluating the relationship between ALFF and behaviors in the CTN patients, we found significantly positive relationships between subjective pain ratings and amplitudes of higher frequency (slow-4) BOLD signals in pain localization brain regions and significantly negative relationships between subjective pain ratings and amplitudes of lower frequencies (slow-5) in pain signaling/modulating brain regions in the patients. We also found that decreased ALFF within the medial/orbital prefrontal regions was negatively correlated with pain duration in the patients.
Discussion
We investigated the ALFF, a widely used index of resting fMRI, and its spatiotemporal (i.e., location- and frequency-dependent) changes in patients with CTN. In the typical band (0.01–0.08 Hz), we found that patients with CTN showed increases in ALFF in the bilateral temporal, occipital, and left middle frontal regions and in the left middle cingulate gyrus, as well as decreases of ALFF in the right inferior temporal gyrus and the medial prefrontal cortex. These significant group differences were identified in different sub-bands, and even more differences were found in sub-bands, with greater brainstem findings in slow-4 (0.027–0.073 Hz) and extensive bilateral preorbital frontal, right post-parietal, and precuneus results in slow-5 (0.01–0.027 Hz). Furthermore, significant relationships were found among subjective pain ratings and amplitudes of higher frequency (slow-4) BOLD signals in pain localization brain regions and lower frequencies (slow-5) in pain signaling/modulating brain regions in the patients. We also found that decreased ALFF within the medial/orbital prefrontal regions was significantly correlated with pain duration in the patients. This result supports our hypothesis that trigeminal pain has a characteristic spatiotemporal low-frequency BOLD signal property. These findings might contribute to a better understanding of the impact of CTN on the brain’s intrinsic architecture.
Most R-fMRI studies address functional connectivity or functional interactions between distant brain regions, while the local features that describe these intrinsic signals are also important. ALFF and ReHo belong to two analyses that describe local spontaneous brain activity. These two measures are relatively straightforward and complement each other. Many physiologic and neurologic processes can affect the low-frequency oscillatory signals, and ALFF is higher in gray matter than white matter.6,8,9 In the resting state, the ALFF is higher across the DMN and visual cortices and has a certain hierarchical distribution in different anatomic functional partitioning units.8
Our results of increased ALFF in bilateral temporal, occipital, and the left middle cingulate regions, as well as decreased ALFF in the medial prefrontal cortex (also noted as the hub region of the DMN) in patients with CTN are generally consistent with our previous report2 and other published findings.25–31 One interesting result is the decreases in ALFF in the medial prefrontal cortex, which constitutes a hub region of the DMN.32 The DMN32 is the most stable and extensively studied so far and is generally believed to address spontaneous, unconstrained, and self-referential cognitive processes. Intrinsic activity in the DMN is highest during rest, and stimuli-evoked or goal-directed tasks that engage in the attentional and control resources usually reduce the activity.32 Similarly, a variety of pain processes are associated with decreases in the DMN activity, including chronic low back pain,23,24 fibromyalgia,33 and migraine,34 and the default activity is increasingly recognized as a characteristic change of chronic pain. The reduction in DMN activity may represent the maintenance of attention and vigilance of pain and reflect CTN as a background pain sensation that interferes with the resting state of the brain that is dominated by the default network and continues to be nuisance stimulating. One illustrative example is that a more recent study found that patients with fibromyalgia who listened to their preferred relaxing music and an auditory control can increase ALFF in the DMN.35
In addition to the DMN changes, we also found increased ALFF in the bilateral temporal, occipital, and left middle cingulate regions. Similar to other chronic pain syndromes, previous studies have found that morphologic and functional changes in the temporal lobe and fusiform gyrus are more prominent. For example, Obermann et al29 used voxel-based morphometry analysis and found that temporal gray matter size of CTN patients was significantly reduced and correlated with the course of the disease. Desouza et al25,26 utilized a finer morphometric analysis and found that cortical thickness of patients with CTN has changed significantly. Cortical thickness changes occur across the areas that process noxious stimulation, such as orbital frontal cortex, insula, sensorimotor, (anterior) cingulate, and temporal regions. May36 summarized the voxel-based morphometry results of 15 chronic pains from 30 published papers using meta-analysis and showed that changes in the cortices (increased or decreased gray matter) occur in different pain syndromes but in some common regions such as the anterior cingulate, temporal lobe, prefrontal cortex, thalamus, motor cortex, brainstem, dorsal lateral prefrontal cortex, and insula. In another study that included both patients with trigeminal neuralgia and trigeminal neuropathy, Gustin et al37 reported a reduction of gray matter size in the sensorimotor and basal areas. In a report of migraine headache, it was also found that the volume of the fusiform gyrus was reduced.38 The temporal and occipital regions are involved in multidimensional sensory processing, which may reflect the CTN pathophysiology related to including continuous processing of nociceptive input information and large-scale functional brain network communication.
Like many other chronic pains, CTN is a unique maladaptive process and affects the brain function and behavior through adjusting the cortical oscillatory rhythms both locally and globally. Baliki et al23 established the link between chronic back pain and its frequency-dependent architecture of resting BOLD signals; they found the signals in patients showed a shift to high-frequency dynamics, with increases focusing on the medial prefrontal cortex and the DMN.
Previous studies have also suggested the role of precuneus in chronic pain and the pathologic changes of CTN. Parise et al30 have reported cortical thinning of the precuneus and inferior temporal/fusiform gyrus in CTN patients. Although the cuneus and inferior temporal gyrus are often associated with visual information processing, they are limited by the area of the superior colliculus – a multidimensional information integration. One of the presumed functions of the cuneus seems to be the integration of somatosensory information and other sensory stimulation and cognitive processes such as attention, learning, and memory. These regions have also been reported to be associated with sensory motor zones and other pain-related areas, such as the trigeminal nerve distribution region and the distribution area that are induced by thermal pain stimulation and Aδ fibrosis selective stimulation. In healthy subjects, electric shock pain also activates a series of cortical regions, including the left fusiform, hippocampus, primary and secondary visual cortex, extending to the precuneus and a more dopamine pathway network. The dorsal attention network, activated in the shock stimulus, may involve the process of mental imagination related to the extraction of electric shock perception.39 The pain of CTN is essentially similar to the nature of the electric shock and, therefore, may also lead to similar activation location. Desouza et al25,26 also found that the lateral frontal lobe and the orbital frontal cortex of CTN patients were also thinner, and the loss of the cortical gray matter could also explain the reduction in the spontaneous activity of the medial frontal lobe in this study. In addition, the changes in the brain activity of the fusiform gyrus and precuneus can be activated by trigeminal nerve Aδ fibers and may be involved in the interpretation of the triggering of trigeminal mental activity.40
There are several limitations in this study. The role of carbamazepine on intrinsic brain activity is largely unknown, but we think this effect would be limited. Our sample size was relatively small, which limited the statistical power. Future studies using a larger sample size to increase the test–retest reliability are required.
Conclusion
Results from resting-state oscillations in typical frequency bands showed increases in ALFF in sensorimotor, multidimensional sensory processing, and interoceptive systems, as well as decreases in the default system, suggesting that the pathophysiologic basis of CTN involves the inclusion of sustained processing of noxious inputs and disruptions in modular segregation. The significant group differences identified in different sub-bands with greater brainstem findings in slow-4 (0.027–0.073 Hz) and extensive bilateral preorbital frontal, right posterior parietal, and precuneus results in slow-5 (0.01–0.027 Hz) support our hypothesis that trigeminal pain has a characteristic spatiotemporal resting state in the fMRI low-frequency BOLD signal properties. These findings might contribute to a better understanding of the impact of CTN on the brain’s intrinsic architecture. Future research should take the frequencies into account when investigating the brain resting BOLD signals of patients with CTN.
Acknowledgment
This work was supported by grants from the Science and Technology Plan Projects of Jiaxing (grant no. 2016AY23049).
Disclosure
The authors report no conflicts of interest in this work.
References
Zakrzewska JM, Linskey ME. Trigeminal neuralgia. BMJ. 2014; 348:g474. | ||
Wang Y, Zhang X, Guan Q, Wan L, Yi Y, Liu CF. Altered regional homogeneity of spontaneous brain activity in idiopathic trigeminal neuralgia. Neuropsychiatr Dis Treat. 2015;11:2659–2666. | ||
Moissetl X, Villainl N, Ducreuxl D, et al. Functional brain imaging of trigeminal neuralgia. Eur J Pain. 2011;15(2):124–131. | ||
Costa GMF, Leite CMDA. Trigeminal neuralgia: peripheral and central mechanisms. Revista Dor. 2015;16(4):297–301. | ||
Biswal BB, Mennes M, Zuo XN, et al. Toward discovery science of human brain function. Proc Natl Acad Sci U S A. 2010;107(10):4734–4739. | ||
Biswal B, Zerrin Yetkin F, Haughton VM, Hyde JS. Functional connectivity in the motor cortex of resting human brain using echo-planar mri. Magn Reson Med. 1995;34(4):537–541. | ||
Smith SM, Beckmann CF, Andersson J, et al. Resting-state fMRI in the human connectome project. Neuroimage. 2013;80:144–168. | ||
Zuo XN, Di Martino A, Kelly C, et al. The oscillating brain: complex and reliable. Neuroimage. 2010;49(2):1432–1445. | ||
Zang YF, He Y, Zhu CZ, et al. Altered baseline brain activity in children with ADHD revealed by resting-state functional MRI. Brain Dev. 2007;29(2):83–91. | ||
Zou QH, Zhu CZ, Yang Y, et al. An improved approach to detection of amplitude of low-frequency fluctuation (ALFF) for resting-state fMRI: fractional ALFF. J Neurosci Methods. 2008;172(1):137–141. | ||
Hoptman MJ, Zuo XN, Butler PD, et al. Amplitude of low-frequency oscillations in schizophrenia: a resting state fMRI study. Schizophr Res. 2010;117(1):13–20. | ||
Han Y, Wang J, Zhao Z, et al. Frequency-dependent changes in the amplitude of low-frequency fluctuations in amnestic mild cognitive impairment: a resting-state fMRI study. Neuroimage. 2011;55(1):287–295. | ||
Hou Y, Wu X, Hallett M, Chan P, Wu T. Frequency-dependent neural activity in Parkinson’s disease. Hum Brain Mapp. 2014;35(12):5815–5833. | ||
Wei L, Duan X, Zheng C, et al. Specific frequency bands of amplitude low-frequency oscillation encodes personality. Hum Brain Mapp. 2014;35(1):331–339. | ||
Gao L, Bai L, Zhang Y, et al. Frequency-dependent changes of local resting oscillations in sleep-deprived brain. PLoS One. 2015;10(3):e120323. | ||
Zang Y, Jiang T, Lu Y, He Y, Tian L. Regional homogeneity approach to fMRI data analysis. Neuroimage. 2004;22(1):394–400. | ||
Beck AT, Ward CH, Mendelson M, Mock J, Erbaugh J. An inventory for measuring depression. Arch Gen Psychiatry. 1961;4:561–571. | ||
Hamilton M. The assessment of anxiety states by rating. Br J Med Psychol. 1959;32(1):50–55. | ||
Tombaugh TN, McIntyre NJ. The mini-mental state examination: a comprehensive review. J Am Geriatr Soc. 1992;40(9):922–935. | ||
Chao-Gan Y, Yu-Feng Z. DPARSF: A MATLAB Toolbox for “Pipeline” Data Analysis of Resting-State fMRI. Front Syst Neurosci. 2010;4:13. | ||
Ashburner J. A fast diffeomorphic image registration algorithm. Neuroimage. 2007;38(1):95–113. | ||
Friston KJ, Williams S, Howard R, Frackowiak RS, Turner R. Movement-related effects in fMRI time-series. Magn Reson Med. 1996;35(3):346–355. | ||
Baliki MN, Baria AT, Apkarian AV. The cortical rhythms of chronic back pain. J Neurosci. 2011;31(39):13981–13990. | ||
Baliki MN, Geha PY, Apkarian AV, Chialvo DR. Beyond feeling: chronic pain hurts the brain, disrupting the default-mode network dynamics. J Neurosci. 2008;28(6):1398–1403. | ||
Desouza DD, Moayedi M, Chen DQ, Davis KD, Hodaie M. Sensorimotor and pain modulation brain abnormalities in trigeminal neuralgia: a paroxysmal, sensory-triggered neuropathic pain. PLoS One. 2013;8(6):e66340. | ||
Desouza DD, Hodaie M, Davis KD. Structural magnetic resonance imaging can identify trigeminal system abnormalities in classical trigeminal neuralgia. Front Neuroanat. 2016;10:95. | ||
Dou Z, Zhang X, Yang L, et al. Alternation of regional homogeneity in trigeminal neuralgia after percutaneous radiofrequency thermocoagulation: a resting state fMRI study. Medicine (Baltimore). 2016;95(42):e5193. | ||
Li M, Yan J, Li S, et al. Reduced volume of gray matter in patients with trigeminal neuralgia. Brain Imaging Behav. 2017;11(2):486–492. | ||
Obermann M, Rodriguez-Raecke R, Naegel S, et al. Gray matter volume reduction reflects chronic pain in trigeminal neuralgia. Neuroimage. 2013;74:352–358. | ||
Parise M, Kubo TT, Doring TM, Tukamoto G, Vincent M, Gasparetto EL. Cuneus and fusiform cortices thickness is reduced in trigeminal neuralgia. J Headache Pain. 2014;15:17. | ||
Wang Y, Li D, Bao F, et al. Thalamic metabolic alterations with cognitive dysfunction in idiopathic trigeminal neuralgia: a multivoxel spectroscopy study. Neuroradiology. 2014;56(8):685–693. | ||
Raichle ME. The brain’s default mode network. Annu Rev Neurosci. 2015;38:433–447. | ||
Napadow V, LaCount L, Park K, As Sanie S, Clauw DJ, Harris RE. Intrinsic brain connectivity in fibromyalgia is associated with chronic pain intensity. Arthritis Rheum. 2010;62(8):2545–2555. | ||
Tessitore A, Russo A, Giordano A, et al. Disrupted default mode network connectivity in migraine without aura. J Headache Pain. 2013; 14(1):89. | ||
Garza-Villarreal EA, Jiang Z, Vuust P, et al. Music reduces pain and increases resting state fMRI BOLD signal amplitude in the left angular gyrus in fibromyalgia patients. Front Psychol. 2015;6:1051. | ||
May A. Structural brain imaging: a window into chronic pain. Neuroscientist. 2011;17(2):209–220. | ||
Gustin SM, Peck CC, Wilcox SL, Nash PG, Murray GM, Henderson LA. Different pain, different brain: thalamic anatomy in neuropathic and non-neuropathic chronic pain syndromes. J Neurosci. 2011; 31(16):5956–5964. | ||
Yang FC, Chou KH, Fuh JL, et al. Altered gray matter volume in the frontal pain modulation network in patients with cluster headache. Pain. 2013;154(6):801–807. | ||
Ter Minassian A, Ricalens E, Humbert S, Duc F, Aube C, Beydon L. Dissociating anticipation from perception: acute pain activates default mode network. Hum Brain Mapp. 2013;34(9):2228–2243. | ||
Veldhuijzen DS, Nemenov MI, Keaser M, Zhuo J, Gullapalli RP, Greenspan JD. Differential brain activation associated with laser-evoked burning and pricking pain: an event-related fMRI study. Pain. 2009;141(1–2):104–113. |
 © 2017 The Author(s). This work is published and licensed by Dove Medical Press Limited. The
full terms of this license are available at https://www.dovepress.com/terms
and incorporate the Creative Commons Attribution
- Non Commercial (unported, 3.0) License.
By accessing the work you hereby accept the Terms. Non-commercial uses of the work are permitted
without any further permission from Dove Medical Press Limited, provided the work is properly
attributed. For permission for commercial use of this work, please see paragraphs 4.2 and 5 of our Terms.
© 2017 The Author(s). This work is published and licensed by Dove Medical Press Limited. The
full terms of this license are available at https://www.dovepress.com/terms
and incorporate the Creative Commons Attribution
- Non Commercial (unported, 3.0) License.
By accessing the work you hereby accept the Terms. Non-commercial uses of the work are permitted
without any further permission from Dove Medical Press Limited, provided the work is properly
attributed. For permission for commercial use of this work, please see paragraphs 4.2 and 5 of our Terms.