Back to Journals » Infection and Drug Resistance » Volume 15
Space-Time Distribution Characteristics of Tuberculosis and Its Socioeconomic Factors in Southern China from 2015 to 2019
Authors Lin Y, Liang D, Liang X, Huang M, Lin M, Cui Z ![]()
Received 10 January 2022
Accepted for publication 12 May 2022
Published 20 May 2022 Volume 2022:15 Pages 2603—2616
DOI https://doi.org/10.2147/IDR.S356292
Checked for plagiarism Yes
Review by Single anonymous peer review
Peer reviewer comments 3
Editor who approved publication: Professor Suresh Antony
Yangming Lin,1 Dabin Liang,2 Xiaoyan Liang,2 Minying Huang,2 Mei Lin,2 Zhezhe Cui2
1School of Public Health, Guangxi Medical University, Nanning, Guangxi Zhuang Autonomous Region, 530021, People’s Republic of China; 2Guangxi Key Laboratory of Major Infectious Disease Prevention and Control and Biosafety Emergency Response, Guangxi Zhuang Autonomous Region Center for Disease Control and Prevention, Nanning, Guangxi Zhuang Autonomous Region, 530028, People’s Republic of China
Correspondence: Mei Lin; Zhezhe Cui, Guangxi Key Laboratory of Major Infectious Disease Prevention and Control and Biosafety Emergency Response, Guangxi Zhuang Autonomous Region Center for Disease Control and Prevention, Nanning, Guangxi Zhuang Autonomous Region, 530028, People’s Republic of China, Tel +86-771-2518766 ; +86-771-2518785, Email [email protected]; [email protected]
Purpose: Guangxi is a high prevalence area of tuberculosis (TB) in China, urgent needing of further TB reduction. Our purpose is to analyze the epidemiological characteristics of TB in Guangxi and analyze the relationship between socioeconomic factors and TB from the dimensions of time and space to provide evidence to effectively prevent and control TB.
Patients and Methods: We performed a retrospective analysis of the epidemiology of TB. Moran’s index (I) was used for spatial autocorrelation analysis, and space-time scanning was used to detect temporal, space, and space-time clusters of TB. A Bayesian space-time model was used to analyze related factors of the TB epidemic at the county level in Guangxi.
Results: From 2015 to 2019, a total of 233,623 TB cases were reported in Guangxi. The majority of TB cases were in males; the reported incidence of TB was the highest in people aged ≥ 65 years. By occupation, farmers were the most frequently affected. The overall reported incidence of TB decreased by 4.95% during this period. Tuberculosis occurs all year round, but the annual reporting peak is usually from March to July. Spatial autocorrelation analysis showed that the reported incidence of TB in 2015– 2019 was spatially clustered (Moran’s I > 0, P < 0.05); Kulldorff’s scan revealed that the space-time cluster (log-likelihood ratio = 2683.76, relative risk = 1.60, P < 0.001) was mainly concentrated in northern Guangxi. Using Bayesian space-time modeling, socioeconomic and healthcare factors are related to the high prevalence of TB.
Conclusion: The prevalence of TB is influenced by a space-time interaction effect and is associated with socioeconomic and healthcare status. It is necessary to improve the economic development and health service in areas with a high TB prevalence.
Keywords: tuberculosis, space-time model, associated factors, Guangxi
Graphical Abstract:

Introduction
Tuberculosis (TB) is a chronic infectious disease that is an important threat to human health. The global TB prevention and control programs have made great improvements. Since 2005, China’s comprehensive coverage observation treatment + short-term chemotherapy (DOTS) strategy. With the joint efforts of governments at all levels in China, the prevention and control of tuberculosis has achieved remarkable results, therefore the incidence of tuberculosis has kept going down. Likewise, under the joint efforts of all levels of government in Guangxi, the incidence of tuberculosis in Guangxi also showed a downward trend year by year. However, the current TB epidemic situation remains grim. According to the global TB report in 2021,1 987 million new TB patients and 12.8 million TB deaths were reported in 2020. TB is the 13th leading cause of death worldwide. China is the second largest country with a high burden of TB, and 842,000 new TB cases were reported in 2020. At the same time, China faces many challenges, such as a high prevalence, death toll, TB resistance rate, and TB infection rate, and co-infection with HIV is also prevalent.2 Guangxi, located in southern China, is a region with a high epidemic TB rate.3 Thus, Guangxi is a key region for TB control.
Research shows that there is space-time clustering of TB incidence in geographical space and over time. However, due to the limitation of traditional statistical analysis method, it is difficult to use the spatial and temporal information in the data of infectious diseases, and cannot reflect the space-time interaction of diseases. Therefore, spatial analysis tools (such as ArcGIS, GeoDa, spatial packages of R software, etc.) provide a convenient for analysis of the temporal and spatial characteristics of tuberculosis.4–6 However, there is little evidence of the space-time epidemic characteristics of TB in Guangxi. Therefore, this study used a retrospective method to analyze the epidemiological characteristics of TB in Guangxi from 2015 to 2019 from the dimensions of time, space, and space-time, to explore the space-time clustering characteristics of TB in Guangxi, to identify high-risk periods and areas of TB, and to provide a scientific basis and reference for effective TB prevention and control planning in the future.
The transmission and prevalence of tuberculosis is affected by many factors. Research shows that the prevalence of TB is affected by factors such as economic level and health service level in different periods and regions, thus affecting the local TB incidence rate.7–11 However, there are few joint analyses at the temporal and spatial levels. Therefore, based on district-level TB data in Guangxi from 2015 to 2019, a Bayesian space-time model was constructed to explore the influence of associated factors on the incidence of TB in Guangxi while considering socioeconomic and health service level to provide a scientific basis for the effective regional prevention and control of TB.
Methods
Study Site
Guangxi Zhuang Autonomous Region had been selected as the research site in this study. It is located in Southern China, 20°54′∼26°24′ N, 104°26′∼112°04′ E, and the tropic of cancer crosses the middle part. Guangxi accounts or 2.5% of China ‘s total area with an area of 236,700 square kilometres and comprises 111 districts. In 2019, the resident population of Guangxi was about 49.82 million.
Data Sources
Data on all TB cases reported in 111 districts of Guangxi from January 2015 to December 2019 were obtained from the communicable disease surveillance system of the Guangxi Center for Disease Control and Prevention(CDC). Tuberculosis data specifically include age, sex, occupation, and type of case diagnosis. Diagnostic criteria for tuberculosis cases refer to Health Industry Standards of the People’s Republic of China - Diagnostic criteria for tuberculosis (WS 288–2017).12 District demographic, economic and health services data were provided by the Guangxi Bureau of Statistics. A digital map was generated from geographical boundary data at the county level.
Statistical Analyses
Seasonal Analysis
Seasonal analysis is divided into: seasonal characteristics analysis and seasonal intensity analysis. Seasonal characteristics analysis is to analyze the periodic variation index in a certain period of time series due to seasonal changes. The change of time series is affected by four factors: long-term trend (T), seasonal change (S), periodic change (C) and irregular change (I). This study uses seasonal decomposition of time series for analysis. The seasonal decomposition method uses moving average method to eliminate long-term trends and periodic changes, and obtains sequence TC. Then according to the monthly average method to calculate the seasonal index S; draw scatter plot, select suitable curve model to fit the long-term trend of time series, get the long-term trend T; the periodic factor C is calculated, and the periodic variation factor C can be obtained by dividing the sequence TC by T; finally, the T, S and C of the time series are decomposed, and the remaining variables are the irregular variable factors I.
Spatial Autocorrelation Analysis
The global Moran’s I statistics reflects the spatial correlation of a phenomenon in the whole study area. The Moran’s I index and P value are calculated to determine whether the spatial autocorrelation pattern is clustering, discrete or random. The global Moran’s I range is (−1, 1). When I > 0, and P < 0.05, the spatial distribution was positively correlated, when I < 0, and P < 0.05, was negatively correlated. When I = 0, there is no autocorrelation, namely, random distribution. The local Moran’s I Index is used to describe the autocorrelation pattern between spatial units in the study area. When local Moran’s I > 0 and P < 0.05, it indicates that the attribute value of the space is similar to that of the surrounding space (high-high or low-low); when local Moran’s I < 0, and P < 0.05, it indicates that the attribute value of the space is opposite to the spatial distribution around (high-low or low-high). In this study, global Moran’s I index was used for global spatial autocorrelation analysis to evaluate the spatial clustering of tuberculosis reported incidence in Guangxi. Local Moran’s I index was used to detect high-risk and low-risk areas of reported TB incidence. The spatial weight matrix was established based on the Rook weight in the adjacent rules, and the permutation is carried out by random 999.
Space-Time Scan Analysis
The temporal, spatial, and space-time clustering of TB were detected using Kulldorff’s space-time scanning statistical analysis to verify whether the geographical clustering of TB was caused by random variation.13 A discrete Poisson probability model was used for scanning. Of the total population, 15% was set to the maximum spatial scanning radius. The window with the maximum likelihood was defined as the most likely cluster area, and other clusters with statistically significant log-likelihood ratios (LLR) were defined as potential secondary clusters. P-values of LLR were estimated with 9999 Monte Carlo simulations.14,15 A P < 0.05 indicates that there is a significant high risk within the scan window, which may be a potential cluster of high risk for TB. We calculated the relative risk (RR) of TB in each cluster to assess the risk of TB in the cluster areas.16,17
Bayesian Space-Time Modeling
The reported incidence of TB in the districts of Guangxi from 2015 to 2019 was considered the dependent variable. Nine factors including the proportion of males (%), the proportion of rural residents (%), the per capita GDP (yuan), the per capita disposable income of urban households (yuan), the per capita net income of rural residents (yuan), the number of beds per 1000 population in local healthcare institutions, the number of medical and technical personnel at healthcare institutions per 1000 population, the number of practitioner (assistant) doctors per 1000 population, and forest coverage (%) were used as independent variables. To eliminate the possible effect of collinearity among the covariates on the model, stepwise regression analysis was used to screen the variables in the first step, tolerance difference is used to test collinearity, and the variables with P < 0.05 are included in the Bayesian space-time model.
The Bayesian space-time model is a model based on Bayesian statistical theory that reveals temporal and spatial changes in space-time data. The model is based on a Bayesian space model, which is extended by incorporating a time effect. To model TB cases, Poisson regression is typically used. yit is the observed number of TB cases at time t in district i, which was assumed to follow a Poisson distribution: yit∼Poisson (Eit, θit). In other words, yit∼dpois (muit), muit = Eit*θit, where muit is the expected number of TB cases at time t in district i, Eit is the total number of people at time t in district i, and θit is the relative risk of disease at time t in district i. The mathematical form of the Bayesian space-time model is as follows:

where α is the intercept, μi is the spatial effect, vi is the spatial unstructured effect, gt is the time trend effect, and oit is the space-time interaction effect. The model corrects the space-time variation trends of the disease, and the covariate βxit was used to explore the influence of related factors on TB.
For the intercept (α), a non-informative prior distribution was used, prior distributions for the coefficients (β) were assumed to have normal distributions, and the prior distribution of an unknown parameter used a uniform distribution. Normal distribution and conditional autoregressive models were used for the prior distribution of spatial unstructured effects (vi) and spatial correlation effects (μi), respectively. A prior distribution of the time effect (gt) used first-order autoregressive modeling.
In the establishment of Bayesian space-time model, according to the basic form of Bayesian space-time model. Four models with different effects can be established:
Non-spatial effect model: θit = exp (α+βxit + vi)
Spatial effect model: θit = exp (α+βxit + μi + vi)
Space-time effect model: θit = exp (α+βxit + μi + vi + gt)
Space-time Interaction effect model: θit = exp (α+βxit + μi + vi + gt + oit).
We used the deviance information criterion (DIC) to select the Bayesian model. The smaller the DIC value of the model, the better the model fit.
SPSS v.26.0 was used for statistical analysis, and two-sided P-values < 0.05 were considered statistically significant. The Cochran–Armitage Trend Test was performed using the CATT package in R v.4.0.4. Seasonal decomposition analysis was carried out using the forecast package in R v.4.0.4. Geographic analysis was performed using ArcGIS 10.2.1 and GeoDa 1.8. Space-time scan analysis was performed using SaTScan 10.0. Visual space-time scanning was done using the sp package in R v.4.0.4. Bayesian space-time modeling and analysis were performed using WinBUGS 1.4.3.
Results
Descriptive Analysis
Temporal Trends in the Reported Incidence of TB
In Guangxi from 2015 to 2019, the number of TB cases and the overall reported incidence of TB were 233,623 and 9.53%, respectively. The reported incidence of TB decreased in Guangxi during this period (Cochran–Armitage Trend Test, Z = −24.24, P < 0.001). During this period, there was a 4.95% decrease in the overall reported incidence of TB and a 2.56% decrease from 2015 to 2016 (Table 1).
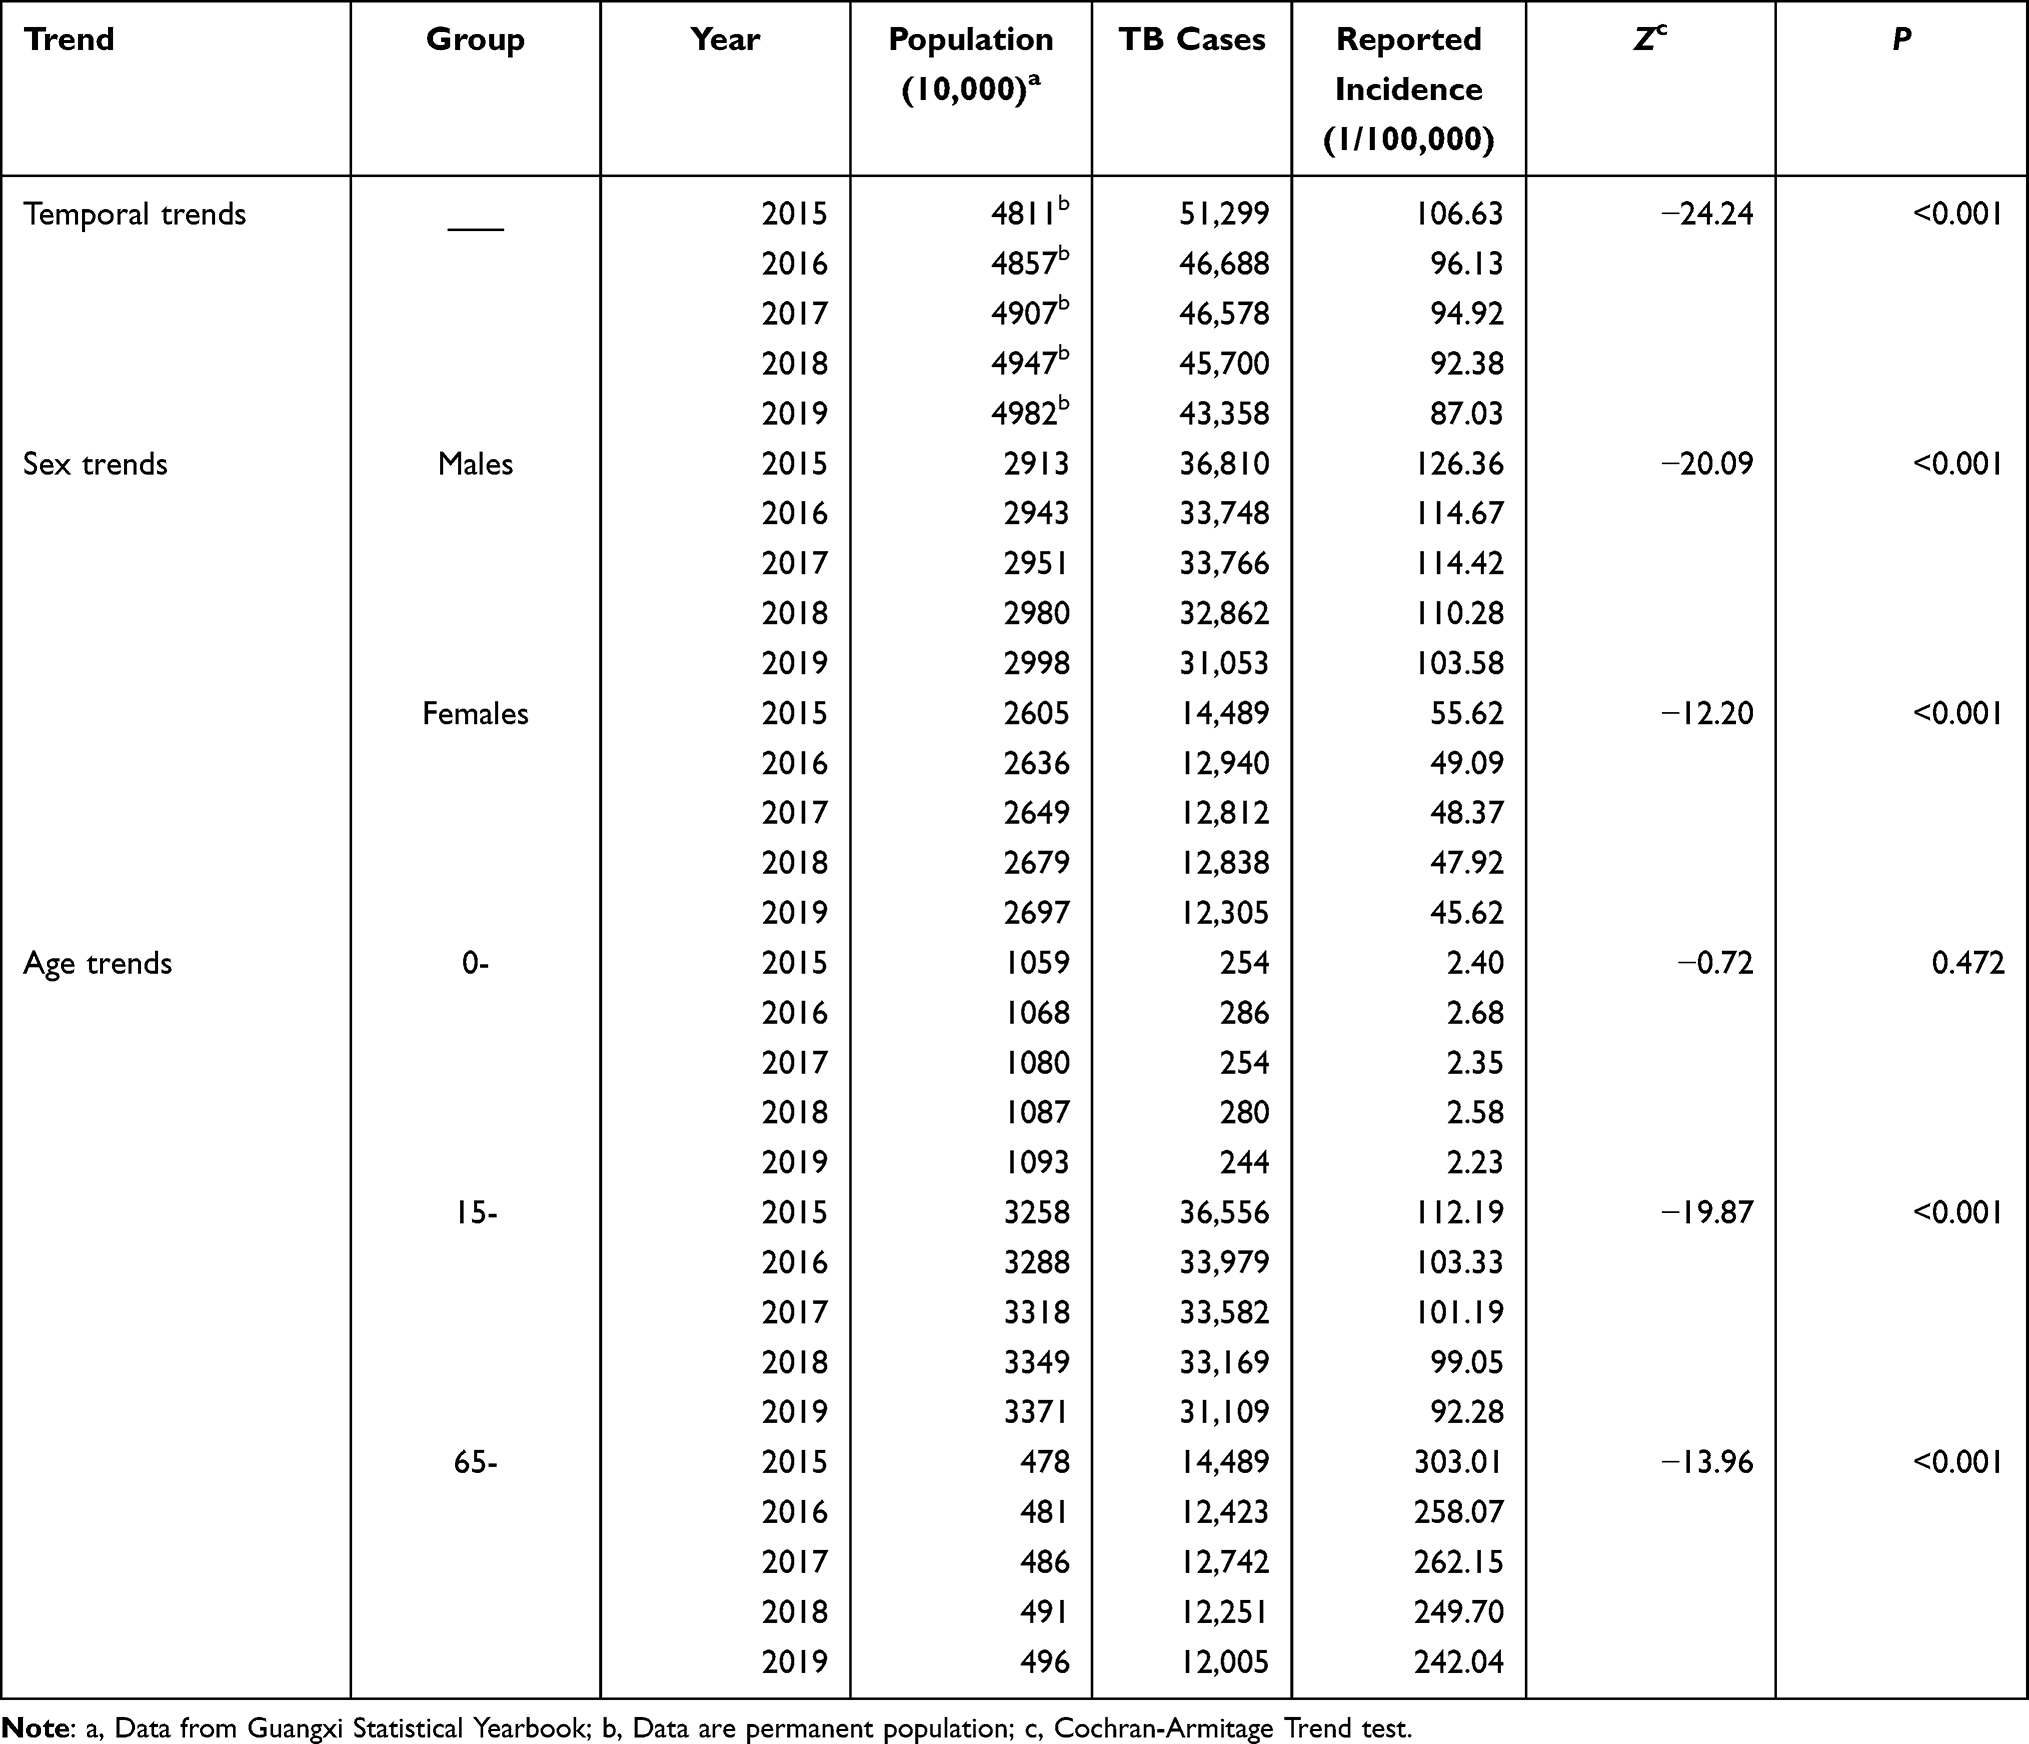 |
Table 1 Trends in Reported Incidence of Tuberculosis in Guangxi, 2015–2019 |
Seasonal decomposition analysis of time series was performed on the number of monthly TB cases (Figure 1). There were rhythmic fluctuations in the raw data. After removing the random noise or reminder components, there was an obvious reporting peak. Tuberculosis occurs all year round, but the annual reporting peak is usually from March to July. In addition, the number of TB cases showed a downward trend.
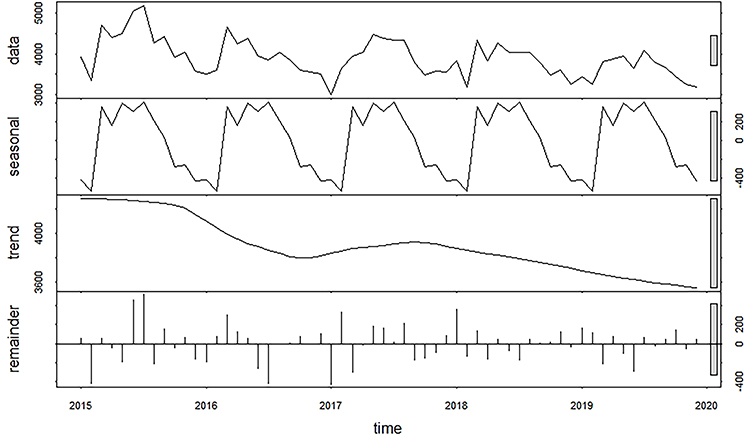 |
Figure 1 Seasonal decomposition analysis TB cases in Guangxi from 2015 to 2019. |
Trends in the Reported Incidence of TB According to Sex and Age
The reported incidence of TB among males and females decreased in Guangxi from 2015 to 2019 (P<0.001). During this period, the reported incidence of TB in males decreased by 4.85%, with a decrease of 2.40% in 2015−2016. The reported incidence of TB in women during this period decreased by 4.83%, with a decrease of 3.07% in 2015−2016. The reported incidence of TB was higher in males than in females (Table 1). During this period, the 5.46% decrease in the reported incidence of TB among those ≥65 years old included a 3.93% decrease from 2015 to 2016. The reported incidence of TB was higher among ≥65-year-olds than among other age groups (Table 1).
The Reported Incidence of TB According to Occupation
The occupations with the top five highest frequencies of reported TB incidence were farmers (74.66%), unemployed (6.52%), retirees (4.89%), students (3.14%), and others (3.11%); these together accounted for 92.31% of the total. Moreover, the reported TB cases were overwhelmingly concentrated among farmers during the 5 years of the study (Figure 2).
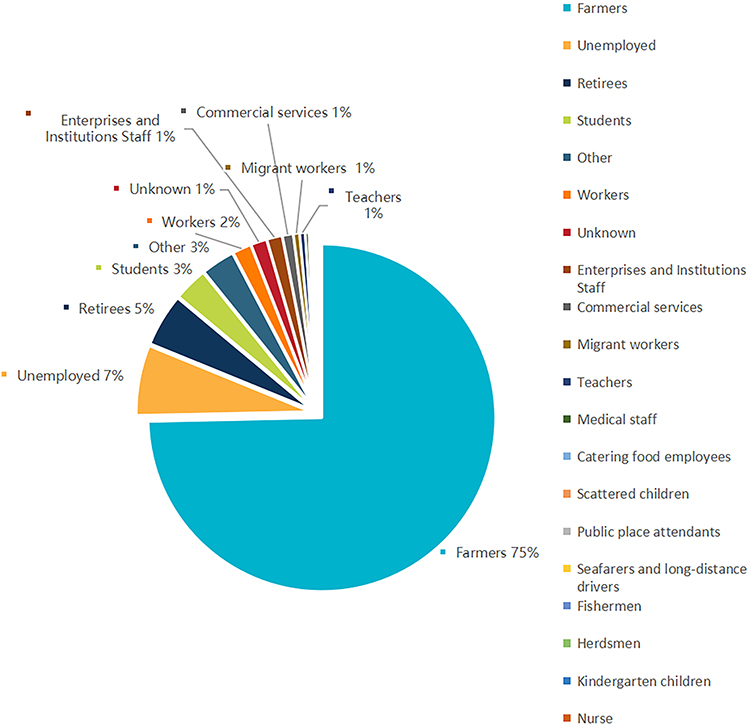 |
Figure 2 Proportion of occupational composition of TB cases. |
Geographical Variation in the Distribution of Reported TB Incidence
Distribution of Reported TB Incidence
The reported incidence of TB in most districts of Guangxi presented a downtrend from 2015 to 2019. During this period, the overall reported incidence of TB was mainly high in the central and northern areas of Guangxi; the reported incidence of TB in the eastern areas was lower. The areas with the top five reported incidences were Xincheng (21.41%), Yizhou (19.05%), Liujiang (17.74%), Liucheng (16.45%), and Xingbin (16.43%), and the areas with the lowest incidence were Changzhou (3.70%), Yuzhou (4.20%), Yanshan (4.24%), Yinhai (4.42%), and Fumian (4.86%) (Figure 3).
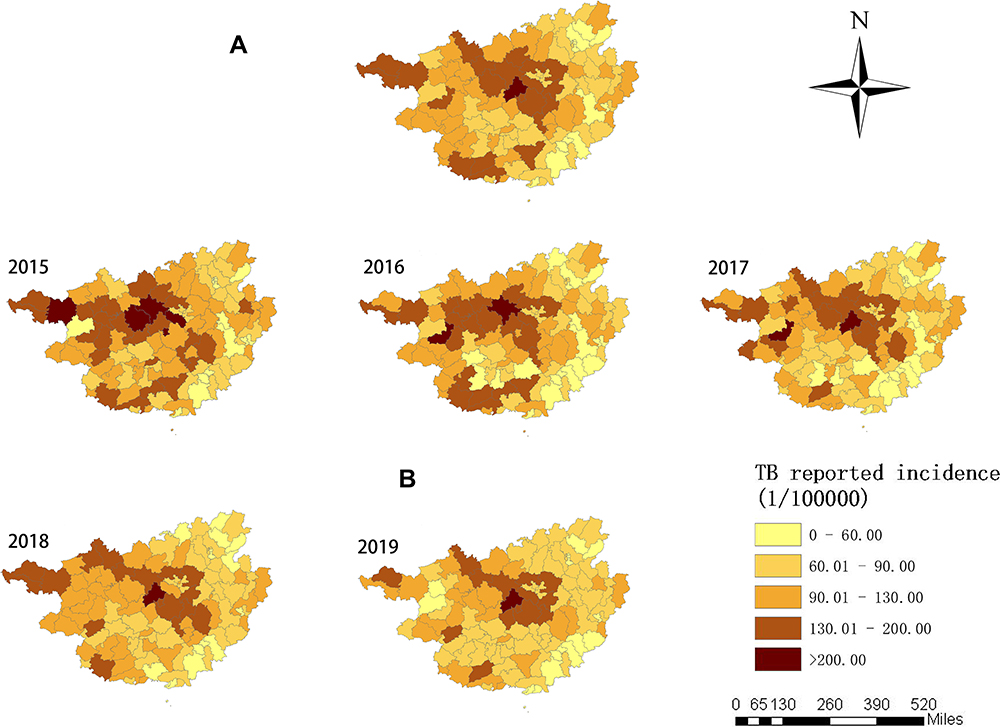 |
Figure 3 Spatial distribution of the overall reported incidence of TB in Guangxi, 2015–2019 (A), and annual incidence of TB reported by county (B). |
Spatial Autocorrelation Analysis
From 2015 to 2019, the reported incidence of TB showed clear geographical clustering (Monte Carlo test, P < 0.001; Table 2). The global spatial autocorrelation Moran’s I values for each year from 2015 to 2019 were 0.399, 0.438, 0.480, 0.486, and 0.515, respectively. The local spatial autocorrelation analysis of reported TB incidence showed that Du’an, Jinchengjiang, Yizhou, Xincheng, and Xiangzhou were identified as hot spot (high-high cluster areas) in the 5-year duration. Xing’an, Lingchuan, Lingui, Qixing, Xiangshan, Xiufeng, and Fumian were cold spot (low-low cluster areas) in the 5-year duration (Figure 4).
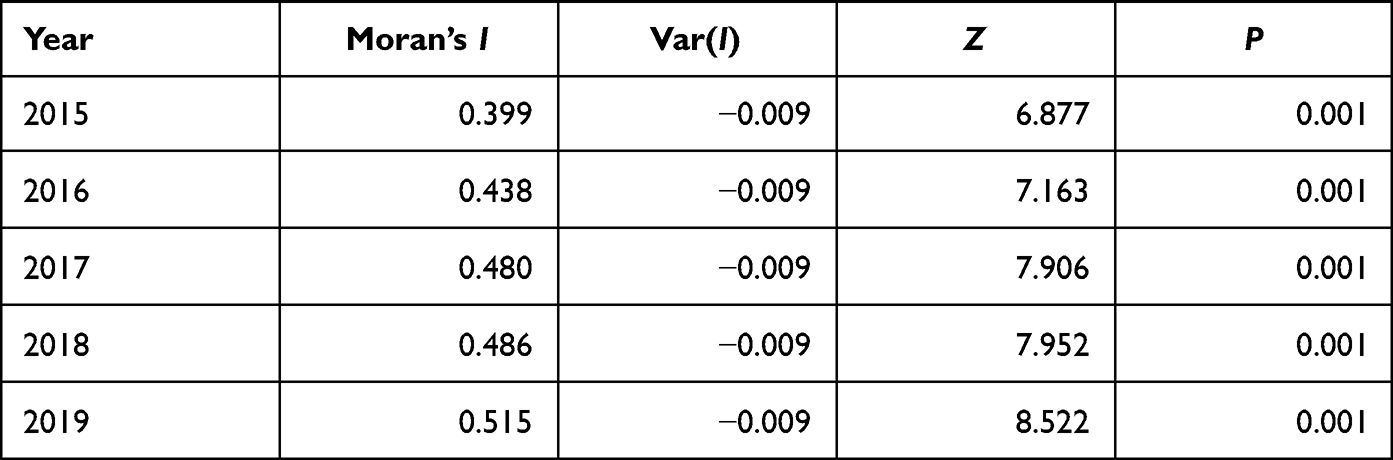 |
Table 2 The Global Spatial Autocorrelation and Trend in Reported Incidence of TB in Guangxi, 2015–2019 |
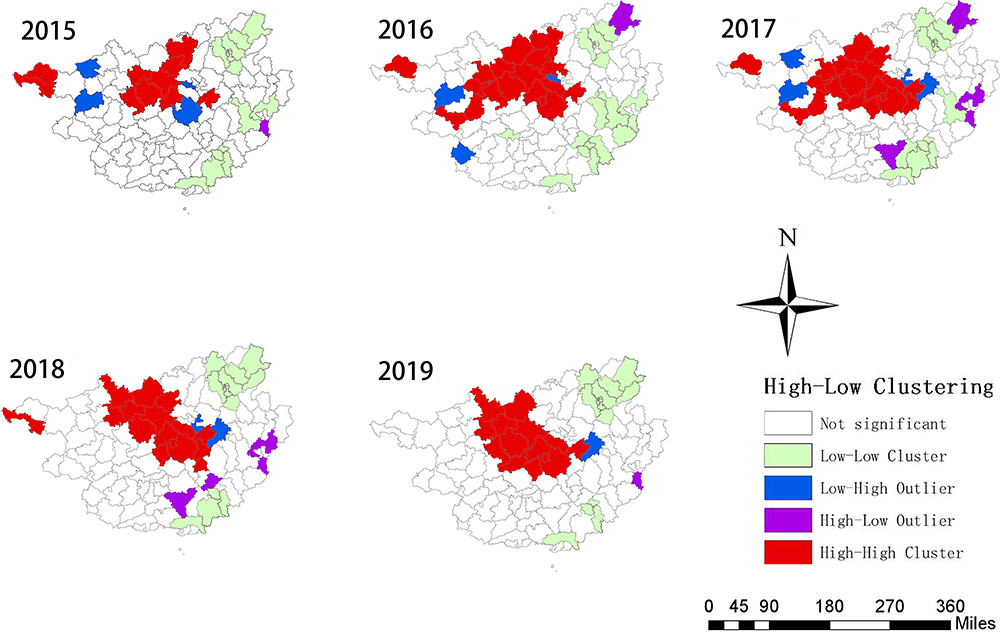 |
Figure 4 Local spatial autocorrelation of the reported incidence of TB in Guangxi, 2015–2019. |
Space-Time Scan Analysis
Using space-time scanning, we detected one most likely cluster area and two secondary cluster areas. The most likely space-time cluster area was located in northern Guangxi, and the high-risk period was from January 2015 to December 2017 (LLR = 2683.76, P < 0.001). The center of the area is located in Jinchengjiang, 24.66N and 107.86E, a circular area with a radius of 147.45 km covering 22 districts. During the high-risk period, a total of 31,394 TB cases were reported in this area, and the RR was 1.60 (Table 3). Figure 5 shows the three-dimensional visualization of the space-time scan analysis results.
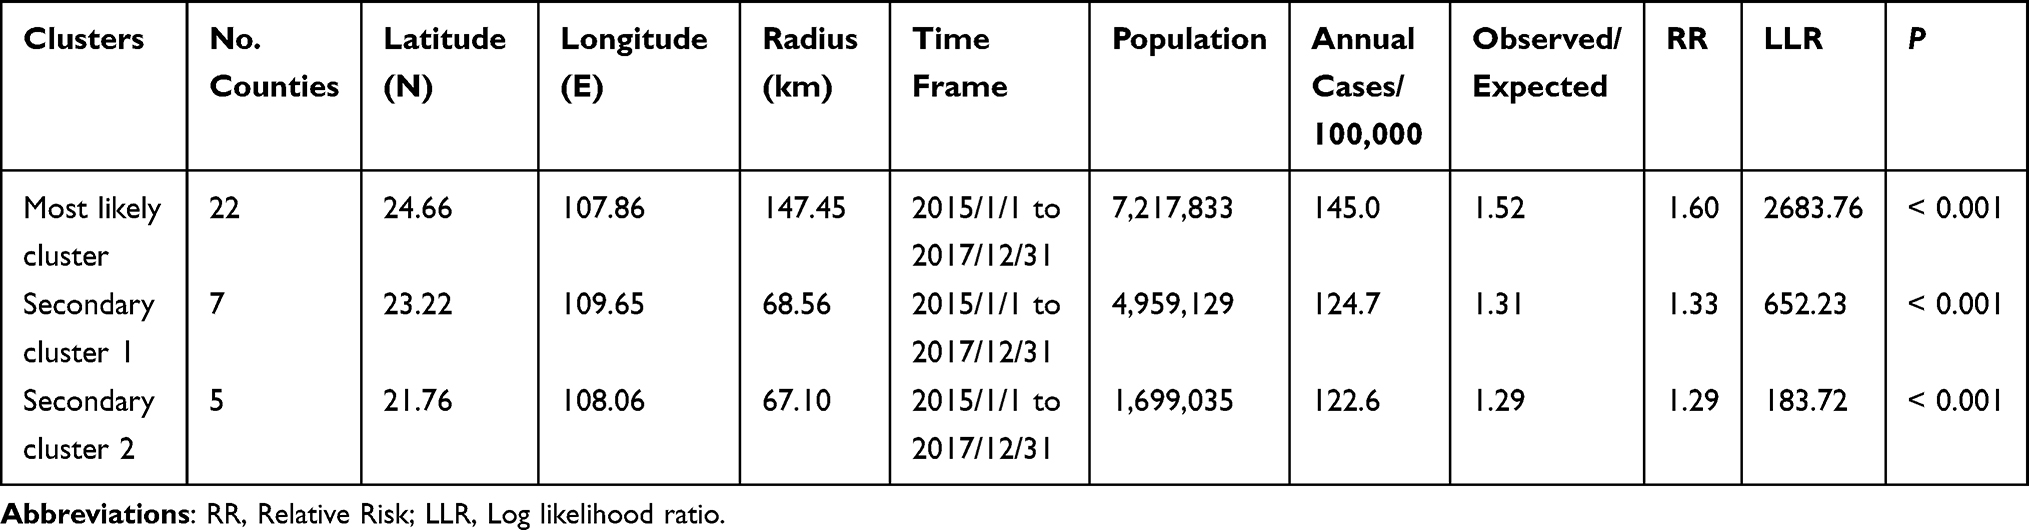 |
Table 3 Spatial Clustering of TB Cases in Guangxi, 2015–2019 |
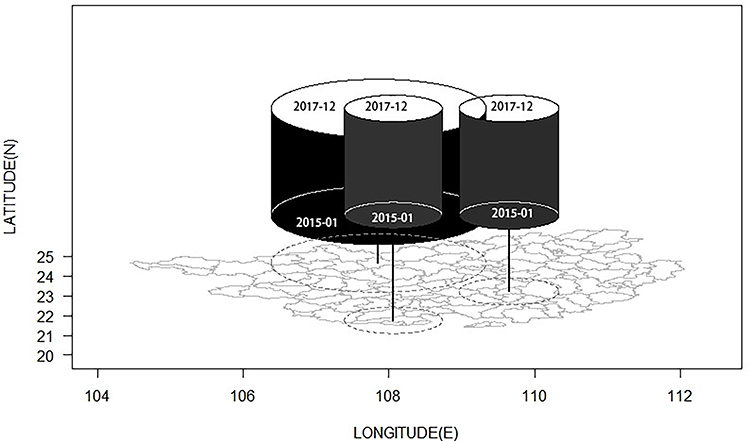 |
Figure 5 Three-dimensional space-time clustering area, 2015–2019. |
Factors Associated with the Reported Incidence of TB
Stepwise Regression Analysis
The results of the stepwise regression model analysis showed that the number of beds per 1000 population in local healthcare institutions, the number of medical and technical personnel at healthcare institutions per 1000 population, and the per capita net income of rural residents were the main factors associated with the TB epidemic in Guangxi (Table 4). The number of medical and technical personnel at healthcare institutions per 1000 population and the per capita net income of rural residents were protective factors for TB.
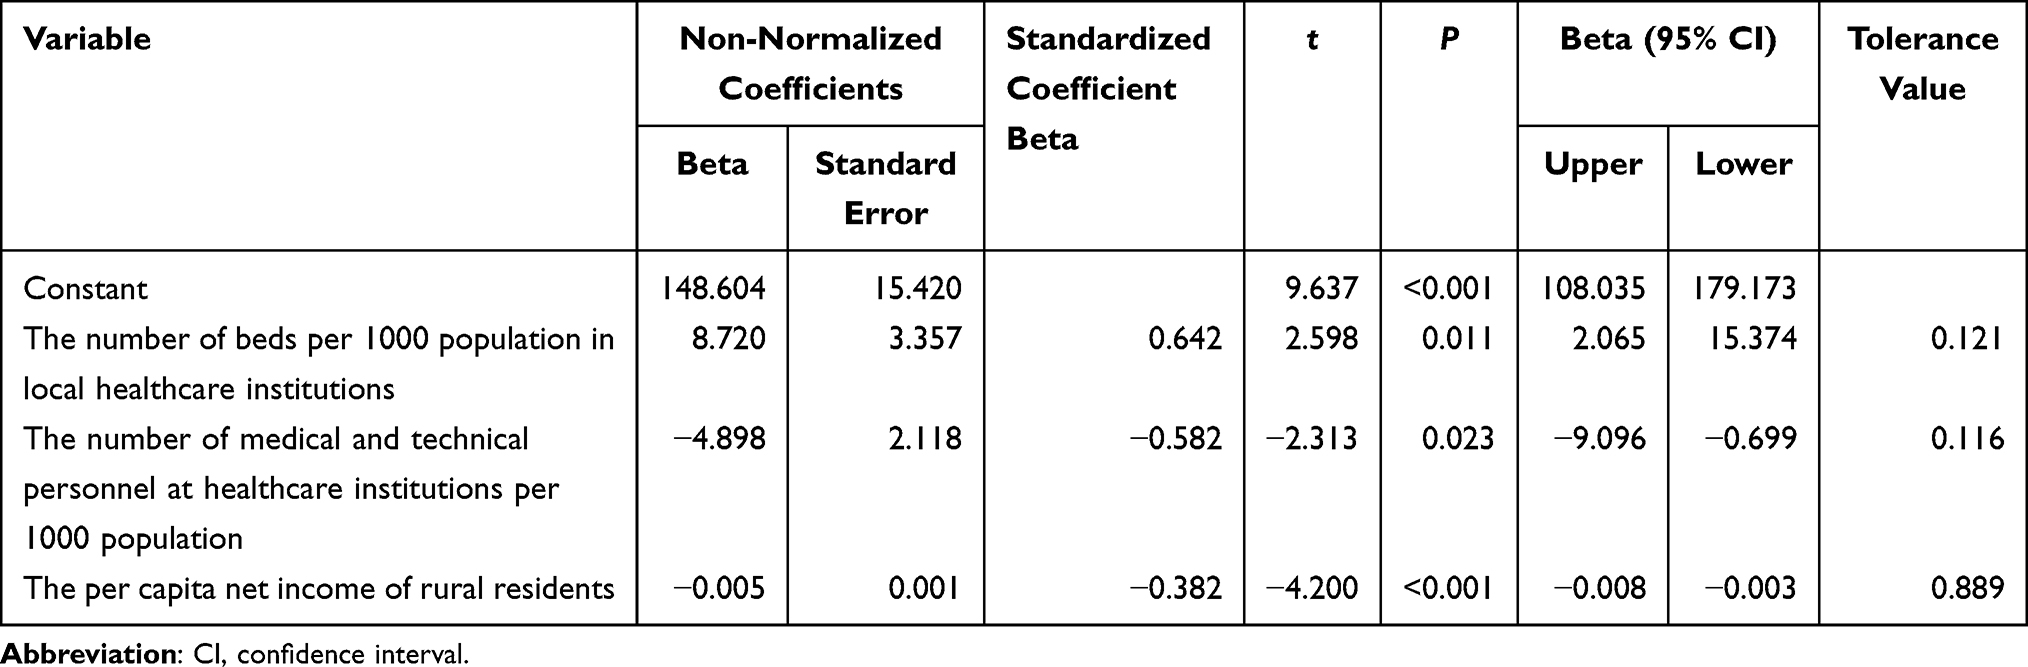 |
Table 4 Stepwise Regression Model Analysis Was Influencing Factors of Reported TB Incidence in Guangxi from 2015 to 2019 |
Bayesian Space-Time Modeling
The optimal-fit Bayesian space-time model (the space-time interaction effect model) was used to analyze the socioeconomic covariates (Table 5). The model included the indicators screened by stepwise regression, which are the number of beds per 1000 population at local healthcare institutions, the number of medical and technical personnel at healthcare institutions per 1000 population, and the per capita net income of rural residents.
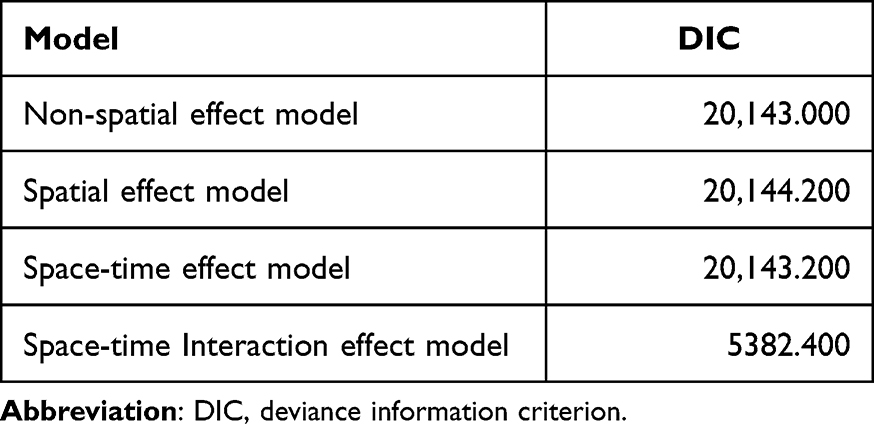 |
Table 5 Comparison of Goodness of Fit of Four Bayesian Models |
Bayesian space-time interaction effect model analysis showed that the risk of TB decreased with the increase of per capita net income of rural residents (Table 6). The MC error was much less than the SD, which demonstrates the rationality and accuracy of the model.
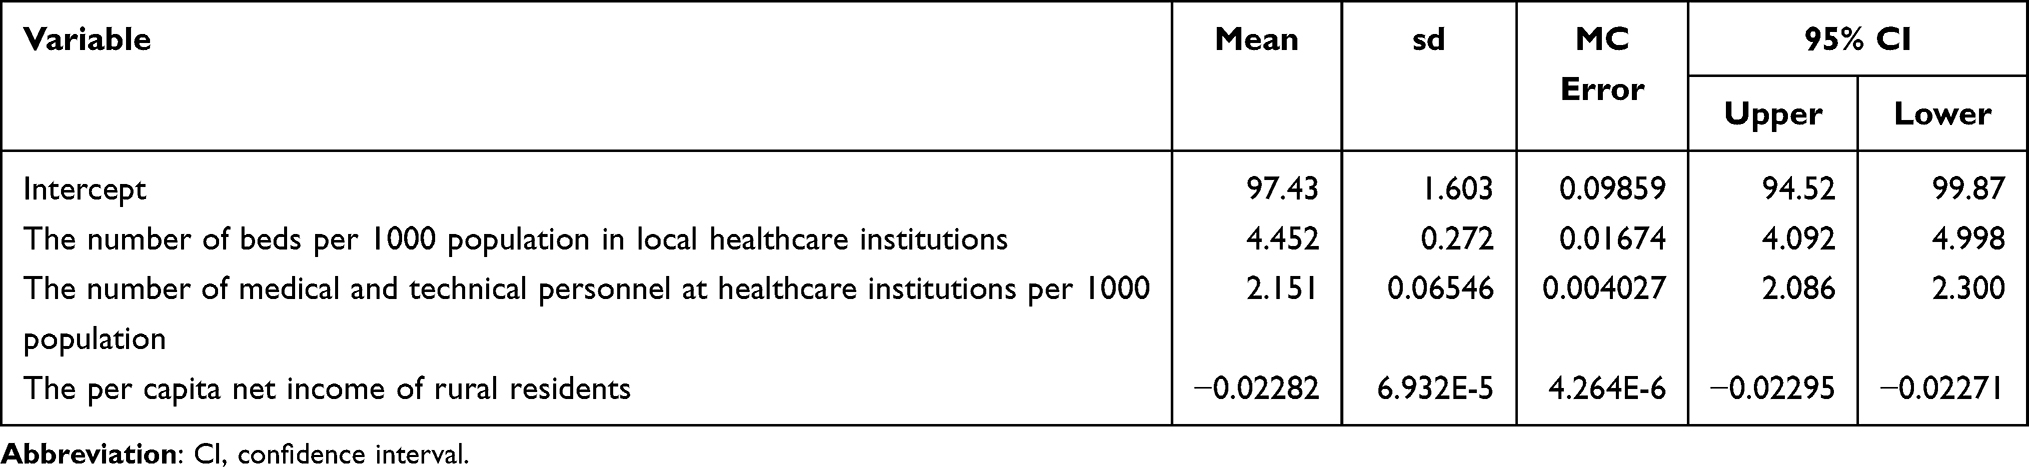 |
Table 6 Bayesian Space-Time Interaction Model Analysis of the Effect of Covariates (β) on TB Risk |
Comparison of Relative Risk and Actual Reported Incidence
The relative risk of TB (θit) calculated by the Bayesian space-time interaction effect model was compared with the actual reported incidence of TB. The point size reflects the relative risk of TB, and the greater the point, the greater the risk of TB; the color of the layer represents the actual reported incidence of TB, and the darker the blue, the higher the reported incidence of TB in the district. Figure 6 shows that the actual reported incidence of TB was not completely consistent with the distribution of relative risk calculated by the model in each district. For example, in 2015, Liujiang had the highest actual reported incidence of TB, and its reported incidence of TB was 31.745%. However, from the perspective of risk, Guanyang had the highest risk of TB (0.002299).
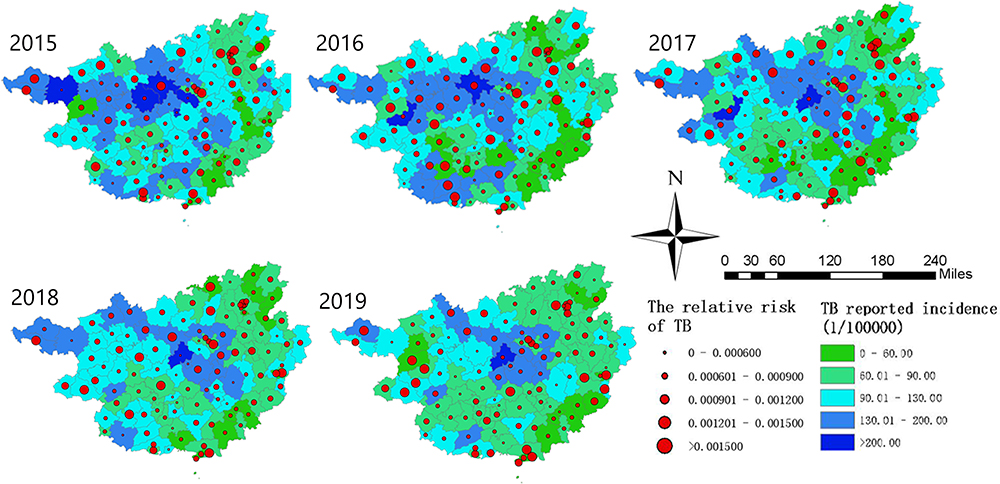 |
Figure 6 Comparison of relative risk and actual reported incidence of TB in Guangxi, 2015–2019. |
Discussion
TB is a chronic infectious disease that seriously threatens human health and is an important public health problem worldwide. The TB epidemic in China is serious, and China is one of the 30 countries with a high TB burden around the world.1 Guangxi is a Chinese province with a high TB burden. Studies have shown that the reported incidence of active TB in Guangxi has clustered in regions with a high space-time incidence in recent years.4 As a disease mainly transmitted through air droplets, TB has a particular spatial pattern, especially impacting the clustering incidence in adjacent areas. The spatial clustering of TB has been reported. If ignored, this feature may lead to wider dissemination and serious consequences, such as public health events.18
In this study, the reported incidence of TB was higher in males than in females; sex-specific metabolism, sex hormones, and other sex-related physiological factors may make men more susceptible to TB than women,19 and men are more likely to be exposed to TB risk factors such as smoking, alcoholism, drug use, and HIV infection.20,21 The reported incidence of TB was highest in people aged ≥65 years, which may be due to low immunity in the elderly, resulting in increased risk of infection and reactivation of potential TB lesions.22,23 In addition, farmers had the greatest risk of TB, which may be due to low economic conditions and weak public health services in rural areas; it is also likely since this group lacks self-protection and timely medical awareness.24,25
Seasonal decomposition analysis showed that tuberculosis was reported throughout the year in Guangxi, but there was an obvious reporting peak. The annual reporting peak was usually from March to July. The reasons for these peaks may be related to geographical and climatic factors, vitamin D deficiency, human immunity, and seasonal activities of the population,26–29 and attention should also be paid to potential delays in TB diagnosis.30
This study shows that the reported incidence of TB is non-randomly distributed spatially in Guangxi, and there is a positive spatial autocorrelation and a clustering distribution. The local spatial autocorrelation analysis showed that the high-high distribution pattern of TB incidence was located in the central and northern areas of Guangxi, and these areas were also high incidence areas of TB. High prevalence of tuberculosis may be due to poor economy in these areas (such as Du’an, Jinchengjiang, Yizhou, Xincheng, and Xiangzhou). For these hot spot areas, epidemic monitoring and prevention should be continuously strengthened. The space-time analysis explored the location and extent of the clustering areas and showed that the most likely cluster was mainly located in the northern areas of Guangxi. These results are consistent with the autocorrelation analysis, indicating the reliability of the space-time scanning results.
The per capita net income of rural residents was negatively associated with the reported incidence of TB. The number of beds per 1000 population in local healthcare institutions and the number of medical and technical personnel at healthcare institutions per 1000 population were positively associated with the reported incidence of TB. Bayesian space-time interaction effect model analysis showed that the risk of TB is closely related to the poverty level of rural residents. Relevant studies have shown that poverty is an important risk factor for TB. In areas with poor economic conditions, the incidence of TB is often higher.9,31,32 Therefore, the prevention and management of TB should be strengthened in areas with poor economic conditions. In addition, the incidence of TB may be related to health service levels.33,34 The risk of tuberculosis was positively correlated with the number of beds and the number of medical personnel. It may attribute to the high accessibility of medical resources which has increased sensitivity to patient detection, and the increase in patient load has promoted the increase in the number of beds and medical personnel in medical institutions.
The space-time interaction effect model was used to calculate the risk of TB in districts from 2015 to 2019. This result suggests that compared with the actual reported incidence of TB, the risk of TB in districts with high incidence was not necessarily the same high. This may be due to several factors. First, the TB data used in this study are reported data, and there may be some differences with the true values. Second, the impact of confounding factors that were not considered on the model, such as meteorology, the environment, diabetes prevalence, the HIV infection rate, and other factors, may affect the actual incidence of TB in the district. Therefore, the model should include more potential influential factors in future research.
The strength of this study is that it is the largest study of reported incidence trends and related factors of TB at the district level in Guangxi from 2015 to 2019. However, the limitation of this study is that it is a retrospective analysis; a prospective study could predict trends in TB prevalence.
Conclusion
The overall TB reported incidence in Guangxi decreased from 2015 to 2019 and was the highest in the central and northern areas. Our results suggest that socioeconomic and healthcare factors are related to the high prevalence of TB. Thus, it is necessary to improve the level of economic development and health services, especially in the central and northern regions of Guangxi (TB hot spots area). Moreover, more research on risk factors should be conducted.
Ethics Statements
This retrospective study was consulted to the Ethics Review Board of the Guangxi Center for Disease Control and Prevention. Ethics approval was not necessary in this study because we did not include any data of Patients’ privacy such as name and identity information.
Acknowledgments
The authors gratefully acknowledge all staff contributing to TB surveillance in Guangxi, China. Additionally, we acknowledge the editors and anonymous reviewers for their helpful remarks.
Funding
This work was supported by the Guangxi National Natural Science Foundation (2015GXNSFAA139202), Guangxi Key Research and Development Program (AB18221010).
Disclosure
The authors report no conflicts of interest in this work.
References
1. World Health Organization. Global Tuberculosis Report 2020. Geneva, Switzerland: World Health Organization; 2021.
2. Wei CH, Yin-yin X, Tao LI, et al. Analysis for the Global and China TB Epidemic Situation in 2015. J Tuberc Lung Dis. 2016;5(01):32–36.
3. Sheng-xian BI, Xi-jian HU, Hui-guo Z. Temporal-spatial distribution characteristics and its influencing factors of tuberculosis epidemic in the Chinese mainland from 2014 to 2018. Chin J Dis Control Prev. 2021;25(07):
4. Qiang M. Study on Spatial -temporal Characteristics and Prediction for Tuberculosis Trends in China during 2004–2015 [Master]. Lanzhou University; 2018.
5. Yong W. Spatio-temporal Cluster Research Tuberculosis Incidence [Master]. Zhejiang University; 2008.
6. Tao W. The spatial epidemiology of tuberculosis in Linyi City, Shandong Province [Master]. Shandong University; 2012.
7. Oxlade O, Murray M, Neyrolles O. Tuberculosis and poverty: why are the poor at greater risk in India? PLoS One. 2012;7(11):e47533. doi:10.1371/journal.pone.0047533
8. Saunders MJ, Evans CA. Fighting poverty to prevent tuberculosis. Lancet Infect Dis. 2016;16(4):395–396. doi:10.1016/S1473-3099(15)00434-X
9. Geraldes Santos Mde L, Figueiredo Vendramini SH, Gazetta CE, Cruz Oliveira SA, Scatena Villa TC. Poverty: socioeconomic characterization at tuberculosis. Rev Lat Am Enfermagem. 2007;15:762–767. doi:10.1590/S0104-11692007000700008
10. van der Werf MJ, Zellweger JP. Impact of migration on tuberculosis epidemiology and control in the EU/EEA. Euro Surveill. 2016;21(12). doi:10.2807/1560-7917.ES.2016.21.12.30174
11. Sulis G, Roggi A, Matteelli A, Raviglione MC. Tuberculosis: epidemiology and control. Mediterr J Hematol Infect Dis. 2014;6(1):e2014070. doi:10.4084/mjhid.2014.070
12. The National Health and Family Planning Commission of the People’s Republic of China. Diagnostic criteria for pulmonary tuberculosis (WS 288- −2017). Electron J Emerg Infect Dis. 2018;3(1):59–61.
13. Jones SG, Kulldorff M, Bejon P. Influence of spatial resolution on space-time disease cluster detection. PLoS One. 2012;7(10):e48036. doi:10.1371/journal.pone.0048036
14. Abbas T, Younus M, Muhammad SA. Spatial cluster analysis of human cases of Crimean Congo hemorrhagic fever reported in Pakistan. Infect Dis Poverty. 2015;4:9. doi:10.1186/2049-9957-4-9
15. Alemu K, Worku A, Berhane Y, Fernandez-Reyes D. Malaria infection has spatial, temporal, and spatiotemporal heterogeneity in unstable malaria transmission areas in northwest Ethiopia. PLoS One. 2013;8(11):e79966. doi:10.1371/journal.pone.0079966
16. Xia J, Cai S, Zhang H, et al. Spatial, temporal, and spatiotemporal analysis of malaria in Hubei Province, China from 2004–2011. Malar J. 2015;14:145. doi:10.1186/s12936-015-0650-2
17. Huang L, Kulldorff M, Gregorio D. A spatial scan statistic for survival data. Biometrics. 2007;63(1):109–118. doi:10.1111/j.1541-0420.2006.00661.x
18. Yan P, Ying L, Qing-ya W, et al. Epidemic situation of tuberculosis in schools in Chongqing Municipality, 2016. Pract Prev Med. 2018;25(01):10–13.
19. Yang-yang L, Yin-yin X, Xin D, et al. Analysis of characteristics of pulmonary tuberculosis patients registered in tuberculosis management information system from 2004 to 2013. Dis Surveill. 2014;29(08):633–637.
20. Catarina F, Teresa P, Ines N, Raquel D. Gender differences in active tuberculosis. Eur Respir J. 2014;44:P2688.
21. Sharma PP, Kumar A, Singh P. A study of gender differentials in the prevalence of tuberculosis based on NFHS-2 and NFHS-3 data. Indian J Community Med. 2010;35(2):230–237. doi:10.4103/0970-0218.66869
22. Friedman A, Turner J, Szomolay B. A model on the influence of age on immunity to infection with Mycobacterium tuberculosis. Exp Gerontol. 2007;43(4):275–285. doi:10.1016/j.exger.2007.12.004
23. Vesosky B, Turner J. The influence of age on immunity to infection with Mycobacterium tuberculosis. Immunol Rev. 2005;205:229–243. doi:10.1111/j.0105-2896.2005.00257.x
24. Wei-lin L, Zhou N, Yong-ming L. Occupational Distribution of TB Patients Registered, Fujian, 2008–2013. Prev Med Trib. 2014;20(10):761–763.
25. Qiaofen G, Xinhua W, Shumin Y, et al. Study on the Relationship between Pulmonary Tuberculosis and Occupation in Gansu Province. Health Vocation Educ. 2011;29(20):125–126.
26. Yong-chao X, Lan-fang X, Zhi-guang Y, et al. Using circular distribution method to analyze seasonal characteristic of tuberculosis, 2004–2013. Chin J PHM. 2015;31(05):624–626.
27. Hao X, Ronghao L, Hongjun Z, et al. Seasonal characteristics of pulmonary tuberculosis registration were analyzed by circular distribution method. Prev Med. 2016;28(09):
28. Zhang ZB, Lu ZQ, Xie H, Duan QH. Seasonal variation and related influencing factors for tuberculosis. Zhonghua Liu Xing Bing Xue Za Zhi. 2016;37(8):1183–1186. doi:10.3760/cma.j.issn.0254-6450.2016.08.025
29. Wingfield T, Schumacher SG, Sandhu G, et al. The seasonality of tuberculosis, sunlight, vitamin D, and household crowding. J Infect Dis. 2014;210(5):774–783. doi:10.1093/infdis/jiu121
30. Meyssonnier V, Li X, Shen X, et al. Factors associated with delayed tuberculosis diagnosis in China. Eur J Public Health. 2013;23(2):253–257. doi:10.1093/eurpub/cks037
31. Emmanuelli X, Grosset J. [Tuberculosis and poverty]. Rev Mal Respir. 2003;20(2 Pt 1):169–171. French.
32. Cambanis A, Yassin MA, Ramsay A, Bertel Squire S, Arbide I, Cuevas LE. Rural poverty and delayed presentation to tuberculosis services in Ethiopia. Trop Med Int Health. 2005;10(4):330–335. doi:10.1111/j.1365-3156.2005.01393.x
33. Alene KA, Clements ACA. Spatial clustering of notified tuberculosis in Ethiopia: a nationwide study. PLoS One. 2019;14(8):e0221027. doi:10.1371/journal.pone.0221027
34. Alene KA, Viney K, Moore HC, Wagaw M, Clements ACA. Spatial patterns of tuberculosis and HIV co-infection in Ethiopia. PLoS One. 2019;14(12):e0226127. doi:10.1371/journal.pone.0226127
 © 2022 The Author(s). This work is published and licensed by Dove Medical Press Limited. The
full terms of this license are available at https://www.dovepress.com/terms
and incorporate the Creative Commons Attribution
- Non Commercial (unported, 3.0) License.
By accessing the work you hereby accept the Terms. Non-commercial uses of the work are permitted
without any further permission from Dove Medical Press Limited, provided the work is properly
attributed. For permission for commercial use of this work, please see paragraphs 4.2 and 5 of our Terms.
© 2022 The Author(s). This work is published and licensed by Dove Medical Press Limited. The
full terms of this license are available at https://www.dovepress.com/terms
and incorporate the Creative Commons Attribution
- Non Commercial (unported, 3.0) License.
By accessing the work you hereby accept the Terms. Non-commercial uses of the work are permitted
without any further permission from Dove Medical Press Limited, provided the work is properly
attributed. For permission for commercial use of this work, please see paragraphs 4.2 and 5 of our Terms.