Back to Journals » Clinical Epidemiology » Volume 9
Somatic symptom profiles in the general population: a latent class analysis in a Danish population-based health survey
Authors Eliasen M ![]() , Jørgensen T
, Jørgensen T ![]() , Schröder A
, Schröder A ![]() , Dantoft TM
, Dantoft TM ![]() , Fink P
, Fink P ![]() , Poulsen CH
, Poulsen CH ![]() , Johansen NB, Eplov LF
, Johansen NB, Eplov LF ![]() , Skovbjerg S, Kreiner S
, Skovbjerg S, Kreiner S
Received 15 March 2017
Accepted for publication 31 May 2017
Published 23 August 2017 Volume 2017:9 Pages 421—433
DOI https://doi.org/10.2147/CLEP.S137167
Checked for plagiarism Yes
Review by Single anonymous peer review
Peer reviewer comments 3
Editor who approved publication: Professor H Sorensen
Marie Eliasen,1 Torben Jørgensen,1–3 Andreas Schröder,4 Thomas Meinertz Dantoft,1 Per Fink,4 Chalotte Heinsvig Poulsen,1,5 Nanna Borup Johansen,1 Lene Falgaard Eplov,5 Sine Skovbjerg,1 Svend Kreiner2
1Research Centre for Prevention and Health, Centre for Health, The Capital Region of Denmark, Glostrup, 2Department of Public Health, University of Copenhagen, Copenhagen, 3Department of Clinical Medicine, Aalborg University, Aalborg, 4Research Clinic for Functional Disorders and Psychosomatics, Aarhus University Hospital, Aarhus C, 5Mental Health Centre Copenhagen, The Capital Region of Denmark, Hellerup, Denmark
Purpose: The aim of this study was to identify and describe somatic symptom profiles in the general adult population in order to enable further epidemiological research within multiple somatic symptoms.
Methods: Information on 19 self-reported common somatic symptoms was achieved from a population-based questionnaire survey of 36,163 randomly selected adults in the Capital Region of Denmark (55.4% women). The participants stated whether they had been considerably bothered by each symptom within 14 days prior to answering the questionnaire. We used latent class analysis to identify the somatic symptom profiles. The profiles were further described by their association with age, sex, chronic disease, and self-perceived health.
Results: We identified 10 different somatic symptom profiles defined by number, type, and site of the symptoms. The majority of the population (74.0%) had a profile characterized by no considerable bothering symptoms, while a minor group of 3.9% had profiles defined by a high risk of multiple somatic symptoms. The remaining profiles were more likely to be characterized by a few specific symptoms. The profiles could further be described by their associations with age, sex, chronic disease, and self-perceived health.
Conclusion: The identified somatic symptom profiles could be distinguished by number, type, and site of the symptoms. The profiles have the potential to be used in further epidemiological studies on risk factors and prognosis of somatic symptoms but should be confirmed in other population-based studies with specific focus on symptom burden.
Keywords: epidemiology, somatic symptoms, subjective health complaints, multiple symptoms, functional somatic syndromes, health status
Introduction
Multiple somatic symptoms, such as headache and musculoskeletal (MS) pain, have been associated with an increased risk of poor health status1–3 and high health care use3–5 independently of the etiology of the symptoms. This indicates an importance of focusing on multiple symptoms in health research and not only on a few specific symptoms or diseases. Studies looking at the epidemiology of multiple symptoms have mainly used the number of symptoms to identify groups at risk1–4 using standard symptom questionnaires, eg, the Patient Health Questionnaire6 and the Symptom Checklist.7 However, it can be questioned if this method identifies the persons at the highest risk of poor health and hence leads to blurred or distorted results.8,9 For example, in a recent study, we found that the associations between symptoms and health status depended on both the specific symptoms and the co-occurrence of symptoms.8 This emphasized the need for a better and more precise identification of persons at risk for poor health based on their symptom reporting than merely counting symptoms. This knowledge would improve the quality of epidemiological research on risk factors, prevention, and prognosis of somatic symptoms and hence create basis for better patient management. Identification of persons at risk accounting for both the particular symptom and the number of symptoms could be done by identifying and delimitating groups of people with similar symptom patterns, ie, identifying different somatic symptom profiles in the population.
Previous studies investigating symptom profiles have reached different results.9–14 Thus, 2,13,14 3,9,10 5,12 and 1111 profiles have been identified either based merely on numbers of symptoms9,10,13,14 or based on number, site, and type of symptoms.11,12 However, all the studies differed considerably in material and methods. Only two of the studies were conducted on a population-based sample,12,14 while the others included more selected populations, eg, patients from primary or secondary care. This selection might have led to considerable bias in the identification of classes including higher symptom prevalence in the study population. Furthermore, most of the studies included only few symptoms12 or groups of symptoms9–11 in their analyses on symptom profiles, which may have decreased the possibility of identifying nuanced and multiple profiles. Similarly, the relatively small study populations used in some of the studies may also have limited the nuances.10,11,13,14
To overcome some of the limitations in prior studies, we aimed to identify and describe somatic symptom profiles in the general adult population using latent class analysis (LCA) of 19 self-reported somatic symptoms in a Danish population-based health survey.
Participants and methods
Study population
The data have been described in previous articles.8,15 Briefly, we used information from a cross-sectional health and life-style survey “The Regional Health Survey 2006/2007” conducted in the Capital Region of Denmark. Municipality-stratified random samples of the general population aged 25–79 years were drawn from the Danish Civil Registration System using computer-generated random numbers. The selected individuals (N=69,800) were sent an invitation to complete an enclosed questionnaire, and a postal reminder was sent once. Of those invited, 36,472 (52%) returned a completed questionnaire.
All participants in the Regional Health Survey gave written informed consent before taking part in the study. According to Danish legislation, the study did not require ethical approval.
Somatic symptoms
The participants were asked to which extent they had been bothered by 19 listed somatic symptoms 14 days prior to answering the questionnaire (“not at all”, “a little”, or “a lot”). The list covered the most frequent symptoms reported in other studies16 and included three MS symptoms, three gastrointestinal (GI) symptoms, four cardiopulmonary (CP) symptoms, four general symptoms (eg, tiredness and headache), two urinary tract symptoms, and three other symptoms (Table 1).8 In the analyses, we focused on those being considerably bothered by the symptoms and compared it with the combined group of not at all and a little bothered.
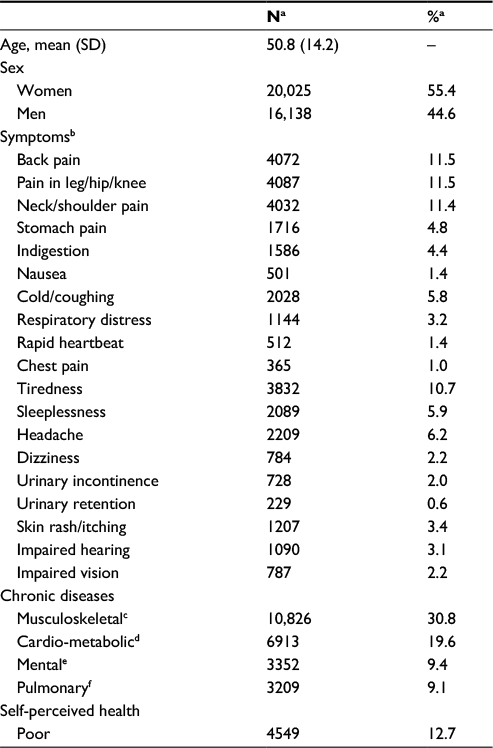 | Table 1 Characteristics of the population Notes: The Regional Health Survey 2006/2007, the Capital Region of Denmark. N=35,122–35,810. aAll presented numbers except age are the frequency (N) and proportion (%) of participants with the given characteristic. For age, the presented numbers are mean (SD). bPresence of symptom defined as being considerably bothered by the sensation during 14 days preceding the survey; self-reported. cArthrosis/arthritis, osteoporosis, and herniated disk; self-reported. dAngina, diabetes, and hypertension; self-reported; eMental disorder, eg, depression and anxiety; self-reported. fAsthma and chronic bronchitis; self-reported. Abbreviation: SD, standard deviation. |
Covariates
Characteristics of the somatic symptom profiles were described according to sex, age, and chronic disease. Sex and age were extracted from the personal registration number. Chronic disease was self-reported using a list of nine common chronic diseases and operationalized as the presence of disease in the following four categories: 1) diseases in the MS system (arthritis, osteoporosis, and herniated disk), 2) cardio-metabolic diseases (angina, hypertension, and diabetes), 3) mental disorders (eg, depression and anxiety), and 4) pulmonary diseases (asthma and chronic bronchitis).
To evaluate the impact of the somatic symptom profiles, we related them to self-perceived health measured by the question “In general, would you say your health is:” with the answers categorized into good (combination of “excellent”, “very good”, and “good”) and poor (combination of “fair” and “poor”).
Final study population
Information was missing on all symptoms for 309 individuals, leaving 36,163 for the identification of the symptom profiles requiring information of minimum one symptom. Most information available was used for the characterization of the profiles based on the covariates (varying between N=35,188 and N=36,163). For the analyses on self-perceived health, 33,696 individuals were eligible due to missing data on chronic disease (N=2,130) and self-perceived health (N=337).
Statistical methods
We identified the somatic symptom profiles using LCA in Latent GOLD 5.0.17 LCA is a method to empirically identify mutually exclusive latent classes or profiles in the population based on a number of observed variables. The assumption is that population heterogeneity regarding associations between the observed variables can be explained by a latent categorical variable. Hence, the observed variables are independent within classes.18 In our study, each class identified in the LCA will thus have similar symptom patterns and therefore have the same symptom profile.
We used the expectation–maximization (EM) algorithm followed by Newton–Raphson given a predefined number of classes to estimate the model. We used 150 random sets of starting values with 150 iterations per set. As convergence criteria, we used an EM tolerance of 0.01 and an overall tolerance of 10–6.17,18 Posterior probabilities were used to classify the participants in the latent classes.
The LCA model was identified using an iterative process starting with a model with a 1-class solution and continuing up to 15 classes. The Bayesian Information Criterion (BIC) was used to identify the number of classes, as it has been shown to be the best performing information criterion for enumeration.19 The iterative process was conducted twice. First, it was conducted for a model assuming local independency between the symptoms. Problems with the assumption were identified by investigating and comparing the bivariate residuals in the three models with the lowest BIC and in the model with a 1-class solution; high residuals indicated violation of the assumption. Based on the bivariate residuals and prior knowledge of associations between symptoms,8 we decided for which symptoms local dependency should be allowed. Second, to identify the number of classes, the iterative process was reconducted in a model including direct effects between the identified locally dependent symptoms. We compared the BIC across the models; the model with the lowest BIC and the models with ±1 class were investigated more thoroughly.18 The final model was chosen between the three models based on 1) model fit: BIC, the Consistent Akaike’s Information Criterion (CAIC), classification error, and the classification table (Tables S1 and S2), 2) clarity and clinical meaning, and 3) simplicity.19
The final model was re-estimated in two randomly split parts of the dataset to confirm the model. The log likelihood values of the two models on the split dataset were compared with the full model using likelihood ratio (LR) test. Moreover, the BIC values were compared and potential differences were investigated.
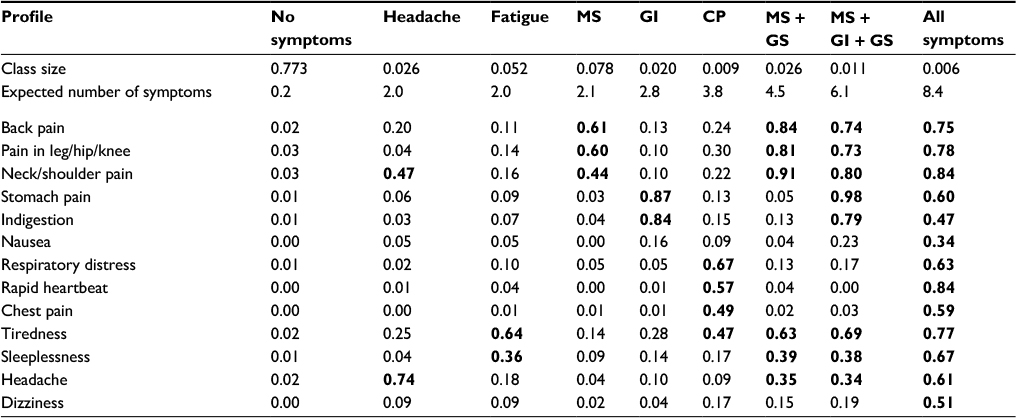
To describe the classes, the marginal conditional probabilities of the symptoms given the classes were estimated together with the expected number of symptoms within each class, defined as the sum of the conditional probabilities of symptoms (Table 2).
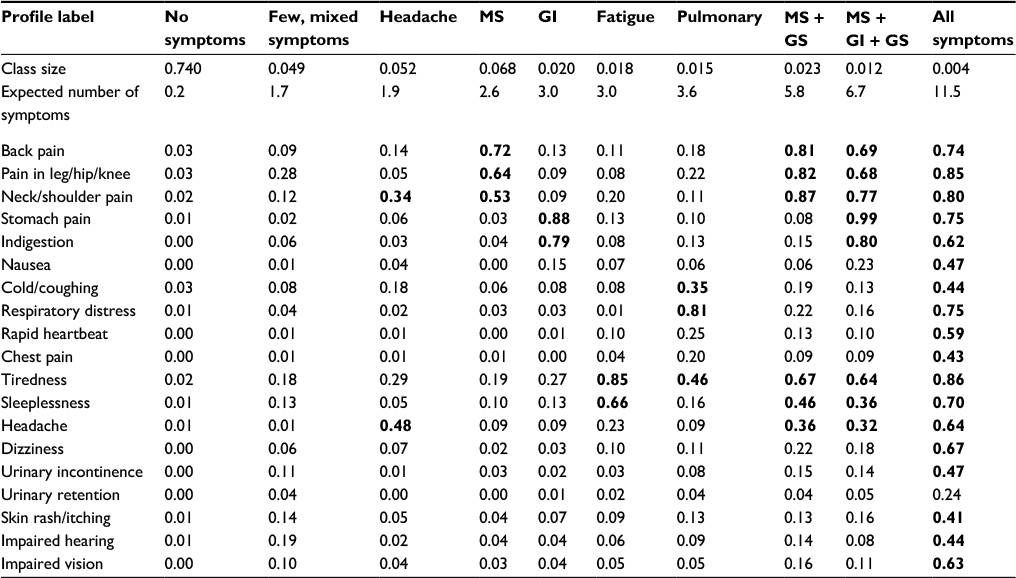 | Table 2 Conditional probabilities of the 19 symptoms given the 10 classes in the LCA model, including class size and expected number of symptoms Notes: The table shows the profile label, class size, expected number of symptoms, and conditional probability of the symptoms given the classes. Numbers in bold indicates a symptom probability of >0.30. The profiles are sorted according to number of expected symptoms. The model includes direct effects between rapid heartbeat and chest pain and between urinary incontinence and urinary retention. GS includes headache, tiredness, and sleeplessness. N=36,163. Abbreviations: GI, gastrointestinal; GS, general symptoms; MS, musculoskeletal. |
The associations between the symptom profiles and the covariates were investigated using the three-step procedure in Latent GOLD 5.0 which accounts for the uncertainty in the class assignment.20 Bivariate analyses were performed for the independent variables age, sex, and chronic disease, and odds ratios (ORs) were estimated with the largest profile as reference (Table 3). Self-perceived health was treated as dependent on the symptom profiles, and the analysis was therefore adjusted for sex, age, and chronic disease (Table 4). All the analyses were based on posterior probability estimates. The maximum likelihood approach was used for estimation of sex, chronic disease, and self-perceived health, while a modified approach by Bolck, Croon, and Hagenaars was used for age.20
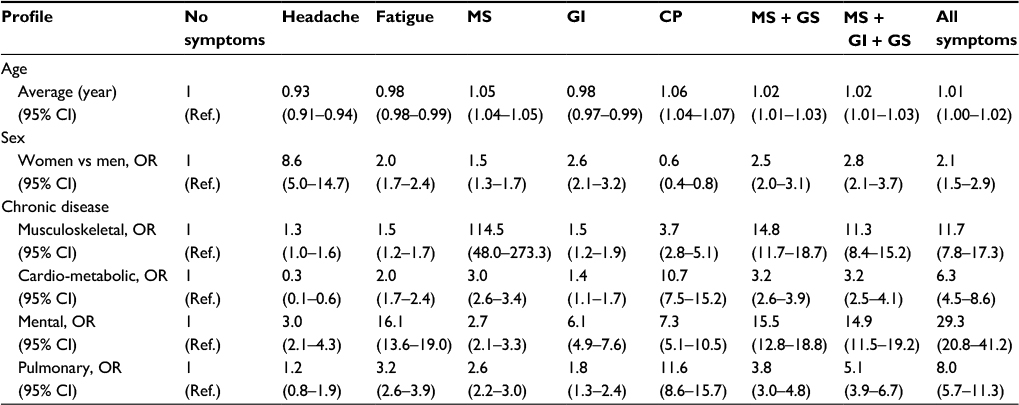
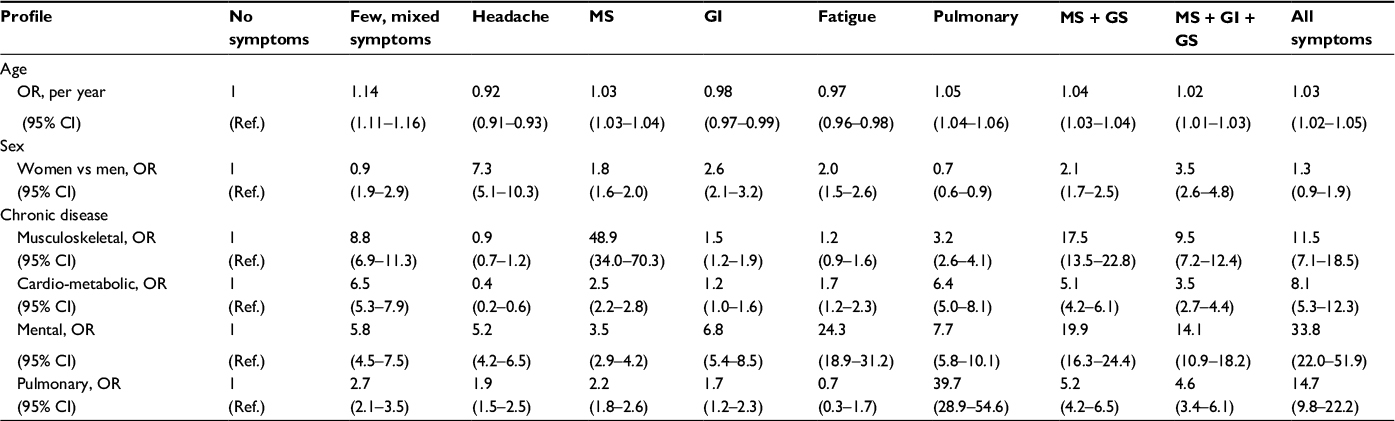 | Table 3 OR for being in the symptom profiles compared to the “no symptoms” profile according to age, sex, and chronic disease Notes: The model includes direct effects between rapid heartbeat and chest pain and between urinary incontinence and urinary retention. N=35,188–36,163. GS includes headache, tiredness, and sleeplessness. Abbreviations: GI, gastrointestinal; GS, general symptoms; MS, musculoskeletal; OR, odds ratio; Ref., reference profile. |
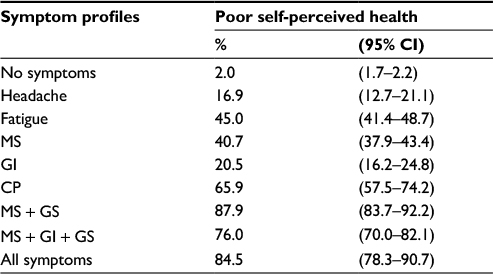
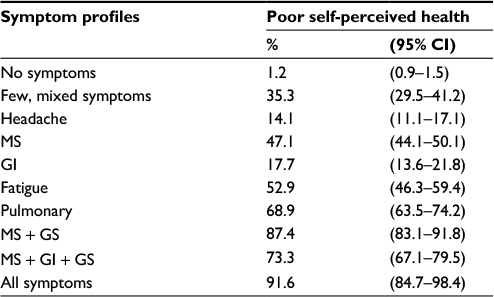 | Table 4 The probability of poor self-perceived health within each of the 10 symptom profiles Notes: The numbers are adjusted for sex, age, and chronic disease. N=33,696. GS includes headache, tiredness, and sleeplessness. Abbreviations: GI, gastrointestinal; GS, general symptoms; MS, musculoskeletal. |
In the primary analyses, we included all somatic symptoms available in the questionnaire. However, it could be questioned if all the symptoms were a part of the same latent variable as they varied considerably in type, eg, when comparing being considerably bothered by cold/coughing, impaired hearing, and back pain. Moreover, many symptom scales do not cover symptoms with a more objective character, eg, coughing.16 To investigate the impact of including many varying symptoms and to help comparing results between studies, we conducted a sensitivity analysis including only the more commonly measured symptoms, thus excluding cold/coughing, urinary retention, urinary incontinence, impaired hearing, impaired vision, and skin rash/itching (Tables S3–S5).
Missing information on symptoms was handled in the latent class model using the information available for the other symptoms assuming missing at random.17 In the analyses on the associations with sex, age, chronic disease, and self-perceived health, persons with missing information on the external variables were excluded.
Results
Characteristics of the population
Of the 36,163 persons included in the study, 55.4% were women and the mean age was 50.8 years (Table 1). Being considerably bothered by at least one symptom during the 14 days preceding the survey was reported by 39.4% of the persons, and 12.6% reported being considerably bothered by three or more symptoms. The prevalence of being considerably bothered by each of the 19 symptoms is listed in Table 1 together with other characteristics of the population. The most frequent symptoms were MS symptoms and tiredness. Poor self-perceived health was reported by 12.7%.
The LCA model
The search for the final LCA model showed problems with the assumption of local independency between rapid heartbeat and chest pain and between urinary incontinence and urinary retention. Therefore, direct effects between these symptoms were included in the model. The models with 9–11 classes were chosen to be investigated more thoroughly based on the BIC values (Table S1). Looking at model fit, the BIC and CAIC were the lowest in the model with 10 classes, while the classification error was the lowest in the model with 9 classes. The classification tables indicated classification problems in mainly two to four classes in the three models (for the 10-class model refer Table S2). Especially one class with relatively low conditional probabilities for all symptoms was poorly identified in all three models (referred to as “few, mixed symptoms”). We identified violations of the assumption of local independency between tiredness and sleeplessness in the model with nine classes. Only minor issues with the assumption were present in the models with 10–11 classes, and we therefore accepted the assumption for these models. Concerning the clarity, meaning, and simplicity of the models, the two models with 9 and 10 classes performed relatively well, while many of the classes in the 11-class model were difficult to interpret. The difference between the 9- and 10-class models was an extra class in the 10-class model described by high conditional probabilities of tiredness and sleeplessness and low probabilities for other symptoms equivalent to the local dependency between these two symptoms in the 9-class model. Based on the observations, we chose the LCA model with 10 classes as the final model.
The LR test of the model in two randomly split halves of the data was significant (P<0.001) indicating lack of model fit. The BIC value was however smaller in the full model (BIC =209,191) than in the two small models together (BIC =210,748), indicating that randomly splitting the data in two did not improve the model. When we investigated the differences in the models, no specific difference was identified. We identified the same classification problems in the two small samples as in the full sample, especially with the few, mixed symptoms profile. Thus, we assumed that the main problems with the model were due to these classification problems, and we therefore accepted the model with 10 classes and direct effects between rapid heartbeat and chest pain and between urinary incontinence and urinary retention to be the best model.
Somatic symptom profiles
Table 2 shows the conditional probabilities of the 19 symptoms in the 10 identified symptom profiles (also depicted in Figure 1) including label, size, and expected number of symptoms for each profile. The largest profile with a prevalence of 74.0% consisted of those without any considerably bothering symptoms thus labeled “no symptoms”. A partially similar profile with relatively low probability for all the symptoms but still with 1.7 expected symptoms was labeled few, mixed symptoms. However, as mentioned earlier, this profile was poorly defined and had great overlap with the no symptoms profile (Table S2). Five profiles were mainly characterized by high probabilities for symptoms from one body part/organ system: one profile with neck/shoulder pain and headache (thus labeled “headache”), one with MS symptoms (MS), one with GI symptoms (GI), one with tiredness and sleeplessness (fatigue), and one with cold/coughing, respiratory distress, and tiredness (pulmonary). The expected number of symptoms in the five profiles was 1.9–3.6 with a prevalence of 1.5–6.8%, summing to 17.3% of the population being considerably bothered by symptoms from primarily one organ system. The last three profiles were characterized by multiple symptoms (5.8–11.5 expected symptoms) and had a total prevalence of 3.9%. Two of these profiles were symptom specific with considerable overlap. Thus, one consisted of those with MS symptoms, tiredness, sleeplessness, and headache (MS + general symptoms), while the others also had high probabilities of GI symptoms (MS + GI + general symptoms). The last profile was characterized by relatively high probabilities of all the 19 symptoms (all symptoms).
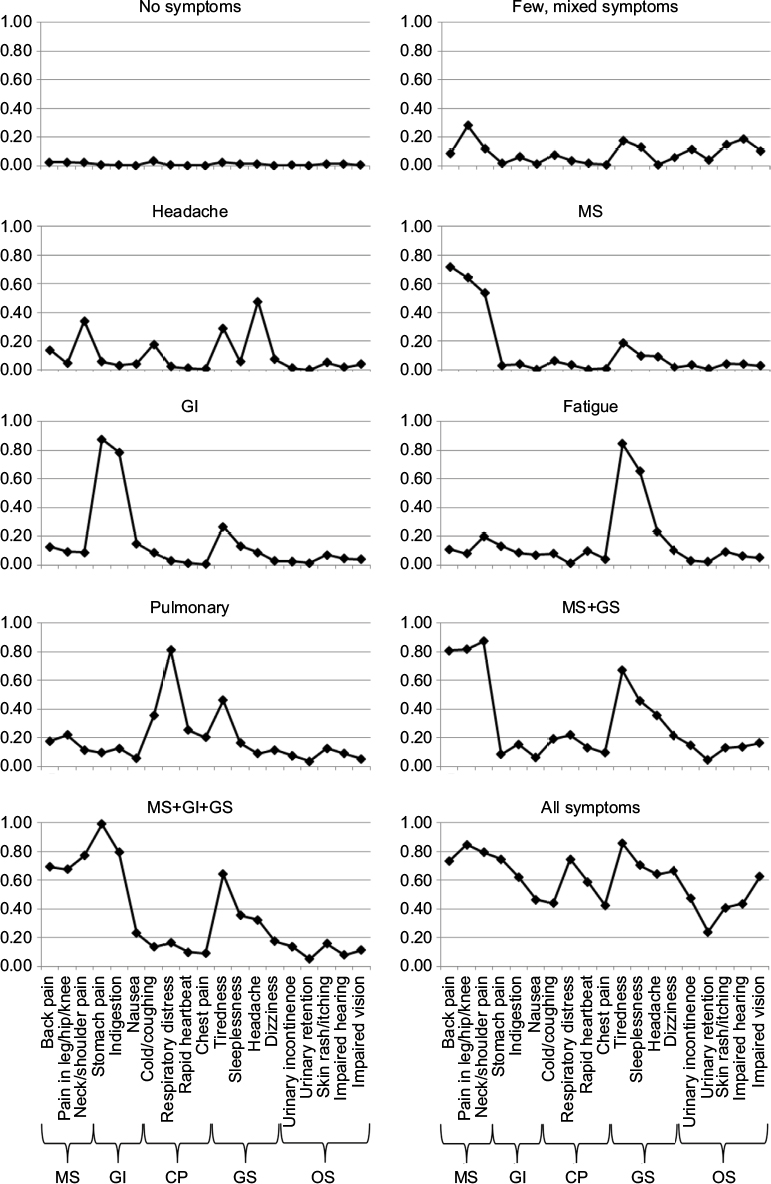 | Figure 1 Ten graphs each representing a symptom profile. Notes: The graph indicates the probability of being considerably bothered by the symptoms given at the X-axis when belonging to the specific symptom profile. The names of the graphs represent the profile labels. The symptoms at the X-axis are sorted according to type/site of the symptom (categories in brackets below the graph). The model includes direct effects between rapid heartbeat and chest pain and between urinary incontinence and urinary retention. GS includes headache, tiredness, and sleeplessness. Abbreviations: CP, cardiopulmonary; GI, gastrointestinal; GS, general symptoms; MS, musculoskeletal; OS, other symptoms. |
Associations with sex, age, chronic disease, and self-perceived health
Overall, the symptom profiles varied according to their association with age, sex, and chronic disease (Table 3). Age was associated with noticeable high ORs for being in the few, mixed symptoms profile, while it was associated with low ORs for the headache, the GI, and the fatigue profiles. Women had high ORs for being in most of the profiles with symptoms compared to the no symptoms profile, especially in the headache, GI, and MS + GI + general symptoms profiles (Table 3). In general, reporting a chronic disease, especially a mental disorder, was associated with high ORs for being in the profiles with symptoms, however with varying sizes of the ORs (Table 3). Noticeably, all four disease categories and particularly mental disorders were associated with high ORs for being in the three multisymptom profiles. In contrast, the ORs were relatively close to 1 in the headache and the GI profiles. The rest of the profiles were strongly associated with specific diseases. Thus, being in the few, mixed symptoms profile was strongly associated with having MS and cardio-metabolic diseases, the MS profile with having MS diseases, the fatigue profile with having mental disorders, and the pulmonary profile with having cardio-metabolic and pulmonary diseases (Table 3).
Poor self-perceived health tended to be positively associated with the number of expected symptoms in the profiles (Table 4). For example, the risk was 91.6% in the multisymptom profile and 1.2% in the no symptoms profile. Still, the risk of poor self-perceived health differed substantially for the profiles characterized by specific symptoms. Thus, the headache and the GI profiles were associated with a low risk of poor self-perceived health (14.1 and 17.7%, respectively), while the fatigue and pulmonary profiles were associated with a relatively high risk of poor self-perceived health (52.9 and 68.9%, respectively).
LCA on 13 more commonly measured symptoms
When excluding the more objective and rarely measured symptoms from the LCA, we identified the best model to have nine classes and include a direct effect between dizziness and nausea (Table S3). Most of the profiles described by the nine classes were similar to those found in the LCA on all symptoms. The main differences concerned the following two profiles: the few, mixed symptoms profile, which was not identified, and the pulmonary profile, which included higher probabilities of cardio symptoms in the limited LCA (thus labeled CP instead). The prevalence of the nine profiles was almost equivalent to that of the 10 profiles in the main analysis when combining the no symptoms and few, mixed symptoms into one group. Exceptions were the fatigue profile (0.02 in the full LCA and 0.05 in the limited LCA) and the headache profile (0.05 vs 0.03, respectively).
We found similar tendencies in the symptom profiles’ associations with age, sex, and chronic disease in the two LCA models (Table S4). Exceptions included that women had higher ORs for being in the all-symptoms profile in the limited model and that having a pulmonary disease was associated with higher odds for being in the fatigue profile. Similar risks of poor self-perceived health according to profile membership were found in the two models (Table S5).
Discussion
Main findings
In this large epidemiological study, we identified 10 different symptom profiles described by number and type/site of the symptoms: one without symptoms, one with few nonspecific symptoms, five with symptom-specific profiles (headache, MS, GI, fatigue, and pulmonary), and three with multiple symptoms (MS + general symptoms, MS + GI + general symptoms, and all symptoms). The no symptoms profile contained three quarters of the population, while the three multisymptom profiles contained 3.9% of the population. The profiles could further be distinguished by their association with sex, age, and chronic disease. Poor self-perceived health was associated with the number of expected symptoms in the profiles with some exceptions: the headache and GI profiles had a low risk of poor self-perceived health, while the few, mixed symptoms profile had a high risk. Similar results were found when excluding symptoms with a more objective character from the analyses.
Interpretation and explanations of the findings
The identified profiles described clinical recognizable symptom patterns from both well-defined diseases and more unexplained syndromes, eg, fibromyalgia. For example, the headache profile is often seen among people with tension headache or migraine and the pulmonary profile is seen among people with chronic obstructive pulmonary disease or an ordinary cold. This was also reflected by the relatively high OR for being in a profile characterized by symptoms similar to symptoms of the respective disease. Still, a large part of symptoms cannot be explained by well-defined diseases.21,22 The symptom profiles could therefore also indicate possible delimitations of more unexplained syndromes. However, until the profiles have been explored more thoroughly, the symptom profiles should not be interpreted as definitions of diseases or new classifications of disorders but as complexes of considerably bothering symptoms of different origin.
The few, mixed symptoms profile was vaguely characterized by its symptom prevalence but was recognizable when including information on sex, age, and chronic disease as it then could be interpreted as a profile for healthy seniors with age-related health problems. Still, the risk of poor self-perceived health was relatively high in this group. This indicates that the absence of considerably bothering symptoms is not equivalent with having a good self-perceived health. Neither was the opposite, thus being considerably bothered by symptoms and having poor self-perceived health, indicated by the low risk of poor self-perceived health in the headache and the GI profiles. Thus, health status was also associated with the specific symptom combinations and not merely with the quantity of symptoms.
Relation to other studies
The findings of symptom profiles with no/few symptoms and with multiple symptoms were comparable with previous findings,9–14 while only two of the previous studies also found symptom profiles defined by specific symptoms.11,12 However, the number and description of the profiles differed from our findings except for an MS/pain profile,11,12 a GI profile,11,12 and an MS + GI profile.11 The divergent findings could be a result of different materials and methods. Thus, different symptoms were included in the analyses of symptom profiles and some included groups of symptoms instead of single symptoms.9–11 This could limit the identification of potential nuances in the profiles and thus limit the number of profiles identified. Moreover, all the previous studies focused on medically unexplained symptoms or functional disorders, hence symptoms viewed as medically explained were excluded in many of the studies.10,11,13,14 Most of the previous studies were further clinical studies and thus based on a highly selected population,9–11,13 which could result in fewer or biased profiles if transferred to the general population.
Many studies have investigated associations between symptoms and groups of symptoms mostly using factor analysis.8,10,14,23–29 The findings differ, but in general, they have found an MS, GI, and CP factor and some have also found an overall factor comprising multiple symptoms from several factors.27–29 Thus, these findings correspond well with our findings of an MS, GI, pulmonary/CP, and the all-symptoms profile. Furthermore, our findings also correspond surprisingly well with findings of patient groups with “unexplained” syndromes, such as fibromyalgia,30 irritable bowel syndrome,31 and bodily distress syndrome.10,32 We found similar prevalence as other epidemiological studies on these single unexplained syndromes.30,31 Furthermore, we confirmed the finding that the GI symptom profile is very common in the general population, but only in cases with multiple other (non-GI) symptoms, it is associated with poor self-perceived health.33 Our study using LCA added further information on symptom profiles, as we did not use predefined syndrome definitions but still identified symptom profiles that were originally described in the clinical literature. As we used an explorative approach that enabled grouping of persons based on symptom reporting instead of grouping of symptoms, the considerable similarity of our findings with studies in unexplained syndromes is remarkable.
Methodological considerations
Strengths of the study included that it is the first large population-based study to explore symptom profiles based on a variety of somatic symptoms covering the most frequently reported symptoms in other studies.16 The use of LCA on all the symptoms directly enabled a nuanced identification and description of the somatic symptom profiles. Moreover, the profiles were provided directly by the LCA model and assignment to the profiles based on posterior probabilities. Hence, the choice of cut points and underlying structure of the symptoms were avoided and the uncertainty in the model was included in the class assignment.34 By relating the profiles to age, sex, chronic disease, and self-perceived health, a better understanding of the profiles was obtained.
However, the study also has some limitations. Some of the profiles could be a result of chance findings and may be too complex due to the large data sample and the many symptoms included directly in the LCA. For instance, the relatively rare multiple symptom profiles were rather similar and the differences may not be detectable in smaller samples. Nevertheless, the interpretation of the profiles was clinically meaningful and supported by many studies, and the complexity of the model must be seen in the light of the disease complexity in the general population. Also, limiting the analyses to fewer symptoms did not reduce the number or interpretation of the profiles considerably. A further implication of the large data sample may be the lack of model fit according to the LR test, as even minor chance associations may have been given weight in the analyses. Therefore, we accepted the model based on the exploration of model characteristics including the BIC, even though the LR test was significant. Another potential limitation was the use of a predefined list of symptoms, as the symptoms included in the LCA directly influenced which profiles could be identified. Yet, as mentioned earlier, the list covered all the important and frequently assessed symptoms identified in a recent review of symptom assessing,16 indicating that no major symptoms were lacking. Moreover, the similarities between the LCA on all symptoms and on 13 selected symptoms indicated a robustness of the profiles. Still, the profiles were a result of the assessed symptoms and they should be confirmed in other similar studies focusing on symptom assessment. Another limitation was the poor classification of some of the profiles in the model, especially the few, mixed symptoms profile. However, as mentioned earlier, the profile was distinguished by higher OR for age and age-related diseases pointing toward a profile consisting of healthy seniors with age-related health problems.
The survey used in the study had a response rate at 0.52, and the participants could be expected to be healthier than nonparticipant.8,35 This could have affected the identification and size of the symptom profiles as other nonidentified profiles could exist among the nonparticipants and the prevalence of the profiles with symptoms may have been underestimated. Furthermore, the identified profiles could also be affected if the selection resulted in some symptoms were given too much weight in the modeling process. However, as the profiles were interpretable and clinically meaningful, we believe that this bias may be minor.
Conclusions and implications of the study
In this large population-based study, we found that symptom profiles in the general adult population could be described by both number and site/type of symptom presentations. The symptom profiles were further characterized by their association with sex, age, chronic disease, and self-perceived health. The profiles were clinically recognizable but should not be labeled with any disease or disorder categories. Instead, the profiles can broaden the perspectives and provide additional insight into the health status at both individual and population level than if merely using disease status or single symptoms.22 Also, using the symptom profiles in further epidemiological research, possible risk factors, pathophysiology, and prognosis of multiple symptoms can be explored. This can add valuable information to patient and public health management beyond the knowledge of well-defined diseases. Furthermore, the symptom profiles including a broad focus on multiple symptoms may help guiding the delimitation and management of more unexplained syndromes. However, the analyses were explorative and based on a predefined list of considerably bothering symptoms, and the validity of the symptom profiles needs to be explored and confirmed in other populations preferable with a focus on symptom measurement.
Acknowledgments
The authors would like to thank the participants in the health survey and the team behind the survey at the Research Centre for Prevention and Health, the Capital Region of Denmark, for their great work in collecting and assuring data of high quality. This study was a part of the Danish study of Functional Disorders (DanFunD) funded by The Lundbeck Foundation (grant number R155-2013-14070) and TrygFonden (grant number 7-11-0213). The DanFunD scientific management group consists of Professor MD DMSc Torben Jørgensen (PI), Professor MD DMSc Per Fink, Senior consultant MD PhD Lene Falgaard Eplov, Senior researcher MSc PhD Sine Skovbjerg, and Head of research MD DMSc Jesper Mehlsen.
Author contributions
ME contributed to the conception and design of the study, performed and interpreted all the analyses of the data, and drafted the article. TJ and AS contributed to the conception and design of the study and interpretation of the data and provided supervision. TMD contributed to the interpretation of the data. PF contributed to the conception and design of the study and interpretation of the data. NBJ contributed to the acquisition of the data and suggestions for analyses. CHP, LFE, and SS contributed to the conception and design of the study. SK contributed to the conception and design of the study and interpretation of the data and supervised the statistical analyses. All authors contributed to critically revising the paper for important intellectual content, and all authors read and approved the final article.
Disclosure
The authors report no conflicts of interest in this work.
References
Creed FH, Davies I, Jackson J, et al. The epidemiology of multiple somatic symptoms. J Psychosom Res. 2012;72(4):311–317. | ||
Tomenson B, Essau C, Jacobi F, et al. Total somatic symptom score as a predictor of health outcome in somatic symptom disorders. Br J Psychiatry. 2013;203(5):373–380. | ||
Ladwig KH, Marten-Mittag B, Lacruz ME, Henningsen P, Creed F; MONICA KORA Investigators. Screening for multiple somatic complaints in a population-based survey: does excessive symptom reporting capture the concept of somatic symptom disorders? Findings from the MONICA-KORA Cohort Study. J Psychosom Res. 2010;68(5):427–437. | ||
Escobar JI, Cook B, Chen CN, et al. Whether medically unexplained or not, three or more concurrent somatic symptoms predict psychopathology and service use in community populations. J Psychosom Res. 2010;69(1):1–8. | ||
Klaus K, Rief W, Brahler E, Martin A, Glaesmer H, Mewes R. The distinction between “medically unexplained” and “medically explained” in the context of somatoform disorders. Int J Behav Med. 2013;20:161–171. | ||
Kroenke K, Spitzer RL, Williams JBW. The PHQ-15: validity of a new measure for evaluating the severity of somatic symptoms. Psychosom Med. 2002;64(2):258–266. | ||
Derogatis LR, Lipman RS, Rickels K, Uhlenhuth EH, Covi L. The Hopkins Symptom Checklist (HSCL): a self-report symptom inventory. Behav Sci. 1974;19:1–15. | ||
Eliasen M, Kreiner S, Ebstrup JF, et al. Somatic symptoms: prevalence, co-occurrence and associations with self-perceived health and limitations due to physical health – a Danish population-based study. PLoS One. 2016;11:e0150664. | ||
Budtz-Lilly A, Fink P, Ørnbøl E, et al. A new questionnaire to identify bodily distress in primary care: the “BDS checklist”. J Psychosom Res. 2015;78:536–545. | ||
Fink P, Toft T, Hansen MS, Ornbol E, Olesen F. Symptoms and syndromes of bodily distress: an exploratory study of 978 internal medical, neurological, and primary care patients. Psychosom Med. 2007;69(1):30–39. | ||
Gara MA, Silver RC, Escobar JI, Holman A, Waitzkin H. A hierarchical classes analysis (HICLAS) of primary care patients with medically unexplained somatic symptoms. Psychiatry Res. 1998;81(1):77–86. | ||
Kato K, Sullivan PF, Pedersen NL. Latent class analysis of functional somatic symptoms in a population-based sample of twins. J Psychosom Res. 2010;68(5):447–453. | ||
Lacourt T, Houtveen J, van DL. “Functional somatic syndromes, one or many?” An answer by cluster analysis. J Psychosom Res. 2013;74:6–11. | ||
Rosmalen JGM, Tak LM, de Jonge P. Empirical foundations for the diagnosis of somatization: implications for DSM-5. Psychol Med. 2011;41(6):1133–1142. | ||
Toft U, Vinding AL, Larsen FB, Hvidberg MF, Robinson KM, Glümer C. The development in body mass index, overweight and obesity in three regions in Denmark. Eur J Public Health. 2015;25(2):273–278. | ||
Zijlema WL, Stolk RP, Löwe B, et al. How to assess common somatic symptoms in large-scale studies: a systematic review of questionnaires. J Psychosom Res. 2013;74(6):459–468. | ||
Vermunt JK, Magidson J. Technical Guide for Latent GOLD 5.0: Basic, Advanced, and Syntax. Belmont, MA: Statistical Innovations Inc.; 2013. | ||
Masyn KE. Latent class analysis and finite mixture modeling. In: Little TD, editor. The Oxford Handbook of Quantitative Methods in Psychology: Vol. 2: Statistical Analysis. New York, NY: Oxford University Press; 2013:551–611. | ||
Nylund KL, Asparouhov T, Muthén BO. Deciding on the number of classes in latent class analysis and growth mixture modeling: a monte carlo simulation study. Struct Equ Model. 2007;14:535–569. | ||
Vermunt JK. Latent class modeling with covariates: two improved three-step approaches. Polit Anal. 2010;18:450–469. | ||
Kroenke K, Mangelsdorff AD. Common symptoms in ambulatory care: incidence, evaluation, therapy, and outcome. Am J Med. 1989;86(3):262–266. | ||
Kroenke K. A practical and evidence-based approach to common symptoms a narrative review. Ann Intern Med. 2014;161(8):579–U82. | ||
Eriksen HR, Ihlebaek C, Ursin H. A scoring system for subjective health complaints (SHC). Scand J Public Health. 1999;27(1):63–72. | ||
Gierk B, Kohlmann S, Kroenke K, et al. The somatic symptom scale-8 (SSS-8): a brief measure of somatic symptom burden. JAMA Intern Med. 2014;174(3):399–407. | ||
Tsai CH. Factor analysis of the clustering of common somatic symptoms: a preliminary study. BMC Heal Serv Res. 2010;10:160. | ||
Nordin S, Palmquist E, Nordin M. Psychometric evaluation and normative data for a Swedish version of the Patient Health Questionnaire 15-Item Somatic Symptom Severity Scale. Scand J Psychol. 2013;54(2):112–117. | ||
Witthoft M, Hiller W, Loch N, Jasper F. The latent structure of medically unexplained symptoms and its relation to functional somatic syndromes. Int J Behav Med. 2013;20(2):172–183. | ||
Liu G, Clark MR, Eaton WW. Structural factor analyses for medically unexplained somatic symptoms of somatization disorder in the Epidemiologic Catchment Area study. Psychol Med. 1997;27(3):617–626. | ||
Porsius JT, Martens AL, Slottje P, et al. Somatic symptom reports in the general population: application of a bi-factor model to the analysis of change. J Psychosom Res. 2015;79(5):378–383. | ||
Clauw DJ. Fibromyalgia. JAMA. 2014;311:1547. | ||
Chey WD, Kurlander J, Eswaran S. Irritable bowel syndrome. JAMA. 2015;313:949. | ||
Fink P, Schroder A. One single diagnosis, bodily distress syndrome, succeeded to capture 10 diagnostic categories of functional somatic syndromes and somatoform disorders. J Psychosom Res. 2010;68(5):415–426. | ||
Vandvik PO, Wilhelmsen I, Ihlebaek C, Farup PG. Comorbidity of irritable bowel syndrome in general practice: a striking feature with clinical implications. Aliment Pharmacol Ther. 2004;20(10):1195–1203. | ||
Muthén B, Muthén LK. Integrating person-centered and variable-centered analyses: growth mixture modeling with latent trajectory classes. Alcohol Clin Exp Res. 2000;24(6):882–891. | ||
Glumer C, Hilding-Nørkjær H, Jensen HN, Jørgensen T, Andreasen AH, Ladelund S. Sundhedsprofil for region og kommuner 2008. Research Centre for Prevention and Health, The Capital Region of Denmark; 2008. Danish. |
Supplementary materials
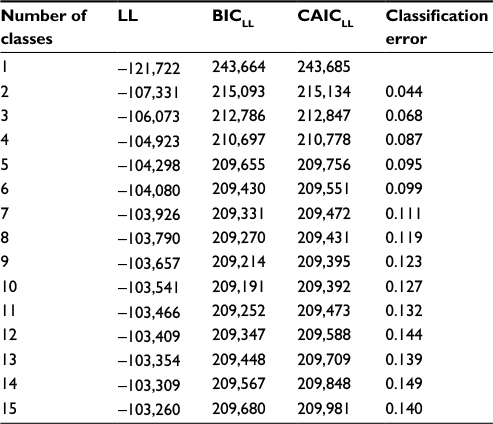 | Table S1 Model fit statistics for latent class models with 1–15 classes based on data on 19 self-reported symptoms Note: The model includes direct effects between rapid heartbeat and chest pain and between urinary incontinence and urinary retention. Abbreviations: BIC, Bayesian Information Criterion; CAIC, Consistent Akaike’s Information Criterion; LL, log likelihood statistics. |
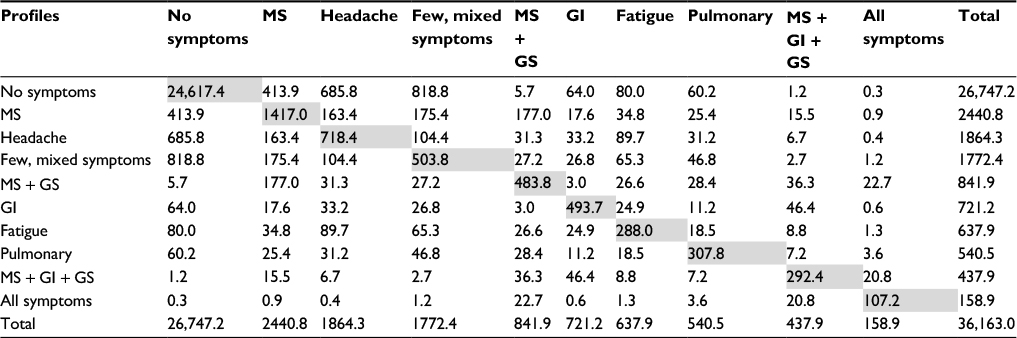 | Table S2 Classification table for the latent model with 10 classes based on 19 self-reported symptoms Notes: The table shows the cross-tabulation of the true profile membership against the predicted profile membership based on proportional assignment. The shaded diagonal represents those who have been assigned correctly. The model includes direct effects between rapid heartbeat and chest pain and between urinary incontinence and urinary retention. GS includes headache, tiredness, and sleeplessness. Abbreviations: GI, gastrointestinal; GS, general symptoms; MS, musculoskeletal. |
 | Table S3 Conditional probabilities of the symptoms given the 9 classes in the LCA model based on 13 more commonly measured symptoms including class size and expected number of symptoms Notes: The table shows the class size, expected number of symptoms, and symptom probability given the classes. Numbers in bold indicate a symptom probability of >0.30. The profiles are sorted according to the number of expected symptoms. The model includes a direct effect between dizziness and nausea. GS includes headache, tiredness, and sleeplessness. N=36,163. Abbreviations: CP, cardiopulmonary; GI, gastrointestinal; GS, general symptoms; LCA, latent class analysis; MS, musculoskeletal. |
 | Table S4 OR for being in the symptom profiles compared to the healthy profile, based on the LCA on 13 symptoms Notes: The model includes a direct effect between dizziness and nausea. N=35,188–36,163. GS includes headache, tiredness, and sleeplessness. Abbreviations: CP, cardiopulmonary; GI, gastrointestinal; GS, general symptoms; LCA, latent class analysis; MS, musculoskeletal; OR, odds ratio; Ref., reference profile. |
 | Table S5 The probability of poor self-perceived health within each of the 9 symptom profiles based on the LCA on 13 symptoms Notes: The model is adjusted for sex, age, and chronic disease. The model includes a direct effect between dizziness and nausea. N=33,696. GS includes headache, tiredness, and sleeplessness. Abbreviations: CP, cardiopulmonary; GI, gastrointestinal; GS, general symptoms; LCA, latent class analysis; MS, musculoskeletal. |
 © 2017 The Author(s). This work is published and licensed by Dove Medical Press Limited. The
full terms of this license are available at https://www.dovepress.com/terms
and incorporate the Creative Commons Attribution
- Non Commercial (unported, 3.0) License.
By accessing the work you hereby accept the Terms. Non-commercial uses of the work are permitted
without any further permission from Dove Medical Press Limited, provided the work is properly
attributed. For permission for commercial use of this work, please see paragraphs 4.2 and 5 of our Terms.
© 2017 The Author(s). This work is published and licensed by Dove Medical Press Limited. The
full terms of this license are available at https://www.dovepress.com/terms
and incorporate the Creative Commons Attribution
- Non Commercial (unported, 3.0) License.
By accessing the work you hereby accept the Terms. Non-commercial uses of the work are permitted
without any further permission from Dove Medical Press Limited, provided the work is properly
attributed. For permission for commercial use of this work, please see paragraphs 4.2 and 5 of our Terms.