Back to Journals » Clinical, Cosmetic and Investigational Dentistry » Volume 12
Socioeconomic-Related Inequalities in Dental Care Utilization in Northwestern Iran
Authors Rezaei S ![]() , Pulok MH
, Pulok MH ![]() , Zahirian Moghadam T
, Zahirian Moghadam T ![]() , Zandian H
, Zandian H ![]()
Received 10 March 2020
Accepted for publication 17 April 2020
Published 28 April 2020 Volume 2020:12 Pages 181—189
DOI https://doi.org/10.2147/CCIDE.S253242
Checked for plagiarism Yes
Review by Single anonymous peer review
Peer reviewer comments 2
Editor who approved publication: Professor Christopher E. Okunseri
Satar Rezaei,1 Mohammad Habibullah Pulok,2 Telma Zahirian Moghadam,3 Hamed Zandian3
1Research Center for Environmental Determinants of Health, Health Institute, Kermanshah University of Medical Sciences, Kermanshah, Iran; 2Nova Scotia Health Authority, Halifax, Nova Scotia, Canada; 3Social Determinants of Health Research Center, Ardabil University of Medical Sciences, Ardabil, Iran
Correspondence: Hamed Zandian
Social Determinants of Health Research Center, Ardabil University of Medical Sciences, Ardabil, Iran
Tel +98 4533513775
Email [email protected]
Introduction: There have been multiple studies on socioeconomic-related inequalities in the use of dental services in Iran, but the evidence is still limited. This study measured inequality in dental care utilization by socioeconomic status and examined factors explaining this inequality among households in Ardabil, Iran in 2019.
Methods: A total of 436 household heads participated in this cross-sectional study. Using a validated questionnaire, face-to-face interviews were conducted to collect data on dental care utilization, unmet needs, sociodemographic characteristics, economic status, health insurance, and oral health status of the participants. We used the concentration curve and relative concentration index (RCI) to visualize and quantify the level of inequality in dental care utilization by income. Regression-based decomposition was also applied to understand the causes of inequality.
Results: About 59.2% (95% CI 54.4%– 63.7%) and 14.7% (95% CI 11.6%– 18.4%) of participants had visited a dentist for dental treatment in the previous 12 months and for 6-month dental checkups, respectively. The RCI for the probability of visiting a dentist in the last 12 months was 0.243 (95% CI 0.140– 0.346). This suggests that dental care utilization was more concentrated among the rich. The RCI for unmet dental care needs was negative, which indicates more prevalence among the poor. Monthly household income (20.9%), self-rated oral health (6.9%), regular brushing (3.2%), and dental health insurance (2.5%) were the main factors in socioeconomic inequality in dental care utilization.
Conclusion: This study reveals that dental care–service utilization did not match the need for dental care, due to differences in socioeconomic status in Ardabil, Iran. Policies could be implemented to increase the coverage of dental care services among socioeconomically disadvantaged groups to tackle socioeconomic-related inequality in dental care utilization.
Keywords: dental care utilization, socioeconomic status, inequality, decomposition
Introduction
Oral health is one of the main components of general health, which affects quality of life of the population.1,2 Increasing utilization of dental care services and routine oral checkups could lead to better oral health.3 Studies have highlighted that socioeconomic status4 is significantly associated with oral health status.1,5–7 Poorer people get less benefit from dental care services than wealthier people.5,8–12 Empirical evidence from different jurisdictions reveal that low income, low education, and living in rural areas are associated with low utilization of dental care services.1,5,13–17 According to the Anderson model of health-service utilization, economic status is not only a major factor in dental service utilization, other factors, such as age, sex, education, attitude to oral health, lifestyle, and sociocultural status, influence dental service utilization.18 Determinants of dental care utilization can be divided into two categories: personal factors and health-system factors. Personal factors include sociodemographic and predisposing factors, such as experience, education, marital status, perceptions about oral health, and enabling factors, such as income and ability to pay for services. Factors related to the health system are physical and geographical access to dental care services.8,11
Several studies from Iran have shown that utilization of dental services is much lower than other countries. In one study, >27% of the targeted population (mothers) had had less than one dentist visit and >45% no dental service utilization during the previous year. The researchers concluded that many factors had effect on dental service utilization.19 Utilization of dental services is strongly associated with socioeconomic factors, such as income, age, level of education, and dental insurance, in Iran.1,6,20–22 There have been several studies on determinants of dental care utilization in different regions of Iran,6,23 but empirical evidence on socioeconomic inequality in dental care utilization is scarce.22 The objective of this study was to contribute to the literature by presenting new empirical evidence on socioeconomic-related inequality in dental care utilization and the causes of this inequality in Ardabil, Iran.
Methods
Study Setting and Sample
Ardabil, the capital of Ardabil province in northwest Iran, was the study setting. This city has a population of approximately 532,000 people according to the 2016 national census of Iran. This study was based on data from a cross-sectional survey conducted between August and October 2019. Heads of households living in Ardabil were the target population. Cluster random sampling was applied to select samples in a cross-sectional survey designed for this study. For this purpose, the health centers of Ardabil (23 centers) were determined as the clusters. Eight centers were randomly selected from the center list. Within each health center, households with health documents were selected randomly for interviews. For sample-size estimation, we used a formula based on the prevalence of dental service utilization:1
(1)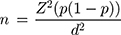
where n is the sample size, calculated at the 95% level of significance (Z=1.96), p the prevalence of dental care utilization obtained from a previous study in Iran,1 and d precision of 0.05. A 20% nonresponse rate was considered for sample-size calculation. The population covered by each health center determined the sample size selected from that center. If there were no access to a family within a cluster or an uncooperative household, the next available household was used as the replacement. At the household level, the household head was interviewed as the representative. In the absence of a household head, the oldest person, usually the spouse, was interviewed. Finally, data from 436 household heads living in Ardabil in 2019 were included.
Data Collection
During the survey, face-to-face interviews were conducted to collect data, with the information used in this study self-reported. The questionnaire had previously beenused and validated in several studies in Iran, with Cronbach’s α=0.76–0.86.1,6,24 The questionnaire had two parts. The first part was related to socioeconomic and demographic variables of households, comprising age, sex, education, employment, household size, health insurance coverage, dental health insurance, and monthly household income. The second part was related to questions about the use of dental services and its various aspects.
Outcome Variables
We used the question “Have you visited the dentist in the last 12 months for dental treatment?” as the dependent (and binary) variable. In addition, the question “Did you have a dental pain, but did not visit the dentist in the last 12 months?” was used to assess the status of unmet dental care need. The 6-monthly dental checkup status was examined with the question “Have you visited a dentist only for checkup in the last 6 months?”
Independent Variables
Age (continues variable), sex (male/female), education(illiterate/primary/secondary/university graduate), employment (unemployed/self-employed/employed/retired), dental insurance (yes/no), household size (continuous variable), regular brushing at least once per day (yes/no), monthly household income (<IRR10 million, IRR10–20 million, IRR20–40 million, and >IRR40 million), self-rated oral health (poor/good), and importance of oral health similar to rest of body (yes/no) were used as explanatory variables in the analysis.
Statistical Analysis
We used multivariate logistic regression to identify the correlates of dental care utilization. The relative concentration index (RCI) and concentration curve (CC) were used to assess and quantify socioeconomic inequality in dental care utilization among participants.25 Household monthly income was used as the proxy for socioeconomic status. The CC showed the cumulative proportion of the dependent variable (in this study, dental care utilization in the last 12 months, unmet dental care needs, or 6-monthly checkup) on the y-axis and cumulative proportion of samples ranked by socioeconomic status (in this study, monthly income) on the x-axis. If the CC lay below (above) the 45° line (perfect equality), it suggested that dental care utilization was more prevalent among the rich.26
We quantified the level of inequality using the RCI, which can be estimated as twice the area between the CC and the 45° line.27 The RCI varies between −1 and 1. A positive (negative) RCI implies that the outcome variable (eg, dental care utilization) is more concentrated among richer (poorer) households. Since the outcome variable in this study was binary, the estimated RCI could not fall between −1 and 1. Following Wagstaff,28 we normalized the RCI by dividing it by  , where µ is the mean of dental care utilization.
Finally, we employed the decomposition method to identify the main determinants of observed inequality in dental care utilization.29 There is a relationship between utilization of dental care, y, and explanatory variables, xk:
(2)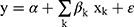
where (3) represents the explanatory variables mentioned in the previous section. The RCI for dental care utilization was decomposed:
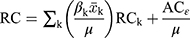
Where (4) is the relative concentration index for dental care utilization,
  the mean of
  determinants,
  the
the  for explanatory factors, and
 the elasticity of dental care utilization with respect to the explanatory variable
  .
.  presents the contribution of the explanatory factor
 to the
  . The last term,
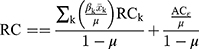
 , is the residual component. Since our measure of inequality was normalized RCI, we used the following formula in the decomposition analysis.
Since the outcome variable was binary in this study, we used logistic regression to obtain the marginal effect of determinants in the decomposition analysis. Statistical analysis was performed with Stata 12.0 (StataCorp, College Station, TX, USA), and p<0.05 was considered statistically significant.
Ethics Statement
The ethics committee of the Deputy of Research, Ardabil University of Medical Sciences (ARUMS) reviewed and approved the study protocol (IR.ARUMS.REC.1398.169). Ethical codes of conduct recommended by the World Medical Association and Declaration of Helsinki were used to engage each eligible participant of the study. As such, verbal informed consent was obtained from each participant and deemed to be acceptable and approved by the ethics committee after explanation of study details, including its purpose, and it was explained that the participant had the right to withdraw from the study at any point during data collection. Data were collected and analyzed with participants remaining anonymous, and the results were used for research purposes only.
Results
Table 1 presents descriptive characteristics of the study participants. Of 436 household heads, >90% were male. The average age of the study population was 46.4±11.1 years. Mean household size was 3.8 (range one to nine). Monthly household income was <IRR10 million for 11.2% of households and ≥IRR40 million for 18.6% households. A majority of the samples (81.9%) had health insurance, and about 23.6% had dental health insurance.
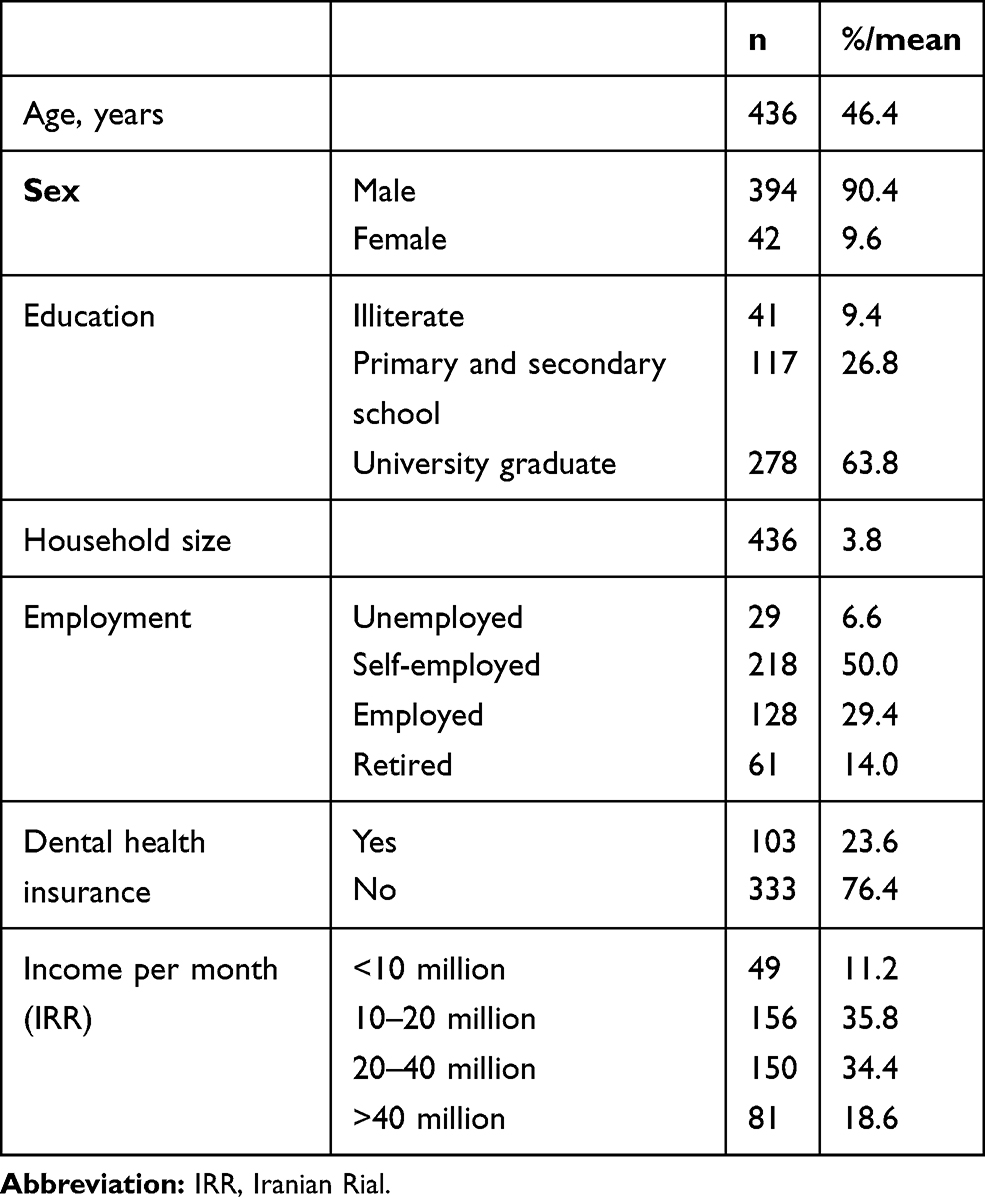 |
Table 1 Characteristics of the Study Population in Ardabil, 2019 |
Table 2 reports the various aspects of dental care utilization among the household heads. The average number of visits to the dentist was 2.9±5.3. Approximately 59.2% (95% I 54.4%–63.7%) of participants reported that they had visited a dentist for dental treatment in the last 12 months. About 14.7% (95% CI 11.6%–18.4%) of the participants had visited a dentist at least once for a 6-monthly dental checkup. In sum, 402 (92.2%) respondents reported that the cost of dental services was high, 110 (25.2%)reported utilizing dental services once or twice, and 148 (33.9%) had visited a dentist more than twice in the last 12 months.
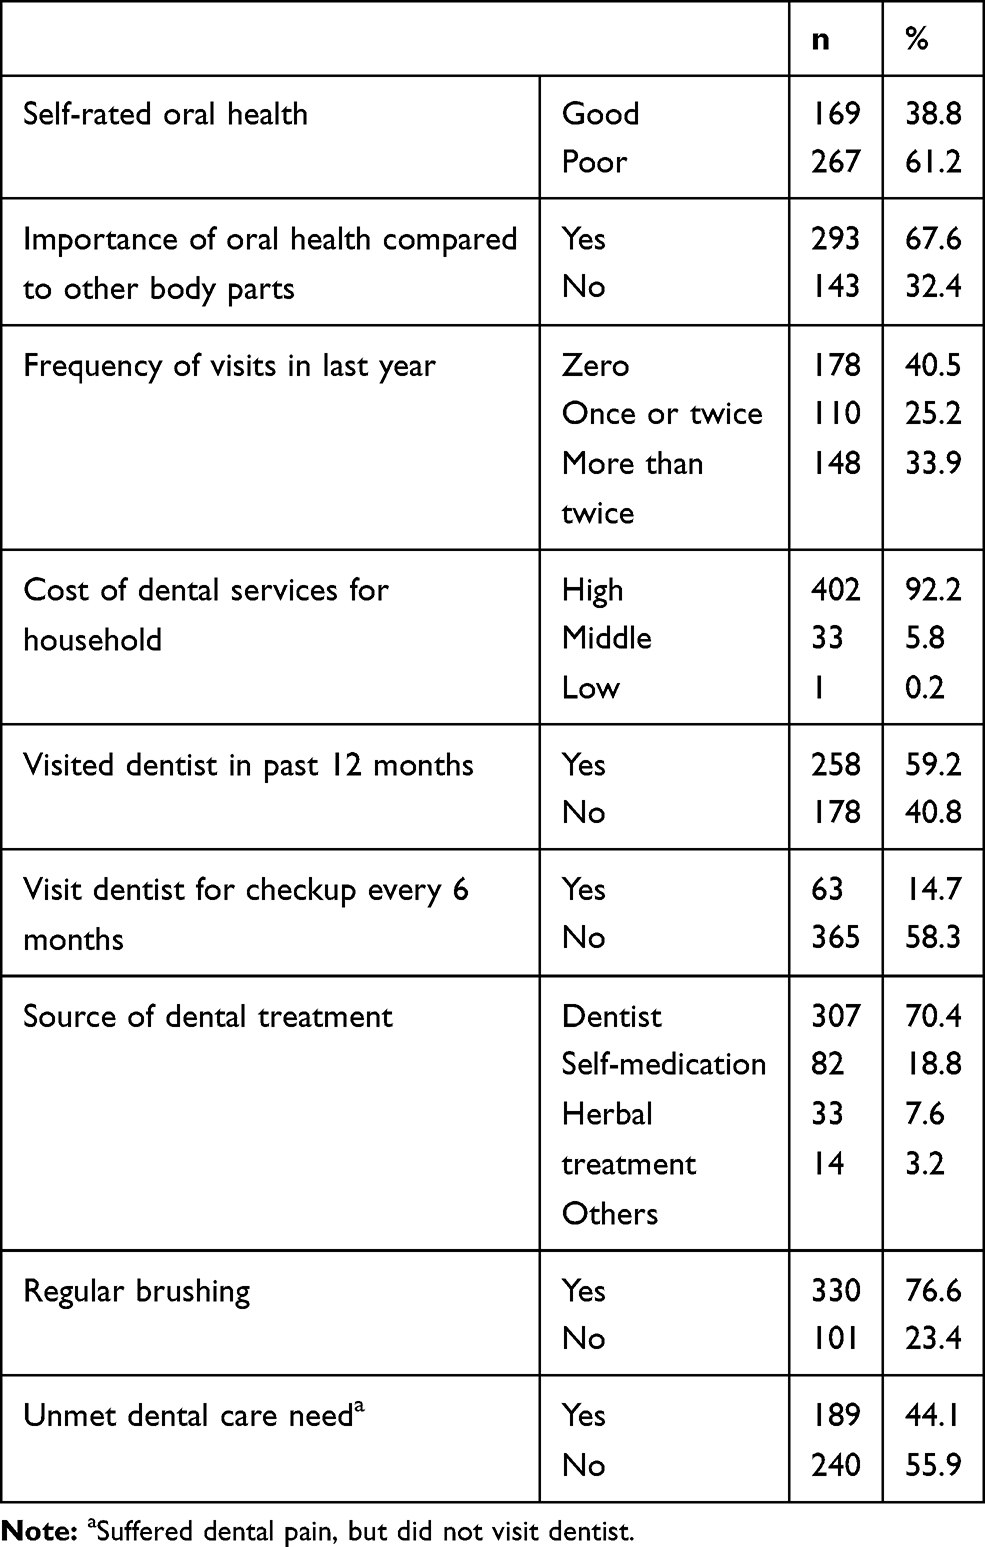 |
Table 2 Characteristics of Study Participants Regarding Various Aspects of Dental Care Utilization |
Results from multivariate logistic regression analysis on determinants of visiting a dentist are reported in Table 3. There was a positive association between age and probability of visiting a dentist for dental care (OR 1.03, p=0.031). People with dental health insurance were 1.8 times as likely to visit a dentist than without dental health insurance. The likelihood of visiting a dentist was 3.71 times higher in households with monthly income >IRR 40 million than those with monthly income <IRR 10 million.
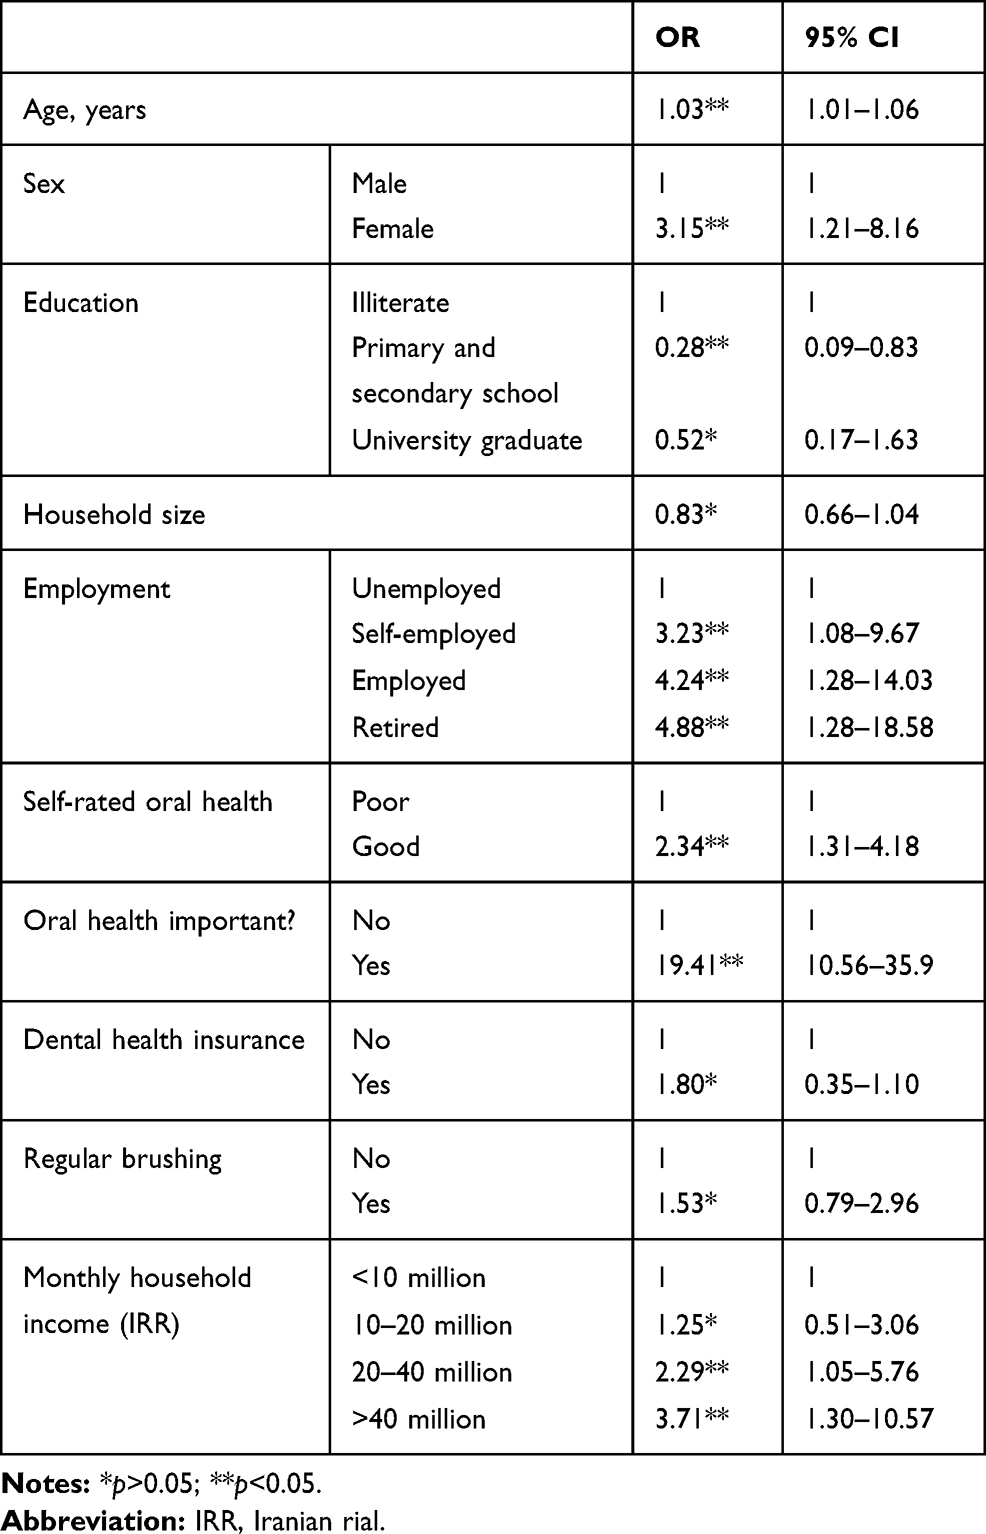 |
Table 3 Multivariate Logistic Regression on Dental Care Utilization in Ardabil, 2019 (n=436) |
Result of normalized RCI values indicated that visiting a dentist for dental treatment in the last 12 months was more concentrated among individuals with high income (RCI 0.243, 95% CI 0.140–0.346). The RCI for visiting a dentist for a 6-monthly checkup was 0.179 (95% CI 0.033–0.326), suggesting that 6-monthly checkups were more prevalent among better-off samples. Finally, unmet dental care needs were more concentrated among the poor (RCI −0.125, 95% CI −0.229 to −0.022).
Figure 1 shows CCs for visiting a dentist for treatment in the last 12 months, 6-monthly checkups, and unmet dental care needs. CCs for visiting a dentist for treatment in the last 12 months and 6-monthly checkups are under the 45° line. This implies that these outcomes were more concentrated among the richest. On the other hand, the CC for unmet dental care need lies above the 45° line, suggesting a poorer people had more unmet needs for dental care services. The interpretation is that poorer people were in need of dental care services, but could not use these services for various reasons.
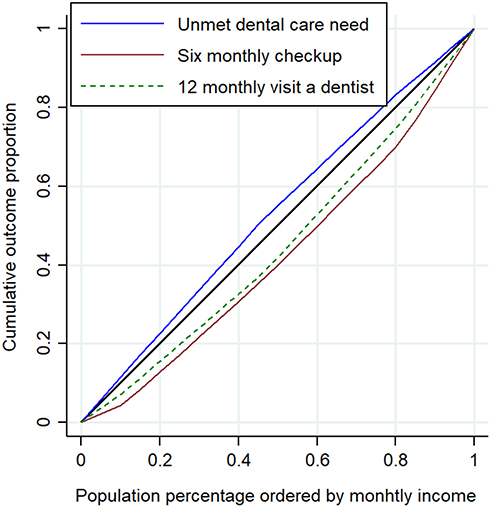 |
Figure 1 Concentration curves for unmet dental care need, 6-month checkups, and probability of visiting dentist in last 12 months in Ardabil, 2019. |
Table 4 shows decomposition results for the probability of a dentist visit in the last 12 months. The RCIs for females, self-employed, and those with primary and secondary education are negative, which suggests that these variables were more concentrated amongpoorest households. Dental insurance, greater household size, and regular brushing were more concentrated among the better-off. The main factors contributing to socioeconomic inequality in dental care utilization were monthly household income (20.9%), self-rated oral health (6.9%), regular brushing (3.2%), and dental health insurance (2.5%). The results demonstrated that 36.5% of inequality in dental care utilization was explained by the variables included in the study, withresidual contribution of 64.5%.
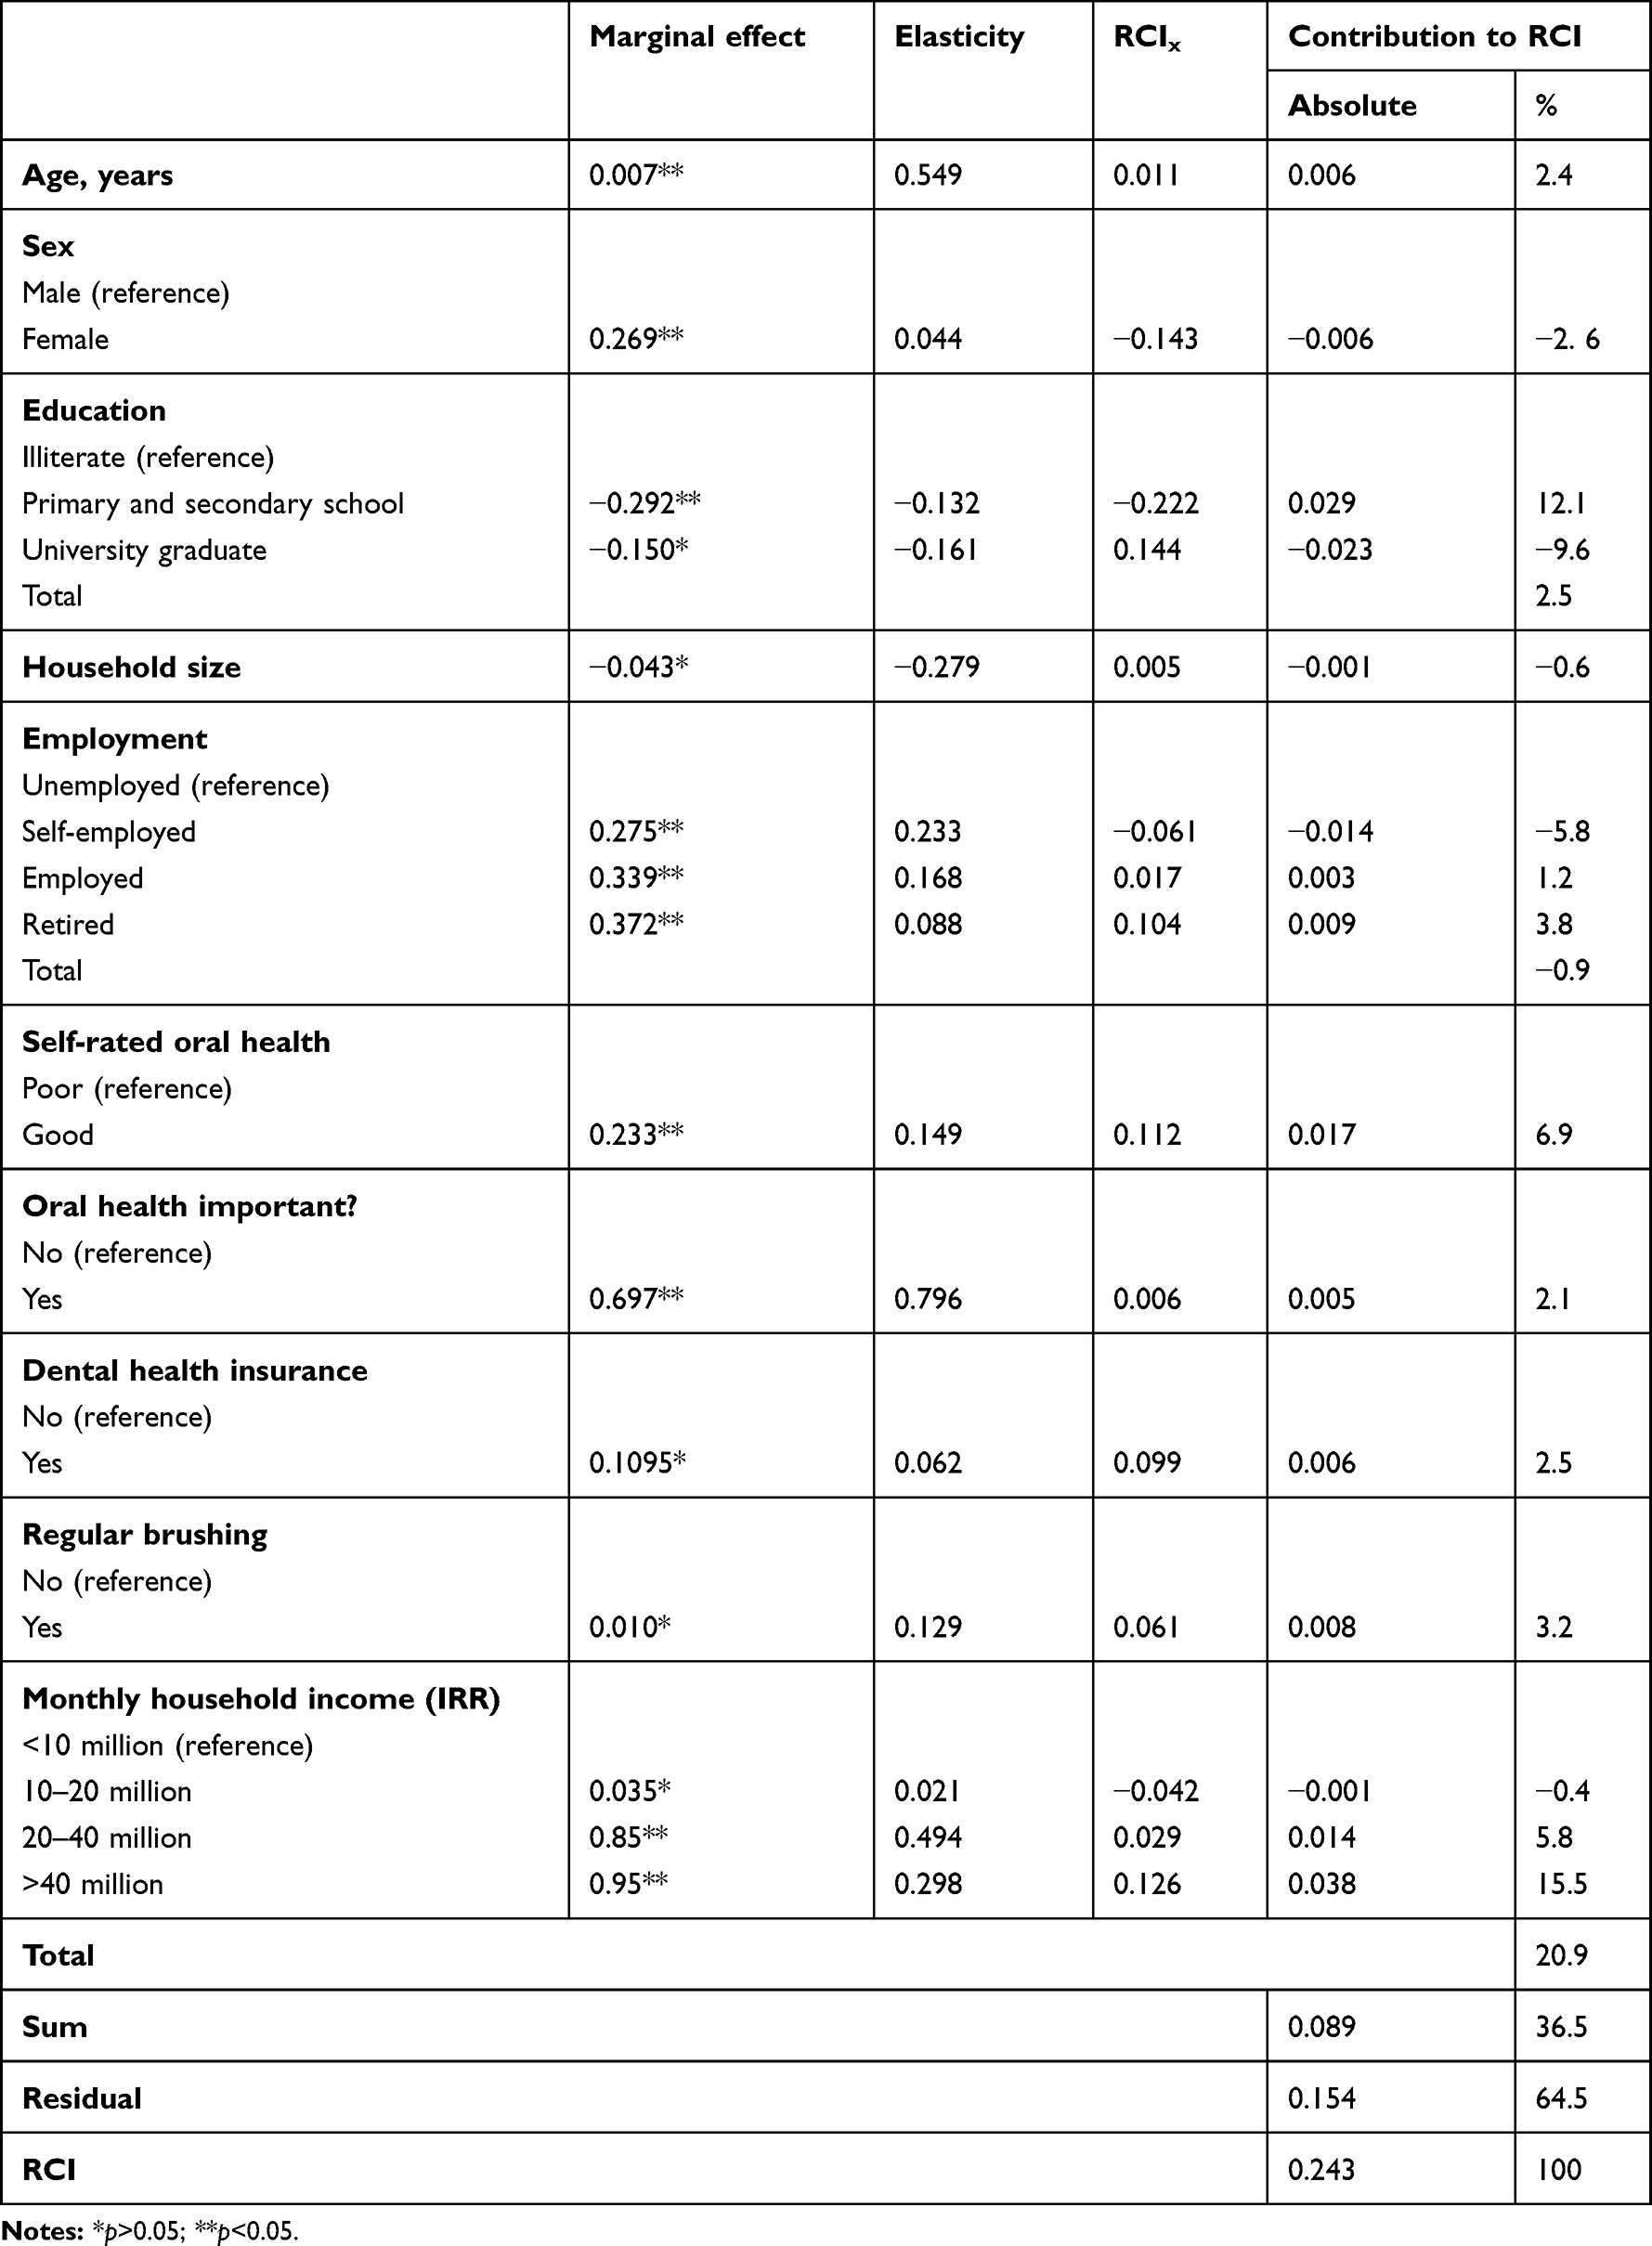 |
Table 4 Decomposition Analysis of Socioeconomic Inequality in Dental Care Utilization |
Discussion
The role of socioeconomic factors in determining inequality in access to and utilization of dental services, especially in developing countries, is of particular importance. In these countries, the distribution of oral health is not equal, because of differences in socioeconomic position of the populations, and people with low socioeconomic statusare more likely to have poorer oral health outcomes.30,31 Socioeconomically disadvantaged people typically have less access to dental care services, despite greater need among them. In this study, we used the decomposition technique to analyze socioeconomic-related inequalities in dental care utilization in Ardabil, northwest Iran.
The average regularity of dentist visits in this study was lower than in developed countries and similar to developing countries. The regularity of dentist visits during the last 12 months is different in different countries based on their development level. For example, in developing countries like Brazil and South Africa, about 49% and 55% reported at least one dentist visit in the last year.4,32 On the other hand, about 81% reported at least one dentist visit in the UK.5 More than half thehouseholds reported a dentist visit in the last year by family members in this study, which is similar to previous studies from Iran. Rezaei et al showed that more than half of Iranian families had at least one dentist visit in the last year of the survey.1
The cost of dental services for a majority of the households in this study was high. Dental service costs can increase out-of-pocket8 costs of households, which can result in households facing higher catastrophic health-care expenditure (CHE). As a result, there could be increasing inequality in dental care service utilization. In other words, poorer people would have less opportunity for regular dental checkups and other services. A study on 89 countries showed that 3% in low-income, 1.8% in middle-income, and 0.6% in high-income countries faced CHE because of dental service utilization.33,34 Research from Iran has also shown that dental health expenditure leads to an increase in householdCHE.35
Our findings show that sex, education, employment status, regular brushing, self-rated oral health, and average household income were significantly related to dental care utilization. Female sex, poor education, being retired, lack of oral health care, lack of dental care insurance, and low income decreased the probability of utilization of dental services. Significant associations between education,15,16 job status, and oral health status with inequality of dental service utilization have been found in earlier studies, where higher education, employment, and good oral health decreased inequality in dental care utilization.1,5,26,36–39
In this study, we found that the probability of of dentist visits was higher among households with dental insurance than those without insurance. Dental insurance usually increases utilization, and we identified that households with dental service insurance utilized dental services twice as much as uninsured households. Previous studies revealed that having dental service insurance results in increasing access to dental care providers, specialists, and specialized dental services.1,40 In the US, utilization of dental services decreased during 2007–2009 among those in the lowest-income group due to a decline in insurance coverage for dental care services.16 Rad et al showed that being covered by insurance increased the probability of dental care utilization in urban areas of Iran.41 The explanation is that households spend less of their budget on dental care services when they have insurance. As such, the utilization of dental care services increases due to reduction in cost to access these services.42,43
Our findings suggest that inequalities in dentist-visit probability in the past 12 months and 6-monthly checkups were biased in favor of therich. This implies that richer households utilized dental care service more than poorer households and routine checkups were more concentrated among wealthier households. On the other hand, the distribution of unmet need for dental care services was concentrated among worse-off households. These results indicate that dental care–service utilization did not match the need for dental care, due to differences in socioeconomic status. Analysis of the decomposition results revealed that household income was the most important determinant of prorich inequality in the use of dental services. Higher utilization among richer households indicates stronger association of income with dental service utilization.1,9,40 Due to higher income, households can afford to seek services from from private dentists. Our findings follow the results ofstudies from other countries. For example, the use of dental services was distributed according to income and was prorich in Finland, where a majority of households received dental services from the private sector.44 One of the main reasons for lower utilization among low-income households could be the high cost of dental services and low ability to pay for these services.14 The main reason for poor families not utilizing dental services is their lack of awareness about dental health and related services and their preference to utilizee services only in times of extreme need.13
Studying inequality in the utilization of dental care services is complex when using survey data from a limited a sample from a specific area. As such, there are several limitations to our study. We cannot interpret the findings as causal, due to the cross-sectional study design. Another limitation is that the data on dental care utilization were self-reported. Therefore, there might be the problem of recall bias in our study compared to studies using registered data from dental centers. We conducted this study among households in a northwest province of Iran. This could limit the generalizability of of our results to other population groups. Moreover, we could not collect data on some some important determinants of dental care, such as quality of dental services, oral health status in terms of the DMF (decayed, missed, and filled teeth) index,and fear of pain. This limitation might have influenced the findings of the study. Therefore, it is suggested that these factors be considered in future studies on determinants of inequality in dental care utilization.
Conclusion
Our study revealed that inequality in the utilization of dental care in northwest Iran was prorich and that household income was the main driver of this prorich inequality. We also found that the sex and age of the household head, education, self-assessment of oral health, ranking of importance of oral health as per other organs, dental care insurance, and regular toothbrushing were other factors explaining the observed inequality in dental care favoring the well-off. Since income and insurance were found to be the most important factors in dental care utilization, policy-makers in developing countries may consider increasing dental service–insurance coverage among poorer people to increase utilization of dental care services. Intervention targeting socioeconomically disadvantaged communities with the highest dental needs could be also implemented in these countries. These policies could help in reducing the gap between poor and rich to access needed dental care services.
Funding
The study was supported and funded by the Deputy of Research, Ardabil University of Medical Sciences.
Disclosure
The authors declare that there is no conflict of interest.
References
1. Rezaei S, Woldemichael A, Zandian H, Homaie Rad E, Veisi N, Karami Matin B. Dental health‐care service utilisation and its determinants in West Iran: a cross‐sectional study. Int Dent J. 2018;68(3):176–182. doi:10.1111/idj.12346
2. Cohen-Carneiro F, Souza-Santos R, Rebelo MAB. Quality of life related to oral health: contribution from social factors. Cien Saude Colet. 2011;16:1007–1015. doi:10.1590/S1413-81232011000700033
3. Sheiham A. Oral Health, General Health and Quality of Life. SciELO Public Health; 2005.
4. Monteiro CN, Beenackers MA, Goldbaum M, et al. Socioeconomic inequalities in dental health services in Sao Paulo, Brazil, 2003–2008. BMC Health Serv Res. 2016;16(1):683. doi:10.1186/s12913-016-1928-y
5. Tchicaya A, Lorentz N. Socioeconomic inequalities in the non-use of dental care in Europe. Int J Equity Health. 2014;13(1):7. doi:10.1186/1475-9276-13-7
6. Rezaei S, Ghahramani E, Hajizadeh M, Nouri B, Bayazidi S, Khezrnezhad F. Dental care utilization in the west of Iran: a cross-sectional analysis of socioeconomic determinants. Int J Hum Rights. 2016;9(4):235–241. doi:10.1108/IJHRH-06-2016-0008
7. Tseveenjav B, Vehkalahti M, Murtomaa H. Oral health and its determinants among Mongolian dentists. Acta Odontol Scand. 2004;62(1):1–6. doi:10.1080/00016350310008003
8. De Looper M, Lafortune G. Measuring Disparities in Health Status and in Access and Use of Health Care in OECD Countries. OECD; 2009.
9. Van Doorslaer E, Masseria C. Income-Related Inequality in the Use of Medical Care in 21 OECD Countries. Paris: OECD; 2004.
10. Sheiham A. Adult oral health and attitudes to dentistry in New Zealand, 1976. J N Z Soc Periodontol. 1980;(50):17–18.
11. Brown R, Treasure E. Inequities in oral health: implications for the delivery of care and health promotion. N Z Dent J. 1992;88(394):132–138.
12. Thomson W, Poulton R, Milne B, Caspi A, Broughton J, Ayers K. Socioeconomic inequalities in oral health in childhood and adulthood in a birth cohort. Community Dent Oral Epidemiol. 2004;32(5):345–353. doi:10.1111/j.1600-0528.2004.00173.x
13. Listl S, Moeller J, Manski R. A multi‐country comparison of reasons for dental non‐attendance. Eur J Oral Sci. 2014;122(1):62–69. doi:10.1111/eos.12096
14. Widström E, Seppälä T. Willingness and ability to pay for unexpected dental expenses by Finnish adults. BMC Oral Health. 2012;12(1):35. doi:10.1186/1472-6831-12-35
15. Gaskin DJ, Dinwiddie GY, Chan KS, McCleary R. Residential segregation and disparities in health care services utilization. Med Care Res Rev. 2012;69(2):158–175. doi:10.1177/1077558711420263
16. Wall TP, Vujicic M, Nasseh K. Recent trends in the utilization of dental care in the United States. J Dent Educ. 2012;76(8):1020–1027.
17. Listl S. Income-related inequalities in dental service utilization by Europeans aged 50+. J Dent Res. 2011;90(6):717–723. doi:10.1177/0022034511399907
18. Andersen R, Newman JF. Societal and individual determinants of medical care utilization in the United States. Milbank Q. 2005;83(4):
19. Palència L, Espelt A, Cornejo‐Ovalle M, Borrell C. Socioeconomic inequalities in the use of dental care services in Europe: what is the role of public coverage? Community Dent Oral Epidemiol. 2014;42(2):97–105. doi:10.1111/cdoe.12056
20. Lo E, Lin H, Wang Z, Wong M, Schwarz E. Utilization of dental services in Southern China. J Dent Res. 2001;80(5):1471–1474. doi:10.1177/00220345010800051701
21. Guiney H, Woods N, Whelton HP, Morgan K. Predictors of utilisation of dental care services in a nationally representative sample of adults. Community Dent Health. 2011;28(4):269–273.
22. Rezaei S, Hajizadeh M, Irandoost SF, Salimi Y. Socioeconomic inequality in dental care utilization in Iran: a decomposition approach. Int J Equity Health. 2019;18(1):161. doi:10.1186/s12939-019-1072-5
23. Sistani MMN, Virtanen JI, Yazdani R, Murtomaa H. Association of oral health behavior and the use of dental services with oral health literacy among adults in Tehran, Iran. Eur J Dent. 2017;11(2):162. doi:10.4103/ejd.ejd_332_16
24. Ghaderi H, Jamshidi RA, Ghorbani A. Estimation of dental services demand function of family in Sabzevar, Iran, in the urban area: 2007. J Health Adm. 2010;13(40):12–79.
25. Wagstaff A, Paci P, Van Doorslaer E. On the measurement of inequalities in health. Soc Sci Med. 1991;33(5):545–557. doi:10.1016/0277-9536(91)90212-U
26. Hosseinpoor A, Itani L, Petersen P. Socio-economic inequality in oral healthcare coverage: results from the World Health Survey. J Dent Res. 2012;91(3):275–281. doi:10.1177/0022034511432341
27. Pulok MH, van Gool K, Hajizadeh M, Allin S, Hall J. Measuring horizontal inequity in healthcare utilisation: A review of methodological developments and debates. Eur J Health Econ. 2020;21(2):171–180. doi:10.1007/s10198-019-01118-2
28. Wagstaff A. The concentration index of a binary outcome revisited. Health Econ. 2011;20(10):1155–1160. doi:10.1002/hec.1752
29. Wagstaff A, Doorslaer VE, Watanabe N. On Decomposing the Causes of Health Sector Inequalities with an Application to Malnutrition Inequalities in Vietnam. The World Bank; 2001.
30. Petersen PE, Kwan S. Equity, social determinants and public health programmes–the case of oral health. Community Dent Oral Epidemiol. 2011;39(6):481–487. doi:10.1111/j.1600-0528.2011.00623.x
31. Marmot M, Bell R. Social determinants and dental health. Adv Dent Res. 2011;23(2):201–206. doi:10.1177/0022034511402079
32. Ayo-Yusuf I, Ayo-Yusuf O, Olutola B. Health insurance, socio-economic position and racial disparities in preventive dental visits in South Africa. Int J Environ Res Public Health. 2013;10(1):178–191. doi:10.3390/ijerph10010178
33. Xu K, Evans DB, Carrin G, Aguilar-Rivera AM, Musgrove P, Evans T. Protecting households from catastrophic health spending. Health Aff. 2007;26(4):972–983. doi:10.1377/hlthaff.26.4.972
34. Masood M, Sheiham A, Bernabé E. Household expenditure for dental care in low and middle income countries. PLoS One. 2015;10(4):e0123075. doi:10.1371/journal.pone.0123075
35. Kavosi Z, Rashidian A, Pourreza A, et al. Inequality in household catastrophic health care expenditure in a low-income society of Iran. Health Policy Plan. 2012;27(7):613–623. doi:10.1093/heapol/czs001
36. Slack-Smith L, Hyndman J. The relationship between demographic and health-related factors on dental service attendance by older Australians. Br Dent J. 2004;197(4):193. doi:10.1038/sj.bdj.4811571
37. Molarius A, Engström S, Flink H, Simonsson B, Tegelberg Å. Socioeconomic differences in self-rated oral health and dental care utilisation after the dental care reform in 2008 in Sweden. BMC Oral Health. 2014;14(1):134. doi:10.1186/1472-6831-14-134
38. Sanders AE, Spencer AJ, Slade GD. Evaluating the role of dental behaviour in oral health inequalities. Community Dent Oral Epidemiol. 2006;34(1):71–79. doi:10.1111/j.1600-0528.2006.00261.x
39. Pizarro V, Ferrer M, Domingo‐Salvany A, et al. The utilization of dental care services according to health insurance coverage in Catalonia (Spain). Community Dent Oral Epidemiol. 2009;37(1):78–84. doi:10.1111/j.1600-0528.2008.00439.x
40. Souza JGS, Sampaio AA, Costa Oliveira BE, Jones KM, Martins AMEDBL. Socioeconomic inequalities in the use of dental care services during early childhood: an epidemiological survey. Int J Paediatr Dent. 2018;28(4):400–409. doi:10.1111/ipd.12368
41. Rad EH, Kavosi Z, Arefnezhad M. Economic inequalities in dental care utilizations in Iran: evidence from an urban region. Med J Islam Repub Iran. 2016;30:383.
42. Hole AR, Kolstad JR. Mixed logit estimation of willingness to pay distributions: a comparison of models in preference and WTP space using data from a health-related choice experiment. Empir Econ. 2012;42(2):445–469. doi:10.1007/s00181-011-0500-1
43. Tambor M, Pavlova M, Rechel B, Golinowska S, Sowada C, Groot W. Willingness to pay for publicly financed health care services in Central and Eastern Europe: evidence from six countries based on a contingent valuation method. Soc Sci Med. 2014;116:193–201. doi:10.1016/j.socscimed.2014.07.009
44. Raittio E, Kiiskinen U, Helminen S, Aromaa A, Suominen AL. Income‐related inequality and inequity in the use of dental services in F inland after a major subsidization reform. Community Dent Oral Epidemiol. 2015;43(3):240–254. doi:10.1111/cdoe.12148
 © 2020 The Author(s). This work is published and licensed by Dove Medical Press Limited. The
full terms of this license are available at https://www.dovepress.com/terms
and incorporate the Creative Commons Attribution
- Non Commercial (unported, 3.0) License.
By accessing the work you hereby accept the Terms. Non-commercial uses of the work are permitted
without any further permission from Dove Medical Press Limited, provided the work is properly
attributed. For permission for commercial use of this work, please see paragraphs 4.2 and 5 of our Terms.
© 2020 The Author(s). This work is published and licensed by Dove Medical Press Limited. The
full terms of this license are available at https://www.dovepress.com/terms
and incorporate the Creative Commons Attribution
- Non Commercial (unported, 3.0) License.
By accessing the work you hereby accept the Terms. Non-commercial uses of the work are permitted
without any further permission from Dove Medical Press Limited, provided the work is properly
attributed. For permission for commercial use of this work, please see paragraphs 4.2 and 5 of our Terms.