Back to Journals » Risk Management and Healthcare Policy » Volume 16
Socioeconomic and Behavioral Determinants of Cardiovascular Risk in Russia: A Structural Equation Modeling Approach
Authors Kaneva M ![]() , Jakovljevic M
, Jakovljevic M ![]()
Received 15 September 2022
Accepted for publication 25 March 2023
Published 6 April 2023 Volume 2023:16 Pages 585—605
DOI https://doi.org/10.2147/RMHP.S388873
Checked for plagiarism Yes
Review by Single anonymous peer review
Peer reviewer comments 2
Editor who approved publication: Professor Mecit Can Emre Simsekler
Maria Kaneva,1,* Mihajlo Jakovljevic2– 4,*
1Institute of Economics and Industrial Engineering of the Siberian Branch of the Russian Academy of Sciences, Novosibirsk, Russia; 2Institute of Advanced Manufacturing Technologies Peter the Great St. Petersburg Polytechnic University, Saint Petersburg, Russia; 3Institute of Comparative Economic Studies, Hosei University Faculty of Economics, Tokyo, Japan; 4Department of Global Health Economics and Policy, University of Kragujevac, Kragujevac, Serbia
*These authors contributed equally to this work
Correspondence: Maria Kaneva, Institute of Economics and Industrial Engineering of the Siberian Branch of the RAS, 17 Academician Lavrentiev Avenue, office 373, Novosibirsk, Russia, Tel +7 993 028 8421, Email [email protected]
Purpose: Despite much attention within the literature, the multiple risk factors associated with CVD mortality in Russia are still not fully understood. Drawing on the Health Belief Model as a theoretical framework, we aim to elicit socioeconomic and behavioral determinants of cardiovascular risks in Russian men and women.
Methods: Using the Know Your Heart project data, we utilize regression analysis and then structural equation modeling (latent class analysis and mediation analysis) to study the determinants of CVD risks.
Results: OLS and ordered logit regressions show that the key factors defining cardiovascular health behaviors in Russia are health-related actions to reduce the perceived threat of diseases (physical activity and GP visits), perceived barriers to behavioral change (financial constraints), and cues to action (awareness of the federal health check-up program). The latent class analysis further identifies three distinct groups of the population with different CVD risk levels. Over one-third of respondents belong to the “high CVD risk” class characterized by the highest share of smokers and alcohol abusers who evade contact with primary care and face financial constraints. In the mediation analysis, we find that employment mediates the relationship between physical activity and CVD risks: physically active individuals have a greater chance of employment, and employment further mitigates CVD risks. We also find an indication of the selection of the healthy into employment in the causal relationship between GP visits, having a job, and CVD risks.
Conclusion: A corresponding set of policy actions stem from these findings. These include reinforcing the change of perceptions of CVD risks and lowering barriers to health care; raising awareness of the free preventive check-up program in the “high CVD risk” group; making sports and exercise accessible to the elderly; and using off-putting labels on alcohol products as behavioral nudges among “physically active but drinking” males.
Keywords: Health Belief Model, cardiovascular risks, health behaviors, structural equation modeling, Russia
Introduction
Cardiovascular mortality remains the leading cause of death in Russia.1 Mortality from cardiovascular diseases (CVD) is exceptionally high compared to the European average (55.7% vs 46%).2 This means that in Russia, every hour, seven people die of myocardial infarction,3 and every third fifteen-year-old boy will only live to the age of 60.4
Several large-scale cohort studies were carried out in Russia in the last four decades. Examples are international projects such as the Monitoring trends and determinants in cardiovascular disease (MONICA) WHO Study in Novosibirsk (1984–1995),5 the Health, Alcohol and Psychosocial factors In Eastern Europe (HAPIEE) study in Eastern Europe (2002–2008),6 the Know Your Heart Project (2015–2018),7 and the Epidemiology of CVDs and Their Risk Factors in the Russian Regions (ESSE-RF) study in Russian regions (2012–2017).8 However, despite continuous research efforts, the multiple risk factors of CVD mortality in Russia are still not fully understood.
Across projects and datasets, the consensus concerning the vital role of socioeconomic and behavioral characteristics for cardiovascular risks has been reached. Educational inequalities,5,9 financial hardship,10 and material deprivation11,12 were shown to explain the temporal changes and differences between subgroups of the population. Research into behavioral determinants and lifestyle factors of CVD risks yielded results similar to other countries, putting smoking, diet,13 physical activity,14 alcohol,1 untreated hypertension,15 and primary care visits16 at the center of the debate. A scoping review of phycological and social CVD risk factors in Russia added marital status and occupation to the important determinants of CVD health.17 However, with few exceptions,1 the methods employed were limited to regression analysis and bivariate associations. Additionally, to our knowledge, only a handful of studies adopted a theoretical framework to analyze health beliefs and their relationship to cardiovascular health. These were the health locus of control18 and the social causation (not a study on Russia)19 models.
Russian cardiovascular morbidity and mortality landscape is largely comparable to other leading emerging markets.20 Among the plausible solutions to resolve the cardiovascular challenge is introduction of the “best buy” concept by the World Health Organization (WHO) to scale up the core intervention package against non-communicable chronic diseases (NCDs) targeted for low- and middle-income (LMIC) countries.21 It should substantially affect the entire health spending dynamics as we approach 2030.22,23
Our paper aims to analyze multiple socioeconomic and behavioral cardiovascular risk factors of the Russian population and the links between them. Based on these factors, we also aim to elicit different (latent) classes of respondents with different CVD risk levels among the Russian population and formulate policy recommendations on mitigating the risks.
We believe that until recently a comprehensive analysis of the multiple cardiovascular risk factors and the causal mechanisms between them remained difficult for a number of reasons. First, exploring a set of socioeconomic, behavioral, and lifestyle CVD risk factors in a single econometric model implied potential multicollinearity between the covariates in the proposed equation. Second, it was problematic, if not impossible, to employ a single estimation method that would encompass a wide array of models linked together by a single study objective. Third, the computational method that accounted for paths and causal links between various risk factors was not readily available. In this study, we overcome these difficulties by a) employing a theoretical framework called the Health Belief Model (HBM); and b) adopting a structural equation modeling (SEM) approach to elicit the socioeconomic and behavioral cardiovascular risk factors and the causal paths between them. By adopting the SEM framework and employing the notion of latent variables, we are able to conduct latent class analysis to determine population classes with different CVD risk levels. We are also able to apply the mediation analysis to estimate the effect of employment status and financial constraints on health behaviors. These types of analysis go beyond the regression and ANOVA methodologies common for studies on CVD risks.
We put forward the following three empirically testable hypotheses for this study:
Hypothesis 1. The link between cardiovascular risks and socioeconomic and behavioral characteristics in Russia can be better understood through estimating the components of the Health Belief Model. These components are: “perceived threat”, “perceived barriers” and “cues to action”. Hypothesis 2. There are distinct subgroups of low, moderate, and high levels of CVD risk that can be predicted by a set of socioeconomic and behavioral risk factors. These behavioral factors correspond to the perceived threat of cardiovascular diseases and the triggers for change in health behaviors (“cues to action”). Hypothesis 3. There are underlying causal mechanisms between different components of the Health Belief Model. One such causal pathway is between a) employment status and/or b) financial status, lifestyle factors, and CVD risk level in Russia.
Materials and Methods
Research Design
This is a cross-sectional study that employs regression analysis and structural equation modeling approach for latent class and mediation analysis. As such, no causality in the regression models can be assumed. However, mediation analysis, which is part of SEM, is causal by design24 and allows to test causality in Hypothesis 3.
The Health Belief Model
Our testable hypotheses 1–3 are based on the Health Belief Model. We describe the model and our adaptation in this section of the study.
Since its development in the 1950s by a group of American psychologists from the US Public Health Service,25 the HBM became the most widely used theory to interpret health behaviors. The model was an attempt to understand the failure of the population to accept disease preventive measures for asymptomatic diseases.26 The model posits that the change in health behaviors can be explained by considering the various components or constructs. Originally the models contained the following elements:
- the individual subjective state of readiness to take a health-related action defined by “perceived susceptibility” to a particular illness and its “perceived severity” (jointly representing “perceived threat”);
- individual evaluation of the feasibility and efficaciousness of the proposed behavioral change and weighting “perceived benefits” against “the perceived barriers” (financial, physical, or psychological);
- “cues to action” that must occur to trigger the behavioral change.27
Later, the self-efficacy component28 was added to the model as the individual perception of the competence in order to perform the behavioral change successfully.
We believe that the HBM offers an appropriate framework for classifying, analyzing, and eliciting the various socioeconomic and behavioral determinants of cardiovascular risks in Russia. These determinants define behaviors that individuals take toward their cardiovascular health. Historically, the perceptions, beliefs, and actions, which make up the HBM, have been demonstrated to be alterable,29 thus making the model applicable to different settings. For our setting, with a focus on CVD risks, we make several alterations.
First, we internalize the cues to action and make them direct causes of health action. As we demonstrate below, we do this because the data we use in the study presents a patient’s reflection of the received cues to action. We also have data on the individual awareness of the preventive check-up program offered free of charge to the Russian population in the public healthcare sector (called “dispanserisation”),30 which could be a potential trigger for taking part in the check-ups. Second, as prior research demonstrated, in the context of CVD, the same set of predictors characterizes the models for the perceived threat and benefits components. For example, a dummy for being on a diet can indicate either an additional benefit from behavioral change to mitigate CVD risk or might reflect a response to the perceived threat to cardiovascular health.31 Realizing this, we decided not to model the “perceived benefits” component. Third, although we estimated the self-efficacy component, we did not find a statistically significant association between self-efficacy and CVD risks, so this model dimension is not discussed in this study. Figure 1 depicts our adaptation of the HBM.
 |
Figure 1 Health Behavior Model for understanding of socioeconomic and behavioral determinants of cardiovascular risks in Russia. Notes: the following adaptations were made to the original HBM model: 1) cues to actions were internalized; 2) same set of predictors characterized perceived benefits and threats; 3) self-efficacy component was not discussed in the study. |
Prior research has shown that the individual-level constructs drawn from the HBM are among the most reliable determinants of various health behaviors (see, for example),32,33 and can be associated with latent groups with distinct differences in health behaviors. Following this stream of research, we posit that such groups may exist among the population who are exposed to cardiovascular risks.
The HBM is also a starting point for thinking about the causal mechanism and complex paths between various determinants of cardiovascular risks. While the cross-sectional regressions are not causal, causal relationships and their interpretations are part of SEM. Noar & Zimmerman27 point out that relationships between various model constructs in HBM and causal mechanisms between the variables defining constructs have been tested using a structural equation modeling (SEM) approach (see, for example, Kim34 for the analysis of college students’ health behavior). In this spirit, this study also employs the SEM approach to analyze the causal relationship between employment status influencing health behaviors and health behaviors affecting employment status via the mediation analysis.
Data
This study utilizes the data from the “Know Your Heart Project” (KHY), an international project on cardiovascular disease in Russia.7 The project collected demographic, socioeconomic, and CVD risk factors in two Russian cities – Novosibirsk and Arkhangelsk – between 2015–2018 from 4504 men and women void of any self-reported history of CVD (myocardial infarction, atrial fibrillation, angina, stroke, and heart failure). The original sample size was determined based on the statistical power needed to compare KHY with other CVD health studies (primarily with Tromsó 7 study from Norway) and to investigate statistical associations of interest within the KHY database. The cities were chosen because they had previous experience of conducting large epidemiological surveys.7 Within each city, four districts were chosen not randomly but purposefully to represent a range of socio-demographic and mortality levels in each city. Then a random sample of addresses where a person aged 35–69 years lived were taken from the population list. The sample was stratified by age, sex, and district. In addition to answering questions from the questionnaire, participants were invited to a health check at a polyclinic for detailed measurement of cardiovascular phenotype. All participants provided a blood sample, and a subset of participants provided urine and faecal samples. As we are utilizing a Systematic Coronary Risk Evaluation (SCORE) methodology that only applies to individuals over the age of 40, the KHY sample is reduced to 2752 respondents.
Table S1 presents descriptive statistics for the variables used in the empirical analysis. As expected for this age group, the sample is majority (57%) female and married (70%). Despite the fact that 64% are in regular employment, many Russians remain financially constrained, and, in these data, 18% of the sample cannot afford food or clothing, and 12% report having had a major financial crisis in the last six months.
Twenty-six percent of the sample smokes; 2.7% drink alcohol every day or almost every day. Concerning healthcare utilization, the average number of visits to general practitioners over the last year is 1.1 with a maximum value of 5, to cardiologists in an outpatient clinic — 0.2 (maximum 5), in a hospital — 0.06 (5). About 8% of respondents complain of pain limiting their work activity. Noteworthy is the high proportion of respondents who reported vigorous physical activity that caused perspiration or faster heartbeat (47%). 80% of the respondents are aware of the preventive check-up program.
Calculation of the 10-Year CVD Risk Scores
We apply the SCORE methodology to calculate a CVD risk score, the primary variable of interest in this study. SCORE calculates the 10-year risk of a fatal CVD event.35 The methodology is based on the risk charts for 12 European countries, including Russia, and the risk functions estimated as Weibull proportional hazard models.36 Sex, age, a dummy for smoking, systolic blood pressure, and cholesterol level are used to calculate risk scores. The detailed methodology, along with the coefficients for the survival probability functions and weights for different risk factors, is presented in Conroy et al (2003). The Stata code for calculation of the 10-year CVD risk SCOREs was kindly shared by Dr. Jakob Petersen (QMUL).35
We create two variables for our analysis. Risk10 is an index from 0 to 100%. It estimates the 10-year probability of dying from a fatal cardiovascular disease. We can then divide Risk10 into three risk groups: high (5+%), moderate (1–4.9%), and low risk (<1%)37 and create a categorical variable h_cvdrisk with three categories (1=low; 2=moderate; 3=high risk) corresponding to the three risk groups. Figure 2 presents histograms for the distributions of the dependent variables.
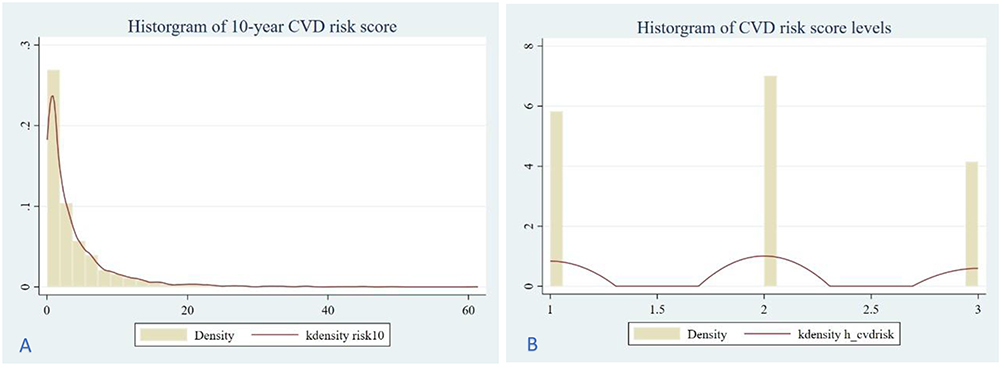 |
Figure 2 Histograms of the dependent variables in the regression analysis ((A)=risk10, (B)=h_cvdrisk). |
Regression Analysis
To model CVD risks, we run two types of econometric models. The first type of model is the cross-sectional ordinary least squares (OLS) model for risk10 as a dependent variable.
The second type of model exploits the categorical nature of the data. Our observed variable h_cvdrisk has three categories, M=1…3. The ordered logit model can be written as:
where kj are the threshold between the categories, j=1,2,38 and β is the vector of coefficients to be estimated.
The model is based on the proportional odds assumption that the relationship between each pair of categories is the same. Although a few variables in our dataset fail the Brant test,38 we estimate the ordered logit as a more parsimonious model than the generalized ordered logit regression.
For each of the three dimensions of the HBM (perceived threat, perceived barriers, and cues to action), we build OLS and ordered logit models. Modeling dimensions separately allows mitigating multicollinearity between different covariates of CVD risks and finding statistically significant associations between factors that characterize different components and CVD risks. Recognizing long-standing differences in health behaviors and cardiovascular mortality and morbidity among men and women in Russia,7,12,39 we estimate separate specifications for each sex.
Structural Equation Modeling Approach
Beyond the regression analysis, the study adopts the structural equation modeling approach. SEM is a class of methodologies that “seek to represent hypotheses regarding the means, the variances, and covariances of observed data in terms of a smaller number of ‘structural parameters’ defined by a hypothesized underlying conceptual or theoretical model”.40
SEM is a very powerful multivariate technique. It has advantages beyond the traditional regression and ANOVA analyses – it can test models with multiple dependent variables, model mediating variables, and handle difficult data (multi-level, non-normal, etc.). In addition, SEM has an attractive graphical interface that can visualize and estimate different paths between independent and dependent variables.
What makes SEM unique is using unobserved latent variables. SEM gives researchers a way to represent theories as models using latent variables that are not directly measured. This is easy to do and is a major benefit of SEM because many key constructs in the behavioral sciences simply cannot be directly observed and measured.41
A great computational advantage of SEM is that calculation of all parameters and statistical tests occur simultaneously, where the errors throughout the model are calculated using all information from the model. This means the errors are more accurate than if we were to estimate each part of the model separately.
In this research, we utilize the advantages of the SEM framework by employing latent variables for latent class analysis and building a set of mediation models. Therefore, the main advantage of the SEM approach for this research is twofold: a) it can fit any type of response for different paths between CVD risk factors and is computationally advanced; but more importantly, b) it provides the opportunity to unify two independent types of analysis under a single empirical framework and relate their results to one another. The latter is essential for developing a corresponding set of policy actions for mitigating CVD risks.
Latent Class Analysis
Latent class analysis (LCA) is part of the structural equation modeling framework in this study. It aims to identify shared characteristics of the population’s health behaviors related to cardiovascular risks. We use the LCA to identify lifestyle classes as “healthy” or “unhealthy” and associate them with higher or lower CVD risk scores. Identifying the clustered patterns of modifiable behavioral characteristics allows targeting preventive interventions and formulating policy recommendations for reducing CVD risk in the Russian population.
LCA assumes that the studied population is heterogeneous and can be divided into subgroups (or latent classes) of individuals. There are two principal types of variables: the indicator variables and the latent class variables. While the latent class variables are not directly observed, the observed indicator variables are presumed to be influenced by the latent class variables.42 Two types of variables correspond to the two types of models: the measurement and structural models. The measurement model specifies the latent class and distributions of the indicator variables specific to this class. The structural model defines the relationship between predictors and latent class variables and provides information on the distribution of classes within the studied population.42 Another variable that can be added to the analysis is the predictor of class membership.43
The central assumption of the analysis is that the relationship between the observed indicator variables is “explained” by the latent variable and that, given the class membership, these variables are locally (or conditionally) independent.42 The assumption implies that the latent class membership explains all the associations between the indicator variables.
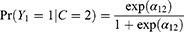
In the basic form of the model, we assume that we have three binary indicators Y1Y2 and Y3, and one latent variable C with two classes (С = 1, С = 2). The parameters in the latent class analysis are the intercepts α in the logistic model that are allowed to vary between classes.44,45
Estimated intercepts for the first class are:44
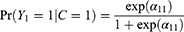
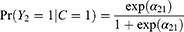

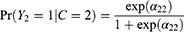
And for the second class are:

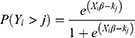
LCA also estimates the probabilities of belonging to each class using the multinomial logistic regression:
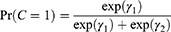
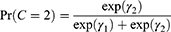
where  (k=1,2) are intercepts in the multinomial logit model. The analysis assumes that the first class is the reference, so
  =0.
=0.
LCA is estimated via maximum likelihood (MLE) and expectation-maximization (EM) algorithm.46,47 The model has to be identified; otherwise, the algorithm fails to converge.
A “good” or high-quality latent class analysis results in: a) class homogeneity; and b) class separation. When endorsement of one of the items (variables) epitomizes members in at least one of the classes, the item-class relationship is considered to be homogeneous. Class separation means that an estimated class-specific probability is low for one class and high for another class. Class proportions can be used to assign meanings to classes with the “typical class” having a marginal probability of over 50% in a population and “atypical” or “rare” having a marginal probability around or below 10%.
In LCA, it is often arduous to decide on the number of classes. Typically, the analysis starts with one or two classes, and then the number of classes increases until the model stops converging. At this point, Akaike Information Criterion (AIC) and Bayesian Information Criterion (BIC) are applied to test for the relative fit of the models with K classes and K-1 classes. The model with the smallest AIC and BIC is preferred.
The indicator variables for the measurement model are the behavioral characteristics that are shown to have significant associations with CVD risk scores in the HBM regressions. Per the LCA’s requirements, the count variable gpvis is re-coded into the binary format (see Table S1 for details). To better match the latent classes to CVD risks, we also include smoking status. Demographic and socioeconomic covariates that have statistically significant associations with the CVD risks in the econometric models are added to the model as class predictors.
Although an attractive framework for analysis, LCA is not causal by design, and the association between covariates and latent class membership cannot be interpreted as one causing another. Also, the links and possible effects between the indicators and predictors of class are not estimated in LCA. However, such effects are essential for understanding the paths between healthy and unhealthy behaviors and socioeconomic status for different CVD risk groups. This said, we turn to the mediation analysis in SEM to disentangle the complex relationship between these indicators and predictors of class. Of particular interest are the financial constraints and employment status.
Mediation Analysis
The mediation analysis aims to check whether a variable M influences the direction or strength of the relationship between the dependent variable Y and the independent variable X (Figure 3).
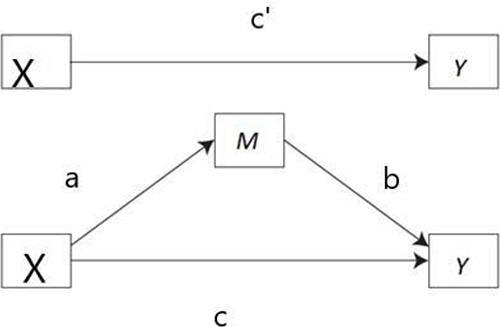 |
Figure 3 A three-variable model with the mediator M. |
To test mediation, three equations that are related to the paths a, b, and c have to be estimated.24
Regressing the mediator on the independent variable:

Regressing the dependent variable (Y) on X:

Regressing the dependent variable on both the independent variable and the mediator:

The amount of mediation is termed the indirect effect. It is equal to a*b. The effect of the independent variable X on Y is called the direct effect and is equal to c. The total effect has the following formula:

Mediation is established if three conditions hold: 1) variations in X significantly account for the variations in the presumed mediator M in the first equation (a is significant); 2) variations in M significantly account for the variations in Y (b is significant); and 3) the independent variable X affects the dependent variable Y in equation (11) (c’ is significant).24 The mediator is presumed to affect the outcome but not vice versa. Perfect mediation occurs when c is zero: the independent variable X has no effect on Y when the mediator is controlled.
Previously the Sobel test48 was applied to test the indirect effect’s significance. However, the causal step approach of Baron and Kenny24 and the Sobel test were lately replaced by methods for testing mediation that are statistically superior and make fewer assumptions of the data. Bootstrapping, a non-parametric method of resampling with replacement, has become a standard approach to estimate the standard errors (SEs) and the confidence intervals (CIs) for the indirect effect.49,50
The introduction of new methods for testing mediation and the possibility to compute direct, indirect, and total effects altered the causal step approach. It is now legitimate to claim mediation even if the total effect (c’) is not significant. Zhao et al51 introduced a decision tree for establishing the type of mediation that we follow in the analysis (Figure 4).
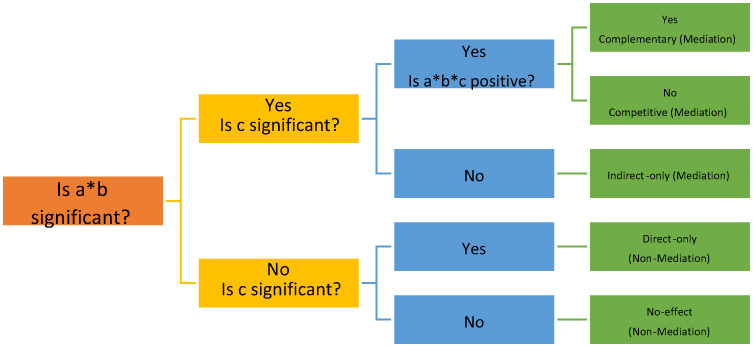 |
Figure 4 Decision tree for establishing and understanding types of mediation and nonmediation (adapted by author from Zhao et al, 2010). |
We hypothesize (Hypothesis 3) that the relationships between the CVD risks and behavioral indicators of class membership are mediated by employment status or financial constraints. Vice versa, we employ the mediation analysis to test whether behavioral characteristics can be mediators in the relationship between employment status, financial constraints, and CVD risks. Mediation analysis is a causal framework52 and allows for quantifying the effects of these complex relationships that will form the basis for policy recommendations for mitigating CVD risks. However, the assumptions for causal inference are quite strong, ie, no omitted variables, no measurement errors, no reverse causality, and no interaction effects.53
Results
Regression Models
Regression models (1–12) are cross-sectional and say little about causality. Instead, we interpret these results in terms of identifying statistically significant associations between the explanatory variables and CVD risks.
Table 1 presents the regression analysis results for the “perceived threat” component. The base covariates for all models are age, education, and marital status.
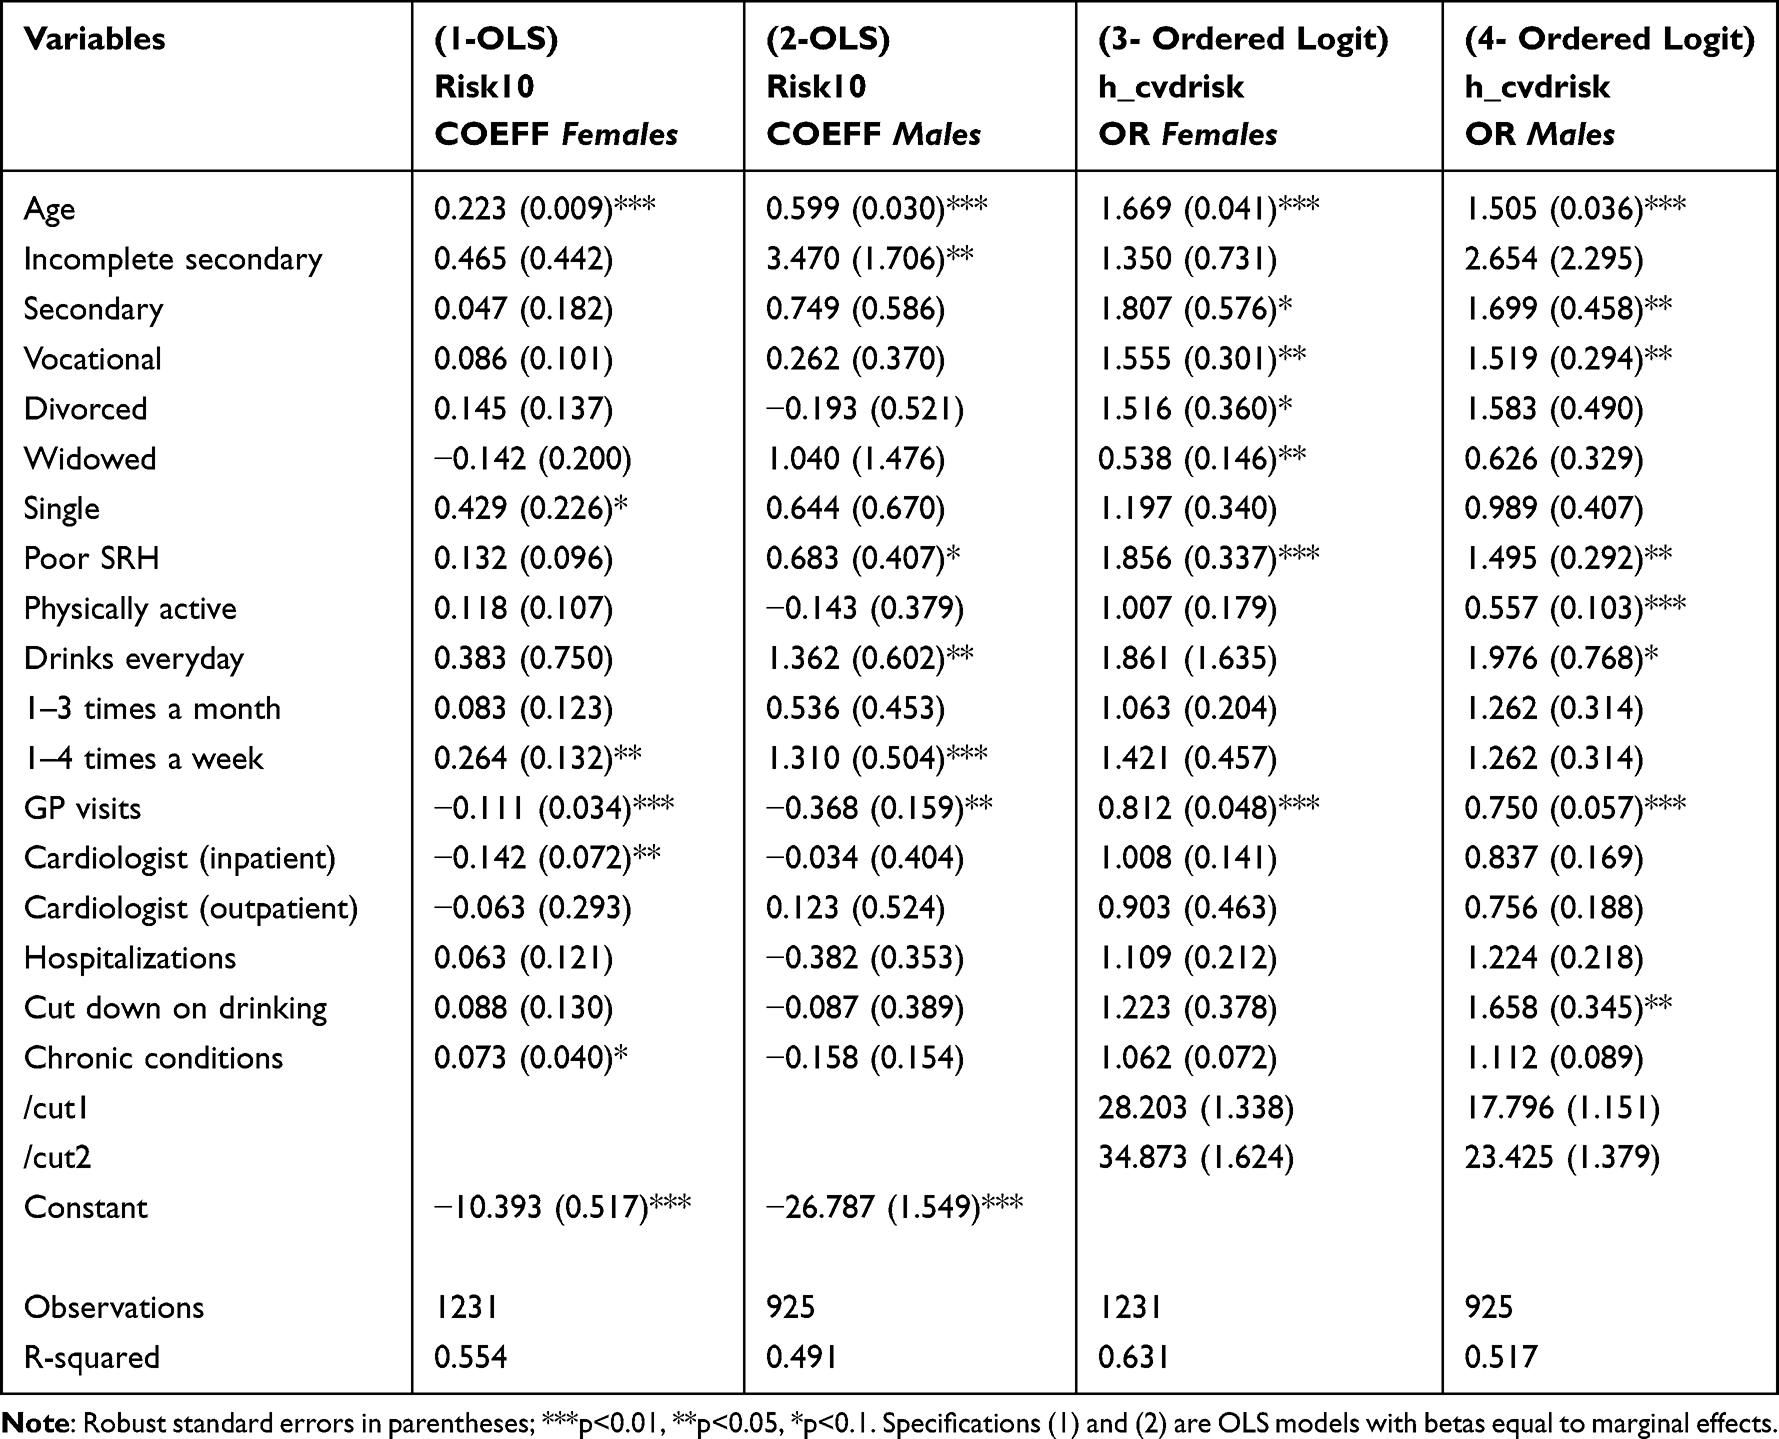 |
Table 1 OLS and Ordered Logit Regressions for CVD Risk Scores and Their Determinants in the “Perceived Threat” Component |
We include the following regressors in the perceived susceptibility component of the HBM to model CVD risks: self-reported health (SRH), physical activity, and alcohol consumption. Those who report poor SRH perceive themselves as more susceptible to developing CVDs than those who report good SRH. Individuals engaging in health risk behaviors (alcohol abuse) likely perceive the risk of CVD as low. Health-conscious individuals may perceive the physical activity as a prevention measure against cardiovascular morbidity.
HBM proposes that individuals who perceive a health problem as severe are more likely to engage in preventive behaviors.26 Therefore, multimorbidity, the number of visits to a general practitioner (GP), visits to the cardiologist in inpatient and outpatient care, and hospitalizations are included to predict “perceived severity”. Individuals are likely to try to reduce the severity of the problem. Thus, a reported opinion of the need to reduce alcohol intake can also be associated with the perceived severity.
We find that age is associated with increased CVD risk scores, and the negative effect is greater for males than for females. We also find evidence for males’ education gradient in health.54 The CVD risk score is higher by 3.47 pp for the respondents not attaining secondary and tertiary education. Single females have a greater CVD risk score with a marginal effect of 0.429, while marital status has no association with CVD risks for males.
Turning to the perceived threat characteristics, we note that reporting poor SRH is associated with increased cardiovascular risks for males in the OLS model (2) and for both sexes in the ordered logit models (3–4). Seeking care from a GP is associated with a decrease in the likelihood of fatal CVD disease in the next ten years for both men and women, but the risk reduction of a GP visit is three times greater for men (−0.368 vs −0.111). The visits to a cardiologist are associated with decreased CVD risk scores for females but not males. Similarly, multimorbidity has a statistically significant association with the CVD risk score for females only (βchron=0.073).
The models confirm the negative association of alcohol consumption and Russian men’s cardiovascular health. Drinking daily or almost daily is associated with an increase in CVD risks compared to the risk of abstainers. The negative association between alcohol and CVD risks for females is weaker; significant associations between the dummy for weekly consumption and risks in models (1–2) are not confirmed in the ordered logit specifications (3–4). Models (3) and (4) reveal statistically significant associations between physical activity in males and the risk category measured by odds ratios (OR=0.56). Also, for the respondents who feel they need to cut down on drinking, the odds of moving into a higher CVD risk category are 1.66 times greater than for those who do not feel that way.
Table 2 presents the model for “perceived barriers.” Financial constraints related to low income and lack of stable employment earnings can become significant obstacles to seeking medical care, even in the public sector (eg, transportation costs). Therefore, we use the employment status, financial difficulties, and the dummy variable for facing a major financial crisis to model financial barriers.
 |
Table 2 OLS and Ordered Logit Regressions for CVD Risk Scores and Their Determinants in the “Perceived Barriers” Component |
Perceived barriers can also be of a non-financial type. A significant barrier included in our model is disability, which results in an inability to get to a clinic or hospital without someone’s help, or aggravates the treatment of the CVD disease in the presence of an underlying chronic condition.
Various dimensions of the financial barriers have a negative association with the cardiovascular health of the Russian population. Loss of wages due to retirement is seen as a barrier to medical care by Russian females (βretr=0.450). Also, for females, moving from the most affluent income group to the group with moderate financial constraints increases the odds of a higher CVD risk group by a factor of 2 (Model 7). There is a statistically significant negative association between a major financial crisis dummy and the CVD risk group for Russian men (OR=1.65).
We find a non-trivial relationship between the disability and the CVD risk group among females (Model 7): females with disabilities are less likely to belong to the moderate or high-risk groups. This is likely a result of greater involvement of the disabled women with the health care sector that mitigates the risk of a fatal CVD disease, but the discussion of this effect is beyond the scope of the study.
The cues to action can be internal or external. Pain is one of the internal cues; it requires medical attention. The information from the healthcare providers represents external cues in our model. These consist of doctors’ advice to change diet and to take up sports or exercise. Another variable that falls into the external cues category is the person’s awareness of the check-up program. We posit that the knowledge of this prevention program might trigger individual participation in it.
Table 3 presents the four specifications for the “Cues to action” component of the HBM.
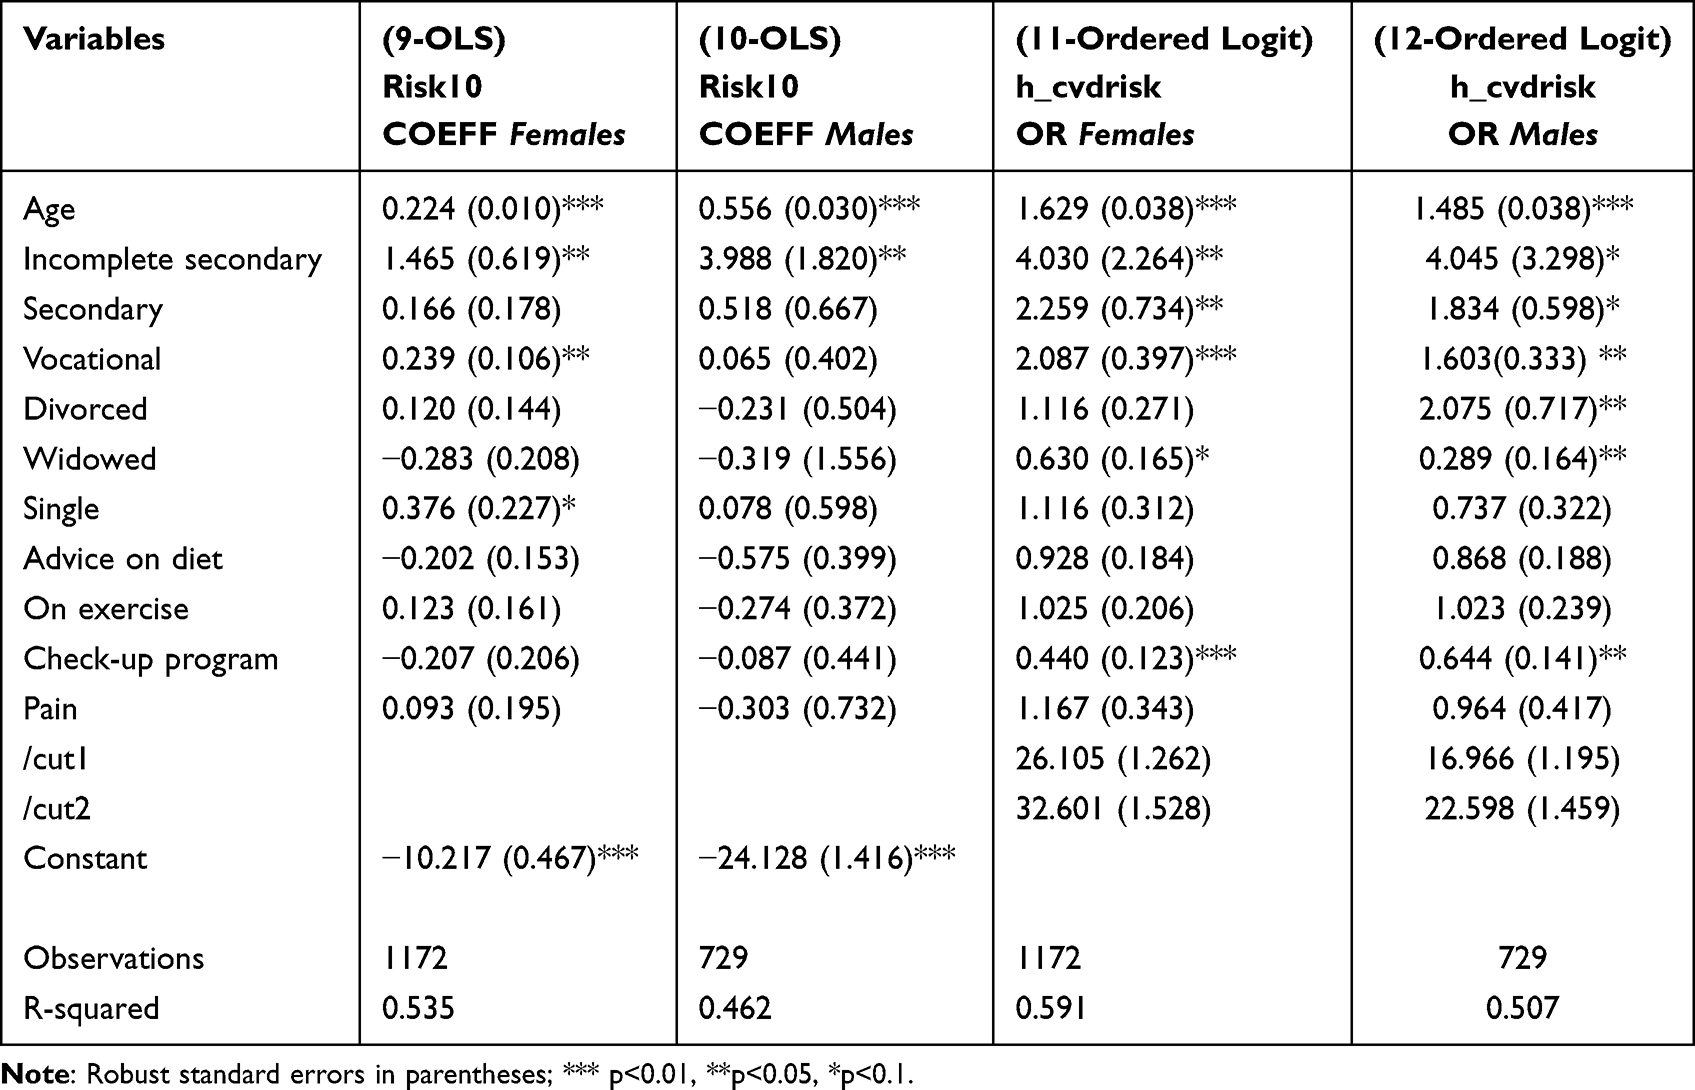 |
Table 3 OLS and Ordered Logit Regressions for CVD Risk Scores and Their Determinants in the “Cues to Action” Component |
Among the cues to action, only the awareness of the check-up program has a statistically significant association with cardiovascular health. For females (males) who are aware of the program, the odds of moderate CVD risks and high CVD risks are 56% (36%) lower than for females (males) unaware of this prevention program.
The explanatory power for the models (1–12) ranges from 0.46 to 0.63, confirming that the specifications explain the dependent variables well. Correlation matrices for the model do not reveal any correlations above 0.65.
The regression analysis presented above confirms Hypothesis 1. Specifically, it elicited socioeconomic and behavioral associations between CVD risks and the variables proxying for “perceived threat”, “perceived barriers” and “cues to action” – the key components of the HBM. We now move on to test Hypothesis 2.
Latent Class Analysis: Defining Lifestyle Patterns Among Different CVD Risk Groups
LCA suggested that the three-class model provided a good fit to the data resulting in a better relative fit than the two-class model with the lower AIC and BIC (Table S2). The four-class model did not converge. 55% of the individuals belong to Class 1, 10% are in Class 2, and 35% are in Class 3 (Table S3).
Table 4 reports probabilities of responding positively to each question in the form of the marginal means of the indicator variables. They are visualized in Figure S1 to provide each class’s graphical interpretations (or profiles).
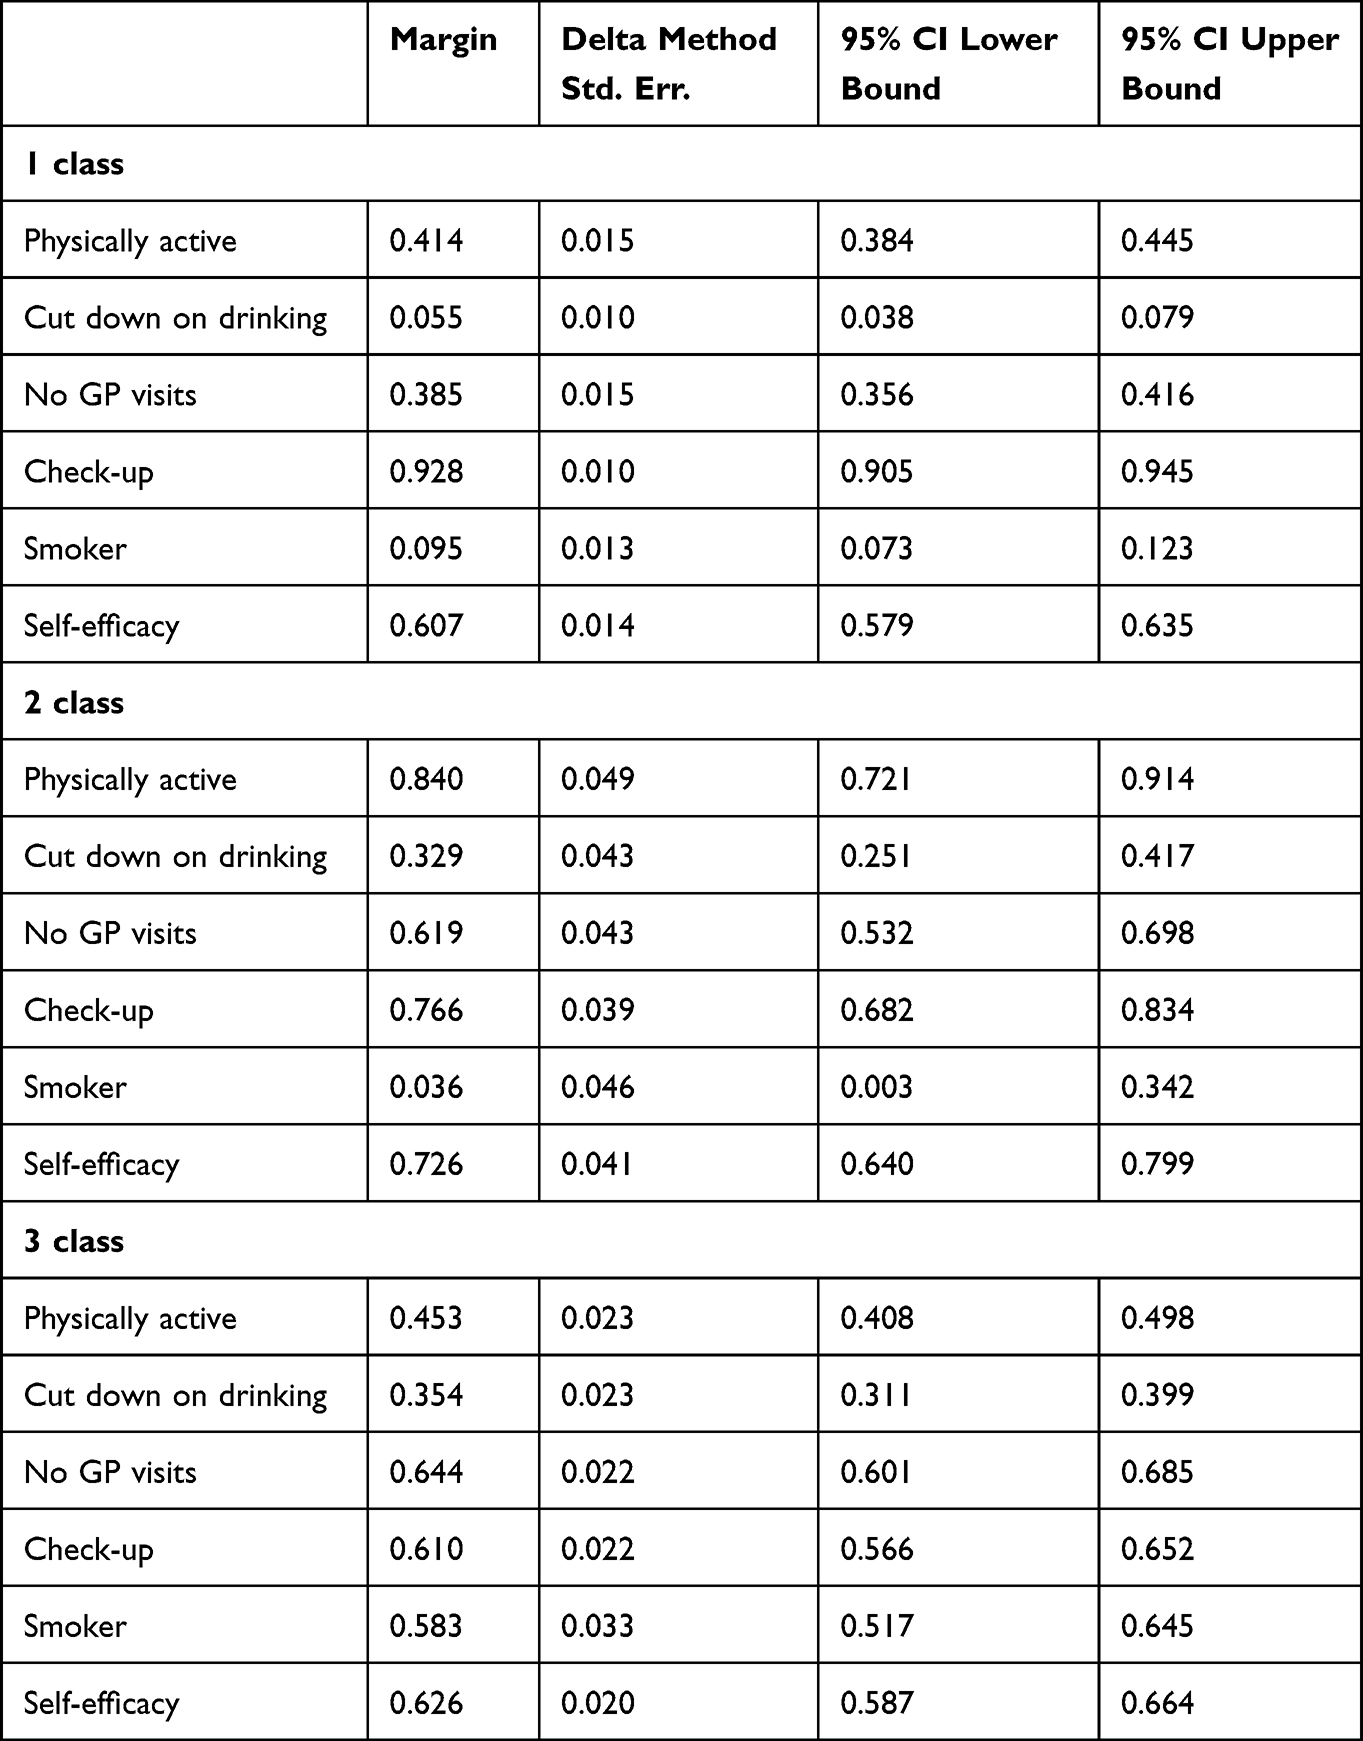 |
Table 4 Latent Class Marginal Means (n=2701) |
All socioeconomic and demographic predictors of class predictors are statistically significant except for the financial constraints dummy for Class 2 (Table 5; see Table S4 for the full model).
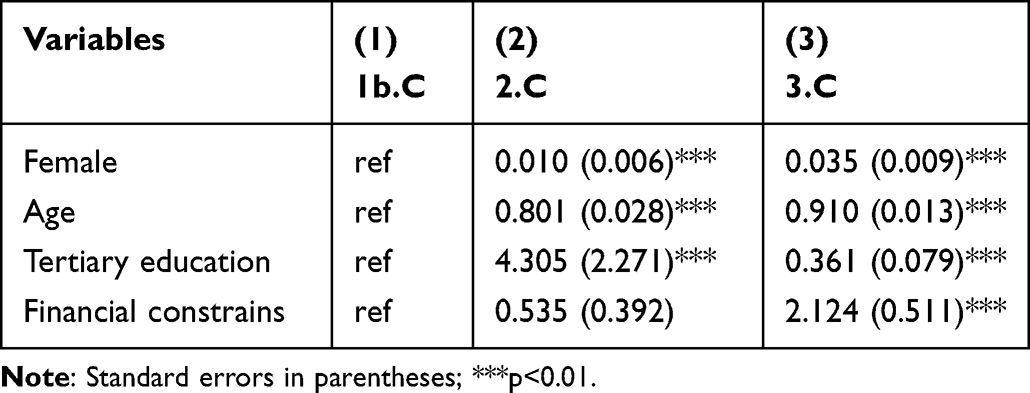 |
Table 5 Odds Ratios for Predictors of Class Membership in Multinomial Logistic Regression |
LCA, therefore, confirms Hypothesis 2: among the population exposed to CVD risks, we find three distinct subgroups. The dominant or typical grouping is Class 1, which includes 55% of the respondents. This class can be thought of as a “low CVD risk and healthy lifestyle” class. The class is characterized by the lowest shares of smokers (9.5%) and alcohol consumers (5.5%). Awareness of the check-up program is almost universal (93%). Another feature of the class membership is frequent GP visits (only 39% of individuals belonging to Class 1 did not see a GP in the past year). Relative to Classes 2 and 3, this class is populated by women and older individuals (Table 4). The visits might be both for preventive care and for the treatment of chronic conditions. Another feature of Class 1 is a low level of physical activity: only 41% of members are physically active. This could be due to age in some cases.
Class 2 is the atypical class that includes only 10% of the respondents. A high level of physical activity epitomizes Class 2: 84% of class members practiced vigorous physical activity that caused perspiration or a faster heartbeat. Males with tertiary education dominate Class 2 (the OR of a female belonging to class 2 relative to class 1 is only 0.01, and the members are 4.3 times more likely to attain higher education). While physically active, quite a few individuals in Class 2 frequently consume alcohol (33% feel they should cut down on drinking) but rarely smoke (3.6%). Class 2 also contains financially protected individuals (OR of reporting any financial constraint relative to Class 1 is 0.535). Therefore, we can hypothesize that middle-aged males earning above-average income form the basis of Class 2. Accordingly, Class 2 can be labeled as “Physically active but drinking” and categorized as a class with a moderate CVD risk.
35% of respondents belong to Class 3, which is the “high CVD risk” class. The highest share of smokers (58%) epitomizes Class 3. This class is also characterized by the greatest share of individuals who feel they should reduce alcohol intake (35%). Respondents in Class 3 rarely visit the GP (64% of class members did not see a doctor last year). The level of physical activity is relatively low. The class is dominated by males (OR for females=0.035). We observe an education gradient in health because the class is populated by those not attaining tertiary education (OR=0.361) who avoid seeing a medical specialist. This behavior could stem from financial constraints and the lack of finances that characterize this class (OR for financial constraints =2.124).
In LCA, we add a binary self-efficacy indicator for healthy behaviors (“By living healthily, I can prevent serious diseases”, score 0–2 on the 0–7 scale, where 0 is “strongly agree”). We do this because the model with the self-efficacy indicator has a better relative fit than alternative specifications. It is also superior in terms of the latent class marginal probabilities, allowing the identification of typical and atypical classes.
Mediation Analysis of the Relationship Between Employment Status, Health Behaviors, and CVD Risks
In testing Hypothesis 3 concerning the underlying causal mechanisms between the employment status/financial constraints, health behaviors, and cardiovascular risks, we put forward a number of assumptions which could plausibly describe the direction and nature of these causal pathways (Table 6).
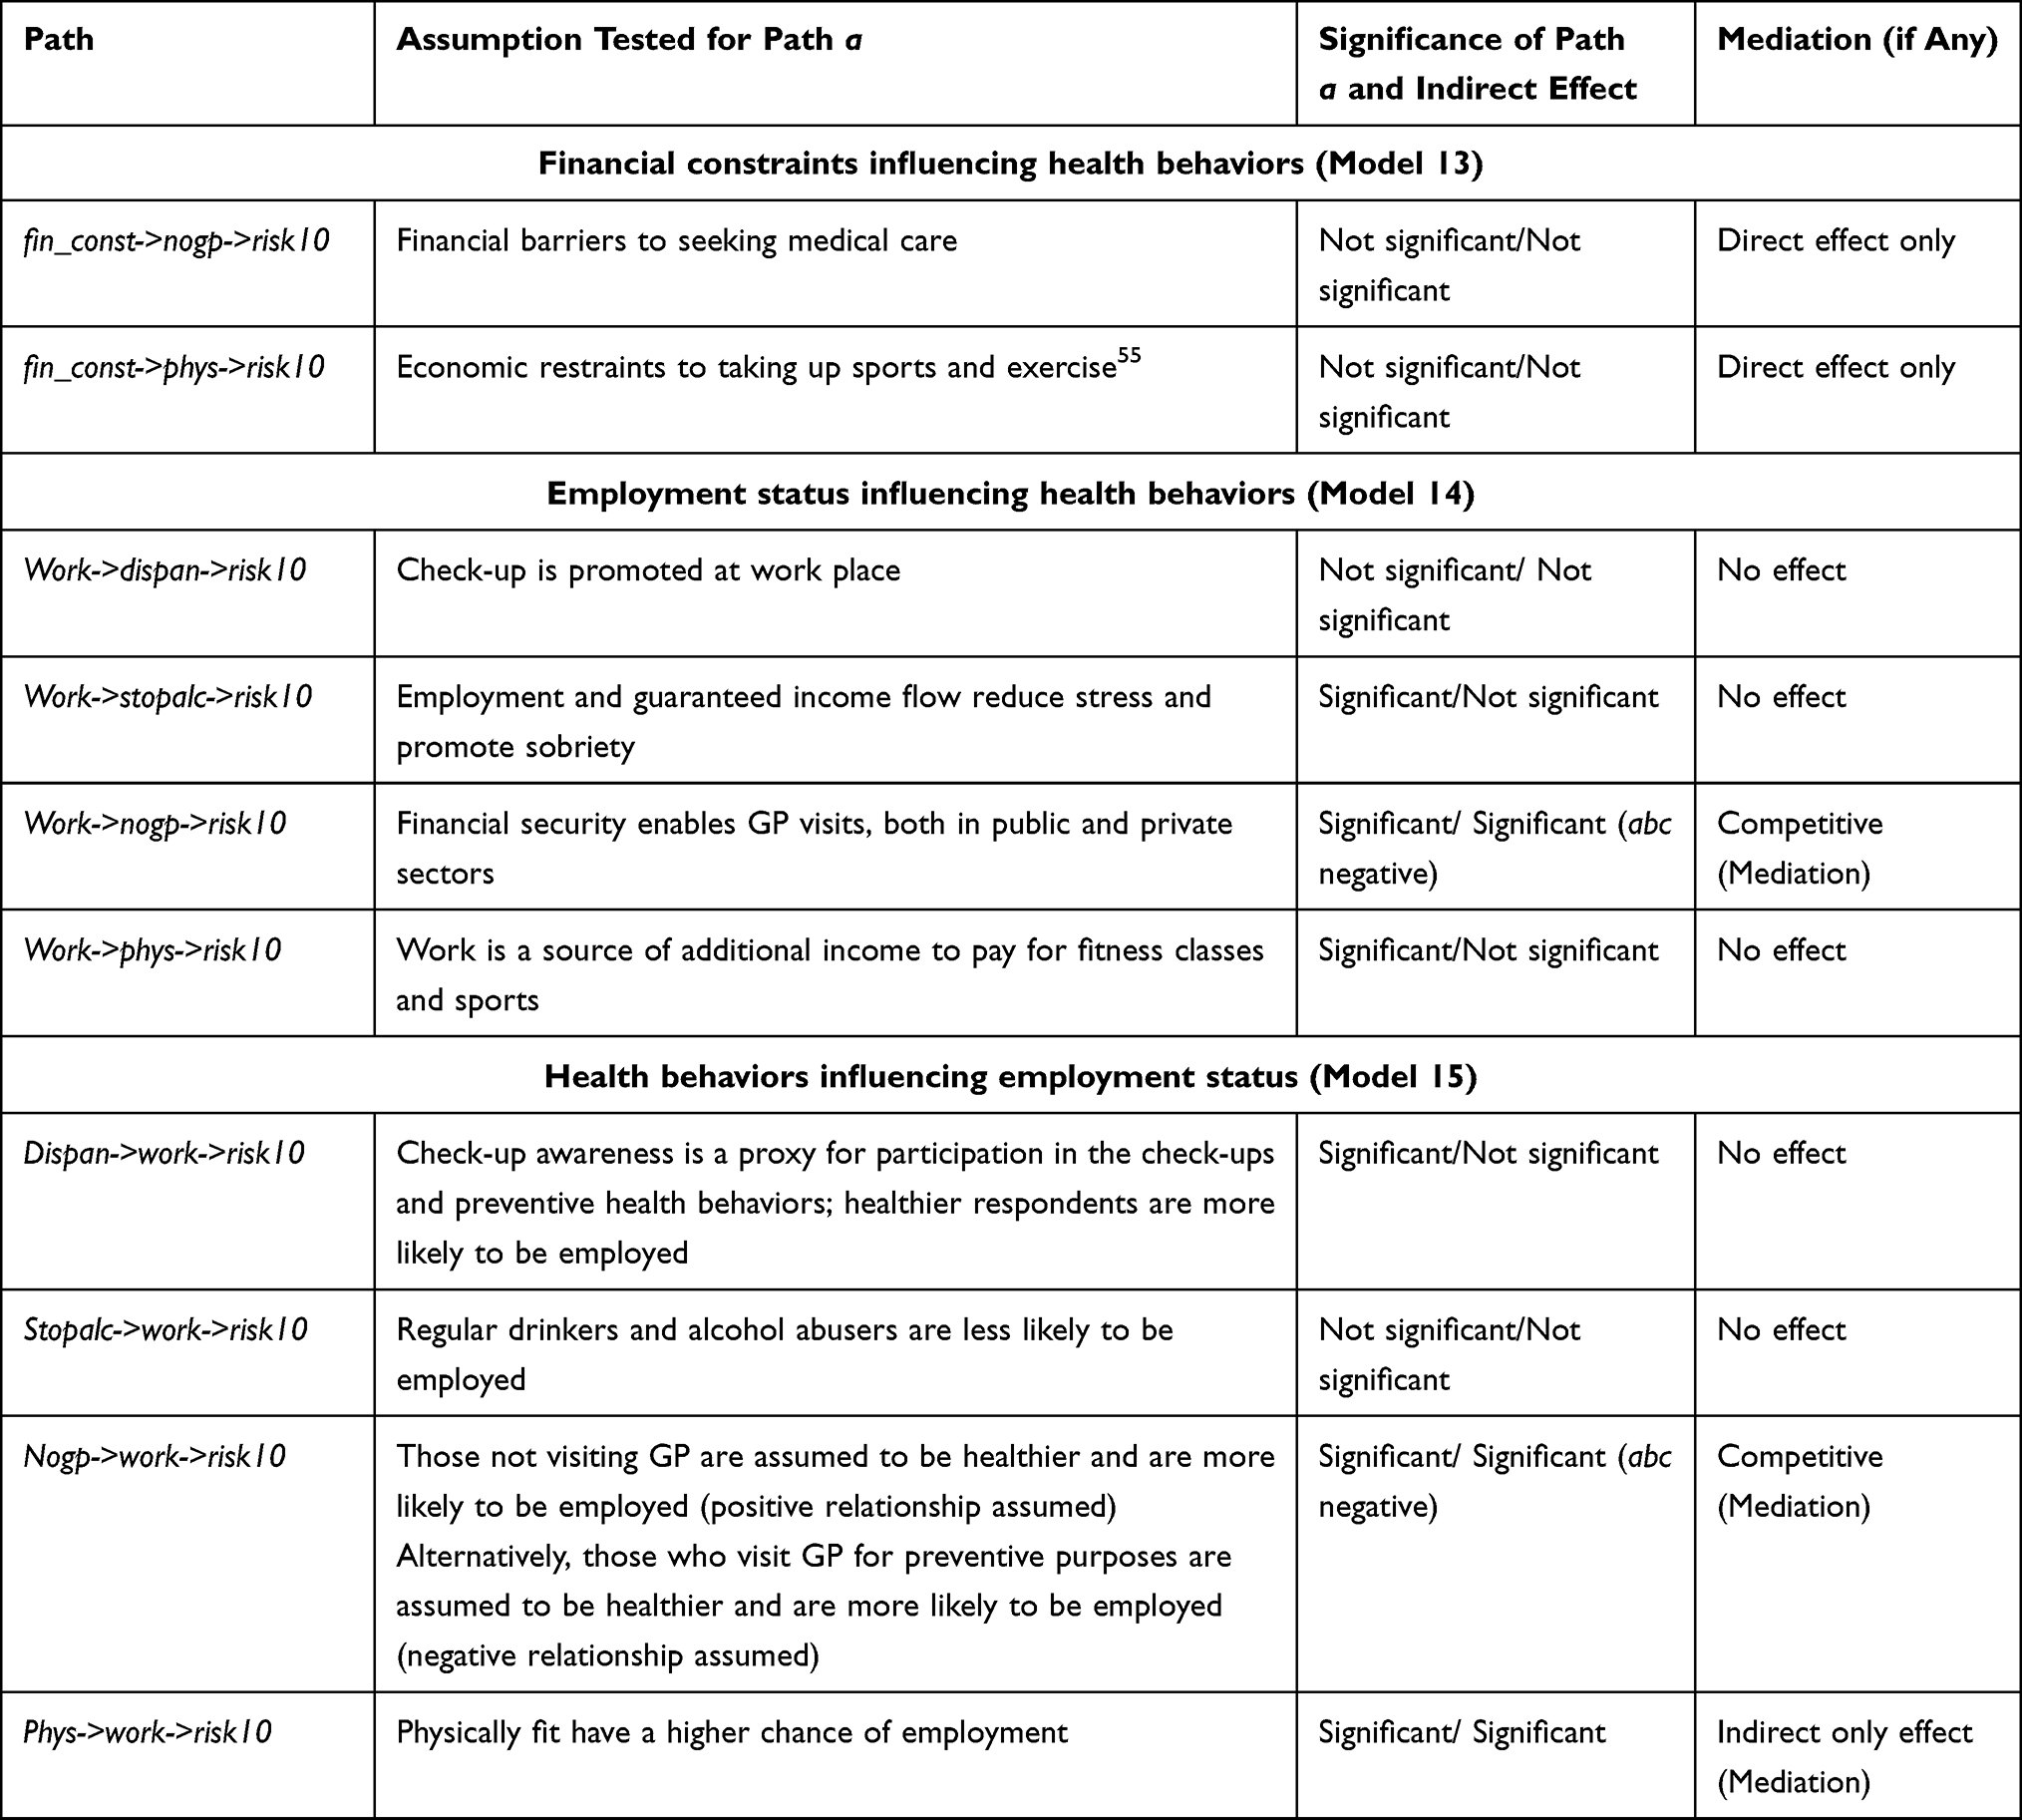 |
Table 6 Path-Specific Effects for Employment Status and Financial Constraints |
We believe that financial constraints can limit participation in sports and exercise, and then, in turn, low levels of physical activity can result in higher CVD risk scores. Similarly, there could be financial barriers to seeking medical care in public and private sectors, while not seeking care can later lead to developing CVDs. We test the significance of paths a, b, and c in the generalized SEM (GSEM) model but find only the direct effects of financial constraints on the CVD risk scores (Table 6). The CVD risk score is 0.72 pp higher for those with financial constraints in the generalized structural equation model.
We further explore the paths from employment status to health behaviors and CVD risk scores; then from health behaviors to employment status and CVD risk scores. We analyze the extended models (13–15) and calculate the indirect, direct, and total effects. If the path is not significant in the extended model, we remove it and run the reduced version. Figure 5 visualizes the final GSEM model (16) with the employment status as the mediator, and Table 7 presents the model’s results.
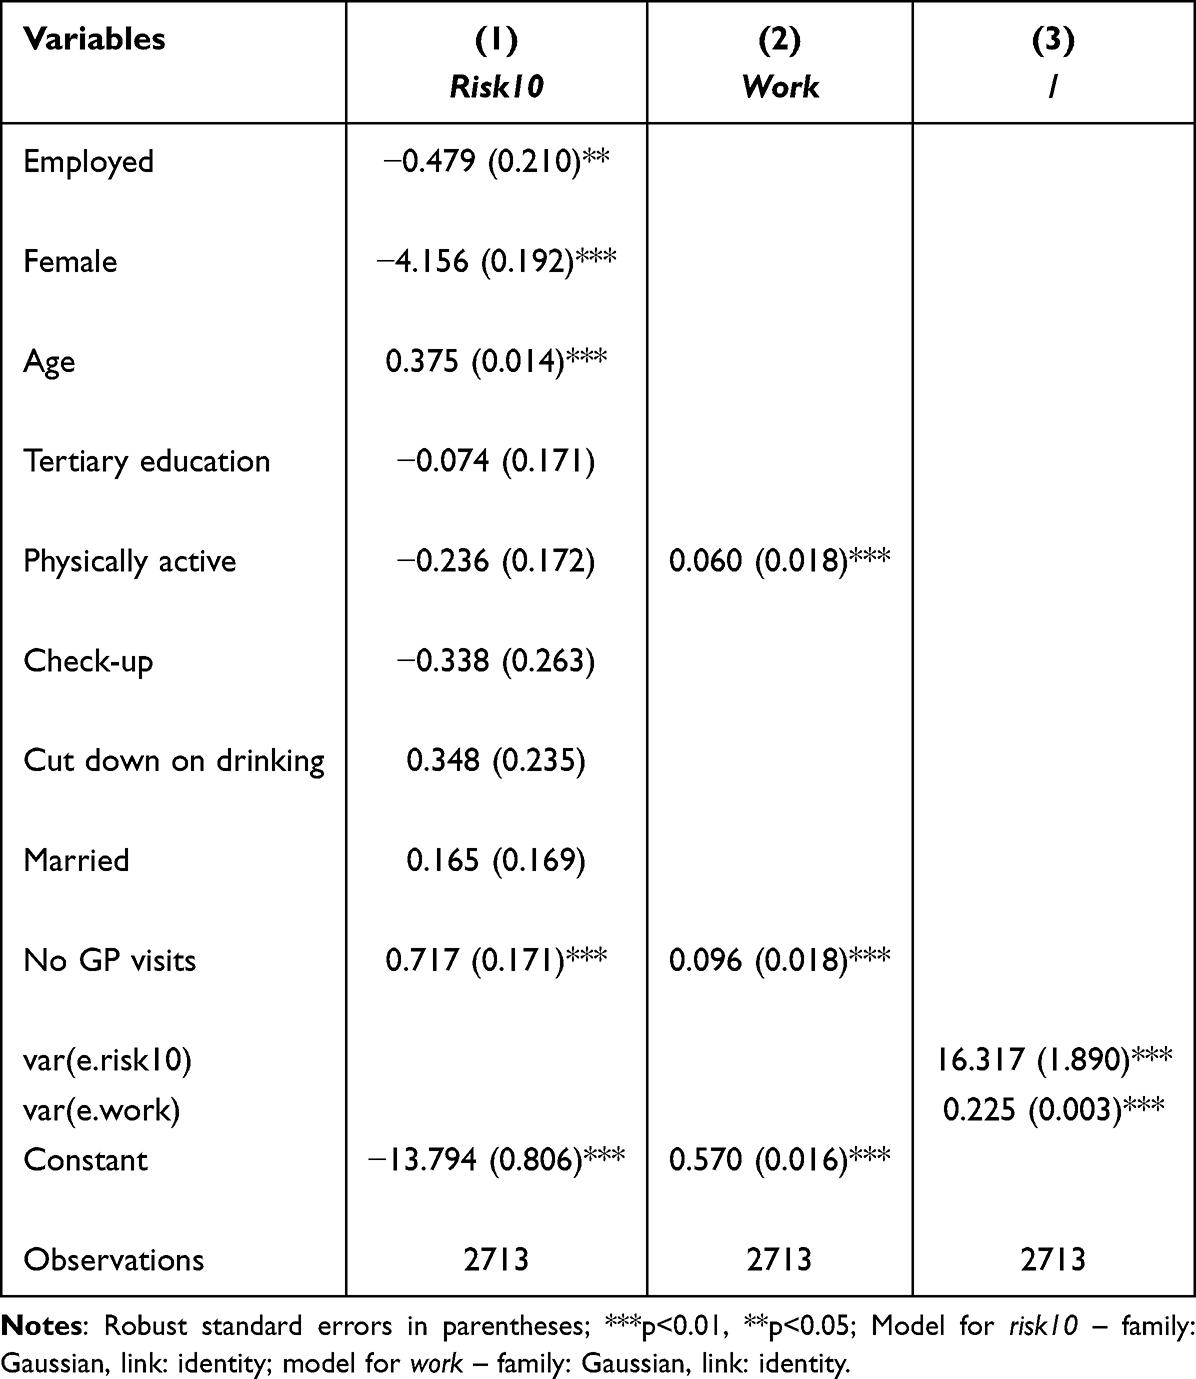 |
Table 7 Mediation Analysis with GSEM for CVD Risk Score and Employment Status as a Mediator (Model 16) |
 |
Figure 5 GSEM builder for the model with the employment status as the mediator (Model 16). |
The analysis uses 500 bootstrap re-samples to compute SEs and CIs for indirect and total effects (Table 8). Following the decision tree51 (Figure 4), we find that the employment status mediates the relationship between physical activity levels and CVD risk scores and confirm Hypothesis 3. 11% of the total effect (−0.264) is explained by the indirect effect of the phys->work->risk10 path (−0.029). Physical activity increases the likelihood of employment (βphys=0.060, path a), and employment reduces CVD risk scores (βwork=−0.480, path b). The mediator identified is consistent with the hypothesized theoretical framework. When the mediation effect is accounted for in the model for cardiovascular risk scores, only three socioeconomic variables — sex, age, and job status — retain their statistically significant associations with the dependent variable.
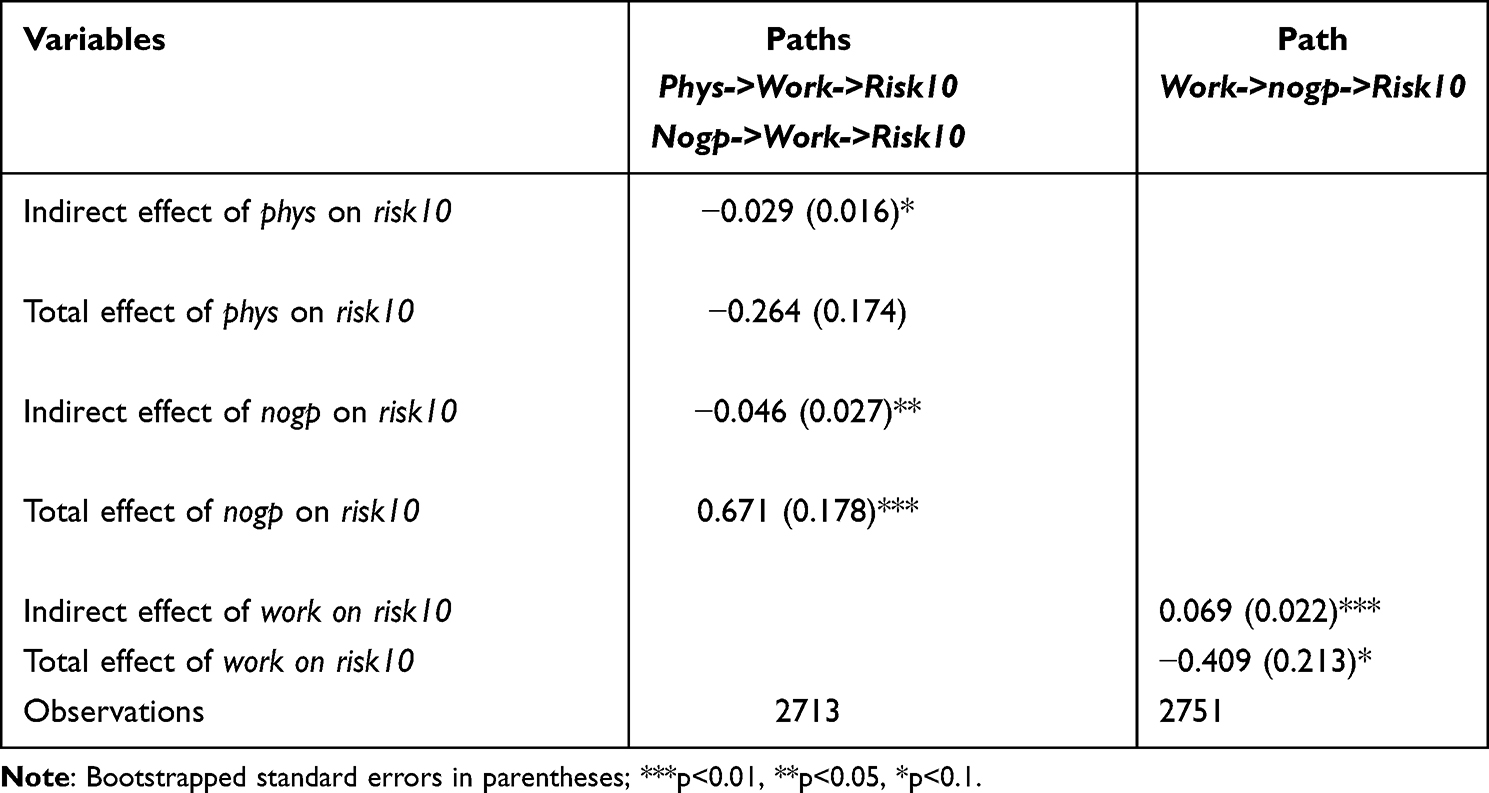 |
Table 8 Estimation of Indirect and Total Effects |
We find inconsistent or competitive mediation55 for the path from GP visits to cardiovascular risk scores mediated by the employment status. The direct effect of not visiting the GP has a positive sign: not seeking medical care increases cardiovascular risks by 0.717 pp. However, the effect of not seeking care on employment is positive. These effects are indicative of the selection mechanism in place, with the fit and the healthy in employment and those with worse health not finding work. In line with inconsistent mediation,55 the direct effect of nogp on risk10 is larger than the total effect (0.671). Thus, employment status acts as the suppressor in the relationship between seeking medical care and the risks of a fatal CVD event.
We also find inconsistent mediation for the causal mechanism work->nogp->risk10 (Figure S2), suggesting an incomplete theoretical framework. There is a positive effect of employment status on the likelihood of not visiting the GP (0.097). Together with a similar result found for Germany,56 it points towards the well-documented empirical evidence that having secure employment has a positive effect on both mental and physical health.57,58
Discussion and Limitations
Our results provide strong evidence of: a) the importance of individual perceptions of health in defining cardiovascular health behaviors among the Russian population; b) the existence of distinct subgroups of the population with different sets of health behaviors and socioeconomic characteristics; and c) the critical role of employment status for adopting health behaviors that mitigate the CVD risks, including physical activity and primary care visits.
Our results align with those obtained in earlier studies of CVD risks in Russia (MONICA, ESSE-RF and HAPIEE projects). First, our research confirms the existence of an education gradient in cardiovascular health for males following the MONICA study5 that shows that higher education was associated with reduced mortality from CVDs. Second, both the ESSE-RF study9 and our paper highlight the importance of physical activity for cardiovascular health and the positive association between higher education and vigorous physical activity. Third, our study also confirms the ESSE-RF study’s conclusion about the greater prevalence of smokers among the less educated population with higher CVD risks (Class 3 in our research). Fourth, our research and the HAPIEE study11 demonstrated that low material amenities (HAPIEE) and financial constraints (KHY) were associated with the increased risk of CVD death. Fifth, our mediation analysis shows that having a secure employment is associated with better CVD health, confirming the HAPIEE conclusion that unemployment is an important CVD risk factor.11
The SEM methodology allows us to go beyond the regression analysis prevalent in earlier studies of CVD risks. Using the concept of latent variables, we have identified three distinct groups with different levels of CVD risks and different health behaviors. This is a novel result for Russia, and as shown below, the set of policy recommendations will be based on the existence of these groups. Our mediation analysis also allows us to elicit a complex relationship between physical activity, employment level, and CVD risks, indicating that employment status mediates the relationship between physical activity and CVD risks. This relationship could not be uncovered in a standard regression model. Both LTA and mediation analysis shed new light on the topic of CVD risks and overcome existing difficulties of the linear regression models in the study of CVD risks.
There is a corresponding set of policy actions that stem from these findings. Policymakers have to continue reinforcing the change of the population mindset, encouraging individuals to adopt health-seeking behaviors. The changes in perception are likely to result in greater involvement with the primary care sector. Reinforcement of the mindset should be accompanied by reducing the barriers to health care. For example, conducting medical examinations in public places, such as shopping malls or directly at enterprises, can attract people who do not normally find time for health check-ups.
Given the distinct subgroups among those exposed to CVD risks, we recommend policy measures targeting different populations. To target individuals in the “high CVD risk” class, we propose media information campaigns to raise awareness of the annual check-ups as an entry point to the primary care sector. The basic evaluation of the first stage of the check-up currently includes estimating the risk SCORE with the follow-up and management of the high-risk patients in the second stage.59 Realization of the health benefits of these free check-ups for cardiovascular health can motivate the participation of low-income groups.
To address the issue of the low levels of physical activity among the elderly in Class 1, we recommend policymakers to further promote sports and exercise, making them accessible across all age groups. “An active longevity” project in Moscow currently offers free exercise classes for senior citizens; Russian regions should follow suit and evaluate the impact of such initiatives. Regardless of some setbacks, a recent study comparing health investment and longevity has clearly shown that Russian life expectancy growth has the strongest dynamics in relation to its expenditures in Eastern Europe.60
Behavioral nudges that increase awareness of the harm of excessive alcohol consumption can effectively target the male-dominated “physically active but drinking” group. One such measure could be putting garish color images on the alcohol packages that currently accompany health warning messages on cigarette packs.
As the mediation analysis has shown, employment and financial stability play an important role in mitigating CVD risks in Russia. Russian healthcare is free but only at the point of entry, sometimes requiring substantial financial resources to get to this point. The costs are even higher for those residing in remote areas. Employment guarantees a flow of income that can be spent on health investments that result, among other benefits, in better cardiovascular health. Having secure employment reduces CVD risks and results in fewer GP visits among those who have jobs. Policymakers must rethink their approaches into providing incentives for firms to create jobs in the private sector while re-evaluating the full range of costs and benefits for public sector employment.
This study is not without limitations. Know Your Heart dataset is not representative at a country level, so the generalizability of our findings is limited. Also, the study by design excluded institutionalized individuals, homeless people, and individuals too ill to be interviewed and, as such, may not be fully representative of groups that are difficult to reach with public health interventions. This limitation should be accounted for when interpreting the results of the study.
In the regression analysis, risk10 variable is not a continuous variable but is an index bounded between 0 and 100. Therefore, the OLS results have to be interpreted with caution. We perform the latent class analysis for the sample of individuals exposed to cardiovascular risk. However, LCA does not require a dependent variable, and the interpretation of classes potentially can go beyond the identification of the low- and high-CVD risk groups.
Furthermore, the GSEM module in Stata that we employ for the mediation analysis currently does not estimate the models’ absolute fit. Also, GSEM treats the mediators as continuous variables for calculating the indirect and total effects ignoring their binary nature. This limits the model inference to some extent. Next, causality in the mediation analysis still remains an area of methodological analysis, and without randomization the interpretation of causal mechanisms in our model remains somewhat tentative.
Lastly, there are possible direct and indirect effects between the variables we do not consider in this study. For example, Fritz et al61 employed the mediation analysis to investigate the relationship between sex, CVD risk factors, and mortality from coronary heart disease. In another study, lifestyle factors and health behaviors were shown to mediate the relationship between education, genetic risk scores, and cardiovascular disease.62 Without a doubt, there is a need for a more complex framework for path analysis that would allow for simultaneous estimation of the mediation effects between lifestyle factors and the socioeconomic determinants of CVD risks.
Conclusion and Further Research
This study presents a new approach to understanding the socioeconomic and behavioral determinants of CVD risks in Russia. The approach unites a theoretical framework of the Health Belief Model and the empirical structural equation modeling framework. Health-related actions to reduce perceived threat of diseases (physical activity and GP visits), perceived barriers to the behavioral change (financial constraints and loss of income due to retirement) and cues to actions (the annual check-up program) were shown to be key factors that defined cardiovascular health behaviors in the KHY sample.
Employing SEM as a more computationally advanced empirical framework lets us go beyond the regression analysis and uncover the hidden causal mechanisms that have not been discussed earlier. We demonstrated the existence of three groups with different sets of health behaviors that give rise to different levels of CVD risks. These groups formed the basis of the policy recommendations aiming to improve CVD health in the Russian population.
Finally, we have discussed and assessed the role of employment status in the mediation analysis. The mechanism that points towards a possible selection into employment is of particular interest.63 Are those who seek GP care more likely to become/or remain unemployed and have higher CVD risks as a result? A similar relationship between the labor market status and health was recently confirmed for mental health by the author.64 Exploring the causal relationship between employment, primary care visits, and CVD risks in a dynamic setting using longitudinal data is the potential direction of the future research.
Ethics Statement
Ethical approval was obtained from the ethics committees of the London School of Hygiene & Tropical Medicine (approval number 8808), Novosibirsk State Medical University (approval number 75; 21 May 2015), the Institute of Preventative Medicine, Novosibirsk (approval received 26 December 2014), and the Northern State Medical University, Arkhangelsk (approval number 01/01-15; 27 January 2015). The study was conducted in accordance with the 1964 Helsinki Declaration and its later amendments. Participants gave written informed consent.
Acknowledgments
We would like to thank Dr. Mylene Lagarde (LSE), Dr. Christopher Gerry (University of Central Asia), Dr. Jakob Petersen (QMUL), and Dr. David Leon (LSHTM) for their academic support during various stages of this research.
Funding
The study was conducted within the Research Plan of the Institute of Economics and Industrial Engineering of the Siberian Branch of the Russian Academy of Sciences, project no. 121040100283–2.
Disclosure
The authors report no conflicts of interest in this work.
References
1. Iakunchykova O, Averina M, Kudryavtsev A, et al. Evidence for a direct harmful effect of alcohol on myocardial health: a large cross-sectional study of consumption patterns and cardiovascular disease risk biomarkers from Northwest Russia, 2015 to 2017. J Am Heart Assoc. 2020;9(1):1–12. doi:10.1161/JAHA.119.014491
2. Pogosova N, Oganov R, Saner H. Positive trends in cardiovascular mortality in Russia and Moscow: potential confounders. Eur Heart J. 2016;37(42):3184–3185. doi:10.1093/EURHEARTJ/EHW470
3. CVD morbidity statistics in Russia. Available from: https://chekhovsc.ru/blog/statistika-serdechno-sosudistykh-zabolevanij-v-rossii.
4. Denisova I. Lawless heart? Rossiyskaya Gazeta; 2019.
5. Malyutina S, Bobak M, Simonova G, Gafarov V, Nikitin Y, Marmot M. Education, marital status, and total and cardiovascular mortality in Novosibirsk, Russia: a prospective cohort study. Ann Epidemiol. 2004;14(4):244–249. doi:10.1016/S1047-2797(03)00133-9
6. Peasey A, Bobak M, Kubinova R, et al. Determinants of cardiovascular disease and other non-communicable diseases in Central and Eastern Europe: rationale and design of the HAPIEE study. BMC Public Health. 2006;6(1):1–10. doi:10.1186/1471-2458-6-255
7. Cook S, Malyutina S, Kudryavtsev AV, et al. Know Your Heart: rationale, design and conduct of a cross-sectional study of cardiovascular structure, function and risk factors in 4500 men and women aged 35–69 years from two Russian cities, 2015–18. Wellcome Open Res. 2018;3. doi:10.12688/WELLCOMEOPENRES.14619.3
8. Shalnova SA, Drapkina OМ. Contribution of the ESSE-RF study to preventive healthcare in Russia. Cardiovasc Ther Prev. 2020;19(3):209–215. doi:10.15829/1728-8800-2020-2602
9. Kontsevaya AV, Shalnova SA, Balanova YA, et al. Social and economic gradients of behavioral risk factors in Russian population (by the ESSE-RF study). Cardiovasc Ther Prev. 2015;14(4):59–67. doi:10.15829/1728-8800-2015-4-59-67
10. Perlman F, Bobak M. Socioeconomic and behavioral determinants of mortality in posttransition Russia: a prospective population study. Ann Epidemiol. 2008;18(2):92–100. doi:10.1016/J.ANNEPIDEM.2007.07.093
11. Tillmann T, Pikhart H, Peasey A, et al. Psychosocial and socioeconomic determinants of cardiovascular mortality in Eastern Europe: a multicentre prospective cohort study. PLoS Med. 2017;14(12):e1002459. doi:10.1371/JOURNAL.PMED.1002459
12. Vandenheede H, Vikhireva O, Pikhart H, et al. Socioeconomic inequalities in all-cause mortality in the Czech Republic, Russia, Poland and Lithuania in the 2000s: findings from the HAPIEE Study. J Epidemiol Community Health. 2014;68:297–303. doi:10.1136/jech-2013-203655
13. Fogacci F, Borghi C, Tocci G, Cicero AFG. Socioeconomic status as determinant of individual cardiovascular risk. Atherosclerosis. 2022;346:82–83. doi:10.1016/J.ATHEROSCLEROSIS.2022.02.020
14. Bobak M, Malyutina S, Horvat P, et al. Alcohol, drinking pattern and all-cause, cardiovascular and alcohol-related mortality in Eastern Europe. Eur J Epidemiol. 2016;31(1):21. doi:10.1007/S10654-015-0092-8
15. Petersen J, Kontsevaya A, McKee M, et al. Untreated hypertension in Russian 35–69 year olds – a cross-sectional study. PLoS One. 2020;15(5):e0233801. doi:10.1371/JOURNAL.PONE.0233801
16. Баланова Ю, Концевая А, Льнова С, Деев А, Артамонова В. Распространенность поведенческих факторов риска сердечно-сосудистых заболеваний в российской популяции по результатам исследования ЭССЕ-РФ. Профилактическая медицина. 2014;17(5):42–52.
17. Gromova E. Psychological and social risk factors of cardiovascular diseases (Literature review). Siberian Med J. 2012;27(2):22–29.
18. Perlman F, Bobak M, Steptoe A, Rose R, Marmot M. Do health control beliefs predict behaviour in Russians? Prev Med. 2003;37(2):73–81. doi:10.1016/S0091-7435(03)00085-9
19. Steptoe A, Marmot M. The role of psychobiological pathways in socioeconomic inequalities in cardiovascular disease risk. Eur Heart J. 2002;23(1):13–25. doi:10.1053/EUHJ.2001.2611
20. Jakovljevic MB, Milovanovic O. Growing burden of non-communicable diseases in the emerging health markets: the case of BRICS. Front Public Health. 2015;3:1. doi:10.3389/FPUBH.2015.00065
21. Jakovljevic M, Jakab M, Gerdtham U, et al. Comparative financing analysis and political economy of noncommunicable diseases. J Med Econ. 2019;22(8):722–727. doi:10.1080/13696998.2019.1600523
22. Jakovljevic MM. Comparison of historical medical spending patterns among the BRICS and G7. J Med Econ. 2016;19(1):70–76. doi:10.3111/13696998.2015.1093493
23. Jakovljevic M, Lamnisos D, Westerman R, Chattu VK, Cerda A. Future health spending forecast in leading emerging BRICS markets in 2030: health policy implications. Health Res Policy Syst. 2022;20(1):1–14. doi:10.1186/S12961-022-00822-5/TABLES/9
24. Baron RM, Kenny DA. The Moderator-mediator variable distinction in social psychological research: conceptual, strategic, and statistical considerations. J Pers Soc Psychol. 1986;51(6):1173–1182. doi:10.1037/0022-3514.51.6.1173
25. Rosenstock IM. Historical origins of the Health Belief Model. Health Educ Monogr. 1974;2(4):328–335. doi:10.1177/109019817400200403
26. Janz NK, Becker M. The health belief model: a decade later. Health Educ Q. 1984;11(1):1–47. doi:10.1177/109019818401100101
27. Noar SM, Zimmerman RS. Health Behavior Theory and cumulative knowledge regarding health behaviors: are we moving in the right direction? Health Educ Res. 2005;20(3):275–290. doi:10.1093/HER/CYG113
28. Bandura A. Self-efficacy: toward a unifying theory of behavioral change. Psychol Rev. 1977;84(2):191–215. doi:10.1037/0033-295X.84.2.191
29. Haefner DP, Kirscht JP. Motivational and behavioral effects of modifying health beliefs. Public Health Rep. 1970;85(6):478–484. doi:10.2307/4593885
30. Gurevich K. Chronic non-communicable disease prevention in Russian Federation. Public Health Res. 2012;2(2):16–20. doi:10.5923/j.phr.20120202.03
31. Sabzmakan L, Morowatisharifabad MA, Mohammadi E, et al. Behavioral determinants of cardiovascular diseases risk factors: a qualitative directed content analysis. ARYA Atheroscler. 2014;10(2):71–82.
32. Haardörfer R, Berg CJ, Lewis M, et al. Polytobacco, marijuana, and alcohol use patterns in college students: a latent class analysis. Addict Behav. 2016;59:58–64. doi:10.1016/J.ADDBEH.2016.03.034
33. Mundal I, Lara-Cabrera ML, Betancort M, De Las Cuevas C. Exploring patterns in psychiatric outpatients’ preferences for involvement in decision-making: a latent class analysis approach. BMC Psychiatry. 2021;21(1). doi:10.1186/S12888-021-03137-X
34. Kim HS, Ahn J, No JK. Applying the Health Belief Model to college students’ health behavior. Nutr Res Pract. 2012;6(6):551–558. doi:10.4162/NRP.2012.6.6.551
35. Conroy RM, Pyörälä K, Fitzgerald S, et al. Estimation of ten-year risk of fatal cardiovascular disease in Europe: the SCORE project. Eur Heart J. 2003;24(11):987–1003. doi:10.1016/S0195-668X(03)00114-3
36. Machin D, Cheung Y, Parmar M. Survival Analysis: A Practical Approach. John Wiley and Sons; 2006.
37. Petersen J, Kontsevaya A, McKee M, et al. Primary care use and cardiovascular disease risk in Russian 40–69 year olds: a cross-sectional study. J Epidemiol Community Health. 2020;74(9):692–967. doi:10.1136/JECH-2019-213549
38. Long J, Freese J. Regression Models for Categorical Dependent Variables Using Stata. Stata Press; 2006.
39. Kayumova M, Gafarov V, Gakova E, Akimova E. Attitude to cardiovascular disease prevention and treatment in open population: gender differences. Int Heart Vasc Dis J. 2016;5(13):3–7.
40. Kaplan D. Structural equation modeling. Int Encyclopedia Soc Behav Sci. 2001;15215–15222. doi:10.1016/B0-08-043076-7/00776-2
41. McAdle J, Kadlec K. Structural equation models. In: Little T, editor. The Oxford Handbook on Quantitative Methods: Statistical Analysis. Oxford University Press; 2013:295–337.
42. Masyn K. Latent class analysis and finite mixture modeling. In: Little TD, editor. The Oxford Handbook on Quantitative Methods: Statistical Analysis. Vol. 2. Oxford University Press; 2013:551–611.
43. MacDonald KL. Latent Class Analysis (LCA) in Stata 2018 London Stata Conference; 2013.
44. Goodman LA. Latent class analysis: the empirical study of latent types, latent variables, and latent structures. In: Applied Latent Class Analysis. Cambridge University Press; 2009:3–55. doi:10.1017/cbo9780511499531.002
45. Stata Press. Structural Equation Modeling Reference Manual. Stata Press; 2021.
46. Dempster AP, Laird NM, Rubin DB. Maximum likelihood from incomplete data via the EM algorithm. J Royal Stat Soc. 1977;39(1):1–22. doi:10.1111/j.2517-6161.1977.tb01600.x
47. Muthén B, Shedden K. Finite mixture modeling with mixture outcomes using the EM algorithm. Biometrics. 1999;55(2):463–469. doi:10.1111/j.0006-341X.1999.00463.x
48. Sobel ME. Asymptotic confidence intervals for indirect effects in structural equation models. Sociol Methodol. 1982;13:290. doi:10.2307/270723
49. MacKinnon DP, Lockwood CM, Williams J. Confidence limits for the indirect effect: distribution of the product and resampling methods. Multivariate Behav Res. 2004;39(1):99. doi:10.1207/S15327906MBR3901_4
50. Shrout PE, Bolger N. Mediation in experimental and nonexperimental studies: new procedures and recommendations. Psychol Methods. 2003;7(4):422. doi:10.1037/1082-989X.7.4.422
51. Zhao X, Lynch J, Chen Q. Reconsidering Baron and Kenny: myths and truths about mediation analysis. J Consumer Res. 2010;37:197–206. doi:10.1086/651257
52. Kenny D. Mediation; 2021. Available from: http://davidakenny.net/cm/mediate.htm#CI.
53. Fairchild AJ, McDaniel HL. Best (but oft-forgotten) practices: mediation analysis. Am J Clin Nutr. 2017;105(6):1259. doi:10.3945/AJCN.117.152546
54. Lokshin M, Ravallion M. Testing for an economic gradient in health status using subjective data. Health Econ. 2008;17(11):1237–1259. doi:10.1002/HEC.1318
55. MacKinnon DP, Fairchild AJ, Fritz MS. Mediation analysis. Annu Rev Psychol. 2007;58:593–614. doi:10.1146/ANNUREV.PSYCH.58.110405.085542
56. van Ophem H. The frequency of visiting a doctor: is the decision to go independent of the frequency? J Appl Econometr. 2011;26(5):872–879. doi:10.1002/JAE.1252
57. Paul KI, Moser K. Unemployment impairs mental health: meta-analyses. J Vocat Behav. 2009;74(3):264–282. doi:10.1016/J.JVB.2009.01.001
58. Hergenrather KC, Zeglin RJ, Mcguire-Kuletz M, Rhodes SD. Employment as a social determinant of health: a systematic review of longitudinal studies exploring the relationship between employment status and physical health. Rehabil Res Policy Educ. 2015;29(1):2–26. doi:10.1891/2168-6653.29.1.2
59. Pogosova N, Sokolova O. Governmental efforts for cardiovascular disease prevention efforts in the Russian Federation. Cardiovasc Diagn Ther. 2017;67(Suppl 1):S48. doi:10.21037/CDT.2017.03.01
60. Jakovljevic MB, Vukovic M, Fontanesi J. Life expectancy and health expenditure evolution in Eastern Europe-DiD and DEA analysis. Expert Rev Pharmacoecon Outcomes Res. 2016;16(4):537–546. doi:10.1586/14737167.2016.1125293
61. Fritz J, Edlinger M, Kelleher C, et al. Mediation analysis of the relationship between sex, cardiovascular risk factors and mortality from coronary heart disease: findings from the population-based VHM&PP cohort. Atherosclerosis. 2015;243(1):86–92. doi:10.1016/J.ATHEROSCLEROSIS.2015.08.048
62. Powell KL, Stephens SR, Stephens AS. Cardiovascular risk factor mediation of the effects of education and Genetic Risk Score on cardiovascular disease: a prospective observational cohort study of the Framingham Heart Study. BMJ Open. 2021;11:45210. doi:10.1136/bmjopen-2020-045210
63. Jakovljevic M, Vukovic M, Chen CC, et al. Do health reforms impact cost consciousness of health care professionals? Results from a nation-wide survey in the Balkans. Balkan Med J. 2016;33(1):8. doi:10.5152/BALKANMEDJ.2015.15869
64. Kaneva M and Gerry CJ. (2021). Labour market status and depression in Russia: A longitudinal study, 2011–2017. Scand J Public Health,
 © 2023 The Author(s). This work is published and licensed by Dove Medical Press Limited. The
full terms of this license are available at https://www.dovepress.com/terms
and incorporate the Creative Commons Attribution
- Non Commercial (unported, 3.0) License.
By accessing the work you hereby accept the Terms. Non-commercial uses of the work are permitted
without any further permission from Dove Medical Press Limited, provided the work is properly
attributed. For permission for commercial use of this work, please see paragraphs 4.2 and 5 of our Terms.
© 2023 The Author(s). This work is published and licensed by Dove Medical Press Limited. The
full terms of this license are available at https://www.dovepress.com/terms
and incorporate the Creative Commons Attribution
- Non Commercial (unported, 3.0) License.
By accessing the work you hereby accept the Terms. Non-commercial uses of the work are permitted
without any further permission from Dove Medical Press Limited, provided the work is properly
attributed. For permission for commercial use of this work, please see paragraphs 4.2 and 5 of our Terms.