Back to Journals » Neuropsychiatric Disease and Treatment » Volume 13
Sociodemographic variables and social values: relationship with work-attendance problems in Brunei public- and private-sector employees
Authors Mundia L ![]() , Mahalle S
, Mahalle S ![]() , Matzin R, Zakaria GAN, Abdullah NZM
, Matzin R, Zakaria GAN, Abdullah NZM
Received 23 February 2017
Accepted for publication 20 June 2017
Published 31 August 2017 Volume 2017:13 Pages 2307—2319
DOI https://doi.org/10.2147/NDT.S135418
Checked for plagiarism Yes
Review by Single anonymous peer review
Peer reviewer comments 3
Editor who approved publication: Dr Roger Pinder
Lawrence Mundia, Salwa Mahalle, Rohani Matzin, Gamal Abdul Nasir Zakaria, Nor Zaiham Midawati Abdullah
Psychological Studies and Human Development Academic Group, Sultan Hassanal Bolkiah Institute of Education, Universiti Brunei Darussalam, Bandar Seri Begawan, Brunei
Objective: The study investigated the degree to which selected sociodemographic variables and social values were related to work-attendance problems in a random sample of 860 Brunei public- and private-sector employees and the nature of this relationship.
Materials and methods: This quantitative study used the field-survey approach to administer research instruments directly to participants. This enabled the researchers to help participants who needed assistance in completing the measures properly, so as to increase the number of usable returns.
Results: Two sociodemographic variables (seeking help from a counselor/psychologist and marital status) correlated significantly with work attendance. Private-sector employees were more likely to have work-attendance problems than government workers. Both single and married employees and the chief wage earner in the household were more likely to have work-attendance issues to deal with compared to their counterparts. However, employees who sought help from a counselor/psychologist were far less likely to have work-attendance problems compared to those who did not get such help. The most significant social-value correlates with work-attendance problems were interpersonal communication, employer–employee relationship, work-stress problems, self-presentation, self-regulation, self-direction, and interpersonal trust. Self-regulation, self-direction, and satisfaction with work-related achievements significantly predicted work-attendance problems positively, while interpersonal communication problems and work-stress problems predicted work-attendance problems negatively. Low scorers on self-regulation and self-direction, as well as on satisfaction with work-related achievements, were more likely to have work-attendance problems compared to high scorers. However, low scorers on interpersonal communication and work-stress problems were less likely to have work-attendance problems compared to high-scoring peers.
Conclusion: Ample evidence from this study showed that sociodemographic variables and social values contribute to work-attendance problems in various ways, and need to be incorporated in counseling interventions for affected employees.
Keywords: sociodemographic variables, social values, work attendance problems, public and private sector employees, Brunei
Introduction
Work-attendance problems include unlawful absenteeism, time “theft” (eg, going to work late, leaving work too early, unnecessarily long non-work-related conversations with workmates), and social loafing, such as being addicted to social media (eg, Facebook, Instagram, Twitter, WhatsApp, and email). These and other adverse work-attendance behaviors affect work and productivity negatively.1 Absenteeism is the main form of work-attendance problems, and takes many forms. It can be voluntary or involuntary, granted or ungranted, and health-related or non-health-related.2 Absenteeism may also be due to family problems.3,4 Vacations are an example of granted worker absence, but vacations are important in that they can lessen future absenteeism by reducing job stress and burnout.5 In terms of sex, the absenteeism rate in females was higher than that in males in Western countries according to one study,3 and is attributed mainly to women having family problems and menstrual cycles.6 Female employees with moderate–severe premenstrual syndrome or disorders had higher rates of absenteeism in comparison to female employees with neither. Other researchers4,7 also found that women had higher absenteeism rates than men due to their commitment to families.
Other factors leading to work-attendance problems
Family responsibilities were determinants of absenteeism in employees of both sexes.3,4,7 In addition, the type of employment sector contributed to worker motivation and absenteeism. In Pakistan, Rashid and Rashid8 found that employees in the public sector had lower job motivation but higher absenteeism rates than private-sector employees, due to the difference in monetary rewards and career-development opportunities. Job satisfaction was another possible cause of absenteeism. To motivate an employee to be present for work, job satisfaction is essential and associated with both worker motivation and systematic performance.9,10 According to previous research, a high absenteeism rate is often caused by low job motivation.11 Studies have also found a positive correlation between job dissatisfaction and absenteeism.2,12
Absenteeism can also be caused by the relationship between a worker and coworkers or supervisor(s). A relationship characterized by fairness and supportiveness can motivate an employee to be present for work, and lead to satisfaction and less likelihood of absenteeism occurring.11,13 Absenteeism may also be caused by bullying and unfairness in an organization.14
There is also empirical evidence that an unsupportive workplace atmosphere leads to higher rates of absenteeism.15 However, strong social support outside work also leads to sickness absenteeism, suggesting that strong social relationships encourage absenteeism during times of sickness.15 Another psychological factor associated with sickness absenteeism in a Finnish study was burnout, a form of psychological stress typically related to work that results from increased job demands.16 Closely related to burnout is stress, a factor commonly experienced by employees that contributes to work-attendance problems. Nielsen et al17 found that different stress types had moderate but positive correlations with sickness absence. Psychological distress, both in general or related to work, predicts work absence.12
Besides stress, numerous other health issues (physical or mental) also affect work attendance. A survey in the UK by Baker-McClearn et al18 revealed that short-term absence from work was usually caused by minor illnesses and stress, while longer absence was caused by issues of mental health or other disorders, such as back pain. Kääriä et al19 found that employees with low-back pain had higher chances of being hospitalized than employees without low-back pain. According to previous research, healthy employees were not only more productive but also less likely to be absent from work compared to unhealthy employees.20 In a French study conducted by Godet-Cayre et al,21 50% of employees with at least 1-day absence were insomniacs, while 34% were good sleepers. In addition, insomniac employees had more days of being absent from work compared to noninsomniacs.
Defining and assessing social values
There are many ways in which values can be defined or described. Values form an important part of the culture of any society. They provide the general guidelines for normative behaviors. Such values as fundamental rights, patriotism, human dignity, rationality, sacrifice, individuality, equality, and democracy guide our behavior in many ways.
According to Braithwaite and Scott, values are both “desirable” and “desired” behaviors expected of people in a given group, community, or society.22 By this definition, the terms “desirable” and “desired” refer to what one “ought” to do and what one “wants” to do, respectively.22 The use of the words “desirable” and “desired” makes it difficult to define values precisely. For instance, behaviors that are considered desirable or desired in one culture and circumstance may not be viewed the same way in another culture or situation. In addition, values are multidimensional and multifaceted constructs that overlap in some cases (eg, moral values are somewhat similar to ethical values). Furthermore, values may be classified in a variety of ways. For example, we have the so-called personal values (eg, an individualistic preference for high academic achievement), national values (eg, American values), regional values (eg, Western values), and collectivist values (eg, communal ways of living).
Attempts have also been made by researchers to identify the most common values, referred to as worldwide universal values or cross-cultural values.23 In the present study, we simply refer to values as “social values”, because they are embedded in several social domains, such as cultural, family, religious, moral, ethical, political, educational, occupational, and sociological disciplines.22
At the time of conducting this study, there was a dearth of research on social values. However, Inglehart’s24,25 work addressed the issues of social values. He focused on two types of social values: materialist values that were a response to the need for economic and physical security (eg, fighting rising prices), and immaterialist values that were concerned with social and self-actualizing needs (eg, decentralizing government decision-making processes). On social values related to employees, Hofstede26 discussed four types of work values: power distance (eg, social inequality and unequal power balance), uncertainty avoidance (eg, ways of dealing with the unknown future), individualism (autonomy) versus collectivism (group interdependence), and masculinity (eg, male assertiveness) versus femininity (eg, female nurturance). He argued that these four basic work values, which he operationalized at the ecological level, could be modified for use in nonwork contexts.
Much of the social psychology and sociological research on social values and work values has tended to focus on measuring the concerns people have for the self and others, known as social value orientation.27,28 Under this theory, people are divided into four social value-based categories. People who emphasize benefiting at the expense of others are referred to as individualistic or egoistic. Those who seek to exploit gains from individual differences are said to be competitive (competitors or “proselfs”). Individuals who advocate equality or collective interest (also known as joint/equal outcomes) are known as cooperatives (cooperators or “prosocials”). Persons with narrow self-interest but much compassion for others are labeled altruistic. Like the interpersonal trust concept, there are also many questionnaires that measure both social and work values.29 The present study used only some items from the value survey30 and the goal and mode value inventories.31 Rokeach30 divided values into two categories: terminal values (which referred to goals in life), and instrumental values (by which he meant modes of conduct). The goal and mode value inventories31 were an attempt to improve on Rokeach’s value-survey instrument.
Braithwaite and Law31 separated social goals/values from personal goals/values, and produced a three-part instrument with 13 dimensions: traditional religiosity, personal growth and inner harmony, physical well-being, secure and satisfying interpersonal relationships, social standing, social stimulation, positive orientation to others, propriety in dress and manners, religious commitment, assertiveness, getting ahead, international harmony, and national strength and order.
Besides these instruments, our study also adapted and incorporated some items from the world values survey,32 which taps a wider diversity of values, – universal, national, political, security, and moral – than is measured by the value survey or the goal and mode value inventories.31
Objectives of the study
The main goal of the present study was twofold: to determine the relationship between sociodemographic variables and work-attendance problems in Brunei public- and private-sector employees, and to determine the relationship between social values and work-attendance problems in Brunei public- and private-sector employees. A study with similar aims as the current investigation has not been done before in Brunei, and we hope this inquiry will address the existing literature and knowledge gaps on this matter.
Materials and methods
Design
A quantitative field survey was employed in preference to other modes of survey research. Using this approach, the researchers were able to assist on the spot participants who required help in completing the instruments. Such help could not easily be given with other types of survey research (eg, postal, online, and telephone). However, any help given to the participants on completing the research instruments correctly was done carefully, to reduce the degree of negative intrusion, such as negative researcher effect, which is a form of bias. We ensured that the help given did not influence the participants’ responses to questionnaire items.
Participants
According to the Brunei Department of Economic Planning and Development,33 there were 189,500 employed persons in Brunei in 2014, comprising 108,500 males (57.3%) and 81,000 females (42.7%). Of these, 137,300 (72.5%) were local Brunei citizens for whom the current study was designed, while 52,200 (27.5%) were foreigners. Although the numbers were not shown in this report, the public sector employed far more people than the private sector. The total number of workers in the private sector was not known at the time of conducting the present study.
A list of government ministries and departments located throughout Brunei was obtained from the Prime Minister’s Office as a sampling frame for public-employee participants. A separate list of companies operating in Brunei-Muara (the metropolitan area with the largest population in the country) was made by the researchers and used as a sampling frame for private-sector employee participants. The ministries and departments were numbered serially and then selected randomly using a table of simple random-sampling numbers. A similar procedure was used to list and select the participants from each department. Using the simple random-sampling technique, 822 participants were recruited for the study from different ministries and departments in the public sector throughout Brunei. Unfortunately, only 38 persons were recruited from the private sector, due to participants’ lack of interest in volunteering for the study. The two selections gave us a composite sample of 860 employees from both sectors of the Brunei economy (public and private). This sample size was adequate for our study, according to Krejcie and Morgan.34 Based on our four-point inclusion criteria, we selected only those people who met the following conditions: persons of all sexes, ethnicities, and religions, full Brunei citizen or permanent resident, employed in the public or private sector, and willing to participate in the study. No other inclusion and exclusion criteria were applied. The demographic composition and personal characteristics of the participants are presented in Table 1.
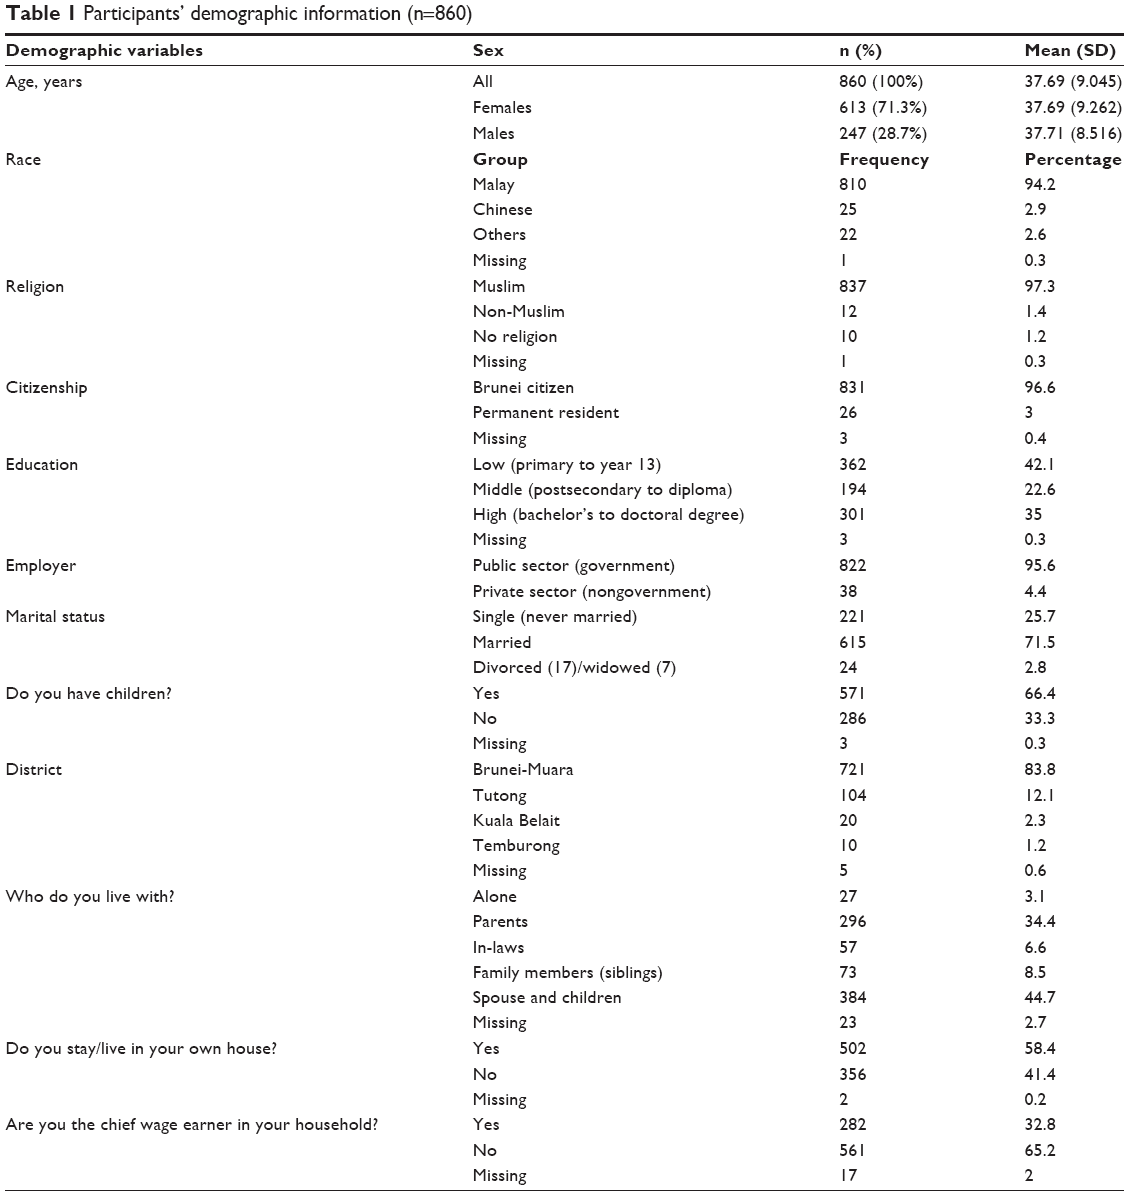 | Table 1 Participants’ demographic information (n=860) |
Instruments
A 16-item demographic questionnaire (part A) that collected the participants’ personal data reported in Table 1. The researchers constructed all the 16 items in part A (demographic questionnaire) using sources from the literature review and their own conceptualization of the problem investigated. Besides this, we also used 13 scales (in parts B–F of the instrument) that measured a wide range of social values shown in Table 2.
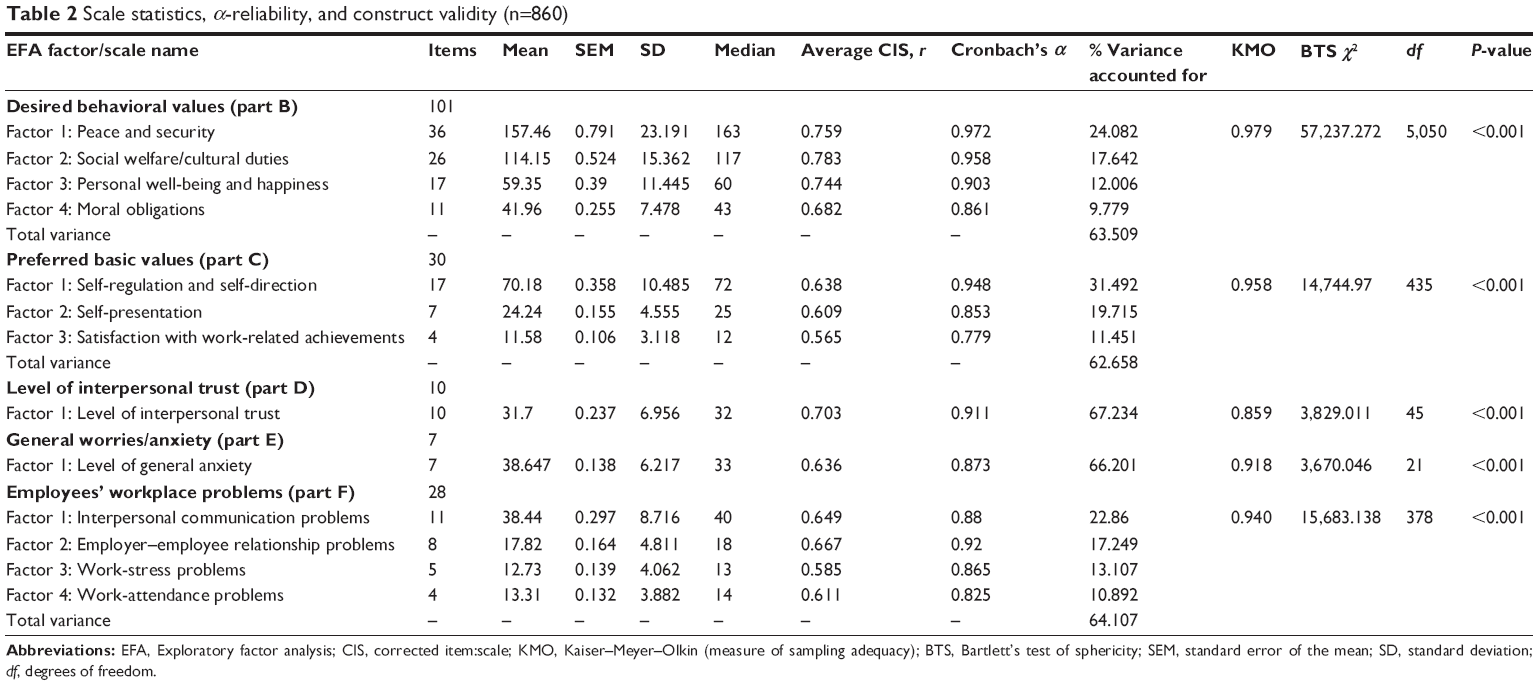 | Table 2 Scale statistics, α-reliability, and construct validity (n=860) |
Part B consisted of 101 items pertaining to desirable behavioral values in the Brunei context, which make up the four subscales shown in Table 2. The items in part B of the instruments were rated on 5-point Likert type scales (1, not at all important; 2, somewhat important; 3, moderately important; 4, quite important; 5, extremely important), eg, “Rate the following statement according to how you regard it as desirable in your life: To have true friends – 1 2 3 4 5”. The researchers constructed 73 of the 101 items in part B (desired behavioral values). The other 28 items in part B were adapted from the value survey30 and the world values survey.32
Part C was comprised of 30 items related to preferred basic values in Brunei that were divided into three subscales, presented in Table 2. The items in part C were also rated on 5-point Likert scales (1, completely unimportant; 2, not very important; 3, more or less important; 4, important; 5, very important), eg, “Rate this statement according to the way you believe you ought to behave: To obtain social support or help when you have a problem – 1 2 3 4 5”. Eighteen of the 30 items in part C (preferred basic values) were modified from the goal and mode value inventories.31 The researchers contributed the remaining 22 items in this section.
Part D had one ten-item questionnaire that measured the level of interpersonal trust. The items in this instrument were rated on 5-point semantic differential scales, eg, “Rate your trust of the people you work with” or “To what extent do you trust your coworkers (supervisor or boss)? Do not trust at all 1 2 3 4 5 Trust completely”. Most of the ten items in part D (level of interpersonal trust) were adapted from the interpersonal trust scale.35
Part E had one seven-item questionnaire that measured work-related general anxiety or worries. The items in this instrument were also rated on 5-point semantic differential scales, eg, “To what degree are you worried about losing your job? – Not at all 1 2 3 4 5 Very much”. The researchers provided all the seven items in part E (general anxiety/worries).
Part F contained 28 items that formed four questionnaires measuring employees’ workplace problems. All the items in this section were rated on 5-point Likert scales, eg, “Please rate the frequency of the following problems you face or are facing at work: Conflicts and not getting along with coworkers (supervisor or boss) – 1, Never; 2, Rarely; 3, Sometimes; 4, Often; 5, Always”. The items in these scales were derived from five main sources: items adapted from the interpersonal trust scale,35 the value survey,30 and the goal and mode values inventories;31 modified items from the world values survey,32 which is available online; and the researchers’ own constructed items (28 in total), based on their content review of the relevant literature, as well as their conceptualization of social values in the Brunei context.
Two main adaptations (changes or modifications) were made to all the borrowed items: wording or phrasing of the item statements/stems, and the response and scoring formats of the items. First, all items were worded positively and did not need reverse scoring. Second, we used only the Likert and semantic differential response formats. Third, each respondent’s total scale score was simply the sum of all the item values endorsed. In the literature, for example, the value survey30 requires the respondents to rank the values, whereas in our instruments the participants were requested to rate the values on either Likert or semantic differential scales, as these were easier to do for our participants than ranking concepts, some of which were very abstract. In their comparative study on assessing values, Alwin and Krosnick36 concluded: “Although ranking methods tend to be preferred for measuring social values, the empirical evidence available from past research suggests that rating techniques may be used just as effectively”.
According to Alwin and Krosnick, ranks have four main disadvantages. First, they are difficult and taxing to do when too many concepts are to be ranked.36 Second, they are time-consuming and expensive to administer. Third, they require the use of visual aids or flash cards. Fourth, the sum of ranks per respondent is affected by linear dependence. Ratings also have two main disadvantages, discussed by Alwin and Krosnick.36 First, though easier to administer and score, responses may be less precise. Second, they are prone to problems of response style or response set. The items in the scales of Rotter,35 Rokeach,30 and Braithwaite and Law31 are freely available in a book by Robinson et al29 while those from the world values survey32 are available online for free open-access download. Researchers are allowed to use items from all these instruments in their investigations, provided full acknowledgment is made. In addition, researchers are also free to make adaptations, modifications, or changes to the items (to suit their contexts) without written permission from the copyright owners. This sourcing procedure generated and provided a pool of 176 initial items on various values, which were subjected to exploratory factor analyses to determine their underlying constructs. Prior to performing the factor analyses, the 176 pooled items were categorized into five broad conceptual domains or themes (parts B–F) as explained, based on their content descriptions: desired behavioral values (101 items), preferred basic values (30 items), level of interpersonal trust (ten items), general worries/anxiety (seven items), and employees’ workplace problems (28 items).
A total of 13 major factors, each with at least four or more items that loaded highly (≥0.4), emerged from the factor analyses. The distribution of the factors across the domains was: desired behavioral values (four factors/subscales, 90 retained items), preferred basic values (three subscales, 28 retained items), level of interpersonal trust (one scale, ten items), general worries/anxiety (one scale, seven items), and employees’ workplace problems (four subscales, 28 items). The naming of factors or scales was largely based on content analyses of the item descriptions in the Brunei linguistic and cultural context. Because of extensive changes made to the borrowed items from published scales and inclusion of a large number of items composed by the researchers, as well as those taken from the online world values survey, the 13 factors generated were quite different from the ones originally obtained by Rotter, Rokeach, and Braithwaite and Law. The domains, factors with scale names, number of items in each scale, and scale descriptive statistics are presented in Table 2, together with information on scale reliability and validity. Items in each scale were reasonably homogeneous or unidimensional, as indicated by the high adjusted or nonspurious item–total correlations. In addition, each scale or subscale had good internal consistency reliability, as shown by high Cronbach’s α-coefficients. Furthermore, the domains and their scales or subscales had adequate construct validity, revealed in Table 2 by the percentage of variance accounted for. Moreover, the Kaiser–Meyer–Olkin measures of sampling adequacy and Bartlett’s tests of sphericity showed that the factor analyses we performed were satisfactory and suited the data, respectively.
In addition to construct validity, we also examined the convergence and discriminant validity of the instruments presented in Table 2 by correlating the derived measures. The resulting intercorrelations are displayed in Table 3. In this table, any two paired instruments with an intercorrelation of ≥0.71 had more than 50% common variance (an indication of possessing moderate convergent validity). Conversely, paired scales with an intercorrelation below the criterion value of 0.71 had satisfactory discriminant validity.
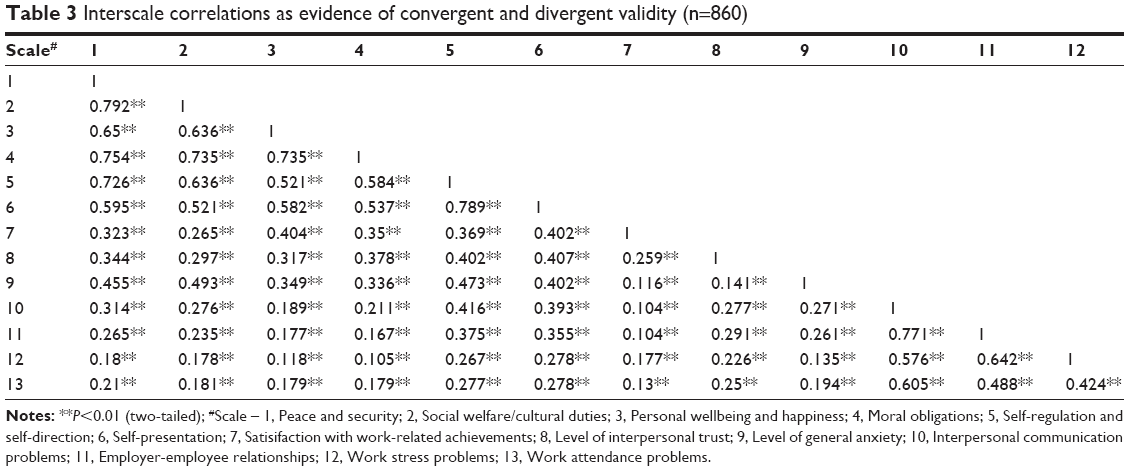 | Table 3 Interscale correlations as evidence of convergent and divergent validity (n=860) |
The meaning of low scores on each scale in the present study is briefly explained below in terms of a comparison between low scorers (< median value, coded 1) versus high scorers (≥ median value, coded 0):
- peace and security – low scores mean that you do not have much peace and security in your mind;
- social welfare/cultural duties – low scores mean that you tend to behave in socially and culturally unacceptable ways;
- personal well-being and happiness problems – low scores mean that your life is going as well as desired or planned;
- moral obligations – low scores mean that you sometimes do not know what things are right and wrong and behave accordingly;
- self-regulation and self-direction – low scores mean that you have no problems of controlling and managing your life;
- self-presentation – low scores mean that you may have low self-confidence and self-esteem and tend to present yourself in a negative manner or direction;
- satisfaction with work-related achievements – low scores mean that you are dissatisfied with your work achievements;
- interpersonal trust problems – low scores mean that you distrust others;
- general anxiety problems – low scores mean that you have fewer worries at work;
- interpersonal communication problems – low scores mean that you have fewer communication problems;
- employer–employee relationship – low scores mean that you often do not get along well with employers or bosses;
- work-stress problems – low scores mean that you have fewer stressful problems at work;
- work-attendance problems – low scores mean that you do not have many problems that affect your work attendance.
Procedures
The present study was funded by the Brunei Research Council of the Government of Brunei Darussalam through the University of Brunei Darussalam, a state tertiary institution. Written permission and approval to conduct the study were obtained from the University of Brunei Darussalam Ethics Committee and the Brunei Research Council Ethics Committee on behalf of the Government of Brunei Darussalam. In addition, ethical conditions and rights (eg, anonymity, confidentiality, privacy, voluntary participation, protection from harm, and informed consent) for participating in the study were first explained verbally in either English or Bahasa Melayu to individual research participants prior to collecting the data. After this, verbal and written informed consent were secured from each research participant in either of the two languages at the time and place of collecting the data. Only those who voluntarily agreed to participate in the study were recruited. Coercion and deception were not used when recruiting the participants. Furthermore, all the study’s research tools were written in simple English, requiring only a grade 7 or year 7 level of education. To address and reduce any possible linguistic and cultural biases, parallel bilingual items were presented on the instruments in both English and Bahasa Melayu, the main and official language of Brunei spoken by the majority of the people. Above all, data collection occurred in the participants’ work environments to increase the study’s ecological validity.
Data analysis
In this study, all our variables (both independent and dependent) were categorical. Quantitative data were analyzed using descriptive statistics (frequencies, percentages, means, and SD) and inferential statistics (Pearson correlations and hierarchical binary logistic regression analysis). To determine the importance of our findings, we used two-tailed tests of statistical significance at both P<0.05 and P<0.01 levels and tests of statistical power (such as effect sizes and model-fit χ2 indices for binary logistic regression analyses). All statistical analyses were performed on SPSS version 22.
Results
The major findings of the present study are presented and explained according to the objectives of the investigation. Most of the findings are not compared to previous trends in Brunei, due to lack of similar past research and data based on the same variables as investigated in the current study.
Relationships between sociodemographic variables and work-attendance problems
To determine the relationships between sociodemographic variables and work-attendance problems, we first used Spearman correlation method and the binary logistic regression analysis with backward elimination. Spearman correlation was suitable to use, since our sociodemographic variables were categorical and not continuous. Low correlations (both positive and negative) were obtained, as shown in Table 4. Of these, only two sociodemographic variables correlated significantly with the work-attendance variable: seeking help from a counselor/psychologist (r860=0.072, P<0.05) and marital status (r860=−0.069, P<0.05).
 | Table 4 Relationships between sociodemographic variables and work attendance using correlations (n=860) |
Binary logistic regression enabled us to explore, identify, and select sociodemographic variables that were most relevant to predicting work-attendance problems in people. This type of regression analysis required a dichotomous dependent variable (DV), while the independent variables (IVs) could be continuous, dichotomous, multicategory, or a combination of these.37–39 In the present study, our DV was work-attendance problems, which was dichotomized at the median score (see Table 2). Low scorers on the DV were coded 1, while high scorers were coded 0. The findings of the binary logistic regression analysis are presented in Table 5.
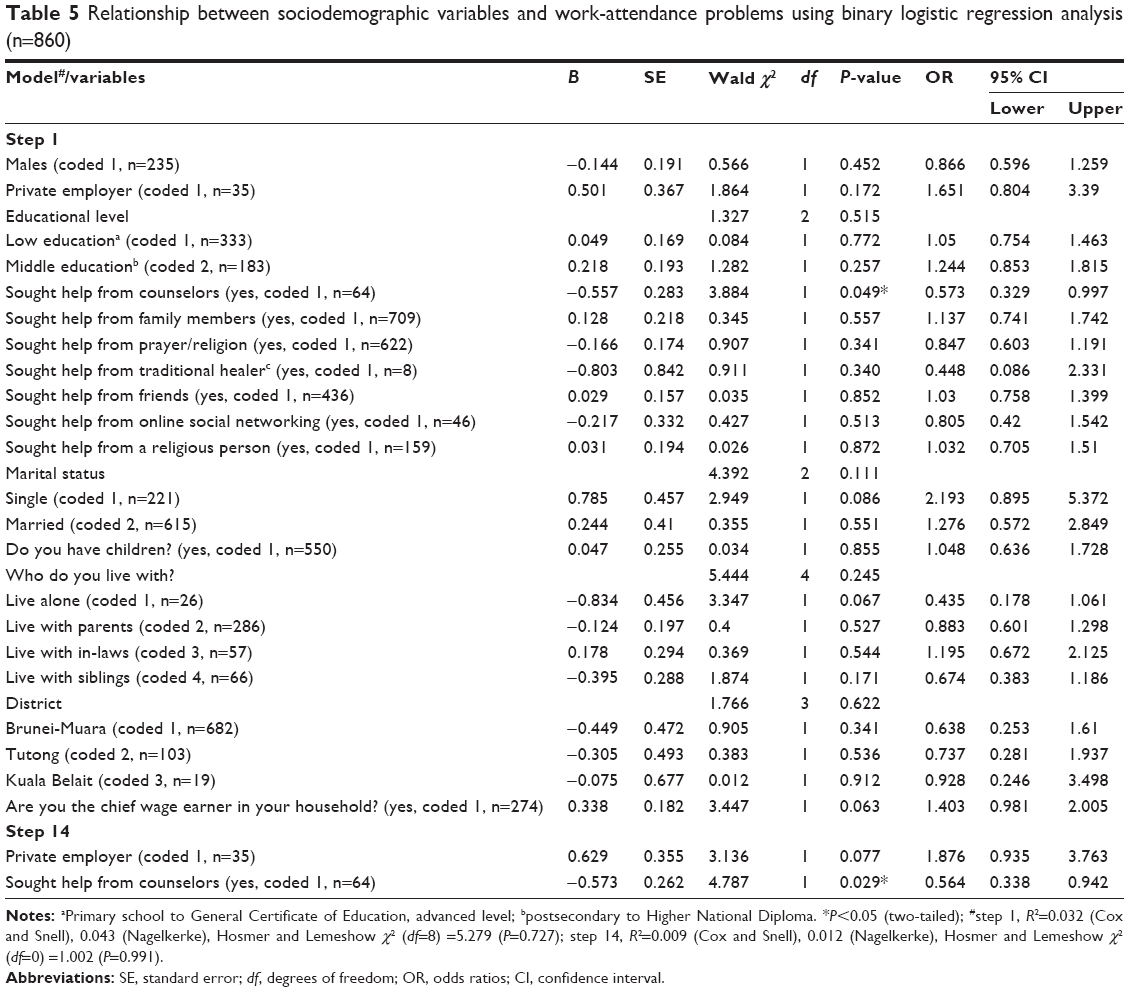 | Table 5 Relationship between sociodemographic variables and work-attendance problems using binary logistic regression analysis (n=860) |
In step 1 (model 1), we entered all the IVs and regressed them on the DV in 14 iterations using SPSS (version 22). For the sake of brevity, Table 5 shows only the specific contribution of each categorical IV to work-attendance problems in the first and last steps. As in previous similar studies,37–39 step 1 (first model) was overfitted and less efficient, because it contained both needed and unwanted IVs. The unnecessary IVs had relatively higher standard error, as in previous research.37–39
Following procedures employed in past research,37–39 SPSS hierarchically removed the irrelevant terms stepwise in the subsequent models. Though underspecified, as in previous studies,39 step 14 (last model) contained the best two and statistically significant predictors for work-attendance problems, which had lower standard error after adjusting for undesirable variables. The most suitable IVs were private employer (n=35) and seeking help from counselor/psychologist (n=64). The whole bivariate logistic model accounted for about 3.2%–4.3% of the common variance between the IVs and DV in the first step and approximately 0.9%–1.2% in the last step. The model was acceptable, as illustrated by the nonsignificant χ2-fit indices at the bottom of Table 5, similar to what was done in previous research.37–39
Compared to workers in the public sector, employees in the private sector were almost 1.9 times more likely to have work-attendance problems (B=0.629, OR 1.876, 95% CI 0.935–3.763; see Table 5). A number of demographic variables had high ORs for work-attendance problems, but were not significant predictors. These included employees who were single (B=0.785, OR 2.193, 95% CI 0.895–5.372), married (B=0.244, OR 1.276, 95% CI 0.572–2.849), and the chief wage earner in the household (B=0.338, OR 1.403, 95% CI 0.981–2.005). However, employees who sought help from counselors/psychologists were far less likely to have work-attendance problems compared to those who did not get such help (B=−0.573, OR 0.564, 95% CI 0.338–0.942).
Relationships between social values and work-attendance problems
To assess the association between social values and work-attendance problems, we used Pearson correlation and binary logistic regression analysis with backward elimination. Pearson correlation was suitable here, since we used continuous total scores of the social values (variables) to obtain interscale correlations (Table 3). As shown in Table 3, the six best and most significant social-value correlates of work-attendance problems were (in order of coefficient magnitude) interpersonal communication (r860=0.605, P<0.01), employer–employee relationship (r860=0.488, P<0.01), work-stress problems (r860=0.424, P<0.01), self-presentation (r860=0.278, P<0.01), self-regulation and −direction (r860=0.277, P<0.01), and interpersonal trust (r860=0.25, P<0.01).
For binary logistic regression analysis, all our variables (IVs and the DV) were bivariate, all having been dichotomized at the median score (see Table 2). The analysis was completed in nine iterations, but only the first and last steps are shown in Table 6. After adjusting for unnecessary terms, the model accounted for 9.6%–12.8% variance in the first step and 9.1%–12.2% in the last step (both steps with acceptable nonsignificant-fit indices shown at the bottom of Table 6). Four social values significantly predicted work-attendance problems both positively and negatively. Low scorers on self-regulation and self-direction were 1.4 times more likely to have work-attendance problems compared to high scorers (B=0.33, OR 1.391, 95% CI 1.063–1.821). In the same way, low scorers on satisfaction with work-related achievements were 1.6 times more likely to have work-attendance issues compared to high scorers (B=0.45, OR 1.568, 95% CI 1.212–2.029). However, low scorers on interpersonal communication problems were far less likely to have work-attendance problems compared to high scorers (B=−0.978, OR 0.376, 95% CI 0.28–0.505). With regard to work-stress problems, low scorers on this variable were equally less likely to have work-attendance problems compared to high scorers (B=−0.275, OR 0.759, 95% CI 0.572–1.008; P<0.05).
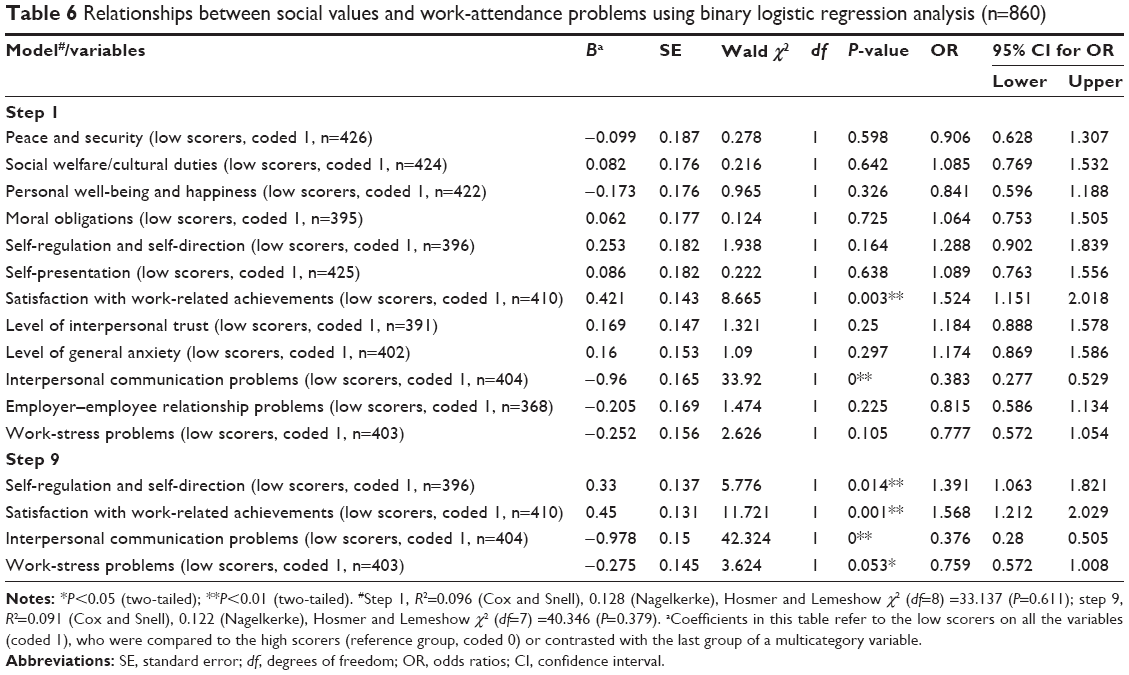 | Table 6 Relationships between social values and work-attendance problems using binary logistic regression analysis (n=860) |
Discussion
We obtained many findings from the present study. The major ones require further interpretation and clarification in this section. They are briefly discussed in the following sections.
Relationships between sociodemographic variables and work-attendance problems
The main sociodemographic correlates of work-attendance problems are presented below.
- Seeking help from a counselor/psychologist. According to research, bad work-attendance behavior, such as absenteeism, affect work efficiency and productivity and need to be addressed.1 Employees who sought help from counselors/psychologists were less likely to have work-attendance problems. This finding underscores the importance of giving professional help to employees with work-attendance problems. Work relationships characterized by fairness and support can motivate an employee to be present for work and lead to satisfaction and less likelihood of absenteeism occurring.11,13 Unsupportive workplace atmospheres lead to higher rates of absenteeism.15
- Marital status. In our study, variables that were related to work-attendance problems were single and married employees.
- Single employees were likely to have work-attendance problems. However, there are common work-attendance factors that affect both single and married employees. According to previous research, a high absenteeism rate is often caused by low job motivation in employees, irrespective of their marital status.11 Studies have also found a positive correlation between job dissatisfaction and absenteeism in both single and married employees.2,12 Absenteeism can also be caused by the relationship between a worker and coworkers or supervisor(s) in both single and married employees.
- Married employees were likely to have work-attendance problems. Absenteeism may also be due to family problems.3–4 Edwards7 found that women had higher absenteeism rates compared to men, due to their commitment to families.
- Private-sector employees were likely to have work-attendance problems. The type of employment sector also contributes to worker motivation and absenteeism. In Pakistan, Rashid and Rashid8 found that employees in the public sector had lower job motivation but higher absenteeism rates than private-sector employees, due to the difference in monetary rewards and career-development opportunities.
- Chief wage earners in the household were also likely to have work-attendance problems. This finding was different from the results of earlier research reviewed, and was thus unique for Brunei. The variable was not investigated in previous studies.
Relationships between social values and work-attendance problems
The six most significant social-value correlates of work-attendance problems in the present study were interpersonal communication, employer–employee relationships, work-stress problems, self-presentation, self-regulation/self-direction, and interpersonal trust. Of these, three or half (interpersonal communication, work-stress problems, and self-regulation/self-direction) were also good predictors of work-attendance problems. The other significant predictor of work-attendance problems in the current study was satisfaction with work-related achievements.
Low scorers on interpersonal communication problems (people who had little or no communication problems with others) were less likely to have work-attendance problems in this study. With regard to employer–employee relationships, much could be said from past research on this variable. For example, absenteeism may be caused by bullying and unfairness in an organization.14 The finding on the employer–employee relationship variable was also related to some aspects of Hofstede’s26 social and work values of employees, such as power distance (social inequality and unequal power balance) and uncertainty avoidance (ways of dealing with the unknown future). Workers will avoid work to protect themselves from an insecure situation. In addition, absenteeism may also be caused by an adversarial relationship between a worker and coworkers. For instance, a relationship characterized by fairness and support could motivate an employee to report for work and lead to job satisfaction, as well as less likelihood of absenteeism occurring.11,13
Consequently, low scorers on such variables as work-stress problems, interpersonal trust, self-presentation, and satisfaction with work-related achievements were likely to have work-attendance issues according to findings from the present study. In the present study, low scorers on self-regulation and self-direction were likely to have work-attendance problems, because they would tend to go on ungranted leave of absence from work. On the other hand, vacations are an example of granted worker absence that can lessen future absenteeism by reducing job stress and burnout.5 Our other findings here relating to low scorers on satisfaction with work-related achievements, interpersonal communication, and employer–employee relationship could perhaps be explained in terms of Rokeach’s30 negative factor on values. Rokeach30 divided the values into two categories: negative and positive. Inappropriate behavior, such as bullying and improper communication at work, are examples of negative social values. Brunei culture emphasizes reciprocating good behavior.
Conclusion
Based on evidence from correlations, a number of sociodemographic variables and social values investigated in the present study were related to work-attendance problems, both negatively and positively. Some of the relationships were statistically significant. Since correlations do not infer causation and effect, we used binary logistic regression to determine the nature and direction of the relationship between the categorical IVs and the dichotomous DV. We recommend further research with a qualitative component to probe the contentious quantitative findings.
Limitations
The present study had one main limitation. We did not include an interview component with probes to explore further participants’ responses on the quantitative surveys. However, the interviews would have demanded far more time from the participants’ busy schedules (which was an unrealistic thing for us to do). Despite this shortcoming, we believe that the current study’s findings have practical significance, and may be relevant to policy makers and researchers in Brunei and elsewhere.
Acknowledgments
Thanks are extended to two anonymous research assistants who collected the data for the value-research project. The study was supported by grant UBD/BRC/7 (September 17, 2013) from the Brunei Research Council, Government of Brunei Darussalam, Brunei.
Disclosure
The authors report no conflicts of interest in this work.
References
Kocakulah MC, Kelley AG, Mitchell KM, Ruggieri MP. Absenteeism problems and costs: causes, effects and cures. Int Bus Econ Res J. 2009;8:81–88. | ||
Alexanderson K. Sickness absence: a review of performed studies with focused [sic] on levels of exposure and theories utilized. Scand J Soc Med. 1998;26:241–249. | ||
VandenHeuvel A. Absence because of family responsibilities: an examination of explanatory factors. J Fam Econ Issues. 1997;18:273–294. | ||
Boise L, Neal MB. Family responsibilities and absenteeism: employees caring for parents versus employees caring for children. J Manag Issues. 1996;8:218–238. | ||
Westman M, Etzion D. The impact of vacation and job stress on burnout and absenteeism. Psychol Health. 2001;16:595–606. | ||
Ichino A, Moretti E. Biological gender differences, absenteeism and the earnings gap. Am Econ J Appl Econ. 2009;1:183–218. | ||
Edwards V. Examining absenteeism in the public and non-profit sectors. Int J Organ Theory Behav. 2014;17:293–306. | ||
Rashid S, Rashid U. Work motivation differences between public and private sector. Am Int J Soc Sci. 2012;1:24–30. | ||
Rothman R. Working: Sociological Perspectives. 2nd ed. Toronto: Prentice-Hall; 1998. | ||
Greenberg J, Baron R. Behavior in Organizations. 8th ed. Upper Saddle River (NJ): Pearson Education; 2008. | ||
Thirulogasundaram P, Sahu D. Job satisfaction and absenteeism interface in corporate sector: a study. IOSR J Humanit Soc Sci. 2014;19:64–68. | ||
Hardy GE, Woods D, Wall TD. The impact of psychological distress on absence from work. J Appl Psychol. 2003;88:306–314. | ||
Punnett BJ, Greenidge D, Ramsey J. Job attitudes and absenteeism: a study in the English speaking Caribbean. J World Bus. 2007;42:214–227. | ||
Kivimäki M, Elovainio M, Vahtera J. Workplace bullying and sickness absence in hospital staff. Occup Environ Med. 2000;57:656–660. | ||
Stansfeld SA, Rael EG, Head J, Shipley M, Marmot M. Social support and psychiatric sickness absence: a prospective study of British civil servants. Psychol Med. 1997;27:35–48. | ||
Schaufeli W, Bakker A, van Rhenen W. How changes in job demands and resources predict burnout, work engagement, and sickness absenteeism. J Organ Behav. 2009;30:893–917. | ||
Nielsen ML, Kristensen TS, Smith-Hansen L. The intervention project on absence and well-being: design and results from the baseline of a 5-year study. Work Stress. 2002;16:191–206. | ||
Baker-McClearn D, Greasley K, Dale J, Griffith F. Absence management and presenteeism: the pressures on employees to attend work and the impact of attendance on performance. Hum Resour Manag J. 2010;20:311–328. | ||
Kääriä S, Kaila-Kangas L, Kirjonen J, Riihimäki H, Luukkonen R, Leino-Arjas P. Low back pain, work absenteeism, chronic back disorders, and clinical findings in the low back as predictors of hospitalization due to low back disorders. Spine (Phila Pa 1976). 2005;30:1211–1218. | ||
Störmer S, Fahr R. Individual determinants of work attendance: evidence on the role of personality. Appl Econ. 2013;45:2863–2875. | ||
Godet-Cayre V, Pelletier-Fleury N, Le Vaillant M, Dinet J, Massuel MA, Le Ger D. Insomnia and absenteeism at work: who pays the cost? Sleep. 2006;29:179 –184. | ||
Braithwaite VA, Scott WA. Values. In: Robinson JP, Shaver PR, Wrightsman LS, editors. Measures of Personality and Social Psychological Attitudes. Vol 1. San Diego: Academic Press; 1991:661–753. | ||
Triandis HC, Kilty KM, Shanmugam AV, Tanak Y, Vassiliou V. Cognitive structures and the analysis of values. In: Triandis HC, editor. The Analysis of Subjective Culture. New York: Wiley; 1972:181–263. | ||
Inglehart R. The silent revolution in Europe: intergenerational change in post-industrial societies. Am Polit Sci Rev. 1971;65:991–1017. | ||
Inglehart R. The Silent Revolution. Princeton: Princeton University Press; 1977. | ||
Hofstede G. Culture’s Consequences: International Differences in Work-Related Values. Thousand Oaks (CA): Sage; 1980. | ||
van Lange PA. The pursuit of joint outcomes and equality in outcomes: an integrative model of social value orientation. J Pers Soc Psychol. 1999;77:337–349. | ||
Murphy RO, Ackermann KA, Handgraaf MJ. Measuring social value orientation. Judgm Decis Mak. 2011;6:771–781. | ||
Robinson JP, Shaver PR, Wrightsman LS. Measures of Personality and Social Psychological Attitudes. Vol 1. San Diego: Academic Press; 1991. | ||
Rokeach M. Beliefs, Attitudes, and Values: A Theory of Organization and Change. San Francisco: Jossey-Bass; 1968. | ||
Braithwaite VA, Law HG. Testing the adequacy of Rokeach value survey. J Pers Soc Psychol. 1985;49:250–263. | ||
Social Research Centre, Australian National University. World values survey 2012. 2012. Available from: http://politicsir.cass.anu.edu.au/sites/politicsir.anu.edu.au/files/world-values-survey-2012-questionnaire.pdf. Accessed August 2, 2017. | ||
Department of Economic Planning and Development. Labor Force Survey 2014: Preliminary Report. Bandar Seri Begawan: Brunei Prime Minister’s Office; 2015. | ||
Krejcie RV, Morgan DW. Determining sample size for research activities. Educ Psychol Meas. 1970;30:607–610. | ||
Rotter JB. A new scale for the measurement of interpersonal trust. J Pers. 1967;35:651–665. | ||
Alwin DF, Krosnick JA. The measurement of values in surveys: a comparison of ratings and rankings. Public Opin Q. 1985;49:535–552. | ||
Mundia L, Matzin R, Mahalle S, Hamid MH, Osman RS. Contributions of sociodemographic factors to criminal behavior. Psychol Res Behav Manag. 2016;9:147–156. | ||
Mundia L, Shahrill M, Jaidin JH, Jawawi R, Mahadi MA. Brunei’s teacher education programs: insights into students’ coping and help-seeking strategies to challenges. Int J Ment Health Syst. 2016;10:62. | ||
Mundia L, Matzin R, Mahalle S, Hamid MH, Osman RS. Recidivism in Brunei prisoners: estimating the rates and predicting reoffending. Int J Emerg Ment Health. 2016;18:742–749. |
 © 2017 The Author(s). This work is published and licensed by Dove Medical Press Limited. The
full terms of this license are available at https://www.dovepress.com/terms
and incorporate the Creative Commons Attribution
- Non Commercial (unported, 3.0) License.
By accessing the work you hereby accept the Terms. Non-commercial uses of the work are permitted
without any further permission from Dove Medical Press Limited, provided the work is properly
attributed. For permission for commercial use of this work, please see paragraphs 4.2 and 5 of our Terms.
© 2017 The Author(s). This work is published and licensed by Dove Medical Press Limited. The
full terms of this license are available at https://www.dovepress.com/terms
and incorporate the Creative Commons Attribution
- Non Commercial (unported, 3.0) License.
By accessing the work you hereby accept the Terms. Non-commercial uses of the work are permitted
without any further permission from Dove Medical Press Limited, provided the work is properly
attributed. For permission for commercial use of this work, please see paragraphs 4.2 and 5 of our Terms.