
Back to Journals » Journal of Hepatocellular Carcinoma » Volume 13
SNHG6 Promotes Lipid Metabolic Reprogramming in Hepatocellular Carcinoma via Upregulation of SCD
Authors Zheng X, Lu J, Qiu H, Jin Q, Cao L, Liu J, Song P, Yao S
Received 18 March 2026
Accepted for publication 19 June 2026
Published 10 July 2026 Volume 2026:13 610313
DOI https://doi.org/10.2147/JHC.S610313
Checked for plagiarism Yes
Review by Single anonymous peer review
Peer reviewer comments 3
Editor who approved publication: Dr Ali Hosni
Xin Zheng,1 Jiajun Lu,2 Huiping Qiu,1 Qianya Jin,1 Lulu Cao,3 Jie Liu,1 Pengxia Song,1 Shuihong Yao1
1Medical School, Quzhou College of Technology, Quzhou, Zhejiang, People’s Republic of China; 2Department of Hepatobiliary Surgery, The Quzhou Affiliated Hospital of Wenzhou Medical University, Quzhou People’s Hospital, Quzhou, Zhejiang, People’s Republic of China; 3Department of Pathology, The Quzhou Affiliated Hospital of Wenzhou Medical University, Quzhou People’s Hospital, Quzhou, Zhejiang, People’s Republic of China
Correspondence: Shuihong Yao, Medical School, Quzhou College of Technology, Quzhou, Zhejiang, People’s Republic of China, Tel +86 15157021122, Email [email protected]
Objective: The aim of this study was to examine the role and molecular mechanism of the long non-coding RNA small nucleolar RNA host gene 6 (SNHG6) in lipid metabolic reprogramming in hepatocellular carcinoma (HCC).
Methods: The effects of SNHG6 knockdown on the proliferative and metastatic capacities of Huh7 and LM3 cells were assessed using CCK-8 assays, colony formation assays, and Transwell migration and invasion assays. Lipid alterations were assessed using LipidTOX staining, triglyceride (TG) quantification, and non-targeted metabolomics. Downstream genes and signaling pathways were analyzed by RNA sequencing, quantitative reverse transcription polymerase chain reaction, and Western blotting. Rescue experiments were conducted by overexpressing stearoyl-coenzyme A desaturase (SCD) in SNHG6-knockdown cells. The regulation of SCD expression by SNHG6 via the AMPK/ sterol regulatory element-binding protein-1 (SREBP1) axis was examined by Western blotting. Additional rescue experiments were conducted using AMPK inhibitors and overexpression of SREBP1 in SNHG6-knockdown cells.
Results: SNHG6 expression was significantly upregulated in tumor tissues from patients with HCC and was associated with poor prognosis. SNHG6 silencing reduced lipid droplet accumulation and TG content in HCC cells and suppressed cellular proliferation, migration, and invasion. Further analyses demonstrated that SNHG6 knockdown decreased SCD expression, whereas overexpression of SCD restored lipogenesis and reversed the suppression of proliferation and metastatic capacity induced by SNHG6 silencing. Mechanistically, the data suggested that SNHG6 upregulated SREBP1 expression through the AMPK signaling pathway, thereby enhancing SCD expression and promoting lipid metabolism. The reduction in lipogenesis and inhibition of proliferation and metastatic capacity induced by SNHG6 silencing were reversed by AMPK pathway inhibition and SREBP1 overexpression.
Conclusion: Taken together, these findings suggested that SNHG6 may regulate lipid metabolism in HCC by linking to SCD-centered lipogenic regulation via the AMPK/SREBP1 pathway, pointing to a potential SNHG6/AMPK/SREBP1/SCD signaling axis.
Keywords: AMPK signaling, hepatocellular carcinoma, lipid metabolism, SCD, SNHG6, SREBP1
Introduction
Lipids constitute a diverse class of structurally complex macromolecules that play essential roles in maintaining physiological processes.1 They form the fundamental structural framework of biological membranes and contribute to membrane protein anchoring and localization through lipid modifications. Lipids function as intracellular signaling mediators and serve as energy reserves in the form of triglycerides (TG).2–4 Cellular homeostasis is maintained through the dynamic regulation of lipid metabolism. Disruption of this balance directly leads to changes in membrane structure and fluidity, dysregulation of signal transduction pathways, and impairment of cellular energy supply systems.5
Lipid synthesis activity in tumor cells is frequently upregulated, and lipid metabolites are efficiently utilized to support cellular proliferation, invasion, and metastasis.6,7 For example, compared with normal hepatocytes, which primarily depend on exogenous fatty acids, hepatocellular carcinoma (HCC) cells preferentially undergo de novo lipid synthesis.8 Therefore, the initiation and progression of HCC are commonly associated with increased expression of key lipogenic enzymes.
Lipogenic enzymes, including stearoyl-coenzyme A desaturase (SCD), fatty acid synthase (FASN), acetyl-coenzyme A carboxylase 1 (ACC1), and ATP-citrate lyase (ACLY), as well as their upstream central transcription factor sterol regulatory element binding protein-1 (SREBP1), are highly expressed in HCC tissues.9–11 SREBP1 is a key transcription factor that regulates the expression of lipogenic genes. AMP-activated protein kinase (AMPK), as an important upstream regulator, inhibits hepatic lipogenesis by downregulating transcription factors such as SREBP1.12 Consequently, targeting key molecules involved in lipid metabolic pathways represents an important focus in current therapeutic research for HCC.13–16
Long non-coding RNAs participate in tumor initiation, progression, and metastasis through regulation at multiple levels, including epigenetic, transcriptional, and translational mechanisms.17,18 Increasing attention has been directed toward their roles in metabolic reprogramming in cancer.19–21 Recent reports confirm that lncRNA-mediated metabolic regulation has emerged as a central research paradigm in cancer biology. For instance, cellular senescence-related lncRNA signatures have been shown to predict prognosis in osteosarcoma, highlighting the broad relevance of lncRNAs in tumor progression.22 Moreover, the lncRNA MALAT1 has been demonstrated to promote mitophagy via the miR-143-3p/RRM2 axis, further illustrating the diverse regulatory functions of lncRNAs in liver cancer metabolism.23 For example, lncRNA HCP5 has been reported to promote fatty acid oxidation through the miR-3619-5p/AMPK/PGC1α/CEBPB axis, thereby enhancing stemness and drug resistance in gastric cancer.24 LncRIM activates YAP signaling by inhibiting the NF2-LATS1 interaction, establishing a positive feedback loop within the iron-Hippo pathway and facilitating breast cancer progression.25
LncRNA small nucleolar RNA host gene 6 (SNHG6) has been reported to form a positive feedback loop with cholesterol, regulating lysosomal recruitment and activation of mTORC1 and thereby contributing to the progression of non-alcoholic fatty liver disease to HCC.26 SNHG6 directly binds to and stabilizes BOP1, promoting tumor glycolysis.27 Although prior studies have described that SNHG6 participates in cholesterol metabolism and glycolysis in HCC, its effects on fatty acid metabolism in HCC and the underlying mechanisms remain unclear.
In this study, the role of lncRNA SNHG6 in lipid metabolism in HCC was investigated. SNHG6 promotes lipid metabolic activity in HCC by inhibiting the AMPK signaling pathway, upregulating SREBP1 expression, and consequently increasing SCD expression. The findings indicated that the SNHG6/AMPK/SREBP1/SCD signaling axis was critical for HCC progression and may represent a potential therapeutic target for HCC.
Materials and Methods
Bioinformatics Analysis
Using the GEPIA2 database (http://gepia2.cancer-pku.cn/), which integrates TCGA and GTEx data, the SNHG6 and SCD expression levels between LIHC tumor tissues and normal liver tissues were analyzed. Survival analysis for SNHG6 in LIHC was also performed using GEPIA2, where patients were divided into high and low expression groups by the median cutoff, and the Kaplan–Meier method with the log rank test was applied.28 The TCGA-LIHC dataset from the UALCAN database (https://ualcan.path.uab.edu/) was used to analyze the SNHG6 and SCD expression levels between LIHC tumor tissues and normal liver tissues, as well as the correlation between SNHG6 expression level and the tumor grade of HCC.29 The TNMplot database (https://tnmplot.com/analysis/) was used to compare SCD expression levels between LIHC tumor tissues and normal liver tissues, and to analyze the correlation between SNHG6 and SCD expression levels in LIHC.30
Cell Culture and Transfection
HCC cell lines (Huh7 and LM3) were obtained from the Chinese Academy of Sciences Shanghai Cell Bank. The cells were cultured in Dulbecco’s modified Eagle’s medium (DMEM; Gibco, USA) supplemented with 10% fetal bovine serum (FBS; Gibco, USA) and 1% penicillin–streptomycin solution (Solarbio, Beijing). All cells were maintained in a humidified incubator at 37 °C with 5% CO2 and were tested for mycoplasma contamination using a mycoplasma detection kit (Beyotime, Shanghai). Small interfering RNA targeting SNHG6 (siRNA) was purchased from Shanghai GenePharma. SREBP1 and SCD overexpression plasmids were constructed by Zhejiang Shangya Biotechnology Co., Ltd. Transfection was performed using Lipofectamine 3000 (Thermo Fisher Scientific, USA), and RNA and protein samples were collected 48 hours after transfection. The targeting sequence for si-SNHG6#1 was 5′-CUGCUAGGUGCAAGAAAGC-3′. The targeting sequence for si-SNHG6#2 was 5′-GCUUCGUUACCUCAAGUGU-3′.
Quantitative Real-Time PCR
Total RNA was extracted from cells using an RNA extraction kit (Vazyme, Nanjing) and reverse-transcribed into cDNA using a cDNA reverse transcription kit (Tiangen, Beijing). The mRNA expression levels of the indicated genes were measured using a SYBR Green quantitative real-time PCR kit (Tiangen, Beijing). Data were analyzed using the ΔΔCt method, and relative expression levels were normalized to β-actin as an internal control. The primer sequences were as follows: SNHG6 forward: 5′-GCGGCATGTATTGAGCATATAG-3′ and SNHG6 reverse: 5′-CACTTGAGGTAACGAAGCAGAA-3′; SCD forward: 5′-TTCCCGACGTGGCTTTTTCT-3′ and SCD reverse: 5′-AGCCAGGTTTGTAGTACCTCC-3′; β-actin forward: 5′-CTCCATCCTGGCCTCGCTGT-3′ and β-actin reverse: 5′-GCTGTCACCTTCACCGTTCC-3′. QRT-PCR was performed with three independent biological replicates, each with three technical replicates.
Sequencing Analysis
Huh7 cells transfected with si-SNHG6#2 (experimental group) or si-NC (negative control group) were collected with six biological replicates per group and submitted to Hangzhou Lianchuan Biotechnology Co., Ltd. for RNA sequencing and non-targeted metabolomics analysis. For RNA sequencing, libraries were sequenced on an Illumina Novaseq™ X Plus platform. Differential expression analysis was performed using DESeq2 software with the median-of-ratios normalization method. Genes with false discovery rate (FDR) < 0.05 (Benjamini–Hochberg) and absolute fold change ≥ 2 (|log2 fold change| ≥ 1) were considered differentially expressed. For non-targeted metabolomics, raw data were processed by XCMS, followed by K-nearest neighbor imputation and probabilistic quotient normalization (PQN). Differential metabolites were identified by P < 0.05 (t-test), fold change > 1.2 or < 1/1.2, and VIP ≥ 1 from PLS-DA. KEGG enrichment analysis used hypergeometric test with P < 0.05.
Western Blotting
Total protein was extracted from cells using RIPA lysis buffer (Beyotime, Shanghai) and quantified using a BCA protein concentration assay kit (Beyotime, Shanghai). Proteins were separated by 10% SDS-PAGE and subsequently transferred onto PVDF membranes (Millipore, USA). The membranes were blocked with 5% skimmed milk and incubated overnight at 4 °C with primary antibodies.The primary antibodies used were as follows: SCD (1:500, Bioswamp, Wuhan, cat# PAB40111), SREBP1 (1:500, Bioswamp, Wuhan, cat# PAB39550), AMPK (1:500, Bioswamp, Wuhan, cat# PAB37943), p-AMPK (1:500, Bioswamp, Wuhan, cat# PAB53258), and β-actin (1:500, Bioswamp, Wuhan, cat# RMAB60261). The membranes were then incubated with secondary antibodies corresponding to the species of origin (1:5000, Bioswamp, Wuhan) at room temperature for 1 hour. Protein bands were visualized using BeyoECL Plus chemiluminescence solution (Beyotime, Shanghai). Western blotting was performed with three independent biological replicates. Protein expression was analyzed using Image J software (v1.48, NIH, Bethesda, MD) withβ-actin as a loading control.
Cell Proliferation Assay
Cell proliferative capacity was assessed using a CCK-8 kit (Beyotime, Shanghai). Transfected cells were seeded into 96-well plates and cultured overnight. At 0, 24, 48, 72, and 96 hours, 10 μL of CCK-8 reagent was added to each well, followed by incubation at 37 °C in the dark for 2 hours. Absorbance was subsequently measured at 450 nm. The assay was performed with three independent biological replicates, each containing three technical replicates. Statistical comparisons between groups across multiple time points were analyzed using two-way ANOVA followed by Sidak’s post hoc test.
Colony Formation Experiment
A total of 200 transfected cells were evenly seeded into each well of a 6-well plate and cultured for 2 weeks. The cells were then fixed with 4% paraformaldehyde and stained with 1% crystal violet solution (Beyotime, Shanghai) for approximately 15 minutes, followed by washing with phosphate-buffered saline (PBS). Cell colonies were subsequently counted and analyzed. The experiment was performed with three independent biological replicates.
Transwell Migration and Invasion Experiment
Cell migration and invasion capacities were assessed using a 24-well Transwell chamber system (Corning, USA). For the invasion assay, the upper chamber was pre-coated with 8% Matrigel (Beyotime, Shanghai). Transfected cells were resuspended in serum-free medium and seeded into the upper chamber. Medium containing 20% FBS was added to the lower chamber, and the cells were incubated at 37 °C for 72 hours. After 72 hours, non-migrated or non-invaded cells on the membrane surface were gently removed using a cotton swab. The membranes were rinsed twice with PBS and fixed with paraformaldehyde for 10 minutes. Following three washes with distilled water, the cells were stained with 0.1% crystal violet at room temperature for 30 minutes. Cells that had migrated or invaded through the membrane were observed and photographed using an inverted microscope. Each experiment was conducted with three independent biological replicates, and three randomly selected fields per membrane were counted.
LipidTOX Staining
Lipid droplets in cells were detected using LipidTOX staining. Cells were fixed with 4% paraformaldehyde and incubated with LipidTOX dye stock solution (Thermo Fisher, USA) diluted 1:1000 in PBS. The cells were incubated at room temperature in the dark for 30 minutes and subsequently washed with PBS two to three times in the dark. After removal of unbound dye, antifade mounting medium containing DAPI (Thermo Fisher, USA) was added dropwise. The cells were then observed and photographed using an inverted microscope. LipidTOX staining was repeated in three independent biological replicates. Quantification of LipidTOX fluorescence intensity was performed using ImageJ software, and the mean fluorescence intensity per cell was calculated from at least three randomly selected fields per replicate.
Triglyceride Content Detection
The TG content in cells was measured using a TG assay kit (Nanjing Jiancheng, Nanjing). All procedures were conducted in accordance with the manufacturer’s instructions. The assay was performed with three biological replicates, each with five technical replicates.
Statistical Analysis
Data analysis was performed using GraphPad Prism 9.0 software (San Diego, CA, USA). All data were presented as the means ± SD and were obtained from three independent experimental replicates (n = 3). All data were tested for normality using the Shapiro–Wilk test and for homogeneity of variance using Levene’s test. The unpaired two-tailed Student’s t-test was used for comparisons between two groups. One-way ANOVA followed by Tukey post-hoc test was used for comparisons among three or more groups. For the CCK-8 proliferation assay with multiple time points, two-way repeated-measures ANOVA with Sidak’s correction was used as described in section 2.4. A p value < 0.05 was considered to indicate a statistically significant difference.
Results
The SNHG6 Expression Was Upregulated in HCC Tissues and Was Associated with Poor Prognosis
Analysis of the GEPIA and UALCAN databases suggested that SNHG6 expression levels in HCC tissues were higher than those in normal tissues, and expression levels gradually increased with advancing tumor grade (Figure 1A–C). Elevated SNHG6 expression was positively associated with poor prognosis (Figure 1D and E).
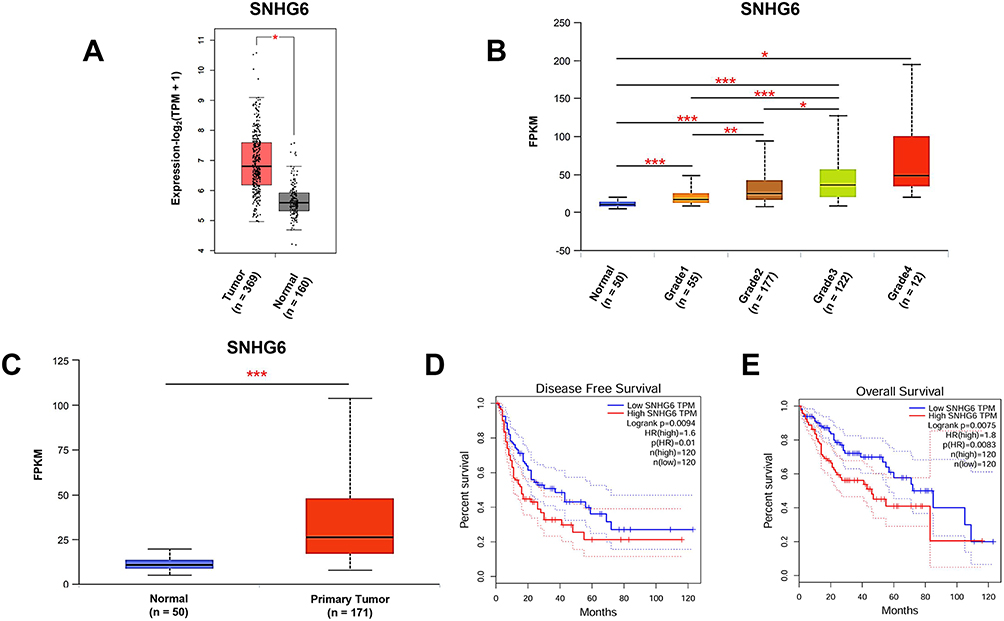 |
Figure 1 SNHG6 expression was upregulated in HCC and was associated with poor prognosis. (A) Differential expression analysis of SNHG6 between HCC tissues and normal tissues using the GEPIA (https://gepia.cancer-pku.cn/detail.php) databases. Statistical analysis was performed using one-way ANOVA followed by Tukey’s post-hoc test for multi-group comparison. *p < 0.05. (B) Evaluation of SNHG6 expression across tumor grades (1–4) using the UALCAN (https://ualcan.path.uab.edu/) databases. Statistical analysis was performed using one-way ANOVA followed by Tukey’s post-hoc test for multi-group comparison. *p < 0.05, **p < 0.01, ***p < 0.001. (C) Differential expression analysis of SNHG6 between HCC tissues and normal tissues using the UALCAN (https://ualcan.path.uab.edu/) databases. Statistical analysis was performed using one-way ANOVA followed by Tukey’s post-hoc test for multi-group comparison. ***p < 0.001. (D) Kaplan–Meier survival curves for disease-free survival stratified by relative SNHG6 expression levels using the GEPIA (https://gepia.cancer-pku.cn/detail.php) databases. The Log rank test was used for survival analysis. (E) Kaplan–Meier survival curves for overall survival stratified by relative SNHG6 expression levels using the GEPIA (https://gepia.cancer-pku.cn/detail.php) databases. The Log rank test was used for survival analysis. |
Multi-Omics Integration Analysis Indicated That SNHG6 Was Closely Related to Lipid Metabolism Reprogramming in HCC
To further investigate the biological function of SNHG6, SNHG6 was silenced in Huh7 and LM3 cells using siRNA, and transfection efficiency was confirmed by quantitative reverse transcription polymerase chain reaction (qRT-PCR) (Figure 2A). Huh7 NC and si-SNHG6#2 cells were selected for integrated transcriptomic sequencing and non-targeted metabolomics analyses. Transcriptomic sequencing demonstrated that, compared with negative control (NC) cells, suppression of SNHG6 expression resulted in significant downregulation of 175 genes (Figure 2B). Gene Ontology (GO) enrichment analysis of differentially expressed genes (DEGs) indicated a close association between SNHG6 and lipid metabolic processes. (Figure 2C).
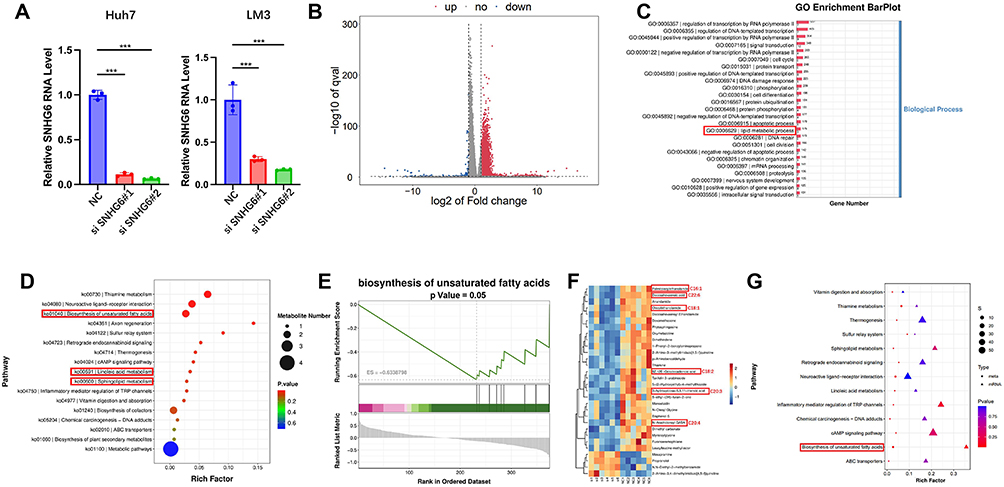 |
Figure 2 Multi-omics integration analysis indicated that SNHG6 was closely related to lipid metabolism reprogramming. (A) Huh7 and LM3 cells were transfected with SNHG6 siRNA, and SNHG6 mRNA expression levels were measured by qRT-PCR. Statistical significance was determined by one-way ANOVA followed by Tukey’s post-hoc test. ***p < 0.001. (B) RNA sequencing (RNA-seq) analysis of DEGs between Huh7 NC and si-SNHG6#2 cells, presented as a volcano plot (fold change > 2 or < 0.5, p < 0.05). Differential expression analysis was performed using DESeq2 software with the Benjamini-Hochberg correction for false discovery rate. (C) GO bar plot illustrating enriched pathways in Huh7 cells based on RNA-seq data. (D) KEGG enrichment analysis of metabolites. The scatter plot illustrates the most significantly altered metabolic pathways. (E) GSEA validating enrichment of the “biosynthesis of unsaturated fatty acids” pathway. (F) Heat map clustering of metabolites in Huh7 NC and si-SNHG6#2 cells based on non-targeted metabolomics. Significantly upregulated metabolites are indicated in red (FC ≥ 1, p < 0.05), and significantly downregulated metabolites are indicated in blue (FC ≤ −1, p < 0.05). Differential metabolites were identified by P < 0.05 (t-test), fold change > 1.2 or < 1/1.2, and VIP ≥ 1 from PLS-DA. (G) Integrated KEGG enrichment analysis combining transcriptomic and metabolomic data. The “biosynthesis of unsaturated fatty acids” pathway was significantly enriched (P < 0.05). Statistical significance was determined using the hypergeometric test. |
KEGG enrichment analysis of non-targeted metabolomics data demonstrated that lipid metabolism–related pathways, including “biosynthesis of unsaturated fatty acids,” “linoleic acid metabolism,” and “sphingolipid metabolism,” were significantly enriched following SNHG6 knockdown (Figure 2D). Consistently, GSEA revealed significant enrichment of the “biosynthesis of unsaturated fatty acids” pathway (Figure 2E). At the metabolite level, the concentrations of multiple unsaturated fatty acids, including palmitoleic acid (C16:1), docosahexaenoic acid (C22:6), and eichlerianic acid (C20:3), as well as their derivatives, were significantly reduced (Figure 2F). Furthermore, integrated KEGG enrichment analysis combining transcriptomic and metabolomic data also revealed significant enrichment of the “biosynthesis of unsaturated fatty acids” pathway (Figure 2G). These transcriptomic and metabolomic findings indicate that SNHG6 is involved in lipid metabolic reprogramming in HCC cells.
SNHG6 Promoted HCC Lipid Metabolism
LipidTOX staining demonstrated that lipid droplet content was significantly reduced in Huh7 and LM3 cells following SNHG6 knockdown (Figure 3A). Consistently, TG content was significantly decreased (Figure 3B). These findings indicate that SNHG6 promotes lipid accumulation in HCC cells. In parallel with the reduction in lipid levels, SNHG6 knockdown significantly suppressed proliferative capacity (Figure 3C), colony formation ability (Figure 3D), and migration and invasion capacities (Figure 3E and F) of HCC cells. Collectively, these results indicate that SNHG6 promotes proliferation and metastatic potential in HCC cells, at least in part, through the regulation of lipid metabolism.
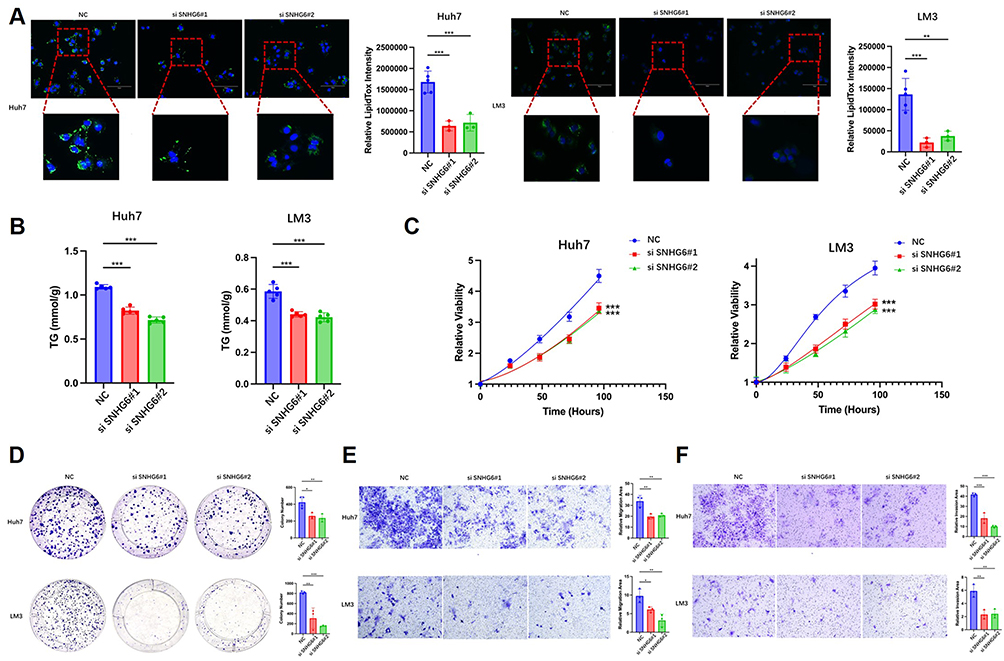 |
Figure 3 SNHG6 promoted lipid accumulation, proliferation, and metastasis in HCC cells. (A) Neutral lipid content in Huh7 and LM3 cells following SNHG6 knockdown was assessed using LipidTOX staining. Unpaired two-tailed Student’s t-test was used for comparison between groups. **p < 0.01, ***p < 0.001. (B) TG content in Huh7 and LM3 cells following SNHG6 knockdown was quantified. Unpaired two-tailed Student’s t-test was used for comparison between groups. ***p < 0.001. (C–F) CCK-8 assay (C), colony formation assay (D), Transwell migration assay (E), and invasion assay (F) were performed in Huh7 and LM3 cells following SNHG6 knockdown. For the CCK-8 assay (C), two-way repeated-measures ANOVA with Sidak’s post-hoc test was used for comparisons across multiple time points. For colony formation (D), Transwell migration (E), and invasion assays (F), unpaired two-tailed Student’s t-test was used. *p < 0.05, **p < 0.01, ***p < 0.001. |
SNHG6 Promoted HCC Lipid Metabolism Through SCD
KEGG and GSEA analyses of non-targeted metabolomics data demonstrated enrichment of the “biosynthesis of unsaturated fatty acids” pathway following SNHG6 knockdown (Figure 2F and G). From these findings, SCD, a key rate-limiting enzyme in this pathway, was further examined. Analysis of the GEPIA, UALCAN, and TNMplot public databases indicated that SCD expression in HCC tissues was significantly higher than that in normal hepatic tissues, and expression levels were positively correlated with tumor grade (Figure 4A–D). Scatter plot analysis further demonstrated a positive correlation between SNHG6 and SCD expression levels (Figure 4E). Subsequent qRT-PCR and Western blot analyses indicated that both SCD mRNA expression and SCD protein levels were significantly reduced following SNHG6 knockdown (Figure 4F and G). These findings suggest that SCD may represent a key downstream effector through which SNHG6 regulates lipid metabolism.To further clarify the relationship between SNHG6 and SCD, SCD was overexpressed in SNHG6-knockdown cells. Western blot analysis demonstrated that SCD protein expression was restored (Figure 4H). Overexpression of SCD partially reversed the inhibition of cell proliferation (Figure 4I) and the reduction in colony formation capacity (Figure 4J) induced by SNHG6 knockdown. In addition, Transwell assays indicated that SCD overexpression substantially reversed the suppression of cell migration and invasion observed following SNHG6 knockdown (Figure 4K and L). To further assess the role of SCD in lipid metabolism in HCC cells, LipidTOX staining and TG quantification were performed. The results demonstrated that SCD overexpression substantially restored the reduction in lipid droplet accumulation (Figure 4M) and TG content (Figure 4N) caused by SNHG6 knockdown. Collectively, these findings indicate that SCD overexpression substantially rescued the impaired proliferative capacity, metastatic potential, and lipid metabolic activity observed in SNHG6-silenced cells.
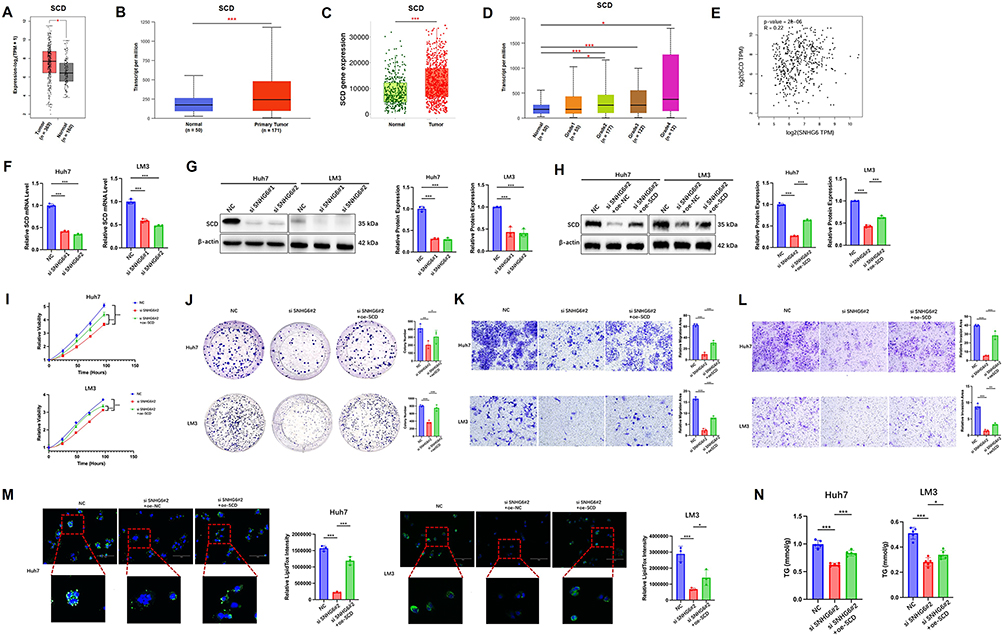 |
Figure 4 SCD was a key downstream effector molecule through which SNHG6 regulated lipid metabolism and malignant phenotypes in HCC. (A) Differential expression of SCD between HCC tissues and normal tissues was analyzed using the GEPIA (https://gepia.cancer-pku.cn/detail.php) databases. Statistical analysis was performed using the non-parametric Wilcoxon rank-sum test. *p < 0.05.(B). Differential expression of SCD between HCC tissues and normal tissues was analyzed using the UALCAN (https://ualcan.path.uab.edu/) databases. Statistical analysis was performed using the non-parametric Wilcoxon rank-sum test. ***p < 0.001.(C). Differential expression of SCD between HCC tissues and normal tissues was analyzed using the TNMplot (https://tnmplot.com/analysis/) databases. Statistical analysis was performed using the non-parametric Wilcoxon rank-sum test. ***p < 0.001.(D). Evaluation of SCD expression across tumor grades (1–4) using the UALCAN (https://ualcan.path.uab.edu/) databases. Statistical analysis was performed using the non-parametric Wilcoxon rank-sum test. *p < 0.05, ***p < 0.001.(E). Correlation analysis of SNHG6 and SCD expression in HCC based on data from the GEPIA database. Correlation was analyzed using Spearman’s rank correlation test.(F). SCD mRNA expression levels in Huh7 and LM3 cells following SNHG6 knockdown, as determined by qRT-PCR. Unpaired two-tailed Student’s t-test was used for comparison between groups. ***p < 0.001.(G). Western blot analysis of SCD protein expression in Huh7 and LM3 cells following SNHG6 knockdown. Unpaired two-tailed Student’s t-test was used for comparison between groups. ***p < 0.001. (H) Western blot analysis of SCD protein expression in si-SNHG6 Huh7 and LM3 cells with or without transfection of SCD overexpression plasmids. Unpaired two-tailed Student’s t-test was used for comparison between groups. ***p < 0.001.(I-L). CCK-8 assay (I), colony formation assay (J), Transwell migration assay (K), and invasion assay (L) in si-SNHG6 Huh7 and LM3 cells with or without SCD plasmid transfection. Two-way repeated-measures ANOVA with Sidak’s post-hoc test was used for comparisons across multiple time points. Unpaired two-tailed Student’s t-test was used for comparison between groups. *p < 0.05, **p < 0.01, ***p < 0.001.(M). Neutral lipid content in si-SNHG6 Huh7 and LM3 cells with or without SCD plasmid transfection, assessed by LipidTOX staining. Unpaired two-tailed Student’s t-test was used for comparison between groups. *p < 0.05, ***p < 0.001.(N). TG content in si-SNHG6 Huh7 and LM3 cells with or without SCD plasmid transfection. Unpaired two-tailed Student’s t-test was used for comparison between groups. *p < 0.05, ***p < 0.001. |
SNHG6 Played a Role Through the AMPK/SREBP1/SCD Axis
RNA sequencing analysis indicated involvement of the AMPK signaling pathway (Figure 5A). AMPK is a recognized energy sensor that maintains cellular energy homeostasis by coordinating processes including lipogenesis, glycolysis, and mitochondrial dynamics.31 Prior studies have demonstrated that AMPK regulates downstream lipogenic gene expression through the transcription factor SREBP1.32,33 To further elucidate the molecular mechanism by which SNHG6 participates in lipid metabolism, protein expression levels of p-AMPK, AMPK, and SREBP1 were examined. The phosphorylation level of AMPK was significantly increased following SNHG6 knockdown (Figure 5B), indicating activation of the AMPK pathway. SNHG6 knockdown significantly reduced SREBP1 protein expression (Figure 5B).
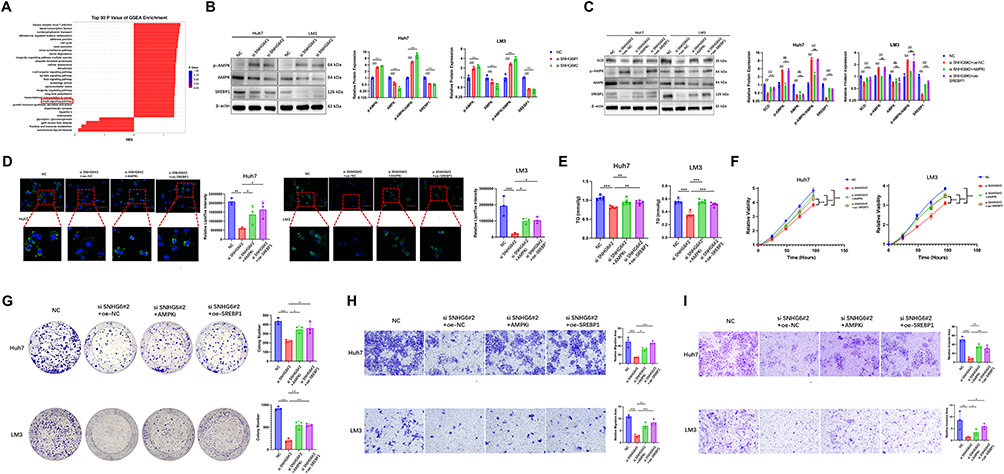 |
Figure 5 SNHG6 regulated lipid metabolism and progression in HCC through the AMPK/SREBP1/SCD signaling axis (A). Top 30 pathways ranked by significance in GSEA based on RNA-seq data. Statistical significance was determined using the hypergeometric test. (B) Western blot analysis of AMPK, p-AMPK, and SREBP1 protein expression in Huh7 and LM3 cells following SNHG6 knockdown. Unpaired two-tailed Student’s t-test was used for comparison between groups. ***p < 0.001. (C) Western blot analysis of AMPK, p-AMPK, and SREBP1 protein expression in si-SNHG6 Huh7 and LM3 cells treated with 10 μM Compound C for 24 h or transfected with SREBP1 overexpression plasmids. Unpaired two-tailed Student’s t-test was used for comparison between groups. ***p < 0.001. (D) Neutral lipid content in si-SNHG6 Huh7 and LM3 cells treated with 10 μM Compound C for 24 h or transfected with SREBP1 plasmids, assessed using LipidTOX staining. Unpaired two-tailed Student’s t-test was used for comparison between groups. *p < 0.05, **p < 0.01, ***p < 0.001. (E) TG content in si-SNHG6 Huh7 and LM3 cells treated with 10 μM Compound C for 24 h or transfected with SREBP1 plasmids. Unpaired two-tailed Student’s t-test was used for comparison between groups. **p < 0.01, ***p < 0.001. (F–I) CCK-8 assay (F), colony formation assay (G), Transwell migration assay (H), and invasion assay (I) performed in Huh7 and LM3 cells treated with 10 μM Compound C for 24 h or transfected with SREBP1 plasmids. Two-way repeated-measures ANOVA with Sidak’s post-hoc test was used for comparisons across multiple time points. Unpaired two-tailed Student’s t-test was used for comparison between groups. *p < 0.05, **p < 0.01, ***p < 0.001. |
Following treatment with the AMPK inhibitor Compound C, AMPK phosphorylation levels decreased, and SCD and SREBP1 protein expression levels were restored (Figure 5C). Consistently, the reduction in lipid droplet accumulation (Figure 5D) and TG content (Figure 5E) induced by SNHG6 knockdown was reversed after Compound C treatment. Compound C treatment alleviated the suppression of proliferative capacity (Figure 5F), colony formation ability (Figure 5G), and migration and invasion capacities (Figure 5H and I) caused by SNHG6 knockdown. These findings indicate that SNHG6 upregulates SCD expression and modulates lipid metabolism, cellular proliferation, and metastatic potential through the AMPK signaling pathway.
To further elucidate the role of SREBP1, SREBP1 was overexpressed in SNHG6-knockdown cells. Overexpression of SREBP1 restored SCD protein expression (Figure 5C) and reversed the reduction in lipid levels (Figure 5D and E), as well as the suppression of proliferative capacity, colony formation ability, and migration and invasion capacities induced by SNHG6 knockdown (Figure 5F–I).
In summary, these findings indicate that SNHG6 attenuated AMPK-mediated inhibition of the transcription factor SREBP1, thereby upregulating SCD expression and promoting lipid metabolism in HCC.
Discussion
HCC ranks seventh in global incidence and third in cancer-related mortality worldwide.34,35 In China, HCC represents one of the leading malignancies in both incidence and mortality. Early-stage disease is frequently asymptomatic, and as a result, many patients with HCC are diagnosed at intermediate or advanced stages. Current therapeutic approaches demonstrate limited efficacy and are often complicated by the development of drug resistance.36–39 Therefore, the identification of novel therapeutic targets and the development of effective treatment strategies for patients with HCC remain urgent clinical priorities.
Dysregulated lipid metabolism represents a prominent metabolic characteristic of HCC.40 Targeting lipid metabolic pathways has emerged as an important direction in current HCC therapeutic research.41,42 The current findings indicate that the lncRNA SNHG6 plays a key role in lipid metabolic reprogramming in HCC. The data suggested that SNHG6 expression was associated with tumor stage in patients with HCC and correlated with poor prognosis, and that SNHG6 expression was positively correlated with SCD. SNHG6 promoted lipid metabolism in HCC by upregulating SCD expression, thereby facilitating HCC progression. Mechanistically, SNHG6 knockdown activated the AMPK signaling pathway, resulting in suppression of the key lipogenic regulatory factor SREBP1. These findings support the involvement of a potential SNHG6/AMPK/SREBP1/SCD signaling axis, although direct molecular interactions have not been established. LncRNA SNHG6 (small nucleolar RNA host gene 6) is highly expressed in several malignant tumors, including HCC, colorectal cancer, and breast cancer, and is predominantly localized in the cytoplasm. Tumor progression has been reported to occur through multiple mechanisms.43–45 Prior studies have demonstrated that SNHG6 regulates cholesterol and glucose metabolism in HCC, thereby contributing to tumor initiation and progression.26,27 In this study, integrated transcriptomic and metabolomic analyses showed that SNHG6 was closely associated with the biosynthetic pathway of unsaturated fatty acids. Following SNHG6 knockdown, significant reductions were observed in intracellular neutral lipid droplets, TG levels, and unsaturated fatty acid levels. Further investigation suggested that SNHG6 upregulated SCD expression through the AMPK/SREBP1 axis, thereby modulating lipid metabolic reprogramming in HCC.
The present findings suggest that SCD functions as a key downstream effector of SNHG6. SCD encodes a rate-limiting enzyme in de novo fatty acid synthesis that catalyzes the conversion of saturated fatty acids into corresponding monounsaturated fatty acids.46 Aberrant overexpression of SCD has been reported in multiple tumor types. In the tumor microenvironment, SCD protein responds to changes in extracellular matrix stiffness, increases the proportion of unsaturated fatty acids, and enhances plasma membrane fluidity, thereby promoting cancer cell proliferation and metastasis,47,48 as well as inhibiting apoptosis and ferroptosis.49,50 The present results indicated that silencing of SNHG6 inhibited HCC cell proliferation, metastatic capacity, and lipid accumulation, whereas SCD overexpression reversed the suppressive effects of SNHG6 knockdown on HCC cell proliferation, metastasis, and lipid metabolism. These findings are consistent with the notion that SCD serves as a functional mediator linking SNHG6 to lipogenic regulation. It should be acknowledged that cellular metabolism is a highly complex process involving numerous genes; therefore, the possibility that SNHG6 regulates lipid metabolism through additional targets beyond SCD cannot be excluded.
Mechanistically, a close association between SNHG6 and the AMPK signaling pathway was identified. The AMPK pathway functions as a cellular energy sensor and central regulator of metabolic homeostasis and can suppress metabolic processes such as fatty acid synthesis through inhibition of the transcription factor SREBP1.51,52 The present results showed that SNHG6 knockdown significantly increased AMPK phosphorylation and reduced downstream SREBP1 protein expression. Treatment with the AMPK inhibitor Compound C or exogenous overexpression of SREBP1 restored the downregulated SCD expression, reversed the reduction in lipid levels, and alleviated the suppression of cell proliferation and metastatic capacity induced by SNHG6 knockdown. These results suggest that SNHG6-mediated upregulation of SCD is dependent on the AMPK/SREBP1 signaling axis. However, it should be noted that the current results do not prove a direct interaction between SNHG6 and AMPK or SREBP1. Additionally, potential off-target effects of siRNAs and Compound C cannot be ruled out, which is a limitation of the present study.” Furthermore, formal statistical power analysis was not performed; however, the sample size (three independent biological replicates per group) was determined based on previous studies in the field and was sufficient to detect the reported statistically significant differences (p < 0.05).
As lipogenesis is relatively inactive in normal cells, targeting lipogenic enzymes and their associated signaling pathways has been considered a promising strategy for the development of novel anticancer therapies.53 Currently, small molecules capable of activating AMPK have been assessed in preclinical cancer models. For example, canagliflozin activates AMPK and inhibits the progression of prostate and lung cancers.54 Combined treatment with salicylate and metformin has been reported to suppress de novo lipid synthesis, thereby reducing cancer cell survival.55 Inhibitors of SCD, including A939572, CVT-1127, MF-438, and CAY10566, have demonstrated antitumor activity in preclinical studies across various cancer types.46 Our study has so far been based on in vitro experiments. Therefore, whether the SNHG6/AMPK/SREBP1/SCD axis can serve as a therapeutic target for HCC remains highly speculative at this stage. Future studies using animal models and clinical samples are required to evaluate the therapeutic potential of this pathway in HCC.
Conclusion
The findings suggest that lncRNA SNHG6 may play a key role in lipid metabolic reprogramming in HCC and point to a possible SNHG6/AMPK/SREBP1/SCD signaling axis.
Abbreviations
HCC, hepatocellular carcinoma; SNHG6, small nucleolar RNA host gene 6; lncRNA, long non-coding RNA; SCD, stearoyl-CoA desaturase; SREBP1, sterol regulatory element-binding protein 1; ACLY, ATP citrate lyase; ACC, acetyl-CoA carboxylase; FASN, fatty acid synthase; siRNA, small interfering RNA; qRT-PCR, quantitative real-time PCR; RNA-seq, RNA-sequencing; SFAs, saturated fatty acids; UFAs, unsaturated fatty acids; GEPIA, Gene Expression Profiling Interactive Analysis; UALCAN, University of ALabama at Birmingham Cancer data analysis Portal; TG, triglyceride; AMPK, Adenosine Monophosphate-Activated Protein Kinase; p-AMPK, Phosphorylated Adenosine Monophosphate-Activated Protein Kinase.
Data Sharing Statement
The datasets used or analysed during the current study are available from the corresponding author on reasonable request.
Ethics Approval and Consent to Participate
This study used commercially available cell lines and publicly available databases. All experiments were evaluated and approved by the Ethics Committee of Quzhou People’s Hospital (Approval No. 060, 2022).
Funding
This research received funding from the science and technology planning project of Quzhou (Grant No. 2022K106 and Grant No. 2022K63).
Disclosure
The authors declare that they have no conflicts of interest regarding this work.
References
1. Cheng H, Wang M, Su J, et al. Lipid metabolism and Cancer. Life. 2022;12(6):784. doi:10.3390/life12060784
2. Wang W, Wang C, Xu H, Gao Y. Aldehyde Dehydrogenase, liver disease and cancer. Int J Biol Sci. 2020;16:921–12. doi:10.7150/IJBS.42300
3. Xiao Q, Xia M, Tang W, Zhao H, Chen Y, Zhong J. The lipid metabolism remodeling: a hurdle in breast cancer therapy. Cancer Lett. 2024;582:216512. doi:10.1016/J.CANLET.2023.216512
4. Moholkar DN, Kandimalla R, Gupta RC, Aqil F. Advances in lipid-based carriers for cancer therapeutics: liposomes, exosomes and hybrid exosomes. Cancer Lett. 2023;565:216220. doi:10.1016/j.canlet.2023.216220
5. Martin-Perez M, Urdiroz-Urricelqui U, Bigas C, Benitah SA. The role of lipids in cancer progression and metastasis. Cell Metabol. 2022;34(11):1675–1699.
6. Yang WS, Zeng XF, Liu ZN, et al. Diet and liver cancer risk: a narrative review of epidemiological evidence, Br. J Nutr. 2020;124:330–340. doi:10.1017/S0007114520001208
7. Munir R, Lisec J, Swinnen JV, Zaidi N. Lipid metabolism in cancer cells under metabolic stress. Br. J. Cancer. 2019;120:1090–1098. doi:10.1038/s41416-019-0451-4
8. Bian X, Liu R, Meng Y, Xing D, Xu D, Lu Z. Lipid metabolism and cancer. J Exp Med. 2021;218(1). doi:10.1084/jem.20201606
9. Li Y, Wu S, Zhao X, et al. Key events in cancer: dysregulation of SREBPs. Front Pharmacol. 2023;14:1130747. doi:10.3389/fphar.2023.1130747
10. He Y, Qi S, Chen L, et al. The roles and mechanisms of SREBP1 in cancer development and drug response. Genes Dis. 2024;11(4):100987. doi:10.1016/j.gendis.2023.04.022
11. Meng H, Shen M, Li J, et al. Novel SREBP1 inhibitor cinobufotalin suppresses proliferation of hepatocellular carcinoma by targeting lipogenesis. Eur J Pharmacol. 2021;906:174280. doi:10.1016/j.ejphar.2021.174280
12. Su F, Koeberle A. Regulation and targeting of SREBP-1 in hepatocellular carcinoma. Cancer Metastasis Rev. 2023;43(2):673–708. doi:10.1007/s10555-023-10156-5
13. An Q, Lin R, Wang D, Wang C. Emerging roles of fatty acid metabolism in cancer and their targeted drug development. Eur J Med Chem. 2022;240:114613. doi:10.1016/j.ejmech.2022.114613
14. Ping P, Li J, Lei H, Xu X. Fatty acid metabolism: a new therapeutic target for cervical cancer. Front Oncol. 2023;13:1111778. doi:10.3389/fonc.2023.1111778
15. Xu H, Chen Y, Gu M, et al. Fatty acid metabolism reprogramming in advanced prostate Cancer. Metabolites. 2021;11(11):765. doi:10.3390/metabo11110765
16. Liu Q, Luo Q, Halim A, Song G. Targeting lipid metabolism of cancer cells: a promising therapeutic strategy for cancer. Cancer Lett. 2017;401:39–45. doi:10.1016/j.canlet.2017.05.002
17. Yao RW, Wang Y, Chen LL. Cellular functions of long noncoding RNAs. Nat Cell Biol. 2019;21:542–551. doi:10.1038/s41556-019-0311-8
18. Bhan A, Soleimani M, S.s M. Long noncoding RNA and cancer: a newparadigm. Cancer Res. 2017;3965–3981.
19. Khan A, Zhang X. Function of the long noncoding RNAs in hepatocellularcarcinoma: classification, molecular mechanisms, and significant therapeuticpotentials. 2022.
20. Klingenberg M, Matsuda A, Diederichs S, Patel T. Non-coding RNA inhepatocellular carcinoma: mechanisms, biomarkers and therapeutic targets. J Hepatol. 2017;67(67):603–618. doi:10.1016/j.jhep.2017.04.009
21. Xu K, Xia P, Gongye X, et al. A novel lncRNA RP11-386G11.10 reprograms lipid metabolism to promote hepatocellular carcinoma progression. Mol Metab. 2022;63:101540. doi:10.1016/j.molmet.2022.101540
22. Zhao P, Chang JL, Chen YK, et al. Cellular senescence-related long non-coding rna signatures predict prognosis in juvenile osteosarcoma. Phenomics. 2024;4(5):430–452. doi:10.1007/s43657-023-00132-y
23. Feng CY, Cai CS, Shi XQ, Zhang ZJ, Su D, Qiu YQ. Resveratrol promotes mitophagy via the MALAT1/miR-143–3p/RRM2 axis and suppresses cancer progression in hepatocellular carcinoma. J Integr Med. 2025;23(1):79–92. doi:10.1016/j.joim.2024.11.003
24. Wu H, Liu B, Chen Z, Li G, Zhang Z. MSC-induced lncRNA HCP5 drove fatty acid oxidation through miR-3619-5p/AMPK/PGC1alpha/CEBPB axis to promote stemness and chemo-resistance of gastric cancer. Cell Death Dis. 2020;11(4):233. doi:10.1038/s41419-020-2426-z
25. He X-Y, Fan X, Qu L. LncRNA modulates Hippo-YAP signaling to reprogram iron metabolism. Nat Commun. 2023;14:2253. doi:10.1038/s41467-023-37871-5
26. Liu F, Tian T, Zhang Z, et al. Long non-coding RNA SNHG6 couples cholesterol sensing with mTORC1 activation in hepatocellular carcinoma. Nat Metab. 2022;4(8):1022–1040. doi:10.1038/s42255-022-00616-7
27. Chen K, Wang X, Wei B, Sun R, Wu C, Yang H-J. LncRNA SNHG6 promotes glycolysis reprogramming in hepatocellular carcinoma by stabilizing the BOP1 protein. Anim Cells Syst. 2022;26(6):369–379. doi:10.1080/19768354.2022.2134206
28. Tang Z, Kang B, Li C, Chen T, Zhang Z. GEPIA2: an enhanced web server for large-scale expression profiling and interactive analysis. Nucleic Acids Res. 2019;47(W1):W556–W560. doi:10.1093/nar/gkz430
29. Chandrashekar DS, Karthikeyan SK, Korla PK, et al. UALCAN: an update to the integrated cancer data analysis platform. Neoplasia. 2022;25:18–27. doi:10.1016/j.neo.2022.01.001
30. Bartha Á, Győrffy B. TNMplot.com: a web tool for the comparison of gene expression in normal,tumor and metastatic tissues. Int J Mol Sci. 2021;22(5):2622. doi:10.3390/ijms22052622
31. Hsu C-C, Peng D, Cai Z, Lin H-K. AMPK signaling and its targeting in cancer progression and treatment. Semin Cancer Biol. 2022;85:52–68. doi:10.1016/j.semcancer.2021.04.006
32. Liu Y, Sun Z, Dong R, et al. Rutin ameliorated lipid metabolism dysfunction of diabetic NAFLD via AMPK/SREBP1 pathway. Phytomedicine. 2024;126:155437. doi:10.1016/j.phymed.2024.155437
33. Lu L, Hu X, Han Y, et al. ENPP2 promotes progression and lipid accumulation via AMPK/SREBP1/FAS pathway in chronic lymphocytic leukemia. Cell Mol Biol Lett. 2024;29(1):159. doi:10.1186/s11658-024-00675-6
34. Sung H, Ferlay J, Siegel RL, et al. Global Cancer Statistics 2020: GLOBOCAN Estimates of Incidence and Mortality Worldwide for 36 Cancers in 185 Countries. CA Cancer J Clin. 2021;71(3):209–249. doi:10.3322/caac.21660
35. Bray F, Ferlay J, Soerjomataram I, Siegel RL, Torre LA, Jemal A. Global cancerstatistics 2018: GLOBOCAN estimates of incidence and mortality worldwide for 36cancers in 185 countries. Ca -Cancer J Clin. 2018;68:394–424. doi:10.3322/caac.21492
36. Harding JJ, Khalil DN, Abou-Alfa GK. Biomarkers: what Role Do They Play (If Any) for Diagnosis, Prognosis and Tumor Response Prediction for Hepatocellular Carcinoma? Dig Dis Sci. 2019;64(4):918–927. doi:10.1007/s10620-019-05517-6
37. Z L. 2. Jy, Hepatocellular carcinoma: current situation and challenge, Hepatobiliary Pancreat Dis. Int: HBPD INT. 2019;18:303–304.
38. Bao MH, Wong CC. Metabolic reprogramming, and drug resistance in liver cancer. Cells. 2021;10(7):1715. doi:10.3390/cells10071715
39. Tang W, Chen Z, Zhang W, et al. The mechanisms of sorafenib resistance in hepatocellular carcinoma: theoretical basis and therapeutic aspects. Signal Transduct Target Ther. 2020;5(1):87. doi:10.1038/s41392-020-0187-x
40. Ward PS, Thompson CB. Metabolic reprogramming: a cancer hallmark evenwarburg did not anticipate. Canc.Cell. 2012;21:297–308.
41. Cao LQ, Xie Y, Fleishman JS, Liu X, Chen ZS. Hepatocellular carcinoma and lipid metabolism: novel targets and therapeutic strategies. Cancer Lett. 2024;597:217061. doi:10.1016/j.canlet.2024.217061
42. Feng J, Dai W, Mao Y, et al. Simvastatin re-sensitizes hepatocellular carcinoma cells to sorafenib by inhibiting HIF-1α/PPAR-γ/PKM2-mediated glycolysis. J Exp Clin Cancer Res. 2020;39(1):24. doi:10.1186/s13046-020-1528-x
43. Liu C, Zhou X, Zeng H, et al. Liu L.endoplasmic reticulum stress potentiates the immunosuppressive microenvironment in hepatocellular carcinoma by promoting the release of snhg6-enriched small extracellular vesicles. Cancer Immunol Res. 2024;12(9):1184–1201. doi:10.1158/2326-6066.CIR-23-0469
44. Wang H, Ma P, Liu P, Guo D, Liu Z, Zhang Z. lncRNA SNHG6 promotes hepatocellular carcinoma progression by interacting with HNRNPL/PTBP1 to facilitate SETD7/LZTFL1 mRNA destabilization. Cancer Lett. 2021;520:121–131. doi:10.1016/j.canlet.2021.07.009
45. Wang YQ, Huang G, Chen J, Cao H, Xu WT. LncRNA SNHG6 promotes breast cancer progression and epithelial-mesenchymal transition via miR-543/LAMC1 axis. Breast Cancer Res Treat. 2021;188(1):1–14.PMID: 33782812. doi:10.1007/s10549-021-06190-y
46. Sen U, Coleman C, Sen T. Stearoyl coenzyme A desaturase-1: multitasker in cancer, metabolism, and ferroptosis. Trends Cancer. 2023;9:480–489. doi:10.1016/j.trecan.2023.03.003
47. Liu -H-H, Xu Y, Li C-J. An SCD1-dependent mechanoresponsive pathway promotes HCC invasion and metastasis through lipid metabolic reprogramming. Mol Ther. 2022;30(7):2554–2567. doi:10.1016/j.ymthe.2022.03.015
48. Han C, Hu C, Liu T, et al. IGF2BP3 enhances lipid metabolism in cervical cancer by upregulating the expression of SCD. Cell Death Dis. 2024;15(2):138. doi:10.1038/s41419-024-06520-0
49. Viswanathan VS, Ryan MJ, Dhruv HD, et al. Dependency of a therapy-resistant state of cancer cells on a lipid peroxidase pathway. Nature. 2017;547:453–457. doi:10.1038/nature23007
50. Tesfay L, Paul BT, Konstorum A, et al. Stearoyl-CoA desaturase 1 protects ovarian cancer cells from ferroptotic cell death. Cancer Res. 2019;79:5355–5366. doi:10.1158/0008-5472.CAN-19-0369
51. Keerthana CK, Rayginia TP, Shifana SC, et al. The role of AMPK in cancer metabolism and its impact on the immunomodulation of the tumor microenvironment. Front Immunol. 2023;14:1114582. doi:10.3389/fimmu.2023.1114582
52. V L Sodi 1, Z A Bacigalupa 1, C M Ferrer 1, J V Lee 2, W A Gocal 1, D Mukhopadhyay 1, K E Wellen 2, M Ivan 3, M J Reginato 1 Nutrient sensor O-GlcNAc transferase controls cancer lipid metabolism via SREBP-1 regulation Oncogene. 37(7):924–934.
53. Lally JSV, Ghoshal S, DePeralta DK. Inhibition of Acetyl-CoA Carboxylase by Phosphorylation or the Inhibitor ND-654 Suppresses Lipogenesis and Hepatocellular Carcinoma. Cell Metab. 2019;29(1):174–182e5. doi:10.1016/j.cmet.2018.08.020
54. Villani LA, Smith BK, Marcinko K, et al. The diabetes medication Canagliflozin reduces cancer cell proliferation by inhibiting mitochondrial complex-I supported respiration. Mol Metab. 2016;5(10):1048–1056. doi:10.1016/j.molmet.2016.08.014
55. O’Brien AJ, Villani LA, Broadfield LA, et al. Salicylate activates AMPK and synergizes with metformin to reduce the survival of prostate and lung cancer cells ex vivo through inhibition of de novo lipogenesis. Biochem J. 2015;469(2):177–187. doi:10.1042/BJ20150122
 © 2026 The Author(s). This work is published and licensed by Dove Medical Press Limited. The
full terms of this license are available at https://www.dovepress.com/terms
and incorporate the Creative Commons Attribution
- Non Commercial (unported, 4.0) License.
By accessing the work you hereby accept the Terms. Non-commercial uses of the work are permitted
without any further permission from Dove Medical Press Limited, provided the work is properly
attributed. For permission for commercial use of this work, please see paragraphs 4.2 and 5 of our Terms.
© 2026 The Author(s). This work is published and licensed by Dove Medical Press Limited. The
full terms of this license are available at https://www.dovepress.com/terms
and incorporate the Creative Commons Attribution
- Non Commercial (unported, 4.0) License.
By accessing the work you hereby accept the Terms. Non-commercial uses of the work are permitted
without any further permission from Dove Medical Press Limited, provided the work is properly
attributed. For permission for commercial use of this work, please see paragraphs 4.2 and 5 of our Terms.
Recommended articles
Dihydroartemisinin: A Promising Therapeutic Agent Against the Hepatitis-to-Hepatocellular Carcinoma Cascade
Wang T, Jiang W, Li J, Ma J, Zhang Y, Zheng J, Chen J, Wen Y, Ma X, Zeng J
Drug Design, Development and Therapy 2025, 19:11145-11162
Published Date: 15 December 2025