Back to Journals » International Journal of Chronic Obstructive Pulmonary Disease » Volume 11 » Issue 1
Small pulmonary vascular alteration and acute exacerbations of COPD: quantitative computed tomography analysis
Authors Wang Z, Chen X, Liu K, Xie W, Wang H, Wei Y, Tang L, Zhu Y
Received 12 May 2016
Accepted for publication 2 July 2016
Published 22 August 2016 Volume 2016:11(1) Pages 1965—1971
DOI https://doi.org/10.2147/COPD.S112651
Checked for plagiarism Yes
Review by Single anonymous peer review
Peer reviewer comments 3
Editor who approved publication: Prof. Dr. Richard Russell
Zhiyue Wang,1,* Xuesong Chen,2,* Kouying Liu,2 Weiping Xie,2 Hong Wang,2 Yongyue Wei,3 Lijun Tang,1 Yinsu Zhu1
1Department of Radiology, 2Department of Respiratory, The First Affiliated Hospital of Nanjing Medical University, 3Department of Biostatistics, School of Public Health, Nanjing Medical University, Nanjing, People’s Republic of China
*These authors contributed equally to this work
Abstract: The morphologic alterations of pulmonary small vessels measured by computed tomography (CT) have been used to evaluate chronic obstructive pulmonary disease (COPD). However, the relationship between small pulmonary vascular alteration and acute exacerbations of COPD (AECOPD) is not well understood. The aim of this study was to evaluate the cross-sectional area (CSA) of small pulmonary vessel alterations measured on CT images and investigate its relationship with the COPD severity staged by the degree of airflow limitation and the occurrence of AECOPD. We retrospectively reviewed CT scans, clinical characteristics, and pulmonary function test results of 153 patients with COPD. All the patients were divided into AECOPD and non-AECOPD group according to the COPD staging and pulmonary function test results. The percentages of the total CSA less than 5 mm2 and equal to 5–10 mm2 over the lung area (%CSA<5 and %CSA5–10, respectively) were measured. The %CSA<5 steadily decreased in relation to the increase of COPD severity. In addition, %CSA<5 of the AECOPD group was significantly lower than that of the non-AECOPD group (0.41±0.13 versus 0.68±0.18, P<0.001), and the optimal cutoff value was 0.56 (sensitivity, 0.863; specificity, 0.731). Therefore, small pulmonary vascular alteration, as measured by %CSA<5, could indicate not only the degree of COPD severity, but also the occurrence of AECOPD.
Keywords: acute exacerbation of chronic obstructive pulmonary disease, computed tomography, cross-sectional area of small pulmonary vessels
Introduction
Chronic obstructive pulmonary disease (COPD) is characterized by persistent airflow limitation that is not fully reversible.1–3 Acute exacerbations of COPD (AECOPD) are critical events in the natural history of the disease and are associated with accelerated loss of lung function and poor quality of life.1,4 Pulmonary vascular disease and cardiovascular disease often coexist with COPD and have major effects on its disease course.5
Pulmonary vascular alteration is one of the characteristic features of COPD, and the major alteration is considered to be passive vascular compression by emphysema and hypoxic vasoconstriction.6 COPD can cause a diminished ability to dilate small pulmonary vessels and thickening of the vascular walls, which result in a decrease of the lumen size and a decreased proportion of small pulmonary vessels.7,8 Pulmonary vascular alteration is an important risk factor for exacerbations and death in COPD.9
The technological improvement of high-resolution computed tomography (CT) has made it possible to measure the cross-sectional area (CSA) of small pulmonary vessels and to evaluate small pulmonary vascular alteration in COPD patients.7,8,10 It was found that the percentage of the total CSA (%CSA) strongly correlated with the severity of certain clinical conditions,7,11 such as the mean pulmonary arterial pressure12 and pulmonary perfusion10 in COPD patients. However, whether %CSA could reflect the severity of COPD staged by the degree of airflow limitation and the existence of AECOPD was still unclear. Since a proportion of patients who have more times of AECOPD might suffer from a more severe phase,13,14 early diagnosis and treatments are urgent. We hypothesized that the small pulmonary vascular alteration as measured by %CSA on CT images could indicate the severity of COPD, and it would be associated with the occurrence of AECOPD.
Materials and methods
Study population
We reviewed 205 patients diagnosed with COPD who had undergone both a noncontrast chest CT and pulmonary function tests (PFTs) from March 2014 to December 2015. The diagnostic criteria of COPD were forced expiratory volume in 1 second (FEV1)/forced vital capacity (FVC) after inhaling bronchodilators in PFTs less than 70%. Totally, 52 patients were excluded according to the following criteria: image noise that prevented image analysis (33 patients) and obvious severe lung lesions such as lung cancer, pulmonary tuberculosis, and severe infection (19 patients). Finally, 153 patients were enrolled in this study. Sex-matched and age-matched control group comprised 154 subjects who underwent noncontrast chest CT but were free from a clinical diagnosis of COPD, heart failure, coronary heart disease, and previous lung resection. The following were the reasons why they did chest CT: to exclude lung cancer as the elevation of tumor biomarker, to regularly follow up for lung nodules, and to exclude pulmonary metastasis when other tumor existed. This study was approved by Ethics Committee of the First Affiliated Hospital of Nanjing Medical University. As all examinations were noninterventional, the need for patients to sign informed consent was waived by the ethics committee.
CT examination
All the subjects were scanned with 16-slice spiral CT scanner (SOMATOM Emotion 16; Siemens, Germany). The CT scan parameters included: mean tube voltage 120 kV, tube current 120 mA, and the reconstruction slice thickness 1.5 mm. During the scan, the subjects were in a supine position, and they held their breath after a full inspiration.
CT measurement of small pulmonary vessels
To measure the CSA of small pulmonary vessels, three CT slices were selected. According to some previous studies,7,8,12 the upper, middle, and lower slices were taken 1 cm above the upper margin of the aortic arch, 1 cm below the carina, and 1 cm below the right inferior pulmonary vein, respectively. These images were analyzed with a semiautomatic quantitative image-processing program (ImageJ Version 1.48g, a public domain Java image processing program available at http://rsb.info.nih.gov/ij/).
On each CT slice, the CSA of pulmonary small vessels was obtained by the “Analyze Particles” function to count and measure objects on binary images.8 Only those vessels that ran perpendicular or closest to perpendicular to the image were analyzed by the “Circularity” function to exclude vessels that ran parallel or obliquely to the image slice.8
CSA measurements were performed (Figure 1) as follows: 1) eliminate image noise with the “Gaussian Blurring” function to make the selected images smooth,12 2) the lung field was segmented using a threshold technique with all pixels between −500 and −1024 HU on each CT image,7 3) convert the segmented images into binary images with a window level of −720 HU; CSA was measured by the size of each vessel separately (less than 5 mm2 and equal to 5–10 mm2), 4) take count of CSA of vessels on each CT image and represent CSA<5 for less than 5 mm2 and CSA5–10 for 5–10 mm2, and 5) obtain total area of the lung in selected images on threshold from −500 to −1,024 HU; the total lung area was calculated by the sum of the three selected CT slices areas. Then, the percentages of CSA<5 (%CSA<5) and CSA5–10 (%CSA5–10) of the total lung were calculated. Two thoracic radiologists (with 5 and 7 years of experience, respectively) assessed all parameters independently with the protocol described and were blinded to other clinical information. Mean values were recorded.
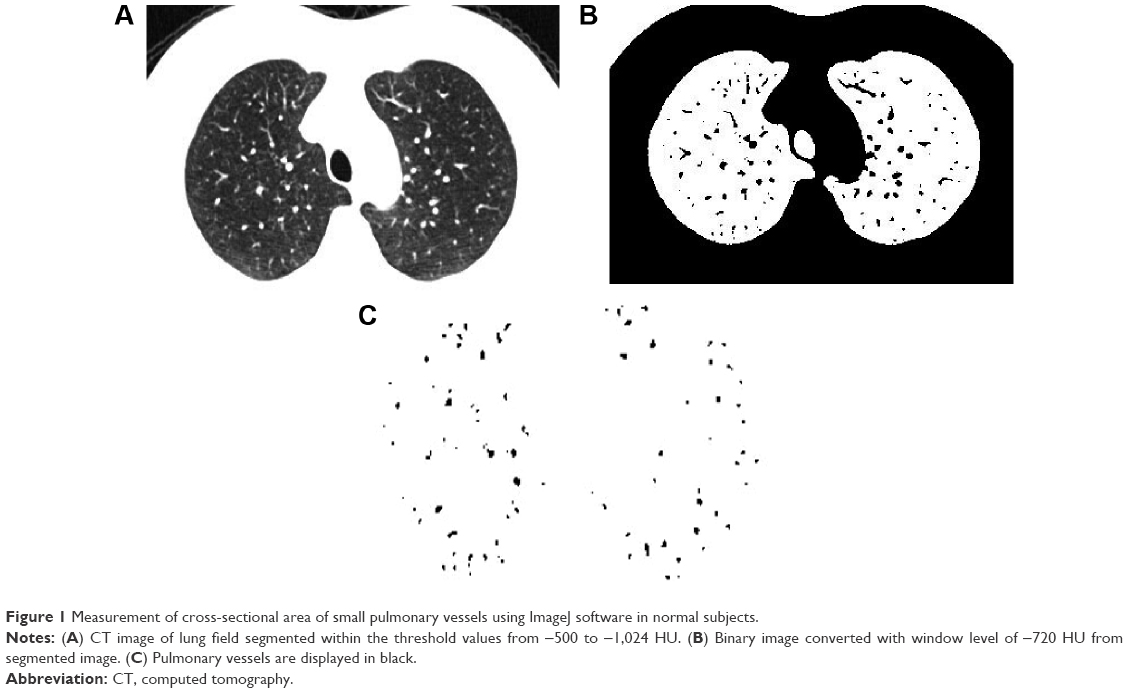 | Figure 1 Measurement of cross-sectional area of small pulmonary vessels using ImageJ software in normal subjects. |
Pulmonary function tests
PFTs and CT examinations were performed within 2 weeks in the same COPD phase (stable or acute) for all the patients. Spirometric measurements were carried out in conformance with American Thoracic Society criteria. The following values were evaluated: FEV1 and the ratio of FEV1 to FVC (FEV1/FVC). The COPD severity staged by the degree of airflow limitation severity in COPD patients was classified as mild, FEV1%≥80% predicted; moderate, 50%≤FEV1%<80% predicted; and severe, FEV1%<50% predicted.11,15
Acute exacerbation of COPD
According to the definition,1–3 the participants were recorded as having an acute exacerbation if they had increased dyspnea, cough, and sputum production and had been treated with antibiotics or systemic glucocorticoids in the outpatient setting or required admission to hospital for treatment.
Statistical analysis
Quantitative data were expressed as mean ± standard deviation and compared among groups by Student’s t-test. Qualitative data were expressed as frequency (percentage) and compared by χ2 test. The differences of %CSA among the three groups classified by the severity of COPD were assessed by analysis of variance followed by Dunnett’s test. Agreement between the blinded independent readers was analyzed using the intraclass correlation coefficient for qualitative variables. For diagnostic utility calculations, receiver operating characteristic (ROC) curves were used. Results were expressed in terms of area under the curve (AUC) and 95% confidence interval for this area. Sensitivity, specificity values, and Youden indexes were established with ROC curves, and the optimal cutoff values were defined according to the occurrence of AECOPD. For all statistical analyses, the significance level was set at P<0.05. All statistical analyses were performed using SPSS version 19.0 statistical package (IBM Corporation, Armonk, NY, USA).
Results
Demographic characteristics and corresponding CT measurements of the 153 COPD patients are presented in Table 1. The two independent blinded readers showed high agreement for all %CSAs (Table 2).
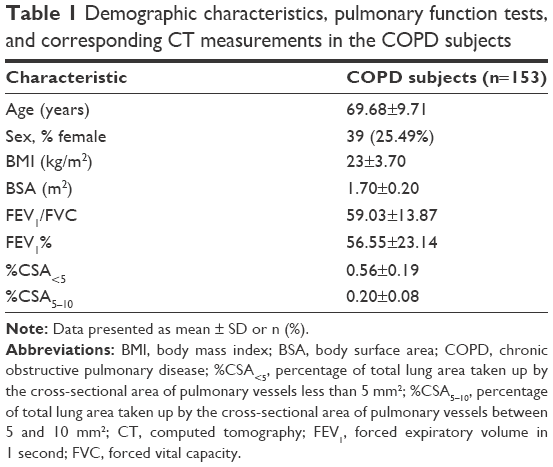 | Table 1 Demographic characteristics, pulmonary function tests, and corresponding CT measurements in the COPD subjects |
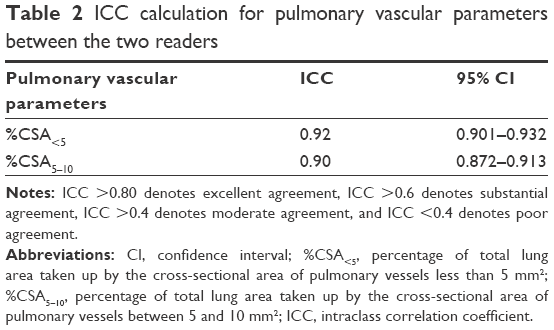 | Table 2 ICC calculation for pulmonary vascular parameters between the two readers |
Differences in %CSA among patients with COPD by severity
Table 3 shows CT measurements among patients with COPD by airflow limitation severity. According to spirometric criteria, COPD severity was classified as mild (n=30), moderate (n=61), and severe (n=62). %CSA steadily decreased in relation to the increase of COPD severity. %CSA<5 of the moderate and severe groups were significantly lower than that of the control group (P<0.001), while no obvious difference was observed between the mild and control group. %CSA5–10 in the three groups of COPD was also significantly lower than that in the control group (P<0.001). However, there was no such trend among the three COPD groups.
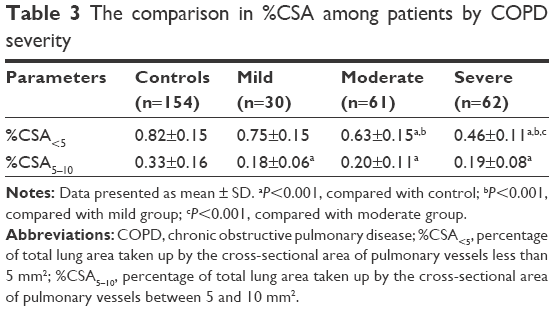 | Table 3 The comparison in %CSA among patients by COPD severity |
Demographic and clinical characteristics of patients with and without AECOPD
Compared with the non-AECOPD group, the group with AECOPD included a smaller number of women (13% versus 26%, P<0.001) and poorer pulmonary functions (FEV1%: 53.92±23.18 versus 64.61±25.23, P<0.001). Furthermore, %CSA<5 in the AECOPD group significantly decreased compared to the non-AECOPD group (0.41±0.13 versus 0.68±0.18, P<0.001). Patients with AECOPD had higher rates of severe COPD than those without AECOPD (54.43% versus 25.68%, P<0.001) (Table 4).
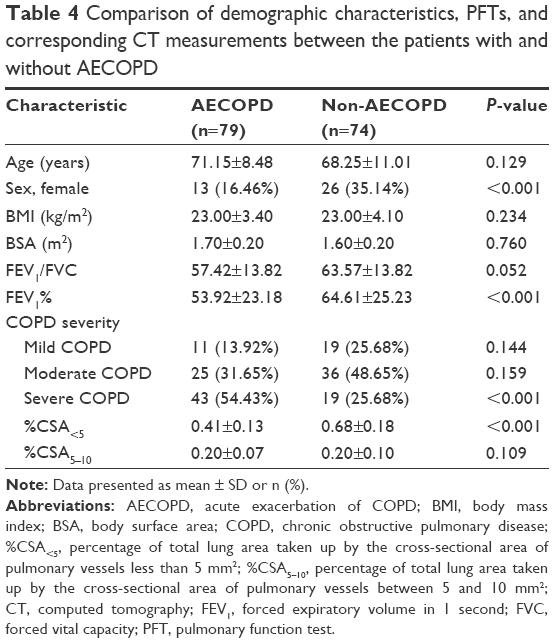 | Table 4 Comparison of demographic characteristics, PFTs, and corresponding CT measurements between the patients with and without AECOPD |
ROC analyses of parameters to investigate %CSA for the occurrence of AECOPD
%CSA<5 had an AUC of 0.764 to diagnose the occurrence of AECOPD (95% confidence interval, 0.677–0.851), which was the highest one among all parameters evaluated. The optimal cutoff of %CSA<5 was 0.56%, corresponding to the highest Youden index, which obtained the sensitivity and specificity of 0.836 and 0.731, respectively (Figure 2).
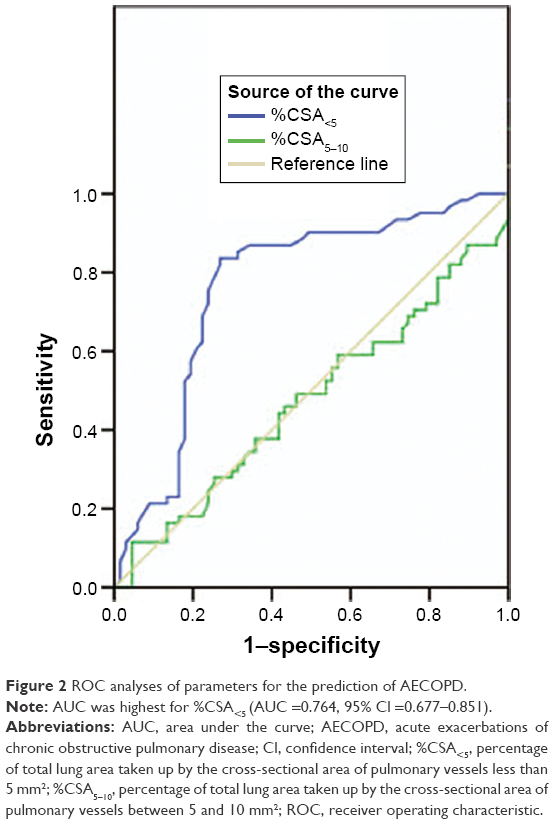 | Figure 2 ROC analyses of parameters for the prediction of AECOPD. |
Discussion
The current study showed for the first time that pulmonary small vessels alteration, as measured by %CSA<5 on CT images, decreased during AECOPD. What is more, it was found that %CSA<5 could indicate AECOPD well and the cutoff value was 0.56%. The study also indicated that more severe COPD was associated with lower %CSA<5, which meant %CSA<5 may play an important role in evaluating the severity of COPD. To our knowledge, it is the first report to quantitatively evaluate the small pulmonary vascular changes using CT in predicting the existence of AECOPD and the severity of COPD.
Lumen size is an important factor for quantitative evaluation of CSA of small pulmonary vessels. Pulmonary vessels less than 5 mm2 include elastic vessels and muscular vessels, while those equal to 5–10 mm2 mostly are elastic vessels. Anatomic vascular lesions mainly occurred in the muscular vessels.7,8 Matsuoka et al7 reported that %CSA<5 significantly correlated with the extent of emphysema, whereas no significant correlation was found in %CSA5–10. The decreased pulmonary blood flow led to a reduction of pulmonary perfusion and decline in pulmonary function,16,17 which worsened the disease itself and even developed into pulmonary hypertension.10 Matsuoka et al12 also found that %CSA<5 had a significant negative correlation with pulmonary arterial pressure, whereas the correlation between %CSA5–10 and pulmonary arterial pressure did not reach statistical significance. In our study, %CSA<5 decreased with an increase in the severity degree of COPD, while no consistent relationship was observed between %CSA5–10 and COPD severity, indicating that the severity of COPD depended on small elastic vessels. Thus, %CSA<5 could serve as an index to detect changes in small pulmonary vessels alteration associated with COPD changing.8
According to spirometric criteria, we classified the severity of COPD into three groups based on pulmonary function.11,15 In consistent with previous studies,7,8,12 we found that %CSA of small pulmonary vessels correlated positively with pulmonary function indicating that vascular alteration, as shown by %CSA, might be a useful CT finding to help the classification of the severity of COPD. In the present study, there was no statistical difference of %CSA<5 for mild COPD compared with the control group. However, the %CSA<5 steadily decreased in relation to the increase of COPD severity. It demonstrated that at an early stage of COPD, the alteration of small pulmonary vessels was not too apparent to be measured on CT scanning, since the difference was not obvious between mild COPD patients and normal subjects. Following the development of this disease, the alteration would become more severe to be observed and measured.
To our knowledge, this was the first report to quantitatively evaluate the difference of small pulmonary vascular changes between COPD patients with and without AECOPD. For patients who were repeatedly affected by AECOPD, associations were found for decreased quality of life, potential permanent loss in lung function, increased risk of mortality,18 and a more severe phase.14,19 Patients seldom completely recovered from an acute exacerbation, and therefore respiratory health status of the patients remained at a low level.14 Management, prevention, early diagnosis, and effective treatment of AECOPD are essential. We found that FEV1% and %CSA<5 were significantly lower in patients with AECOPD than those without it. Patients with AECOPD had higher rates of severe COPD. A possible explanation for this phenomenon is that emphysematous destruction and hypoxia decrease small pulmonary vessel wall distensibility during stability20 and these changes aggravate during AECOPD. Clarenbach et al21 revealed that FEV1% showed an independent effect on vascular endothelial function and a more pronounced effect of FEV1% on endothelial function in physically less active patients. Endothelial dysfunction in AECOPD patients results from lung function changes characterized by vasospasm and increased vascular proliferation, and can lead to reduced vasodilation.22,23 According to the ROC analysis, %CSA<5 might be applied to predict AECOPD when the cutoff value was 0.56%. Actually, %CSA<5 reflected the degree of small pulmonary muscular vessel destruction, and the reduction of this index in AECOPD showed a more serious deterioration and suggested the concept that COPD patients who suffer from AECOPD are likely to constitute a clinical phenotype that represents a more severe form of this disease.14 On the other hand, it meant that %CSA<5 might be a predictor to the risk of AECOPD. In addition, the group with AECOPD included a smaller number of women. It is likely that men might face an increased risk of acute exacerbations more easily. The mechanism for this phenomenon is unknown and requires further studies.
Limitations
There were some limitations in our study. Firstly, the number of mild COPD patients was relatively less, potentially reducing an impact on some results and leading to weak the significance between mild COPD and control groups. In future work, more relative mild COPD patients should be included to identify their small pulmonary vascular alteration to clarify their relationship with the disease. Secondly, as it was a retrospective study, the results might not be completely applied to all patients. Perspective studies should be conducted to confirm %CSA<5 in predicting AECOPD. In addition, whilst we did perform PFTs some weeks before or after AECOPD occurred, we did not perform PFTs at the time of AECOPD onset in the same patient. To find out whether acute exacerbations will do harm to small pulmonary vessels in the same patient, further studies are needed. Thirdly, the study considered three slices for the quantification of vascular area. It may affect the vascular counting. Also, some small vessels that were not perpendicular to the slice (not round in shape) cannot be accurately measured. Finally, we did not measure CSA of pulmonary vessels histologically; therefore, there might be some differences between CSA measured on CT image and actual CSA of pulmonary vessel. Further evaluation is necessary.
In the current study, lower %CSA<5 of small pulmonary vessels in COPD patients was associated with more severe stage. %CSA<5 could predict AECOPD well and the cutoff value was 0.56. The small pulmonary vascular alteration as measured by %CSA<5 using CT scans may be an alternative noninvasive technique to evaluate the degree of airflow limitation severity in COPD and the occurrence of AECOPD.
Acknowledgment
This work was supported by a project funded by the Priority Academic Program Development of Jiangsu Higher Education Institutions (JX10231801).
Disclosure
The authors report no conflicts of interest in this work.
References
Vestbo J, Hurd SS, Agusti AG, et al. Global strategy for the diagnosis, management, and prevention of chronic obstructive pulmonary disease: GOLD executive summary. Am J Respir Crit Care Med. 2013;187(4):347–365. | ||
Sapey E, Stockley RA. COPD exacerbations. 2: aetiology. Thorax. 2006;61(3):250–258. | ||
Hurst JR, Vestbo J, Anzueto A, et al. Susceptibility to exacerbation in chronic obstructive pulmonary disease. N Engl J Med. 2010;363(12):1128–1138. | ||
Mannino DM, Buist AS. Global burden of COPD: risk factors, prevalence, and future trends. Lancet. 2007;370(9589):765–773. | ||
Divo M, Cote C, de Torres JP, et al. Comorbidities and risk of mortality in patients with chronic obstructive pulmonary disease. Am J Respir Crit Care Med. 2012;186(2):155–161. | ||
Jacobson G, Turner AF, Balchum OJ, Jung R. Vascular changes in pulmonary emphysema. The radiologic evaluation by selective and peripheral pulmonary wedge angiography. Am J Roentgenol Radium Ther Nucl Med. 1967;100(2):374–396. | ||
Matsuoka S, Washko GR, Dransfield MT, et al. Quantitative CT measurement of cross-sectional area of small pulmonary vessel in COPD: correlations with emphysema and airflow limitation. Acad Radiol. 2010;17(1):93–99. | ||
Matsuura Y, Kawata N, Yanagawa N, et al. Quantitative assessment of cross-sectional area of small pulmonary vessels in patients with COPD using inspiratory and expiratory MDCT. Eur J Radiol. 2013;82(10):1804–1810. | ||
Terzano C, Conti V, Di SF, et al. Comorbidity, hospitalization, and mortality in COPD: results from a longitudinal study. Lung. 2010;188(4):321–329. | ||
Matsuoka S, Yamashiro T, Matsushita S, et al. Relationship between quantitative CT of pulmonary small vessels and pulmonary perfusion. AJR Am J Roentgenol. 2014;202(4):719–724. | ||
Celli BR, MacNee W; ATS/ERS Task Force. Standards for the diagnosis and treatment of patients with COPD: a summary of the ATS/ERS position paper. Eur Respir J. 2004;23(6):932–946. | ||
Matsuoka S, Washko GR, Yamashiro T, et al. Pulmonary hypertension and computed tomography measurement of small pulmonary vessels in severe emphysema. Am J Respir Crit Care Med. 2010;181(3):218–225. | ||
Wells JM, Washko GR, Han MK, et al. Pulmonary arterial enlargement and acute exacerbations of COPD. N Engl J Med. 2012;367(10):913–921. | ||
Chhabra SK, Dash DJ. Acute exacerbations of chronic obstructive pulmonary disease: causes and impacts. Indian J Chest Dis Allied Sci. 2014;56(2):93–104. | ||
Kawut SM, Poor HD, Parikh MA, et al. Cor Pulmonale parvus in chronic obstructive pulmonary disease and emphysema: the MESA COPD Study. J Am Coll Cardiol. 2014;64(19):2000–2009. | ||
Arakawa A, Yamashita Y, Nakayama Y, et al. Assessment of lung volumes in pulmonary emphysema using multidetector helical CT: comparison with pulmonary function tests. Comput Med Imaging Graph. 2001;25(5):399–404. | ||
Kauczor HU, Hast J, Heussel CP, et al. CT attenuation of paired HRCT scans obtained at full inspiratory/expiratory position: comparison with pulmonary function tests. Eur Radiol. 2002;12(11):2757–2763. | ||
McCurdy BR. Hospital-at-home programs for patients with acute exacerbations of chronic obstructive pulmonary disease (COPD): an evidence-based analysis. Ont Health Technol Assess Ser. 2012;12(10):1–65. | ||
Wells JM, Washko GR, Han MK, et al. Pulmonary arterial enlargement and acute exacerbations of COPD. N Engl J Med. 2012;367(10):913–921. | ||
Gagnon P, Guenette JA, Langer D, et al. Pathogenesis of hyperinflation in chronic obstructive pulmonary disease. Int J Chron Obstruct Pulmon Dis. 2014;15(9):187–201. | ||
Clarenbach CF, Senn O, Sievi NA, et al. Determinants of endothelial function in patients with COPD. Eur Respir J. 2013;42(5):1194–1204. | ||
de Matthaeis A, Greco A, Dagostino MP, et al. Effects of hypercapnia on peripheral vascular reactivity in elderly patients with acute exacerbation of chronic obstructive pulmonary disease. Clin Interv Aging. 2014;29(9):871–878. | ||
Lahera V, Goicoechea M, de Vinuesa SG, et al. Endothelial dysfunction, oxidative stress and inflammation in atherosclerosis: beneficial effects of statins. Curr Med Chem. 2007;14(2):243–248. |
 © 2016 The Author(s). This work is published and licensed by Dove Medical Press Limited. The
full terms of this license are available at https://www.dovepress.com/terms
and incorporate the Creative Commons Attribution
- Non Commercial (unported, 3.0) License.
By accessing the work you hereby accept the Terms. Non-commercial uses of the work are permitted
without any further permission from Dove Medical Press Limited, provided the work is properly
attributed. For permission for commercial use of this work, please see paragraphs 4.2 and 5 of our Terms.
© 2016 The Author(s). This work is published and licensed by Dove Medical Press Limited. The
full terms of this license are available at https://www.dovepress.com/terms
and incorporate the Creative Commons Attribution
- Non Commercial (unported, 3.0) License.
By accessing the work you hereby accept the Terms. Non-commercial uses of the work are permitted
without any further permission from Dove Medical Press Limited, provided the work is properly
attributed. For permission for commercial use of this work, please see paragraphs 4.2 and 5 of our Terms.