Back to Journals » Nature and Science of Sleep » Volume 9
Sleep positions and nocturnal body movements based on free-living accelerometer recordings: association with demographics, lifestyle, and insomnia symptoms
Authors Skarpsno ES ![]() , Mork PJ
, Mork PJ ![]() , Nilsen TIL, Holtermann A
, Nilsen TIL, Holtermann A ![]()
Received 7 July 2017
Accepted for publication 12 September 2017
Published 1 November 2017 Volume 2017:9 Pages 267—275
DOI https://doi.org/10.2147/NSS.S145777
Checked for plagiarism Yes
Review by Single anonymous peer review
Peer reviewer comments 3
Editor who approved publication: Dr Steven Shea
Eivind Schjelderup Skarpsno,1,2 Paul Jarle Mork,1 Tom Ivar Lund Nilsen,1 Andreas Holtermann3,4
1Department of Public Health and Nursing, Norwegian University of Science and Technology (NTNU), 2Liaison Committee between Central Norway Regional Health Authority and NTNU, Trondheim, Norway; 3National Research Centre for the Working Environment, Copenhagen, 4Department of Sports Science and Clinical Biomechanics, University of Southern Denmark, Odense, Denmark
Background: In order to establish normative values for body positions and movements during sleep, the objective of this study was to explore the distribution of sleep positions and extent of nocturnal body moments and the association with sex, age, body-mass index (BMI), smoking, alcohol consumption, and insomnia symptoms.
Materials and methods: This cross-sectional study comprised data on a working population (363 men and 301 women) who participated in the Danish Physical Activity Cohort with Objective Measurements (DPHACTO). Measures of body position and movements were obtained from actigraph accelerometers on the thigh, upper back, and upper arm. Linear regression was used to estimate adjusted mean differences in movements among categories of demographic and lifestyle characteristics.
Results: During their time in bed, participants spent 54.1% (SD 18.1%) in the side position, 37.5% (SD 18.2%) in the back position, and 7.3% (SD 12.3%) in the front position. Increasing age and BMI were associated with increased time in the side position and a proportional reduction in time in the back position. There were on average 1.6 (SD 0.7) position shifts per hour. Compared to males, females had fewer position shifts (–0.37, 95% CI –0.48 to –0.24) and fewer arm, thigh, and upper-back movements. Participants aged 20–34 years had more arm, thigh, and upper-back movements compared to participants ≥35 years. Obese participants had fewer shifts in body position (–0.15, 95% CI –0.27 to 0), but more arm, thigh, and upper-back movements compared to normal-weight participants. Smokers had fewer shifts in body position than nonsmokers (–0.27, 95% CI –0.4 to –0.13).
Conclusion: The predominant sleep position in adults is on the side. This preference increases with age and BMI. The extent of nocturnal body movements is associated with sex, age, BMI, and smoking.
Keywords: sleep, sleep positions, body movements, accelerometers, lifestyle
Introduction
Body postures and movements during sleep have been reported to be associated with sleep quality and various health outcomes.1–3 For example, poor sleepers spend more time on their back,1 the severity of sleep apnea–hypopnea syndrome is increased in this position,2 and patients with heart failure tend to favor sleeping on their side.4,5 These studies thus suggest that distribution of sleep positions may constitute important health-related information. Although the influence of sleep on health and well-being is well documented,6 information about the distribution of body postures and movements during sleep is scarce.
Studies have reported that the preferred body position during sleep is on the side, while the front position is least preferred.7,8 This is supported by a study showing that children sleep equally much on the side, back, and front, with a progressive preference for the side position when approaching adulthood.9 The preference for the side position during adulthood was also confirmed by a study on women aged 20–70 years.8 With regard to body movements, studies have indicated that the number of positional shifts per night may vary considerably among individuals,1,7 and that position shifts7 and body movements tend to decrease with increasing age.10 Noticeably, previous studies that have investigated sleep positions and movements have been limited to small study samples,1,7,9 specific age-groups,1,7 only women,8 specific medical conditions,2,4,5 and measurements in laboratory settings.1,2,4,7,9 As such, there is lack of data that describe the distribution of sleep positions and body movements in the general adult population during free-living conditions.
New wearable technology makes it possible to investigate sleep positions and body movements in large population-based studies outside laboratory conditions over several days. Still, surprisingly few studies have been carried out to investigate the relation between sleep positions and body movements with demographics, lifestyle, and insomnia symptoms. Based on continuous accelerometry data collected over several days in a working population, we investigated the distribution of sleep positions and extent of nocturnal body movements and associations with sex, age, body-mass index (BMI), smoking, alcohol consumption, and insomnia symptoms.
Materials and methods
Study population and design
This study was based on data from the Danish Physical Activity Cohort with Objective Measurements (DPHACTO) study. Data were collected from spring 2012 until spring 2014. Detailed information about the DPHACTO study is described elsewhere.11 Employees from fifteen Danish workplaces (n=2,107) were invited to participate in the study. Of these, 1,119 men and women consented to participate. Inclusion criteria were the possibility to participate in the study during paid working hours, work at least 20 hours per week, age 18–65 years, and providing signed informed consent. Exclusion criteria were pregnancy, having fever on the day of testing, band-aid allergy, slipped disk, and current and past illness making the participant unable to take part in long-term technical measurements.
Accelerometry recordings were obtained from 755 participants. Of these, we excluded 74 participants with missing recordings during nighttime. In addition, we also excluded participants with missing data on BMI (n=19). Therefore, analysis of sleep position and nocturnal movements was based on information from 664 participants (363 men and 301 women). The study was approved by the Ethics Committee for the Capital Region of Denmark and conducted in accordance with the Declaration of Helsinki.
Procedure
All participants were invited to information meetings, where the objective and procedure of the study were explained in detail. All participants were briefed, and were asked to wear accelerometers for collecting physical activities during the entire day and night for up to 6 consecutive days, including at least 2 working days and 2 leisure days. Research staff visited workplaces on the first and the last days of measurements. Anthropometric measurements were carried out on the first day, along with filling in a computer-based questionnaire and mounting of accelerometers for objective measurements of physical activity. On the days they were wearing the accelerometers, participants were required to perform a reference posture (ie, standing still in an upright position for 15 seconds once a day) and to fill in a short daily diary indicating time of reference measurements, working hours, leisure time, time for going to bed to sleep, and time not wearing the accelerometer. Participants were instructed to take the accelerometer off if it caused itching or discomfort. On the last day, workers returned the measurement devices and diary.
Sleep positions and movements
Sleep position (front, back, or side), movements of arm, thigh, and upper back, number of position shifts, and times out of bed were estimated using three accelerometers attached on the right front thigh (midway between the iliac crest and the upper border of the patella), the dominant upper arm (just below the deltoid insertion), and the upper back (upper border of the accelerometer at T1/T2 of the upper back, GT3X+; ActiGraph, Pensacola, FL, USA).11 The GT3X+ is a small, water-resistant device (19×34×45 mm, weight 19 g), which records and stores triaxial acceleration data at a frequency of 30 Hz with a dynamic range of ±6 G and 12-bit precision. The raw data are stored on a 250 MB involatile flash memory. Accelerometers were attached using Fixomull (BSN Medical, Hamburg, Germany), double-sided tape (3M, St Paul, MN, USA) and a waterproof film (OpSite FlexiFix; Smith and Nephew, London, England). Accelerometers were initialized and prepared for recording using the manufacturer’s software (ActiLife version 5.5; ActiGraph). During initialization, the sample rate was selected and the data then automatically collected from all sensors in raw-data format. The data were thereafter processed in the ActiLife software. The battery life was expected to be 30 days with a 30 Hz sample rate.
Based on self-reported information about time for going to bed to sleep, time in bed (TIB) was calculated from the start of the first continuous 10-minute epoch lying down after self-reported time for going to bed until the end of the last 10-minute epoch of lying down. Number of times out of bed included all episodes of not lying down during TIB (ie, sitting, standing, and walking). Body positions (front, back, and side) were recorded from the accelerometer on the upper back and classified based on “mode” filtering, requiring that a position must last for at least 1 minute to be registered. The inclinometer features make it possible to identify the orientation of the device relative to the line of gravity, and to be quantified as a position shift (eg, a shift from front to back position) an angle change of at least 30° was required. Classification of body positions was based on angle-limit values around a longitudinal axis, ie, for the back position of 45°–135° and for front position of 225°–315°. Side position was defined as the angle-limit values between the back and front angles. Time with body movements (arm, thigh, and/or upper back) was recorded during front, back, and side positions, and is presented as percentage of TIB. Quantification of body movements was based on the total time where acceleration exceeded a threshold of 0.005 g, which is about twice the noise level of the GT3X+ (ie, 0.002–0.003 g). Time out of bed and shifts between sleep positions were treated as independent events, and were not included as movements in the present study.
After the participants had completed all days of registration, recorded accelerometer data were downloaded using the ActiLife software. The accelerometer data were analyzed with the MatLab based program Acti4 (National Research Centre for the Working Environment, [Copenhagen, Denmark] and Federal Institute for Occupational Safety and Health [Berlin, Germany]).12,13
Questionnaire data
Sex was determined by asking. Age was determined from the Danish civil registration number. BMI (kg/m2) was calculated using objectively measured height (meters) and body weight (kilograms). Participants were then classified into one of three BMI groups according to the cutoff points suggested by the World Health Organization:14 normal weight (BMI 18.5–24.9 kg/m2), overweight (BMI 25–29.9 kg/m2), or obese (BMI ≥30 kg/m2). Only three workers were classified as underweight, and thus excluded from the analyses. Smoking was determined from the question “Do you smoke?” with four response categories: “yes, daily”, “yes, sometimes”, “used to smoke, not anymore”, and “I have never smoked”. The response alternatives were further categorized into three groups: “yes” (yes, daily), “former/occasionally” (yes, sometimes; used to smoke, not anymore), and “no” (I have never smoked). Alcohol consumption was determined from the question: “Do you drink alcohol?”. If yes, participants were also asked “How many units did you drink last week?” Answers were then categorized into quartiles. The response alternatives were further categorized into three groups: low (lower quartile), medium (median), and high (upper quartile). Insomnia symptoms were determined based on two questions: “How often during the last month did you . . .” have difficulties falling asleep at night/wake up too early and couldn’t get back to sleep? Response options were never, rarely, sometimes, often, and always on both questions. To classify level of insomnia symptoms, the two questions were categorized into three possible responses: 0, no sleep problems (never/rarely); 1, sometimes; and 3, often/always (often, always). The sum score on the two questions was then used to classify level of insomnia symptoms into no (sum score 0), sometimes (sum score 1–2), and often/always (sum score ≥3).
Statistical analysis
Descriptive statistics (mean, SD) are presented separately for sex, age-groups (20–34, 35–44, 45–54, 55–65 years), and BMI (normal weight, overweight, obese). Multiple linear regression (with robust estimation of variance) was used to estimate crude and unadjusted coefficients of body movements associated with sex, age, BMI, smoking, alcohol consumption, and insomnia symptoms. Proportion of movements of arm, thigh, and upper back and number of position shifts were entered as dependent variables. In the primary model, sex, age, BMI, smoking, alcohol consumption, and insomnia symptoms were entered as independent variables. The first category for each of the independent variables was used as the reference category. Precision of coefficients was assessed by 95% CIs. First, crude differences were calculated independently for each of the covariates. Second, in the adjusted model, we calculated adjusted mean differences by including all possible predictors under study as independent variables in the same model. All adjusted differences were thus adjusted for all the other predictors under study (sex, age, BMI, smoking, alcohol consumption, and insomnia symptoms).
To evaluate the consistency of the results, two sensitivity analyses were performed. First, chronic musculoskeletal pain was very common among participants in the current study. A multiple-regression analysis was thus performed with musculoskeletal pain as a covariate in the adjusted model. Intensity and extent of musculoskeletal pain were assessed by the question: “During the last 3 months, what has been your worst pain in the following body regions on a scale from 0 to 10?” Body regions included neck/shoulders, elbows, wrists/hands, low back, hips, knees, and ankles/feet. Based on these initial answers on pain, we constructed a new variable using number of pain sites and pain intensity to categorize participants into four strata: no pain, light pain, one or two pain sites, and three or more pain sites. Participants were categorized into “no pain” if they answered ≤2 on pain intensity for all pain sites, “light pain” if they answered ≤5 on intensity for all pain sites, “one or two pain sites” if they answered ≥6 on intensity for one or two pain sites, and “three or more pain sites” if they answered ≥6 on intensity for at least three pain sites. Furthermore, number of times out of bed and TIB varied considerably between participants, and a sensitivity analysis was thus performed excluding participants with a high number of times out of bed (three or more times per night) and participants with short (<6 hours) or long (>8.5 hours) TIB. Assumptions of linearity and residuals being normally distributed and homoscedastic were fulfilled for movements of arm, thigh, and upper back. All statistical tests were two-sided, and all statistical analyses were conducted using Stata for Windows, version 13.1 (StataCorp LP, College Station, TX, USA).
Results
Characteristics of the study population
Table 1 presents the characteristics of the study population stratified by sex. A total of 363 men and 301 women with valid accelerometer recordings were included in the analyses. The study population consisted of 74% blue-collar workers and 26% white-collar workers. Mean age was 43.3 years in men and 45.9 years in women. Mean BMI was 27.3 kg/m2 in men and 27.4 kg/m2 in women. The proportion of current smokers was slightly higher among women (25.6%) than men (20.4%), while the proportion consuming ≥7 units alcohol per week was considerably higher among men (33.6%) than women (9.3%). A total of 72 participants (10.8%) were classified with insomnia symptoms often or always. Mean recorded TIB per night was 7.5 hours, and mean total recorded TIB per participant was 29.8 hours. About 94.4% of the participants wore the accelerometer for at least 2 valid nights.
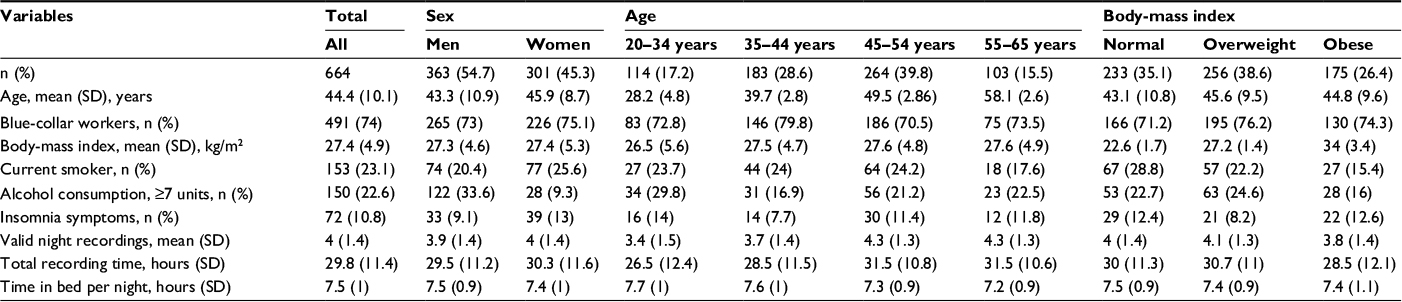 | Table 1 Characteristics of study population stratified by sex, age, and body-mass index Note: Normal weight (BMI 18.5–24.9 kg/m2), overweight (BMI 25–29.9 kg/m2), or obese (BMI ≥30 kg/m2). Abbreviation: BMI, body mass index. |
Descriptive statistics of sleep positions and body movements
Descriptive statistics of sleep positions and duration of nocturnal movements stratified by sex, age, and BMI are presented in Table 2. Overall, participants spent 54.1% of TIB in the side position, 37.5% of TIB on the back, and 7.3% of TIB in the front position. Duration of nocturnal movements was 3.3% of TIB for the arm, 2.8% of TIB for the thigh, and 3.2% of TIB for the upper back. The average number of position shifts per hour was 1.6 during TIB.
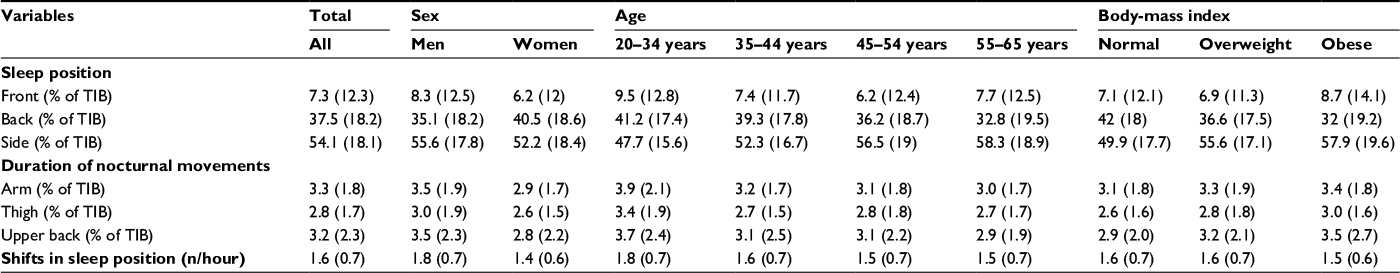 | Table 2 Descriptive statistics of sleep positions and nocturnal body movements stratified by sex, age, and body-mass index Note: Values presented as mean (SD). Normal weight (BMI 18.5–24.9 kg/m2), overweight (BMI 25–29.9 kg/m2), or obese (BMI ≥30 kg/m2). Abbreviations: TIB, time in bed; BMI, body mass index.. |
Females spent 6.2% of TIB in the front position, 40.5% of TIB on the back, and 52.2% of TIB on the side. Males spent 8.3% of TIB in the front position, 35.1% of TIB on the back, and 55.6% of TIB on the side. Time spent on the back decreased with age, from 41.2% of TIB in the age-group 20–34 years to 32.8% of TIB in the age-group 55–65 years. In contrast, time spent on the side increased with age, from 47.7% of TIB in the age-group 20–34 years to 58.3% of TIB in the age-group 55–68 years. Further, time spent on the back decreased with BMI from 42% of TIB in normal weight participants to 32% of TIB in obese participants. An opposite association was observed for time spent on the side, with 49.9% of TIB in normal-weight participants to 57.9% of TIB in obese participants.
Sleep position, movements, and association with demographics, lifestyle, and insomnia symptoms
Table 3 presents associations among number of shifts in sleep position, nocturnal movements (arm, thigh, and upper back), sex, age, BMI, smoking, alcohol consumption, and insomnia symptoms. Number of shifts in sleep position per hour were negatively associated with female sex, obesity, and smoking. Nocturnal movements were negatively associated with female sex for arm, thigh, and upper-back movements. Moreover, the number of nocturnal movements was significantly reduced in all age-groups >35 years compared to the reference group of 20–34 years, and was highest in the oldest age-group (55–65 years). In contrast, the number of nocturnal movements was positively associated with BMI.
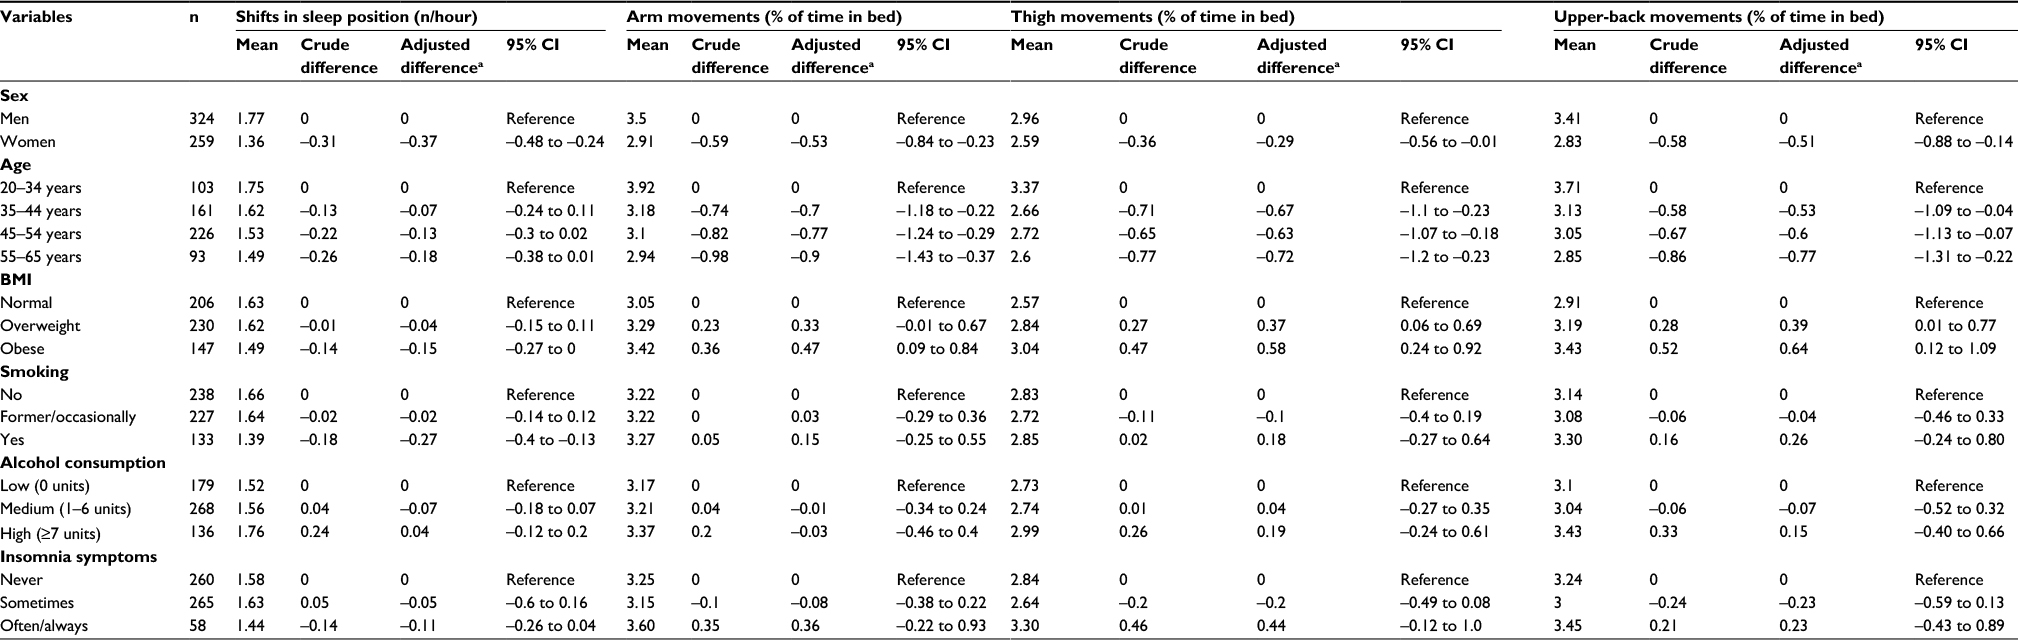 | Table 3 Associations of sex, age, body-mass index (BMI), smoking, alcohol consumption, and sleep problems with shifts in sleep position and nocturnal movements of arm, thigh, and upper back Notes: aMultiadjusted for all predictors in the table. Normal weight (BMI 18.5–24.9 kg/m2), overweight (BMI 25–29.9 kg/m2), or obese (BMI ≥30 kg/m2). |
Sensitivity analysis
When musculoskeletal pain was included as a covariate in the multiadjusted model, the associations remained essentially unchanged. However, the age-group 55–65 years had significant fewer shifts in body position. Finally, the results remained largely unchanged when excluding participants with many times out of bed (three or more per night) and short (<6 hours) or long (>8.5 hours) TIB. Furthermore, the association between nocturnal upper-back movements and age became nonsignificant.
Discussion
In this study, we found that the preferred sleep position was on the side, followed by the back position. Only a small portion of TIB is spent in the front position. The distribution of sleep position is influenced by age and BMI, ie, time in the back position decreases, while time in the side position increases with increasing age and BMI. We also observed that female sex, smoking, and high BMI were associated with fewer shifts in sleep position. Furthermore, female sex and increasing age were negatively associated with extent of nocturnal movements, while BMI was positively associated with movement. Neither insomnia symptoms nor alcohol consumption were associated with shifts in sleep position or extent of nocturnal body movements.
Overall, our findings are in line with previous studies investigating distribution of sleep position.1,7–9 A laboratory study by Lorrain et al on elderly subjects (four men, four women, aged 65–75 years) showed that the side position was the preferred sleep posture (77% of sleeping time) followed by the back position (19%); only 2% of the sleeping time was spent in the front position.7 In the current study, we found that time in the side position increased with age, accompanied by a proportional decrease in time in the back position. In the age-group 55–65 years, time spent on the side, back, and front was 58.3%, 32.8%, and 7.7%, respectively. Therefore, our study and Lorrain et al7 suggest a further shift with advanced age toward sleep in the side position and less in the back position.
A continuous shift in preference toward the side position is also supported by a study that included age-groups from 3–5 years to 65–85 years. The main finding was a progressive preference for sleep in the side position with increasing age.9 However, the latter study included children and older adults, and these results are thus not directly comparable with the working population used in the present study. The overall preference for the side position across adulthood is supported by a study of 600 women (aged 20–70 years) using a portable polysomnographic recording system to capture sleep position in a free-living setting.8 The results showed that about 50% of sleep time was spent in the side position, 41% on the back, and only 9% in the front position. The current study extends on these previous findings by providing data collected during a free-living setting and with the inclusion of both men and women. Moreover, in addition to age, we observed that the distribution of sleep position was influenced by BMI, ie, time in the back position decreased and time in the side position increased with BMI. Further, we observed a tendency that men spent less time in the back position (35.1% vs 40.5%) and more time on the side than women (55.6% vs 52.2%).
Several theories have been put forward to explain the underlying mechanisms that influence preference for the different sleep positions. A possible explanation for the avoidance of the front position is that the respiratory movements of the rib cage require more energy expenditure because of the necessity of elevating the body against gravity in the front position.7 This is supported by studies on infants showing that the front position causes higher heart rate than the back position,15 and may increase susceptibility to hyperthermia16 or autonomic impairment.17 Further, some explanations for the preference of the side position have been proposed. It has been claimed that the preferred side position with increasing age is due to loss of flexibility of the spine and/or the extra effort required for breathing in the front position.9 Interestingly, a study on healthy males during a waking state reported reduced stroke volume and increased sympathetic nervous activity and heart rate in the front position.18 Furthermore, sleeping in the side position is preferred by patients with heart failure,4,5 probably because this position reduces the uncomfortable awareness of the enlarged heart beating against the left chest wall.19
There is limited knowledge about nocturnal body movements and how they relate to demographics, lifestyle, and insomnia symptoms. In the current study, we observed that the youngest age-group (20–34 years) had more arm, thigh, and upper-back movements and more shifts in sleep position than the older age-group (35–65 years). This is in accordance with previous studies showing that the number of posture changes decreases from early childhood into adolescence, with a further reduction in adults9 and the elderly.10 Some possible explanations have been proposed for this, eg, that body movements during sleep mimic the decrease in motor activity seen in old people during wakefulness.20 Moreover, in young adults, body movements occur mainly in REM sleep,21 while elderly subjects show a more even distribution of body movements across sleep stages.10 Accordingly, this may indicate that the relationship between body movements and sleep stages is affected by age and that the brain becomes less able with age to produce body movements during sleep.22
We also observed that women had fewer body movements and shifts in sleep position compared to men. This may relate to the common findings of shorter sleep-onset latency, higher sleep efficiency,23 and fewer awakenings24 in women compared to men. Furthermore, the extent of nocturnal body movements was positively associated with BMI, but inversely associated with number of shifts in sleep position. The increase in extent of body movements may relate to the poor sleep commonly reported by obese individuals.25,26 The contrasting findings of more movements but less frequent shifts in sleep position among the obese participants are puzzling. However, a possible explanation may be the strong preference for the side position in obese individuals. Previous data have shown that the supine position is associated with increased respiratory demand in obese individuals.27 Therefore, it may be that obese individuals are more stationary in the side position.
We found no association between self-reported insomnia symptoms and number of shifts in sleep position or extent of nocturnal body movements. However, we observed that participants who reported experiencing insomnia symptoms often/always tended to have more body movements than participants without symptoms. Previous studies have shown that smoking is associated with longer sleep-onset latency and reduced time in deep sleep.28,29 In the present study, we observed fewer shifts in sleep positions among smokers, but no association with body movements. Alcohol consumption was not associated with number of shifts in sleep position or body movements.
Strengths and limitations
Strengths of the current study include the large sample of adult women and men with objective measurements over several nights in a free-living setting. The latter minimizes the potential bias due to night-to-night variability in sleep position and body movements. However, supplementary analysis showed that there was no variation in sleep positions and body movements across testing nights. Some limitations should be considered when interpreting the results. First, we were not able to determine sleep onset, periods awake during the night, or awakening time in the morning. To minimize this weakness, we used the first continuous 10-minute epoch lying down that occurred after the self-reported time for going to bed until the last continuous 10 minutes to capture TIB. We cannot rule out the possibility that the distribution of sleep positions may have been affected by the placement of the accelerometers. It is possible that the accelerometers caused uncomfortable sleep and made the subjects sleep in positions other than normally preferred. Moreover, home monitoring can be influenced by various unpredictable factors. We tried to minimize this bias by performing recordings over several days. Furthermore, we had no information about other sleep disorders (ie, sleep apnea, periodic limb movements). Finally, the study population consisted mainly of Danish blue-collar workers, and the results may thus have limited generalizability (93% of the study participants were born in Denmark).
The intention of the current study was to explore factors associated with sleep positions and nocturnal body movements. Although the present observations indicate that sleep positions and body movements are related to demographics and lifestyle factors, the mechanisms remain unclear. As such, more studies are needed to establish the association between sleep positions, nocturnal body movements, and health.
Conclusion
This study shows that the distribution of sleep position and nocturnal body movements in adults are associated with demographic and lifestyle factors. More than half of the TIB is spent in the side position, about a third in the back position and less than 10% in the front position. BMI and age are positively associated with time in the side position and inversely associated with time in the back position. Nocturnal movements are negatively associated with age and female sex, but positively associated with BMI.
Author contributions
All authors participated in study concept and design, drafting of the manuscript, critical revision of the manuscript, statistical analysis, analysis and interpretation of data, and final approval.
Acknowledgments
This work was supported by a grant to Eivind Schjelderup Skarpsno from the Liaison Committee between the Central Norway Regional Health Authority (RHA) and the Norwegian University of Science and Technology (NTNU). The National Research Centre for the Working Environment (NRCWE) financed the data collection of this study, and the study was supported by the Danish Working Environment Research Fund. The authors would like to thank the DPHACTO research group and personnel who contributed to the data collection and analysis, especially Julie Lagersted-Olsen, Dorte Ekner, Klaus Hansen, and Jørgen Skotte.
Disclosure
The authors report no conflicts of interest in this work.
References
De Koninck J, Gagnon P, Lallier S. Sleep positions in the young adult and their relationship with the subjective quality of sleep. Sleep. 1983;6(1):52–59. | ||
Oksenberg A, Khamaysi I, Silverberg DS, Tarasiuk A. Association of body position with severity of apneic events in patients with severe nonpositional obstructive sleep apnea. Chest. 2000;118(4):1018–1024. | ||
Horne RS, Franco P, Adamson TM, Groswasser J, Kahn A. Effects of body position on sleep and arousal characteristics in infants. Early Hum Dev. 2002;69(1–2):25–33. | ||
Leung RS, Bowman ME, Parker JD, Newton GE, Bradley TD. Avoidance of the left lateral decubitus position during sleep in patients with heart failure: relationship to cardiac size and function. J Am Coll Cardiol. 2003;41(2):227–230. | ||
Hoffstein V. Snoring. Chest. 1996;109(1):201–222. | ||
Irwin MR. Why sleep is important for health: a psychoneuroimmunology perspective. Annu Rev Psychol. 2015;66:143–172. | ||
Lorrain D, De Koninck J, Dionne H, Goupil G. Sleep positions and postural shifts in elderly persons. Percept Mot Skills. 1986;63(2 Pt 1):352–354. | ||
Sahlin C, Franklin KA, Stenlund H, Lindberg E. Sleep in women: normal values for sleep stages and position and the effect of age, obesity, sleep apnea, smoking, alcohol and hypertension. Sleep Med. 2009;10(9):1025–1030. | ||
De Koninck J, Lorrain D, Gagnon P. Sleep positions and position shifts in five age groups: an ontogenetic picture. Sleep. 1992;15(2):143–149. | ||
Gori S, Ficca G, Giganti F, Nasso ID, Murri L, Salzarulo P. Body movements during night sleep in healthy elderly subjects and their relationships with sleep stages. Brain Res Bull. 2004;63(5):393–397. | ||
Jørgensen M, Korshøj M, Lagersted-Olsen J, et al. Physical activities at work and risk of musculoskeletal pain and its consequences: protocol for a study with objective field measures among blue-collar workers. BMC Musculoskelet Disord. 2013;14:213. | ||
Skotte J, Korshøj M, Kristiansen J, Hanisch C, Holtermann A. Detection of physical activity types using triaxial accelerometers. J Phys Act Health. 2014;11(1):76–84. | ||
Korshøj M, Skotte JH, Christiansen CS, et al. Validity of the Acti4 software using ActiGraph GT3X+ accelerometer for recording of arm and upper body inclination in simulated work tasks. Ergonomics. 2014;57(2):247–253. | ||
World Health Organization. Physical Status: The Use and Interpretation of Anthropometry. Geneva: WHO; 1995. | ||
Tuladhar R, Harding R, Cranage SM, Adamson TM, Horne RS. Effects of sleep position, sleep state and age on heart rate responses following provoked arousal in term infants. Early Hum Dev. 2003;71(2):157–169. | ||
Nelson EA, Taylor BJ, Weatherall IL. Sleeping position and infant bedding may predispose to hyperthermia and the sudden infant death syndrome. Lancet. 1989;1(8631):199–201. | ||
Galland BC, Reeves G, Taylor BJ, Bolton DP. Sleep position, autonomic function, and arousal. Arch Dis Child Fetal Neonatal Ed. 1998;78(3):F189–F194. | ||
Pump B, Talleruphuus U, Christensen NJ, Warberg J, Norsk P. Effects of supine, prone, and lateral positions on cardiovascular and renal variables in humans. Am J Physiol Regul Integr Comp Physiol. 2002;283(1):R174–R180. | ||
Wise JR Jr. Trepopnea. N Engl J Med. 1970;283(5):266. | ||
Renfrew JW, Pettigrew KD, Rapoport SI. Motor activity and sleep duration as a function of age in healthy men. Physiol Behav. 1987;41(6):627–634. | ||
Webb WB, Dreblow LM. A modified method for scoring slow wave sleep of older subjects. Sleep. 1982;5(2):195–199. | ||
Giganti F, Ficca G, Gori S, Salzarulo P. Body movements during night sleep and their relationship with sleep stages are further modified in very old subjects. Brain Res Bull. 2008;75(1):66–69. | ||
Krishnan V, Collop NA. Gender differences in sleep disorders. Curr Opin Pulm Med. 2006;12(6):383–389. | ||
Brychta RJ, Arnardottir NY, Johannsson E, et al. Influence of day length and physical activity on sleep patterns in older Icelandic men and women. J Clin Sleep Med. 2016;12(2):203–213. | ||
Rao MN, Blackwell T, Redline S, Stefanick ML, Ancoli-Israel S, Stone KL. Association between sleep architecture and measures of body composition. Sleep. 2009;32(4):483–490. | ||
Resta O, Barbaro MP, Bonfitto P, et al. Low sleep quality and daytime sleepiness in obese patients without obstructive sleep apnoea syndrome. J Intern Med. 2003;253(5):536–543. | ||
Parameswaran K, Todd DC, Soth M. Altered respiratory physiology in obesity. Can Respir J. 2006;13(4):203–210. | ||
Redline S, Kirchner HL, Quan SF, Gottlieb DJ, Kapur V, Newman A. The effects of age, sex, ethnicity, and sleep-disordered breathing on sleep architecture. Arch Intern Med. 2004;164(4):406–418. | ||
Zhang L, Samet J, Caffo B, Punjabi NM. Cigarette smoking and nocturnal sleep architecture. Am J Epidemiol. 2006;164(6):529–537. |
 © 2017 The Author(s). This work is published and licensed by Dove Medical Press Limited. The
full terms of this license are available at https://www.dovepress.com/terms
and incorporate the Creative Commons Attribution
- Non Commercial (unported, 3.0) License.
By accessing the work you hereby accept the Terms. Non-commercial uses of the work are permitted
without any further permission from Dove Medical Press Limited, provided the work is properly
attributed. For permission for commercial use of this work, please see paragraphs 4.2 and 5 of our Terms.
© 2017 The Author(s). This work is published and licensed by Dove Medical Press Limited. The
full terms of this license are available at https://www.dovepress.com/terms
and incorporate the Creative Commons Attribution
- Non Commercial (unported, 3.0) License.
By accessing the work you hereby accept the Terms. Non-commercial uses of the work are permitted
without any further permission from Dove Medical Press Limited, provided the work is properly
attributed. For permission for commercial use of this work, please see paragraphs 4.2 and 5 of our Terms.