Back to Journals » Nature and Science of Sleep » Volume 14
Sleep Homeostasis and Night Work: A Polysomnographic Study of Daytime Sleep Following Three Consecutive Simulated Night Shifts
Authors Pedersen TT ![]() , Sunde E
, Sunde E ![]() , Wisor J, Mrdalj J
, Wisor J, Mrdalj J ![]() , Pallesen S, Grønli J
, Pallesen S, Grønli J
Received 16 September 2021
Accepted for publication 4 December 2021
Published 18 February 2022 Volume 2022:14 Pages 243—254
DOI https://doi.org/10.2147/NSS.S339639
Checked for plagiarism Yes
Review by Single anonymous peer review
Peer reviewer comments 2
Editor who approved publication: Prof. Dr. Ahmed BaHammam
Torhild T Pedersen,1 Erlend Sunde,2 Jonathan Wisor,3 Jelena Mrdalj,1 Ståle Pallesen,2,4,5 Janne Grønli1
1Department of Biological and Medical Psychology, Faculty of Psychology, University of Bergen, Bergen, Norway; 2Department of Psychosocial Science, Faculty of Psychology, University of Bergen, Bergen, Norway; 3Sleep and Performance Research Center and Department of Translational Medicine and Physiology, Elson S. Floyd College of Medicine, Washington State University, Spokane, WA, USA; 4Norwegian Competence Center for Sleep Disorders, Haukeland University Hospital, Bergen, Norway; 5Optentia Research Focus Area, North-West University, Vanderbijlpark, South Africa
Correspondence: Torhild T Pedersen, Tel +4797007718, Email [email protected]
Purpose: Millions of people work at times that overlap with the habitual time for sleep. Consequently, sleep often occurs during the day. Daytime sleep is, however, characterized by reduced sleep duration. Despite preserved time spent in deep NREM sleep (stage N3), daytime sleep is subjectively rated as less restorative. Knowledge on how night work influences homeostatic sleep pressure is limited. Therefore, we aimed to explore the effect of three consecutive simulated night shifts on daytime sleep and markers of sleep homeostasis.
Patients and Methods: We performed continuous EEG, EMG and EOG recordings in the subjects’ home setting for one nighttime sleep opportunity, and for the daytime sleep opportunities following three consecutive simulated night shifts.
Results: For all daytime sleep opportunities, total sleep time was reduced compared to nighttime sleep. While time spent in stage N3 was preserved, sleep pressure at sleep onset, measured by slow wave activity (1– 4 Hz), was higher than nighttime sleep and higher on day 3 than on day 1 and 2. Elevated EEG power during daytime sleep was sustained through 6 h of time in bed. Slow wave energy was not significantly different from nighttime sleep after 6 h, reflecting a less efficient relief of sleep pressure.
Conclusion: Adaptation to daytime sleep following three consecutive simulated night shifts is limited. The increased homeostatic response and continuation of sleep pressure relief even after 6 h of sleep, are assumed to reflect a challenge for appropriate homeostatic reduction to occur.
Keywords: shift work, daytime sleep, sleep regulation, spectral analysis, sleep homeostasis
Introduction
The human brain and body are naturally programmed to stay awake during the day and to sleep at night. Yet, sleeping during the day can be a necessary part of life, as millions of people work at hours that overlap with the habitual time for sleep. It is reported that shifting the main sleep period to daytime due to night work reduces total sleep time1 and causes poor and non-restorative sleep.2 Sleep loss and non-restorative sleep have significant adverse short- and long-term health consequences3 and may impair cognitive functioning.4
Quantitative EEG studies of daytime sleep have mostly been performed following one single night shift,5–10 although there are a few exceptions. One study investigated daytime sleep in both permanent night shift workers and rotating shift workers after 6 night shifts,11 and one laboratory study looked at 6 daytime sleep periods after 7 simulated night shifts.12 Most of these studies generally support the subjective perception of poor quality of daytime sleep and show that night shift workers normally have a shorter sleep onset latency, albeit with reduced total sleep time compared to ordinary nighttime sleep.
According to the classification of American Academy of Sleep Medicine (AASM), deep nonrapid eye movement (NREM) sleep, stage N3, is defined as a predominance of slow waves and is often referred to as slow wave sleep (SWS).13 SWS is thought to be the most restorative stage of sleep.14 Absolute time spent in SWS, in contrast to stages N1 and N2, is preserved during different sleep opportunities, including daytime sleep after night work. The preservation of time spent in SWS is taken as evidence that this stage is centrally important for the dissipation of sleep pressure, but at the same time not subject to change as a function of sleep pressure.5,7–10 By contrast, the oscillatory activities of cerebral cortex circuits during SWS change as a function of sleep pressure. Using spectral analysis, EEG dynamics of the cortex during SWS are measured by slow wave activity (SWA), representing power density typically in the 0.5–4 Hz range. SWA increases with time in wakefulness and declines during sleep.15 The frontal cortex is particularly sensitive to sleep dependent modulation of slow waves, whereas more posterior areas (central and occipital) also reflect circadian modulation of SWA.16
An important issue to consider is that the intensity of SWA can be masked by total sleep time, given that the longer time in sleep, the smaller is the increase in SWA,17 and vice versa. This aspect is especially relevant when sleep periods are of different lengths, or if time spent in one sleep stage varies within an analysis interval. Slow wave energy (SWE) adds information on the amount of SWA obtained across a given sleep period. SWE and SWA will, therefore, describe somewhat different aspects of the sleep homeostatic function. The rise rate of SWA during sleep reflects the sleep pressure accumulated in prior wake, whereas values of SWE at the end of sleep indicate the extent to which sleep pressure has dissipated in that sleep session.18,19
Studies on night shift work that include quantitative information about SWA during daytime SWS are sparse. Most often the information includes both light NREM sleep (stage N2) and deep NREM sleep (stage N3). One study on rotating shift workers found no change, neither in SWA nor SWE during daytime sleep following one single night shift, compared to nighttime sleep.7 An accumulation of sleep debt after consecutive night shifts (2, 4 or 7 night shifts in a row) has been found by the use of actigraphy in police officers.20 However, it is still not known how consecutive night shifts affect the dynamics of SWA and SWE in SWS (stage N3).
To date, the cost of repeated partial sleep restriction on sleep EEG is better described. The results are somewhat ambiguous. Some studies report that repeated partial sleep restriction does not increase SWA and thus does not cause an increased homeostatic sleep response. Participants in these studies were exposed to sleep restrictions either for 2 nights during the first 4 h of the habitual bedtime,21 or 14 nights with 8, 6 or 4 h sleep opportunity.4 Other studies report increased SWA after 4 and 5 nights with 4 h sleep opportunities,22–24 and increased SWE compared to baseline sleep,23 independent of whether the sleep opportunities were early (23:00–03:00 h) or late (03:00–07:00 h/04:00–08:00 h) in the night. Findings from animal models are also inconsistent. In two different studies, twenty hours of sleep deprivation followed by a 4 h sleep opportunity across 5 days has been found to induce no compensatory response of SWA,25 and an increased SWA compared to baseline.26 Other animal studies on sleep restriction and simulated night shift work did not find any differences in SWA between the experimental conditions.27,28
According to recent recommendations from an expert panel on shift work, no more than three night shifts in a row should be included in a rotating shift schedule to avoid circadian disruption, risks of injuries and potential long-term health risks.29 SWS and SWA are closely related to various fundamental health parameters, such as modulation of endocrine release and reduction of sympathetic nervous activity,30 prevention of cognitive impairment31 and memory consolidation.32 Thus, it is conceivable that changes in quantitative EEG parameters of daytime sleep may very well contribute to health and safety risks.
The present study aimed to investigate daytime sleep EEG following one night shift period consisting of three consecutive simulated night shifts. Based on the literature, we hypothesized an accumulation of sleep debt throughout the night shift period, but a preserved time spent in SWS during daytime sleep after the night shifts. To examine the effect of three consecutive simulated night shifts on changes in the restorative slow waves, we quantified the dynamics of SWA and SWE during stage N3. We hypothesized that changes in cortical slow waves would be more pronounced in frontal EEG derivations and more prominently observed after accumulation of sleep debt and after the 3rd night shift.
Materials and Methods
Participants
Eligible participants were students recruited by flyers or e-mail at the University of Bergen, Norway. Prior to enrollment, a screening procedure was performed to ensure fulfillment of the following criteria: age 19–30 y; Body Mass Index (BMI) <30; not pregnant; not travelled >1 time zone and no night work <1 month before study; no use of tobacco/nicotine, caffeine and/or alcohol during the study; good to excellent self-reported health; no current or relevant history of psychiatric, neurological, heart, lung or sleep disorders/diseases; no use of medications (except contraceptives); no eye diseases; normal color vision; habitual sleep duration of 6–10 h per night; usual wake time between 06:00 and 10:00 h; and no extreme chronotype according to the short Morningness-Eveningness Questionnaire.33
A total of 36 subjects (24 females) provided written informed consent and attended an enrollment session at the laboratory, three days prior to the simulated night shifts. Of these, 19 participants (12 females) were recruited to have polysomnographic (PSG) recordings during a baseline night, simulated night shifts and the following daytime sleep.
Of a total of 19 recruited participants, 2 withdrew from the study before the start of the night shift period, leaving 17 participants (11 females). One withdrew from the study after the first night shift and sleep recording was unavailable for a second participant due to technical issues. This resulted in 15 participants (11 females, 22.2±2.2 years; mean ±SD), each with PSG-recordings for three consecutive daytime sleep periods. In addition, one participant was excluded for D2 due to short sleep duration (<2 h), and due to technical issues PSG data for D3 was missing from another participant. Of these, 12 participants had one baseline night of sleep recording.
Participants completing the study protocol received a financial compensation of approximately 400 EURO. The experiment was conducted according to the declaration of Helsinki and was approved by the Norwegian Regional Committee for Medical and Health Research Ethics (No. 2016/1903). According to the Norwegian Law on Research Ethics, Institutional Review Boards are not assigned in the process of approving research on human subjects.
Design and Procedure
The study was conducted from September 2017 to February 2018. We used a repeated measurement design, consisting of three consecutive simulated night shifts (23:00 to 07:00 h) in a laboratory (see Sunde et al for study protocol).34 Three days prior to the first night shift, participants were instructed to keep a regular sleep schedule based on their habitual sleep timing, with the exception of the third day where sleep was not habitual due to melatonin saliva sampling at home by the participants, ending 1 h after habitual bedtime (see Sunde et al34 for dim-light melatonin onset saliva sampling procedure). Actigraphy (Actiwatch 2, Philips Respironics, The Netherlands) and sleep diary verified adherence to the sleep criteria. The participants were allowed to nap before shifts, but not after 20:00 h and/or longer than 2 h.
The simulated night shift portion of the experiment was performed in a room (30 m2) with no windows, consisting of eight similar workstations separated by partition walls. Each participant had a desktop computer where the screens were covered with a foil (Metolight SFG-10; Asmetec, Germany) filtering out all wavelengths <520 nm. The experimental room was equipped with 20 ceiling mounted LED-luminaires (Modul R 600 LED CCT/RGB MP; Glamox Luxo Lighting AB, Sweden). Light exposure was measured at each workplace using a calibrated spectroradiometer (GL Spectis 1.0 T Flicker; GL Optic, Poland). Measurements were conducted 120 cm from the floor, vertically, facing the same direction as the participants while seated.
During simulated night shifts, participants were exposed to standard full spectrum (~4000 K) light, with a mean intensity of ~90 lux (~57 melanopic lux) from 23:00 to 05:00 h, and 190 lux (~132 melanopic lux) from 05:00 to 07:00 h. The current study was part of a larger project including a bright light condition.34
Laboratory Procedures During Simulated Night Shifts
All participants entered the experimental room at 23:00 h and started the night shift at 23:30 h, after 30 min of adaptation to lighting. During the night shifts, participants mainly performed various neurobehavioral performance tests and answered questionnaires. A main test battery (lasting ~20 min) was completed five times during each night shift at 23:30, 01:00, 02:30, 04:00 and 05:30 h. The main test battery included a Psychomotor Vigilance Task (PVT) and a Digit Symbol Substitution Test (DSST), but other tests were also performed during the shifts, including a Reversal Learning Task, a Working Memory Scanning Task, a Task Switching Test and a Numerosity Discrimination Task. When not being occupied with cognitive tests and/or questionnaires, participants had short breaks and were allowed to engage in quiet activities, such as reading and talking. Participants stayed in the laboratory during the whole night shift, except for toilet breaks. For further details, see Sunde et al.34
Polysomnographic Recordings
An ambulatory PSG-equipment was used to provide one recording of the participants’ ordinary nighttime sleep prior to the night shift period, and for continuous EEG recording during the simulated night shifts and the following daytime sleep. Only the sleep data is presented here. The sleep periods were recorded at home, where participants were able to self-select sleep time.
The PSG data were recorded using SOMNOmedics PSG+ ambulatory devices (SOMNOmedics, GmbH, Randersacker, Germany) and stored at 256 Hz. The analogue low-pass filter was limited to 35 Hz and the high-pass filter to 0.2 Hz. The PSG recordings were performed according to the AASM guidelines.13 The six unipolar EEG derivations of the international 10–20 system (F3:M2, F4:M1, C3:M2, C4:M1, O1:M2, O2:M1) were recorded from scalp electrodes (CNSAC Gold Cup EEG electrodes, MedShop GmbH, Austria) with contralateral mastoid references and a common forehead reference used as a default across all electrodes.
Electromyogram (EMG) was recorded with submental electrodes with a reference electrode placed on the mentalis muscle. For male participants where submental placement was difficult due to facial hair, EMG electrodes were placed over the masseter. Electrooculogram (EOG) was recorded from electrodes placed at the outer canthus of both eyes approximately 1 cm lateral and 1 cm above (E2) or below (E1) the midline, with M2 as the reference electrode. The impedance of EEG and EOG electrodes was kept below 5 kOhm, and below 10 kOhm for EMG electrodes.
Polysomnographic- and EEG Data Analyses
The Domino software (version 2.9.0) was used for sleep stage scoring. Scoring of sleep stages (wake, N1, N2, N3 and REM sleep) was performed according to the AASM guidelines.13 All recordings were scored visually in 30 sec epochs by a trained researcher. The start and end of each sleep recording were determined by subjects’ markers of lights-off and lights-on.
For a qualitative analysis of sleep, EEG power was calculated for each sleep stage in 1 Hz bins from 1 to 20 Hz using Fast Fourier transformation. Furthermore, SWA (1–4 Hz) and SWE (the amount of SWA obtained across a given time period) during stage N3 was calculated from each of three EEG derivations (F4:M1, C4:M1, O2:M1).
Subjective Rating of Sleep Quality and Daytime Functioning
As part of a sleep diary completed during the study, participants were asked to rate their daytime functioning and sleep quality. Using a Likert scale ranging from 1, “very good”, to 5, “very poor”, participants were instructed to rate their daytime functioning just before going to bed. As part of the daytime functioning, participants were told to include the night shift, as they were awake during the nights and slept during the day. As a subjective measure of sleep quality, participants were asked to rate their sleep, using a Likert scale ranging from 1, “very light”, to 5, “very deep”.
Statistics
Linear mixed models (LMM) were used to analyze sleep parameters, SWA, SWE and distribution of 1–20 Hz for difference between daytime sleep and nighttime sleep. Sleep period (N: nighttime sleep; D1: daytime sleep after 1st night shift; D2: daytime sleep after 2nd night shift; D3: daytime sleep after 3rd night shift) was set as a fixed effect and participant as a random effect. In addition, for analyses of SWA and SWE time bin (90 min, 180 min, 270 min and 360 min) and their interaction was set as fixed effects, and for analyses of the distribution of 1–20 Hz, each 1 Hz bin and their interaction were included as fixed effects. The Least Significant Difference (LSD) was used to assess differences between levels of fixed factors in sleep and wake parameters. Cohen's d was calculated as a measure of the effect size.35 Data are presented as mean ± SEM unless otherwise stated. All statistical analyses were performed with IBM SPSS Statistics, version 25.
Results
Unaffected Scores on Self-Reported Sleep Quality
The participants rated their sleep quality as not to be affected by night work (F (3,43) = 1.46, p = 0.24). Despite the absence of a perceived effect on sleep quality, the participants rated their daytime functioning after daytime sleep poorer than after nighttime sleep (F (3,40) = 3.13, p = 0.036), both after D1 (0.73 ± 0.34, p = 0.036; d = 0.54) and D2 (0.94 ± 0.32, p = 0.006; d = 0.75). After D3, the daytime functioning was no longer rated significantly poorer than after nighttime sleep (0.63 ± 0.34, p = 0.074; d = 0.43).
PSG Assessed Nighttime Sleep
During nighttime sleep, all participants displayed a typical organization of sleep and wakefulness, with the mean lights off at 23:58 ± 0:17 h (mean ± SEM) and sleep onset at 00:10 ± 0:17 h. The mean light on time was 08:08 ± 0:19 h. The amounts and durations of the different sleep stages were typical of values expected for nighttime sleep; ~7.5 h TST, including 6.9% N1, 41.9% N2, 23.7% N3 and 27.5% REM sleep. Approximately 5% of the time spent in bed was awake. See more details in Figure 1.
 |
Figure 1 Sleep parameters. Data from nighttime sleep (N) (n=12) and three successive daytime sleep periods (D1–D3) (n = 15, all days). The values are in minutes, expressed as mean ± SEM. **p<0.01, *p < 0.05, compared to nighttime sleep. |
Accumulation of Sleep Debt but Preserved Time Spent in Deep NREM Sleep Following Three Consecutive Simulated Night Shifts
The simulated night shifts ended at 07:00 h. The mean time for lights off was 07:29 ± 0:04 h (mean ± SEM), mean sleep onset was 07:35 ± 0:05 h and mean lights on at 14:09 ± 0:15 h.
Total sleep time was shorter during daytime sleep compared to nighttime sleep (F (3,54) = 3.36, p = 0.025), following all three night shifts (D1: −73.2 ± 28.9 min, p = 0.014, d=0.96; D2: −74.1 ± 28.9 min, p=0.013, d=0.97; D3: −80.3 ± 28.9 min, p=0.007, d=1.05). In total, the cumulative sleep debt was 227.6 min after a night shift period consisting of three shifts. See Figure 1.
Changes in sleep architecture during daytime sleep were indicative of an increased sleep propensity. The latency to sleep was shorter (F (3,54) = 2.9, p = 0.043) at D1 (−4.6 ± 2.2 min, p = 0.046, d = 0.81), D2 (−5.6 ± 2.2 min, p = 0.016, d = 1.00) and D3 (−6.0 ± 2.2 min, p=0.010, d=1.1) compared to nighttime sleep. The latency to stage N3 was not different from nighttime sleep (F (3,41) = 0.8, p = 0.51; D1: −0.2 ± 5.6 min, d = 0.01; D2: −6.6 ± 5.5 min, d = 0.43; D3: −4.7 ± 5.6 min, d = 0.30). Notably, time spent in N3 was not significantly shorter compared to nighttime sleep (F (3,43) = 0.9, p = 0.45; D1: −0.9 ± 7.6 min, d = 0.02; D2: −10.4 ± 7.6 min, d = 0.39; D3: −7.1 ± 7.5 min, d = 0.28).
Sleep was more consolidated after night shifts, as number of transitions between wake and sleep and between the different sleep stages, indicated by the transition-index, was significantly lower (F (3,40) = 3.1, p = 0.036) on D2 (−2.5 ± 0.94, p = 0.012, d = 0.61) and D3 (−1.9 ± 0.94, p = 0.050, d = 0.51) than nighttime sleep. No significant differences between daytime sleep and nighttime sleep were found regarding wake after sleep onset (WASO) (F (3, 39) = 2.1, p = 0.12; D1: 6.9 ± 6.7 min, d = 0.32; D2: 5.9 ± 6.6 min, d = 0.23; D3: −8.1 ± 6.9 min, d = 0.54), number of arousals (F (3, 38) = 1.2, p = 0.33; D1: −0.30 ± 0.60, d = 0.00; D2: −0.94 ± 0.59, d = 0.36; D3: −0.04 ± 0.59, d = 0.12) or sleep efficiency (F (3, 40) = 2.4, p = 0.084; D1: −2.12 ± 1.67, d = 0.40; D2: −1.32 ± 1.67, d = 0.32; D3: 1.87 ± 1.66, d = 0.64).
Thus, these data indicate that three consecutive simulated night shifts are followed by an accumulated sleep debt, increased sleep propensity but preserved time spent in N3.
Duration of stage N3 affects the estimation of the homeostatic parameters; therefore, we assessed whether episode duration changed between nighttime sleep and consecutive daytime sleep. We found no significant change in stage N3 episode duration for each 90-min bout in D1-D3 compared to nighttime sleep (F’s (3,37) <0.9, p > 0.4).
Tendency to Shortened REM Sleep Latency and Duration During Daytime Sleep
Latency to REM sleep was not significantly different between daytime sleep and nighttime sleep (F (3,44) = 2.2, p = 0.10), though latencies were shorter on D1-D3 with medium-to-large effect sizes (D1: −23.3 ± 11.8 min, d = 0.69; D2: −19.3 ± 11.8 min, d = 0.57; D3: −28.7 ± 11.7 min, d = 0.85).
Time spent in REM sleep was close to significance (F (3,44) = 2.7, p = 0.057), where less time in REM sleep on D1-D3 showed medium-to-large effect sizes (D1: −30.9 ± 11.3 min, d = 0.97; D2: −22.8 ± 11.3 min, d = 0.71; D3: −15.1± 11.3 min, d = 0.47). See Figure 1.
The data suggest a trend towards a more rapid transition to REM sleep, but shortened time in REM sleep, during daytime sleep opportunities.
Simulated Night Shifts Profoundly Increase SWA in Stage N3 from D1 to D3
The N3 EEG spectra (1–20 Hz range) during daytime sleep were affected by night shifts, and the changes were frequency-specific (Figure 2). Delta (<5 Hz) activity was increased in the frontal derivation during the first 90-min window (F (57,1005) = 5.1, p <0.0001). Delta and theta (<7 Hz) activities were significantly enhanced compared to nighttime sleep in the central derivation (F (57,1005) = 7.2, p < 0.0001). Significant changes in the occipital region included delta, theta and alpha activity (<11 Hz) (F (57,1005) = 6.4, p <0.0001). The average EEG power in N3 after 6 h of sleep exhibited a similar pattern (see Figure 2, lower panel). Notably, the N3 EEG spectra were more affected after the third night shift as indicated by significantly higher EEG power in D3 compared to D1 and D2.
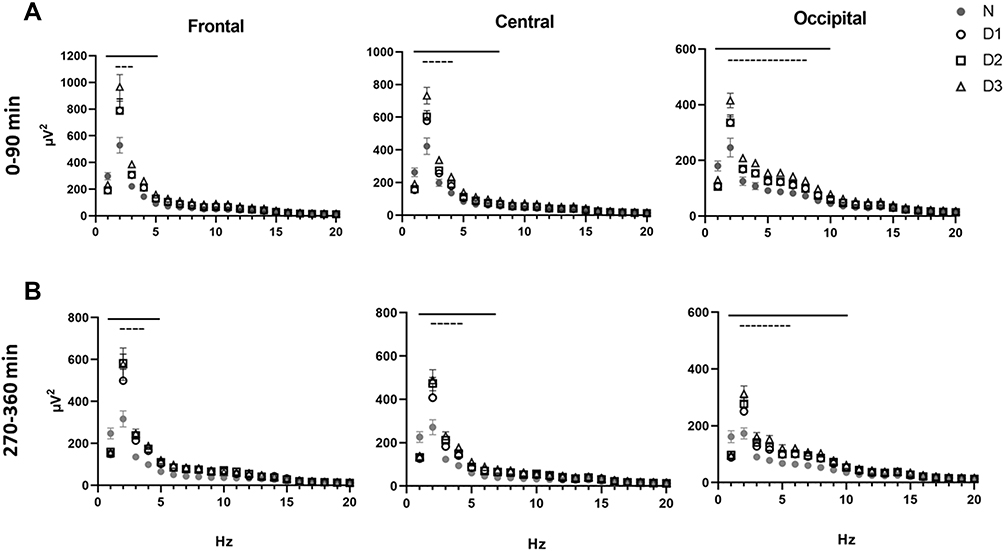 |
Figure 2 Effect of consecutive night shifts on the electroencephalographic power profiles in stage N3 during (A) the first 90-min interval of sleep (n=14), and (B) the fourth 90-min interval of sleep prior to awakening (n=7). Data from nighttime sleep (N) and three successive daytime sleep periods (D1–D3). Values represent mean ± SEM in the 1 to 20 Hz range across the sleep period. Black lines indicate significant difference from nighttime sleep (N) (p<0.05). Dashed lines indicate significant differences among daytime sleep periods (D3 vs both D1 and D2) (p’s<0.05). |
To examine how consecutive night shifts change the slow oscillations during sleep, we measured SWA in N3, averaged across 90 min windows (Figure 3A). SWA was highest at the beginning and declined during time of sleep, in line with the homeostatic process. Notably, in all daytime sleep periods (D1-D3), SWA was significantly higher compared to nighttime sleep throughout the whole sleep period, in all three cortical regions (all p < 0.0001), except for the last 90 min at D1 (p > 0.05). Moreover, the increase in SWA was pronounced and significantly higher at D3 than D1 (p < 0.05) and D2 (except for the last 90 min) (p < 0.05), revealing a significant inter-day build-up of sleep debt.
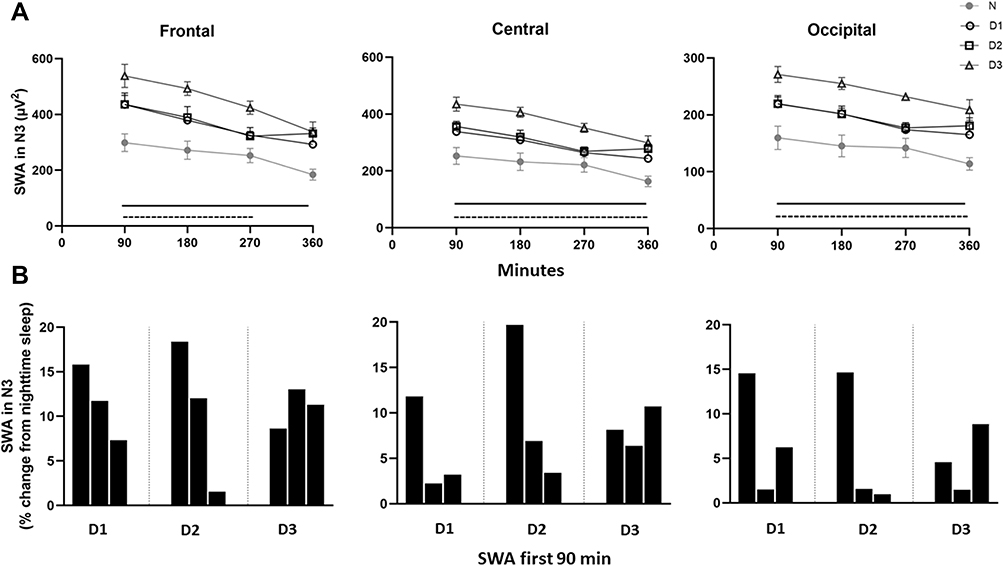 |
Figure 3 Slow wave activity in stage N3. Data from nighttime sleep (N) and three successive daytime sleep periods (D1-D3). Upper panel (A) slow wave activity (SWA) averaged across 90-min intervals. Values are presented as mean ± SEM. Data in frontal, central and occipital derivations. Black lines indicate significant difference from night sleep (p’s<0.05). Note that in the fourth 90-min interval there is only a significant difference between D2/D3 and nighttime sleep. Dashed lines indicate higher EEG power in D3 compared to D1 and D2 (p’s<0.05). Lower panel (B) The build-up of SWA the first 90 min in D1–D3. Data are presented as % change from N in 30-min intervals. |
A sensitive indicator of sleep pressure is the change in the dynamics of SWA during the first NREM sleep period. Changes in the rise of SWA in the initial part of daytime sleep periods compared to nighttime sleep are illustrated in Figure 3B. Here, the percent increase in SWA of the three first 30 min bouts clearly indicates an intensified sleep pressure during D1, D2 and D3, and that the frontal derivation is particularly sensitive to sleep pressure changes. It is concluded that daytime sleep revealed a more rapid manifestation of SWA at the onset of stage N3 than nighttime sleep.
Higher delta power at the beginning and through the duration of 6 h of sleep may be a result of increased need to discharge slow wave sleep during daytime sleep. To address the efficiency of SWA in relieving sleep pressure, we measured SWE in N3 (the EEG power times minutes spent in N3) (Figure 4). During the first 90 mins of sleep, on all days, SWE was significantly higher compared to nighttime sleep levels, across all cortical areas (p’s < 0.01) (frontal, D1: +7869.6 µV2*min; D2: +6536.8 µV2*min; D3: +9659.3 µV2*min; central, D1: +5330.2 µV2*min; D2: +5201.4 µV2*min; D3: +7445.0 µV2*min; and occipital, D1: +3410.9 µV2*min; D2: +2970.6 µV2*min; D3: +4502.5 µV2*min). During the last four 90-min intervals of daytime sleep (from 270 min after sleep onset to 360 min), SWE was no longer significantly different from nighttime sleep in any of the cortical areas. Nonetheless, the cumulative SWE discharged across the entire 6 h recording was significantly elevated during daytime sleep relative to nighttime sleep in the frontal (F (3,31) = 3.6, p = 0.025), central (F (3,31) = 3.4, p = 0.031) and occipital (F (3,33) = 3.0, p = 0.042) derivation, respectively.
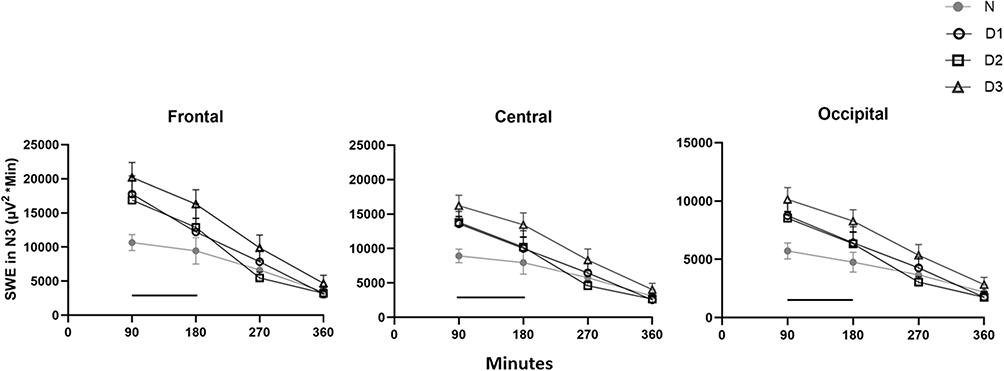 |
Figure 4 Slow wave energy in N3. Data from nighttime sleep (N) and three successive daytime sleep periods (D1–D3). Slow wave energy (SWE) averaged across 90-min intervals. Values are presented as mean ±SEM. Data in frontal, central and occipital derivations. Black lines indicate significant difference in D1/D2/D3 vs nighttime sleep (p’s<0.05). Note in the second 90-min interval there is only a significant difference between D3 and nighttime sleep. |
Discussion
This study shows that the impact of a night shift period consisting of three consecutive simulated night shifts on daytime sleep varies across sleep parameters, EEG power spectra and objective markers of homeostatic sleep responses. Regardless of preserved time in the deep NREM sleep, adaptation to daytime sleep was limited. Sleep debt accumulated across days and the sleep propensity increased, both at sleep onset and after 6 h of sleep. Notably, the intensifying of SWA was pronounced after the 3rd night shift. These findings imply that mechanisms of sleep are less likely to adapt to night shift work, at least in the short term.
Support for this contention comes from comparisons to ordinary nighttime sleep, and of the sleep/wake measures within the three consecutive daytime sleep periods. The homeostatic drive for sleep (indicated by latency to enter sleep and the rate of rise of SWA) was higher compared to nighttime sleep and became increasingly altered across the simulated night shift period. Additionally, the sleep debt accumulated as time spent sleeping was lowest at D3. Other quantitative EEG field7–10 and laboratory5 studies after one single night shift report a reduced total sleep time of >1.5 h. However, laboratory studies looking at sleep after 6 night shifts have reported some conflicting results. Dahlgren11 found reduced total sleep time in both permanent and rotating shift workers, supporting our findings, though Lamond et al12 found that total sleep time was not significantly different from nighttime sleep across 6 daytime sleep periods. One explanation for the enhanced sleep duration in the study by Lamond et al could be that the participants were shielded from social and environmental disturbances throughout the experiment. Disturbed sleep after simulated night shift work is also supported by an animal model of shift work, where simulated night shift work in the resting phase reduces total sleep time in the active phase.28
The principal challenge with night work is to obtain enough and restorative sleep during the day. Important restorative functions occur during all stages of sleep, whereas SWS is suggested to play a major role in energy conservation and in nervous system recuperation. The present study suggests a preserved time spent in stage N3 throughout the simulated night shift period, where only minor deviations from ordinary nighttime sleep were found (from −1 min at D1 to −7 min at D3). This is in line with studies on sleep following one single night shift,5,7–10 and two studies on daytime sleep following 6 night shifts,11,12 where time spent in SWS was found to be preserved.
In addition to time spent in N3, the continuity of this sleep stage is of importance to the restorative effect of sleep. Grønli et al28 found that rats housed in moving running wheels during their normal resting phase showed reduced NREM sleep episode-length compared to those housed in moving running wheels during their normal active phase. It should be mentioned that SWS (stage N3) is not a distinguished sleep stage in rodents. However, as in humans, SWA oscillates in synchrony with the NREM-REM sleep cycles, though with a shorter periodicity due to brain size.36 The present study found no such difference in the continuity of stage N3 between daytime sleep and nighttime sleep. However, our characterization of the EEG of deep NREM sleep suggests that the restorative function is highly affected during a night shift period. Both the spectral profiles in the 1–20 Hz range (Figure 2), changes in SWA in the first and fourth 90-min intervals of sleep (Figure 3A), and SWE in the first half of the recording (Figure 4) were elevated across all the different cortical areas, compared to nighttime sleep.
After three consecutive night shifts, our data show that sleep intensity in the first 90-min interval of sleep (+33% from D1 to D3) and the fourth 90-min interval of sleep (+25% from D1 to D3) (Figure 3A) increases profoundly, supporting the concept that night shift work induces a compensatory response of SWA, similar to that found following repeated partial sleep restriction.22,24 This finding demonstrates a clear cumulative alteration in the homeostatic sleep response in the context of consecutive night shifts.
The increased sleep pressure at the end of the daytime sleep period relative to nighttime sleep contrasts with the participants subjective rating of a sleep quality non-affected by night shift work. SWE would be a reasonable measure of the efficiency to relieve sleep pressure.17 At the beginning of daytime sleep, SWE was significantly higher than nighttime sleep. This would be expected since SWE is calculated based on SWA, and SWA was significantly increased in the first 90 min of sleep. However, after 6 h of daytime sleep, SWE was no longer significantly different from nighttime sleep (see Figure 4). Since SWA was found to be increased after 6 h of sleep, reduced time spent in stage N3 at the end of the sleep period could explain these findings, indicating a less efficient relief of sleep pressure. Still, the total cumulative SWE discharged across 6 h of sleep was increased in all daytime sleep recordings relative to the baseline night.
The quantitative EEG response to consecutive night shifts was slightly higher in the frontal than in the central and occipital areas. Similar findings of globally increased EEG power density of the lower frequencies, but with a frontal dominance, are also reported after 40 h of sleep deprivation37 and after 5 days of repeated partial sleep restriction with a 4 h sleep opportunity.23 The frontal dominance reflects the increased sensitivity of the EEG derived from this cortical region to perturbations of sleep homeostasis relative to more posterior regions.14,38,39 Moreover, all participants in the present study performed in-laboratory tests using visual modalities, lasting approximately 20 min, five times during each shift. Visual tests actively engage the occipital cortex, and the EEG responses may also be a result of local, use-dependent sleep homeostatic processes induced by cognitive workload and visual neural processing during the shift.40 Still, the global effects of EEG observed after insufficient sleep may reflect multiple changes, in terms of the drive to initiate sleep, consequences of sleep loss and sleep regulatory processes. Altered network dynamics after a night shift period manifested at the behavior or metabolic level have not yet been described.
Restorative functions of sleep are thought to be important for efficient daytime functioning. Accordingly, the participants rated their daytime functioning to be poorer after D1 and D2 than after nighttime sleep. However, after D3, the daytime functioning was rated to be similar to after nighttime sleep. This change in the perception of daytime functioning contrasts with the objective findings of accumulated sleep debt and increased homeostatic sleep response. There are several possible explanations for such discrepancy. First, impaired daytime functioning is maintained, at least in part, by subjective perception of sleep.41 Since the participants rated their sleep quality not to be affected by night shift work, this may influence the perception of daytime functioning. Secondly, the intensified SWA may reflect increased recuperative response to sleep loss, resulting in the feeling of being rested. Thirdly, the perception of daytime functioning may be influenced by the incentive effect, through expectations of a day off and the recognition of termination of the night-shift period.42
Shift-work disorder is classified as a circadian sleep-wake disorder.43 The perturbed circadian function experienced by shift workers is extensively reported (i.e.44,45) and better studied than the perturbed homeostatic function. If, how and to what degree the sleep homeostatic response is affected by night work has been surprisingly little studied. Most studies have concluded that the time spent in SWS/stage N3 is preserved; however, absolute time in SWS/stage N3 does not reflect homeostatic response and sleep pressure. Our results suggest that there are constraints on the dissipation of homeostatic sleep pressure during sleep following consecutive night shifts and document a need for further investigation of perturbed homeostatic functions during night shift work.
Strengths and Limitations
The present study is, to our knowledge, the first using EEG during a night shift period consisting of multiple simulated night shifts, contributing to a better understanding of sleep dynamics and sleep homeostatic responses.
In order to enhance the ecological validity of the results, PSG was monitored in the usual home sleep setting. However, home recordings of sleep increase the risk of technical errors, and external factors may very well disrupt the sleep, which could have been avoided in a laboratory setting. Furthermore, the current study allowed the participants to self-select sleep time after each night shift and napping between the night shifts to mimic daytime sleep opportunities, similar to the real-life night-shift workers. Both components, sleeping in a safe environment and napping, may modulate the sleep pressure.14,46 Oscillations in the 0.5–1 Hz range exhibit sleep/wake dependent homeostatic changes,47 but are distinct from oscillations in the 1–4 Hz range, both in terms of their sources48 and their temporal dynamics47 across sleep. The EEG SWA was calculated in the 1–4 Hz range due to limited options in the analysis software. Therefore, we cannot rule out that information about changes in the 0.5–1 Hz range could contribute to more knowledge about the homeostatic response to consecutive night shifts.
In the European health sector, 78% of the night shift workers are women,49 thus parallel to the gender distribution in our study. Even so, future studies should ensure a more equal gender distribution, exploring the possible gender-differences in tolerance to night shift work. Our participants were young adults from a student population, and do not necessarily reflect the “average” night shift worker. Field or laboratory studies including actual night shift workers, and a larger distribution of age, are thus warranted.
Additional considerations are the restricted number of PGS devices available, participant dropouts, and technical issues, all of which lowered the sample size (n = 15) weakening the statistical power. This is reflected by some non-significance despite medium-to-large effect sizes for the main effects of the LMM analyses on parameters like latency to- and time spent in REM sleep.
Conclusion
In summary, adaptation to daytime sleep following three consecutive simulated night shifts is limited. Compared to nighttime sleep, total sleep time was reduced, resulting in a cumulative sleep loss. Although time spent in stage N3 was preserved, the sleep intensity was markedly altered. There was a substantial increase in a global compensatory homeostatic response, as indicated by elevated EEG power, particularly in the low-frequency range of the frontal, central and occipital cortex. A considerably increased sleep intensity was observed after the 3rd successive night shift. After 6 h of sleep, the level of SWE did not deviate from nighttime sleep, reflecting an insufficient relief from sleep pressure. Future studies should further investigate these processes in night shift periods longer than three shifts, during quick rotation shifts and importantly in the recovery-days after night shift periods.
The circadian system, through its interactions with homeostatic processes even at the cellular level, does play a role in facilitating the generation of SWA. A perturbed circadian rhythm may disturb cellular processes in the brain that underlie sleep homeostasis, and thereby affect the generation of SWA. For instance, the synaptosomal-associated Protein, 25 kDa (SNAP-25) serves both as a driver of circadian rhythmicity50 and a regulator of sleep-dependent slow wave activity.38 A question to be asked is whether the sleep homeostatic response remains or reaches a peak level after three night shifts, and if this is regulated by an allostatic process (at the level of cellular physiology, sleep EEG and/or other physiological responses) when facing additional sleep loss.
Disclosure
The authors report no conflicts of interest in this work.
References
1. Åkerstedt T. Shift work and disturbed sleep/wakefulness. Occup Med. 2003;53(2):89–94. doi:10.1093/occmed/kqg046
2. Ganesan S, Magee M, Stone JE, et al. The impact of shift work on sleep, alertness and performance in healthcare workers. Sci Rep. 2019;9(1):4635. doi:10.1038/s41598-019-40914-x
3. Banks S, Dinges DF. Behavioral and physiological consequences of sleep restriction. J Clin Sleep Med. 2007;03(05):519–528. doi:10.5664/jcsm.26918
4. Van Dongen H, Maislin G, Mullington JM, Dinges DF. The cumulative cost of additional wakefulness: dose-response effects on neurobehavioral functions and sleep physiology from chronic sleep restriction and total sleep deprivation. Sleep. 2003;26(2):117–126. doi:10.1093/sleep/26.2.117
5. Matsumoto K. Sleep patterns in hospital nurses due to shift work: an EEG study. Waking Sleeping. 1978;2:169–173.
6. Tilley AJ, Wilkinson R, Warren P, Watson B, Drud M. The sleep and performance of shift workers. Hum Factors. 1982;24(6):629–641. doi:10.1177/001872088202400601
7. Åkerstedt T, Kecklund G, Knutsson A. Spectral analysis of sleep electroencephalography in rotating three-shift work. Scand J Work Environ Health. 1991;17:330–336. doi:10.5271/sjweh.1694
8. Torsvall L, Akerstedt T, Gillander K, Knutsson A. Sleep on the night shift: 24‐hour EEG monitoring of spontaneous sleep/wake behavior. Psychophysiology. 1989;26(3):352–358. doi:10.1111/j.1469-8986.1989.tb01934.x
9. Torsvall L, Åkerstedt T, Gillberg M. Age, sleep and irregular work hours: a field study with electroencephalographic recordings, catecholamine excretion and self-ratings. Scand J Work Environ Health. 1981;7:196–203.
10. Smith-Coggins R, Rosekind MR, Hurd S, Buccino KR. Relationship of day versus night sleep to physician performance and mood. Ann Emerg Med. 1994;24(5):928–934. doi:10.1016/S0196-0644(94)70209-8
11. Dahlgren K. Adjustment of circadian rhythms and EEG sleep functions to day and night sleep among permanent night workers and rotating shiftworkers. Psychophysiology. 1981;18(4):381–391. doi:10.1111/j.1469-8986.1981.tb02469.x
12. Lamond N, Dorrian J, Roach G, et al. The impact of a week of simulated night work on sleep, circadian phase, and performance. Occup Environ Med. 2003;60(11):e13. doi:10.1136/oem.60.11.e13
13. Berry RB, Brooks R, Gamaldo CE, Harding SM, Marcus C, Vaughn BV. The AASM manual for the scoring of sleep and associated events. Rules, Terminology and Technical Specifications. Darien, Illinois: American Academy of Sleep Medicine; 2012:2012.
14. Dijk D-J. Regulation and functional correlates of slow wave sleep. J Clin Sleep Med. 2009;5(2 suppl):S6–S15. doi:10.5664/jcsm.5.2S.S6
15. Borbély AA. A two process model of sleep regulation. Hum Neurobiol. 1982;1(3):195–204.
16. Lazar AS, Lazar ZI, Dijk D-J. Circadian regulation of slow waves in human sleep: topographical aspects. Neuroimage. 2015;116:123–134. doi:10.1016/j.neuroimage.2015.05.012
17. Banks S, Van Dongen HP, Maislin G, Dinges DF. Neurobehavioral dynamics following chronic sleep restriction: dose-response effects of one night for recovery. Sleep. 2010;33(8):1013–1026. doi:10.1093/sleep/33.8.1013
18. Skorucak J, Arbon EL, Dijk D-J, Achermann P. Response to chronic sleep restriction, extension, and subsequent total sleep deprivation in humans: adaptation or preserved sleep homeostasis? Sleep. 2018;41(7). doi:10.1093/sleep/zsy078
19. Dijk DJ, Beersma DG, Daan S, Bloem GM, Van den Hoofdakker RH. Quantitative analysis of the effects of slow wave sleep deprivation during the first 3 h of sleep on subsequent EEG power density. Eur Arch Psychiatry Neurol Sci. 1987;236(6):323–328.
20. Garde AH, Nabe-Nielsen K, Jensen MA, Kristiansen J, Sørensen JK, Hansen ÅM. The effects of the number of consecutive night shifts on sleep duration and quality. Scand J Work Environ Health. 2020;46(4):446–453. doi:10.5271/sjweh.3885
21. Brunner DP, Dijk D-J, Tobler I, Borbély AA. Effect of partial sleep deprivation on sleep stages and EEG power spectra: evidence for non-REM and REM sleep homeostasis. Electroencephalogr Clin Neurophysiol. 1990;75(6):492–499. doi:10.1016/0013-4694(90)90136-8
22. Åkerstedt T, Kecklund G, Ingre M, Lekander M, Axelsson J. Sleep homeostasis during repeated sleep restriction and recovery: support from EEG dynamics. Sleep. 2009;32(2):217–222. doi:10.1093/sleep/32.2.217
23. Goel N, Banks S, Mignot E, Dinges DF. PER3 polymorphism predicts cumulative sleep homeostatic but not neurobehavioral changes to chronic partial sleep deprivation. PLoS One. 2009;4(6):e5874.
24. Brunner DP, Dijk D-J, Borbély AA. Repeated partial sleep deprivation progressively changes the EEG during sleep and wakefulness. Sleep. 1993;16(2):100–113. doi:10.1093/sleep/16.2.100
25. Kim Y, Laposky AD, Bergmann BM, Turek FW. Repeated sleep restriction in rats leads to homeostatic and allostatic responses during recovery sleep. Proc Natl Acad Sci. 2007;104(25):10697–10702. doi:10.1073/pnas.0610351104
26. Leemburg S, Vyazovskiy VV, Olcese U, Bassetti CL, Tononi G, Cirelli C. Sleep homeostasis in the rat is preserved during chronic sleep restriction. Proc Natl Acad Sci. 2010;107(36):15939–15944. doi:10.1073/pnas.1002570107
27. Lancel M, Kerkhof GA. Effects of repeated sleep deprivation in the dark-or light-period on sleep in rats. Physiol Behav. 1989;45(2):289–297. doi:10.1016/0031-9384(89)90130-3
28. Grønli J, Meerlo P, Pedersen TT, et al. A rodent model of night-shift work induces short-term and enduring sleep and electroencephalographic disturbances. J Biol Rhythms. 2017;32(1):48–63. doi:10.1177/0748730416675460
29. Garde AH, Begtrup L, Bjorvatn B, et al. How to schedule night shift work in order to reduce health and safety risks. Scand J Work Environ Health. 2020;46(6):557.
30. Van Cauter E, Spiegel K, Tasali E, Leproult R. Metabolic consequences of sleep and sleep loss. Sleep Med. 2008;9:S23–S28. doi:10.1016/S1389-9457(08)70013-3
31. Bellesi M, Riedner BA, Garcia-Molina GN, Cirelli C, Tononi G. Enhancement of sleep slow waves: underlying mechanisms and practical consequences. Front Syst Neurosci. 2014;8:208.
32. Rasch B, Born J. About sleep’s role in memory. Physiol Rev. 2013. doi:10.1152/physrev.00032.2012
33. Adan A, Almirall H. Horne & Östberg morningness-eveningness questionnaire: a reduced scale. Pers Individ Dif. 1991;12(3):241–253. doi:10.1016/0191-8869(91)90110-W
34. Sunde E, Mrdalj J, Pedersen T, et al. Role of nocturnal light intensity on adaptation to three consecutive night shifts: a counterbalanced crossover study. Occup Environ Med. 2020;77(4):249–255. doi:10.1136/oemed-2019-106049
35. Cohen J. Statistical Power Analysis for the Behavioral Sciences. Academic press; 2013.
36. Franken P, Tobler I, Borbély A. Varying photoperiod in the laboratory rat: profound effect on 24-h sleep pattern but no effect on sleep homeostasis. Am J Physiol Regul Integr Comp Physiol. 1995;269(3):R691–R701. doi:10.1152/ajpregu.1995.269.3.R691
37. Cajochen C, Foy R, Dijk D-J. Frontal predominance of a relative increase in sleep delta and theta EEG activity after sleep loss in humans. Sleep Res Online. 1999;2(3):65–69.
38. Krone LB, Yamagata T, Blanco-Duque C, et al. A role for the cortex in sleep–wake regulation. Nat Neurosci. 2021;24(9):1210–1215. doi:10.1038/s41593-021-00894-6
39. Huber R, Deboer T, Tobler I. Topography of EEG dynamics after sleep deprivation in mice. J Neurophysiol. 2000;84(4):1888–1893. doi:10.1152/jn.2000.84.4.1888
40. Goel N, Abe T, Braun ME, Dinges DF. Cognitive workload and sleep restriction interact to influence sleep homeostatic responses. Sleep. 2014;37(11):1745–1756. doi:10.5665/sleep.4164
41. Semler CN, Harvey AG. Misperception of sleep can adversely affect daytime functioning in insomnia. Behav Res Ther. 2005;43(7):843–856.
42. Haslam D. The incentive effect and sleep deprivation. Sleep. 1983;6(4):362–368. doi:10.1093/sleep/6.4.362
43. Sateia MJ. International classification of sleep disorders. Chest. 2014;146(5):1387–1394. doi:10.1378/chest.14-0970
44. Roden M, Koller M, Pirich K, Vierhapper H, Waldhauser F. The circadian melatonin and cortisol secretion pattern in permanent night shift workers. Am J Physiol Regul Integr Comp Physiol. 1993;265(1):R261–R267. doi:10.1152/ajpregu.1993.265.1.R261
45. Sack RL, Blood ML, Lewy AJ. Melatonin rhythms in night shift workers. Sleep. 1992;15(5):434–441. doi:10.1093/sleep/15.5.434
46. Åkerstedt T, Wright KP. Sleep loss and fatigue in shift work and shift work disorder. Sleep Med Clin. 2009;4(2):257–271.
47. Hubbard J, Gent TC, Hoekstra MM, et al. Rapid fast-delta decay following prolonged wakefulness marks a phase of wake-inertia in NREM sleep. Nat Commun. 2020;11(1):1–16. doi:10.1038/s41467-020-16915-0
48. Steriade M, Nunez A, Amzica F. A novel slow (< 1 Hz) oscillation of neocortical neurons in vivo: depolarizing and hyperpolarizing components. J Neurosci. 1993;13(8):3252–3265.
49. Parent-Thirion A, Biletta I, Cabrita J, et al. Eurofound: sixth European working conditions survey—overview report (2017 update). Publications Office of the European Union, Luxembourg Google Scholar. 2017.
50. Oliver PL, Sobczyk MV, Maywood ES, et al. Disrupted circadian rhythms in a mouse model of schizophrenia. Curr Biol. 2012;22(4):314–319. doi:10.1016/j.cub.2011.12.051
 © 2022 The Author(s). This work is published and licensed by Dove Medical Press Limited. The
full terms of this license are available at https://www.dovepress.com/terms
and incorporate the Creative Commons Attribution
- Non Commercial (unported, 3.0) License.
By accessing the work you hereby accept the Terms. Non-commercial uses of the work are permitted
without any further permission from Dove Medical Press Limited, provided the work is properly
attributed. For permission for commercial use of this work, please see paragraphs 4.2 and 5 of our Terms.
© 2022 The Author(s). This work is published and licensed by Dove Medical Press Limited. The
full terms of this license are available at https://www.dovepress.com/terms
and incorporate the Creative Commons Attribution
- Non Commercial (unported, 3.0) License.
By accessing the work you hereby accept the Terms. Non-commercial uses of the work are permitted
without any further permission from Dove Medical Press Limited, provided the work is properly
attributed. For permission for commercial use of this work, please see paragraphs 4.2 and 5 of our Terms.