Back to Journals » International Journal of Nanomedicine » Volume 12
Skeleton labeled 13C-carbon nanoparticles for the imaging and quantification in tumor drainage lymph nodes
Authors P Xie, Xin Q, Yang S ![]() , He T, Huang Y, Zeng G, Ran M, Tang XH
, He T, Huang Y, Zeng G, Ran M, Tang XH ![]()
Received 11 February 2017
Accepted for publication 10 April 2017
Published 11 July 2017 Volume 2017:12 Pages 4891—4899
DOI https://doi.org/10.2147/IJN.S134493
Checked for plagiarism Yes
Review by Single anonymous peer review
Peer reviewer comments 2
Editor who approved publication: Professor Lei Yang
Ping Xie,1 Qian Xin,2 Sheng-Tao Yang,3 Tiantian He,2,4 Yuanfang Huang,2 Guangfu Zeng,2,4 Maosheng Ran,2,5 Xiaohai Tang2
1State Key Laboratory of Oral Diseases, West China College of Stomatology, Sichuan University, Chengdu, 2Chongqing Lummy Pharmaceutical Co., Ltd, Chongqing, 3College of Chemistry & Environment Protection Engineering, Southwest University for Nationalities, 4College of Life Sciences, Sichuan Normal University, 5State Key Laboratory of Biotherapy, West China Hospital, West China Medical School, Sichuan University, Chengdu, People’s Republic of China
Abstract: Carbon nanoparticles (CNPs) have been widely used in tumor drainage lymph node (TDLN) imaging, drug delivery, photothermal therapy, and so on. However, during the theranostic applications, the accumulation efficiency of CNPs in target organs is unknown yet, which largely hinders the extension of CNPs into clinical uses. Herein, we prepared skeleton-labeled 13C-CNPs that had identical properties to commercial CNPs suspension injection (CNSI) for the imaging and quantification in TDLN. 13C-CNPs were prepared by arc discharge method, followed by homogenization with polyvinylpyrrolidone. The size distribution and morphology of 13C-CNPs were nearly the same as those of CNSI under transmission electron microscope. The hydrodynamic radii of both 13C-CNPs and CNSI were similar, too. According to X-ray photoelectron spectroscopy and infrared spectroscopy analyses, the chemical compositions and chemical states of elements were also nearly identical for both labeled and commercial forms. The skeleton labeling of 13C was reflected by the shift of G-band toward lower frequency in Raman spectra. 13C-CNPs showed competitive performance in TDLN imaging, where the three lymph nodes (popliteal lymph node, common iliac artery lymph node, and paraaortic lymph node) were stained black upon the injection into the hind extremity of mice. The direct quantification of 13C-CNPs indicated that 877 µg/g of 13C-CNPs accumulated in the first station of TDLN (popliteal lymph node). The second station of TDLN (common iliac artery lymph node) had even higher accumulation level (1,062 µg/g), suggesting that 13C-CNPs migrated efficiently along lymphatic vessel. The value decreased to 405 µg/g in the third station of TDLN (paraaortic lymph node). Therefore, the 13C-CNPs provided quantitative approach to image and quantify CNSI in biological systems. The implication in biomedical applications and biosafety evaluations of CNSI is discussed.
Keywords: carbon nanoparticles suspension injection, 13C-labeling, isotope ratio mass spectroscopy, quantification, bioeffect of nanomaterials
Introduction
Carbon nanoparticles suspension injection (CNSI) has been widely studied and applied in biomedical areas.1–3 CNSI migrates fast in lymphatic vessel and accumulates in lymph nodes, thus shows high performance in tumor drainage lymph node (TDLN) imaging. Such attempts have been reported in diverse cancer models. For instance, Wu et al detected TDLN in early breast cancer by CNSI.4 Li et al harvested lymph nodes with CNSI in advanced gastric cancer.5 CNSI does not stain the parathyroid gland during the thyroid carcinoma surgery, thus could reduce the risk of false resection. Zhu et al performed the CNSI-guided central lymph node dissection in patients with papillary thyroid carcinoma.6 The adoption of CNSI largely reduced the number of mistakenly dissected parathyroid gland. Gu et al distinguished parathyroid from thyroid and lymph nodes by CNSI, and preserved the parathyroid glands during the surgery.7 CNSI adsorbs drugs well, thus could be used as drug carrier. For example, the regional lymphatic chemotherapy by CNSI-epirubicin was reported by Yang et al, where significant enhancement of the drug concentration in lymph nodes and reduction of plasma drug concentration were observed.8 In another study, Xie et al used CNSI to deliver epirubicin and doxorubicin.9 Beyond the laboratory and clinical studies, CNSI has been adopted in clinical applications. CNSI has been used on more than 50,000 patients per year for TDLN mapping during oncological surgery (data on file, Chongqing Lummy Pharmaceutical Co., Ltd., January, 2017).
Despite the great achievements in the biomedical applications of CNSI, there are still concerns on its absorption, distribution, metabolism and excretion (ADME) behaviors post injection, in particular for developing new clinical applications of CNSI.10 ADME data provide important information on the biological behaviors of CNSI in body and are essential for biosafety evaluations.11 In the studies of other carbon nanomaterials, the ADME data were obtained by quantitative techniques, such as high performance liquid chromatography,12 isotope labeling,13 fluorescence imaging,14 and inductively coupled plasma mass spectrometry.15 However, the distribution of CNSI in body was only monitored by naked eyes or optical microscopes currently, taking advantage of the dark color of carbon.1–3 No information on the absorption, metabolism and excretion of CNSI was obtained. This is far beyond the clinical requirements to achieve the essential ADME data. The major difficulty that hinders the ADME evaluations of CNSI is the lack of proper method for in vivo quantification, because of the low contents of CNSI in tissues, the high carbon background, and the complexity of biological systems.13
In the recent decade, 13C skeleton isotope labeling of carbon nanomaterials has been established as reliable technique for the quantification of trace amount of carbon nanomaterials in biological systems.16–21 The advantages of 13C skeleton isotope labeling include high accuracy, low detection limit, nonradioactive nature, high stability, and suitability in long-term tracing. In 2007, we reported that 13C-carbon nanotubes (CNTs) could be prepared by laser ablation method and quantified by isotope ratio mass spectroscopy (IRMS) in mice.21 The 13C skeleton isotope labeling method was then extended to the quantification of diverse carbon nanomaterials in mice and wheat, such as carbon dots,22 fullerene,19 and their derivatives.16–20 CNSI shared very similar chemical components and structures to the naked carbon dots (carbon particles with diameters of ~3 nm), which had been successfully quantified by 13C skeleton isotope labeling.18 Therefore, 13C skeleton isotope labeling might be hopeful in quantifying CNSI, and the main issue to achieve the quantification is the preparation of 13C-skeleton-labeled CNSI samples of the same physiochemical properties and imaging capability.
Herein, we prepared skeleton-labeled 13C-CNPs that had identical properties to commercial CNSI for the imaging and quantification in TDLN. The aim of our study was to prepare 13C-skeleton-labeled CNPs that had very similar physical/chemical properties and imaging capability to those of commercial CNSI, thus 13C-skeleton-labeled CNPs could be used as the ideal substitute of CNSI for the quantification of CNSI in biosystems and benefit the ADME studies of CNSI in future.
Material and methods
Materials
Amorphous carbon powder (13C content >99.9%) was purchased from Cambridge Isotope Laboratories, Inc., Tewksbury, MA, USA. Polyvinylpyrrolidone (PVP, average molecular weight 40,000) and sodium citrate were obtained from Kelong Chemical Engineering and Reagent Co., Chengdu, People’s Republic of China. Other chemicals were of analytical grade and used without purification.
Preparation of 13C-CNPs
Raw material of 13C-CNPs (13C-ash) was provided by Prof Xue-Ling Chang. She performed the arc discharge experiment and prepared it following the literature protocols.16,17,19 Briefly, the anode electrode was fabricated by coring out of the 12C-carbon rods and packing the core with 13C-enriched amorphous carbon powder (15 wt%). Pure graphite rod was set as the cathode. The arc discharge was performed under Ar atmosphere (135 Torr) with the following parameters: interelectrode distance of 5 mm, current of 110 A, and voltage of 27 V. The ash was collected after the equipment was cooled to room temperature, and refluxed in CS2 to remove fullerene and other soluble substances. The as-prepared ash was washed and dried before homogenization. For homogenization, the ash was grounded and passed through a 100-mesh sieve. Then, 1 g grounded ash was added to 20 mL of PVP aqueous solution (containing 20 mg/mL PVP and 5 mg/mL sodium citrate) and sonicated for 10 min. The homogenization was performed on a homogenizer (F6/10–8G, Fluko, Shanghai, People’s Republic of China) following the parameters: the homogenization at 25,000 rpm for 10 min, the ejection speed of 40 at 102.1 MPa, and the repetition of 10 cycles. Then, the black suspension was obtained for centrifugation at 2,000 rpm for 5 min. The supernatant was collected as the 13C-CNP suspension.
The 13C-CNPs and commercial CNSI were comparatively characterized by transmission electron microscopy (TEM, Autoflex, Bruker, Bonn, Germany), dynamic light scattering (DLS, Zetasizer Nano ZS90, Malvern Instruments, Malvern, UK), X-ray photoelectron spectroscopy (XPS, Axis Ultra, Kratos, Manchester, UK), infrared spectroscopy (IR, Tensor27, Bruker, Germany) and Raman spectroscopy (Renishaw inVia plus, Renishaw, Wotton-under-Edge, UK) under the same conditions. The 13C-content of 13C-CNPs was determined by IRMS (DELTA V Advantage, Thermo Electron-Finnigan, Bremen, Germany). All C1s and O1s XPS spectra of 13C-CNPs and commercial CNSI were analyzed by CasaXPS software by automatic fitting.
Mapping of 13C-CNPs in TDLN
Animal experiments were approved by the Animal Center of Southwest Minzu University and performed humanely in accordance with the Animal Care and Use Program Guidelines of the Sichuan Province, People’s Republic of China. Male ICR mice (25 g) were obtained from Dashuo Experimental Animal Co., Chengdu, People’s Republic of China. The mice were raised in plastic cages (5 mice/cage) on a 12-h light/dark cycle with ad libitum access to food and water. Following acclimation, the mice were randomly divided into groups of 3 mice each for imaging experiments and 40 mice in each group for 13C quantification.
To verify the imaging capability of 13C-CNPs, 13C-CNPs, CNSI and saline were injected into mouse hind extremities. Briefly, 13C-CNPs, CNSI and saline were filtered by 0.22 μm filter for sterilization before use. Fifty mg/mL of 13C-CNPs was intradermally injected to the hind paw with an injection volume of 50 μL in one injection. After the injection, the injection site was mildly pushed for 1 min to avoid the leakage of 13C-CNPs. At 10 min post injection, the mice were sacrificed by cervical dislocation. The abdominal cavity was cut open, and all the organs were dissected to show the common iliac artery lymph node and paraaortic lymph node. The skin on the hind leg was also cut out to show the popliteal lymph node. Then, photographs were taken by commercial camera (700D, Canon, Tokyo, Japan). Similarly, the imaging experiments were performed with CNSI and saline. For the comparison, all the photograph parameters were set as the same for all 3 groups.
Quantification of 13C-CNPs by IRMS
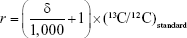
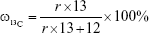
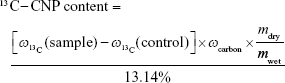
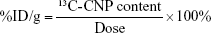
To quantify 13C-CNPs in lymph nodes, 13C-CNPs and saline were filtered by a 0.22 μm filter for sterilization before use. 13C-CNPs (50 mg/mL) were injected into mice at 50 μL per mouse in 1 injection. At 15 min post injection, the mice were sacrificed by cervical dislocation. After cutting open the skin and abdominal cavity, the lymph nodes were harvested. Due to the very light weight of lymph nodes, for each measurement, about 40 nodes were mixed together, homogenized, and lyophilized to obtain dry powder of about 6–12 mg. As the control, mice were injected with saline and sampled following the same protocol. The samples were analyzed by IRMS for 13C content determinations. The 13C contents were expressed as δ values upon IRMS analyses. The δ values were converted to 13C-CNP contents following equations (1–3). The data were also expressed as percentage of injected dose per gram tissue (%ID/g) following equation (4). In equations 1–4, the symbols are: r is the 13C/12C atom ratio; (13C/12C)standard is the 13C/12C atom ratio of Vienna Pee Dee Belemnite standard sample (0.0112372);  is the percentage of 13C in mass; (sample) is the 13C weight percentage of sample; (control) is the 13C weight percentage of control; ωcarbon is the carbon content of lymph node (~0.5 according to IRMS); mdry/mwet is the weight ratio of lymph node after and before drying (0.3234, measured as described in our previous report); 13.14% is the 13C weight percentage of 13C-CNPs; dose is the injected amount of 13C-CNPs (2.5 mg).
|
|
|
|
|
|
|
|
Results and discussion
Characterization of 13C-CNPs
13C-CNPs were prepared by arc discharge method in our study. In the 13C-ash, there were fullerene, graphite and nanoparticles according to the literature.19 Fullerene was removed by extraction with CS2. The graphite did not disperse well after homogenization, and was still present in the precipitate after the centrifugation. The appearance of 13C-CNP suspension was black and nontransparent. This was similar to commercial CNSI, which was black and nontransparent, due to the high absorbance of carbon. The dispersing reagents of both 13C-CNPs and CNSI were PVP of the same molecular weight. To compare the exact morphology and size, we adopted TEM to analyze the 2 samples. As indicated in Figure 1A, 13C-CNPs were composed of small carbon particles of about 10–50 nm. Particles aggregated slightly to form larger structures of 50–300 nm. Similar morphology was observed for CNSI, which was also composed of small carbon particles and the particles aggregated (Figure 1B). However, there were some differences in the aggregate sizes, which could be due to the uncontrollable drying process during the TEM sampling. To quantify the particle sizes, we counted the diameters of 200 particles for each sample from TEM images (Figure 2B). Here, particle size referred to the size of a single particle, rather than the size of an aggregate. Clearly, the particle size distributions of 13C-CNPs and CNSI were nearly identical. The most frequent size range was 20–25 nm. The major difference occurred at particles larger than 45 nm. For 13C-CNPs, the frequency was 0.5%, while it was 7.6% for CNSI. According to the DLS analyses, 13C-CNPs and CNSI had the same hydrodynamic radii, namely 189 nm. The size distribution patterns were also identical in DLS (Figure 2A). Therefore, TEM and DLS characterization collectively suggested that 13C-CNPs and CNSI were composed of small particles and formed aggregates in a similar way.
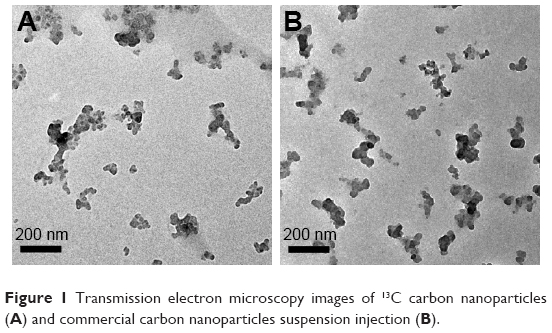 | Figure 1 Transmission electron microscopy images of 13C carbon nanoparticles (A) and commercial carbon nanoparticles suspension injection (B). |
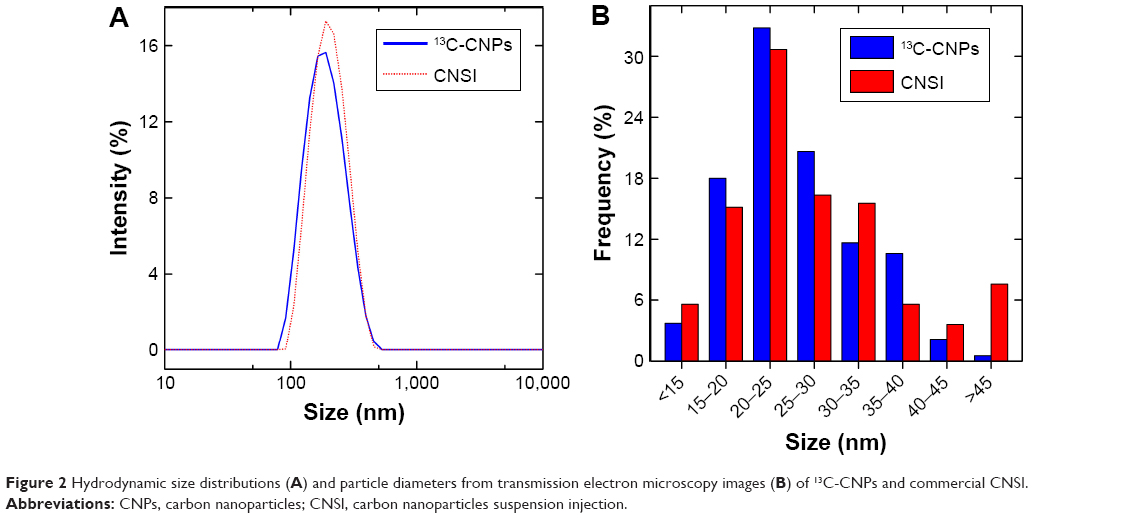 | Figure 2 Hydrodynamic size distributions (A) and particle diameters from transmission electron microscopy images (B) of 13C-CNPs and commercial CNSI. |
The chemical components of carbon cores of 13C-CNPs and CNSI were analyzed by XPS. According to XPS data, the chemical compositions were similar for both 13C-CNPs and CNSI. In 13C-CNPs, there were 91.8±1.2 atom (at)% of C, 7.5±0.3 at% of O and 0.7±0.3 at% of N. In CNSI, the C content (92.4±2.0 at%) and N content (0.8±0.4 at%) were slightly higher, and the O content was lower (6.7±2.5 at%). There was no statistical difference between the compositions 13C-CNPs and CNSI. Nitrogen might have been involved during the preparation of raw materials and the sampling processes, in particular during the arc discharge experiment. As shown in Figure 3, the C1s (Figure 3A and B) and O1s (Figure 3C and D) spectra were also identical for 13C-CNPs and CNSI. Typically, C could be divided into sp2 C, sp3 C and C-O (or C-N)/shake-up components in C1s XPS spectra. It could be stated that different FWHMs (full width at half maximum) were used for different components to reach better fitting, which was widely adopted in XPS analyses.23 The values were 62.5% (sp2 C), 30.0% (sp3 C), 7.5% (C-O and some shake-up components) for 13C-CNPs and 60.3% (sp2 C), 29.0% (sp3 C) and 10.7% (C-O and some shake-up components) for CNSI. With regard to the broad band at 289.1 eV and 290.4 eV, it might be attributed to C-O/C=O and other shake-up components, which made the peak FWHMs extremely broad. There was only a single peak in O1s spectra for both samples. It should be noted that XPS is a semi-quantitative method, which meant the quantitative results of XPS might not be exactly accurate and only reflected the information of the surface layers.24 Such small differences of XPS results likely indicated that the carbon cores of 13C-CNPs and CNSI were of similar chemical compositions and chemical states. The identical chemical states of elements were further confirmed by similar IR spectra (Figure 4). Typical oxygen-containing groups were identified in IR spectra at 3,440 cm−1 (–OH/–COOH) and 1,090 cm−1 (C-O). The absence of peaks at 1,730 cm−1 suggested the lack of C=O. The sp2 carbon atoms were reflected by the strong peaks at 1,640 cm−1.
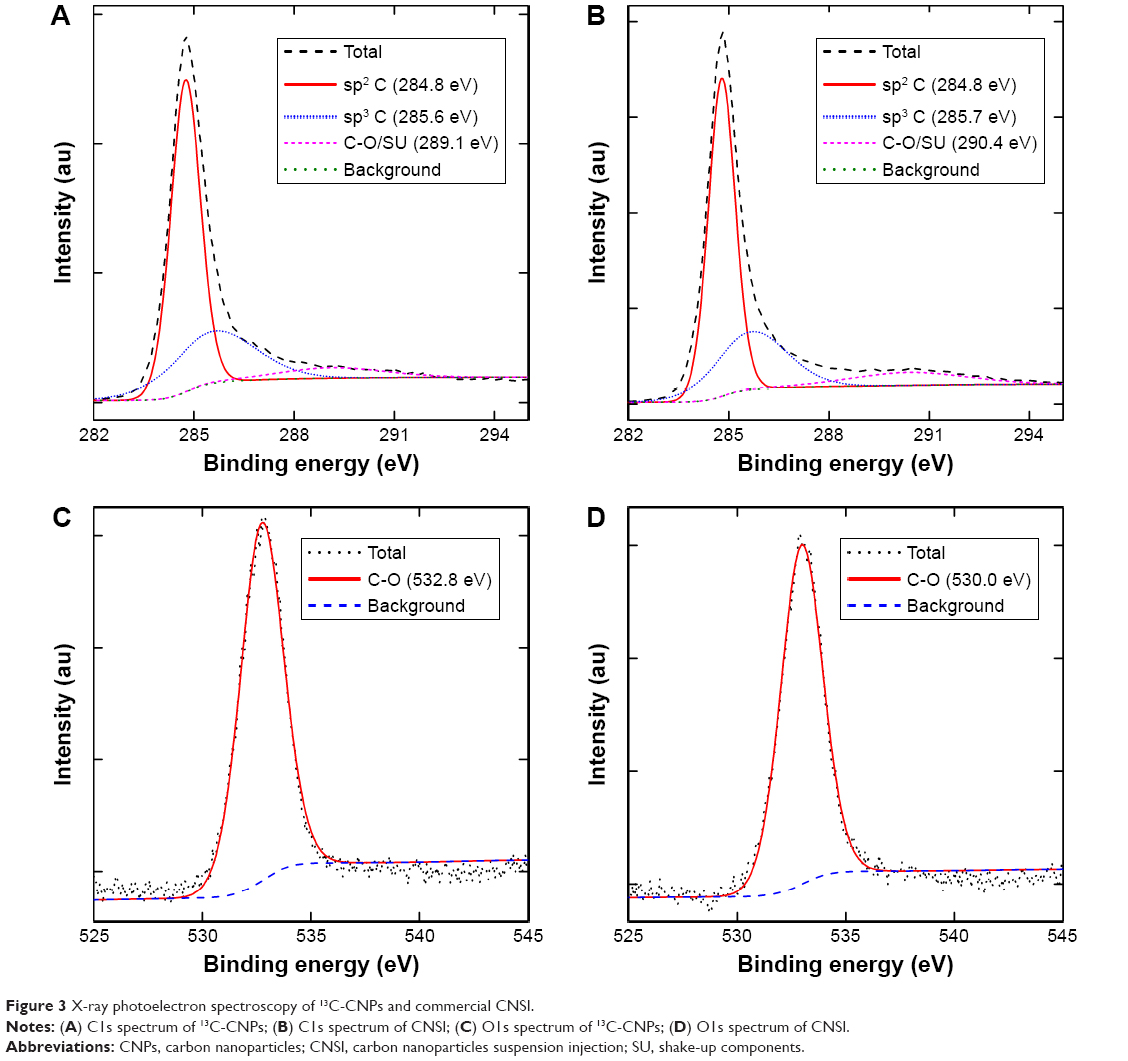 | Figure 3 X-ray photoelectron spectroscopy of 13C-CNPs and commercial CNSI. |
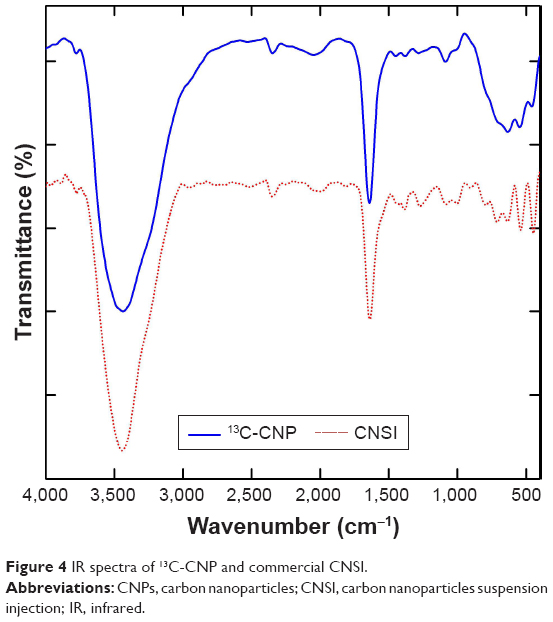 | Figure 4 IR spectra of 13C-CNP and commercial CNSI. |
The purpose of our study was to skeleton label CNPs with 13C. According to IRMS, the 13C content was 13.14 wt% for 13C-CNPs, much higher than natural 13C abundance (1.18 wt%). The Raman spectra confirmed the skeleton incorporation of 13C atoms (Figure 5). The G-band peak shifted from 1,603 cm−1 (CNSI) to 1,586 cm−1 (13C-CNPs). The shift of G-band toward lower frequency was widely reported in other 13C skeleton-labeled nanomaterials. For example, in 2001, Liu and Fan reported the Raman shifts of 13C labeled CNTs.25 Similar phenomena were found in our studies of CNTs, naked carbon dots18 and fullerene,26 too. In addition, the Raman spectra of both 13C-CNPs and CNSI contained large D-band signals, suggesting the defects or disorder of carbon atoms in the carbon cores. The ID/IG was calculated as 1.16 for 13C-CNPs and 1.28 for CNSI.
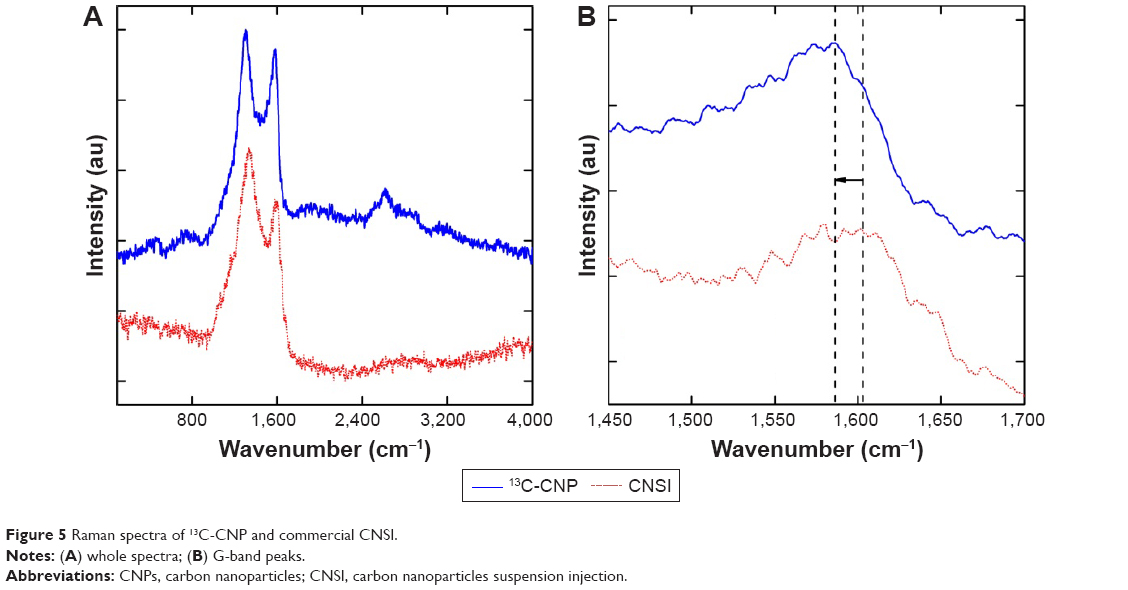 | Figure 5 Raman spectra of 13C-CNP and commercial CNSI. |
Mapping of 13C-CNPs in TDLN
The capability of 13C-CNPs in TDLN imaging was evaluated in mice. Upon intradermal injection to hind extremity, the migration of 13C-CNPs occurred immediately along lymphatic vessel. After 10 min, the mice were sacrificed and photographed. As shown in Figure 6, there were 3 lymph nodes stained black, namely popliteal lymph node, common iliac artery lymph node, and paraaortic lymph node. They could be easily distinguished and dissected, indicating the good performance of 13C-CNPs in TDLN mapping. In the contrast, lymph nodes could hardly be recognized in the mice injected with saline. According to the literature, the migration of nanoparticles along lymphatic vessel was not surprising. Dozens of papers have demonstrated the lymph node mapping by CNSI.1–7 Other particles, such as carbon dots,27 magnetic nanoparticles28 and semiconductor quantum dots,29 also showed migration toward TDLN. In addition, the imaging of lymph nodes was achieved using CNSI, too. Again, the same three stations of TDLN were stained by CNSI within 10 min. It could be noticed that the lymph nodes were slightly darker when CNSI was injected. This could be attributed to the higher absorptivity of CNSI than that of 13C-CNPs. Nevertheless, our imaging results indicated that 13C-CNPs could be used as lymph node imaging reagent, showing similar performance to the commercial CNSI.
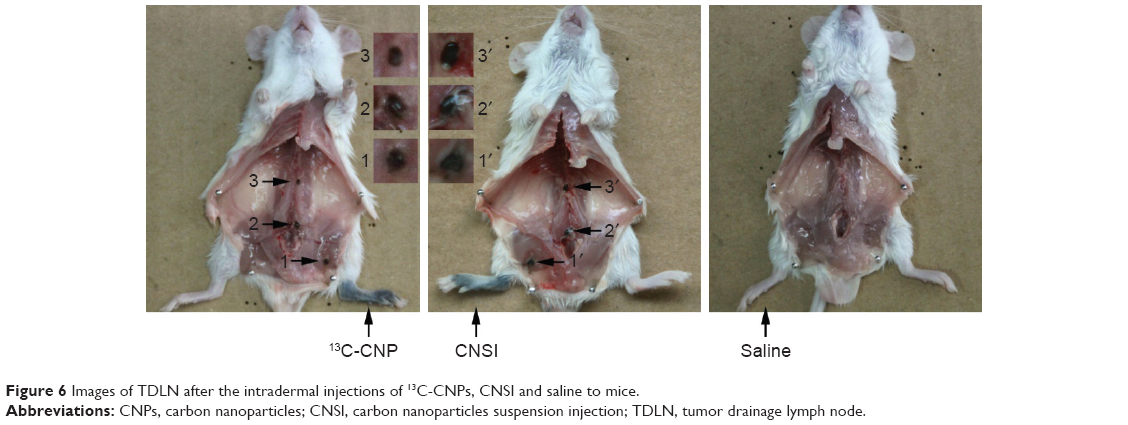 | Figure 6 Images of TDLN after the intradermal injections of 13C-CNPs, CNSI and saline to mice. |
Quantification of 13C-CNPs in TDLN
Beyond the qualitative imaging, the main advantage of 13C-CNPs was the incorporation of stable isotope that could be quantified by IRMS. To verify this, we harvested 40 lymph nodes for each IRMS sample, mixed them, homogenized and lyophilized to obtain dry powder for measurement. According to IRMS, there were 877 μg/g of 13C-CNPs accumulated in the first station of TDLN (Figure 7). The second station of TDLN had even higher accumulation (1,062 μg/g), and the value decreased to 405 μg/g in the third station. These data indicated that 13C-CNPs migrated efficiently along lymphatic vessel. The meaningful accumulation of 13C-CNPs in lymph nodes quantitatively explained the well-stained lymph nodes into black upon injection. In addition, the total amount of 13C-CNPs entering into lymphatic vessel was small. When converting the concentration into %ID/g, it could be noticed that the levels were very low, namely 4.6%ID/g for the first station of TDLN, 5.6%ID/g for the second station, and 2.2%ID/g for the third station. The weight of a lymph node was about 5 mg, thus the accumulation amount of 13C-CNPs in one node equaled to 0.011%–0.027% of the total injection amount. The very small amount of migrated 13C-CNPs suggested that most injected particles were trapped at the injection site or nearby. The small amount to migrate into lymphatic vessel was consistent with the literature reports. In many quantitative imaging experiments, the injection sites emitted the strongest fluorescence.27,29 For example, in the sentinel lymph node imaging by carbon dots, the injection site had saturated fluorescence.27 The accumulation level of 13C-CNPs was competitive to that of silica nanoconjugates, which accumulated about 10%ID/g (diameter of 198 nm) and 2%ID/g (diameter of 23 nm) in popliteal lymph nodes.30 No further migration to second station of TDLN was observed, suggesting that silica nanoconjugates moved less freely in lymphatic vessel than 13C-CNPs. The small amount of migrated 13C-CNPs also explained the failure of detection in other tissues and organs in the pre-experiments and no toxic symptom of mice during the imaging and quantification experiments. Overall, our results clearly indicated that 13C-CNPs could be quantified by IRMS and provided a new technique to quantify CNSI in biological systems. The quantification of CNSI in vivo would definitely benefit the explorations of biomedical uses and safety evaluations. During the imaging and therapy, quantification data would show the accumulation of CNSI in target organs, which would benefit the design of better CNSI formulations and optimization of the exposure conditions. For safety evaluations, quantification data, undoubtedly, would provide the ADME data and guide the toxicity assessments. With regard to these, 13C-CNPs would largely stimulate the studies and applications of CNSI toward more clinical areas.
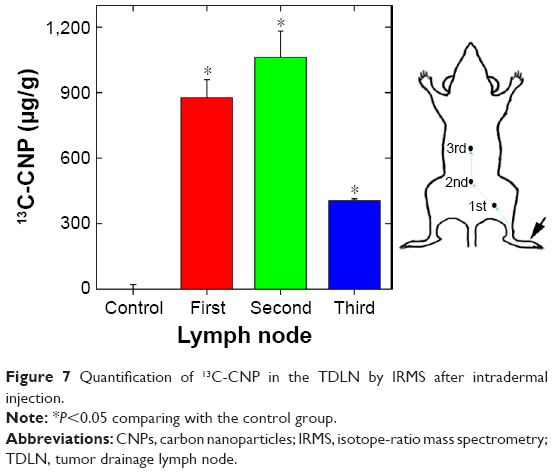 | Figure 7 Quantification of 13C-CNP in the TDLN by IRMS after intradermal injection. |
Conclusion
In summary, the skeleton-labeled 13C-CNPs were prepared for the mapping and quantification in TDLN, where 13C-CNPs showed identical properties to the commercial CNSI during both characterization and imaging. 13C-CNPs had similar morphology, particle size, hydrodynamic radii, chemical components and functional groups to those of commercial CNSI. 13C-CNPs also showed competitive imaging capability to commercial CNSI. The dark color and fast migration along lymphatic vessel allowed the efficient mapping of TDLN by 13C-CNPs, and the contents of 13C-CNPs were readily quantified by IRMS measurements. The meaningful accumulation levels of 13C-CNPs in TDLN explained the good imaging performance and provided quantitative approach to quantify CNSI in biological systems in future biomedical applications and biosafety evaluations. For future studies, the quantification of CNSI in body after injections via other important pathways should be evaluated, such as intravenous injection and intraperitoneal injection, because there are growing applications of CNSI in drug delivery and photothermal therapy that involve diverse injection methods. The identical properties of 13C-CNPs to commercial CNSI, the high 13C abundance and the nonradioactive nature provide an accessible and reliable approach to study the ADME behaviors of CNSI and the analogs with drugs or other functional moieties. The toxicology evaluations of CNSI under the guide of quantification data should be performed, in particular, for the accumulation organs and related systems. It is hoped that our results would benefit the ongoing exploration of the biomedical and clinical applications of carbon-based nanomaterials.
Acknowledgments
We thank Professor Xue-Ling Chang at Institute of High Energy Physics, Chinese Academy of Sciences for kindly providing the arc discharge generated 13C-ash. This work was supported by the major drug discovery science and technology major projects of twelfth 5-year national plan and research fund for major drug research of Nation Science and Technology (863 Projects, 2012ZX091021041 and 2012ZX09102101–015), National Program for Support of Top-notch Young Professionals, and the Fundamental Research Funds for the Central Universities, Southwest Minzu University (No 2016NZDFH01).
Disclosure
Q Xin, T He, Y Huang, G Zeng, M Ran and X Tang are employees of Chongqing Lummy Pharmaceutical Co. Ltd. The authors report no other conflicts of interest in this work.
References
Tan Z, Ge MH, Zheng CM, Wang QL, Nie XL, Jiang LH. The significance of Delphian lymph node in papillary thyroid cancer. Asia Pac J Clin Oncol. 2016. | ||
He J, Li S, Shao W, et al. Activated carbon nanoparticles or methylene blue as tracer during video-assisted thoracic surgery for lung cancer can help pathologist find the detected lymph nodes. J Surg Oncol. 2010;102(6):676–682. | ||
Yan J, Xue F, Chen H, et al. A multi-center study of using carbon nanoparticles to track lymph node metastasis in T1–2 colorectal cancer. Surg Endosc. 2014;28(12):3315–3321. | ||
Wu X, Lin Q, Chen G, et al. Sentinel lymph node detection using carbon nanoparticles in patients with early breast cancer. Plos One. 2015;10(8):e135714. | ||
Li Z, Ao S, Bu Z, et al. Clinical study of harvesting lymph nodes with carbon nanoparticles in advanced gastric cancer: a prospective randomized trial. World J Surg Oncol. 2016;14:88. | ||
Zhu Y, Chen X, Zhang H, et al. Carbon nanoparticle–guided central lymph node dissection in clinically node-negative patients with papillary thyroid carcinoma. Head Neck. 2016;38(6):840–845. | ||
Gu J, Wang J, Nie X, Wang W, Shang J. Potential role for carbon nanoparticles identification and preservation in situ of parathyroid glands during total thyroidectomy and central compartment node dissection. Int J Clin Exp Med. 2015;8(6):9640–9648. | ||
Yang Q, Wang X, Chen J, et al. A clinical study on regional lymphatic chemotherapy using an activated carbon nanoparticle–epirubicin in patients with breast cancer. Tumor Biol. 2012;33(6):2341–2348. | ||
Xie P, Tang X, Li L, et al. Drug-loaded carbon nanoparticle suspension injection: drug selection, releasing behavior, in vitro cytotoxicity and in vivo lymph node targeting. J Nanosci Nanotechnol. 2016;16:6910–6918. | ||
Yang ST, Luo J, Zhou Q, Wang H. Pharmacokinetics, metabolism and toxicity of carbon nanotubes for biomedical purposes. Theranostics. 2012;2(3):271–282. | ||
Xue F, Yang ST, Chen L, Wang X, Wang Z. Quantification of sp2 carbon nanomaterials in biological systems: pharmacokinetics, biodistribution and ecological uptake. Rev Inorg Chem. 2015;35:225–247. | ||
Moussa F, Pressac M, Genin E, et al. Quantitative analysis of C60 fullerene in blood and tissues by high-performance liquid chromatography with photodiode-array and mass spectrometric detection. J Chromatogr B. 1997;696(1):153–159. | ||
Wang H, Yang ST, Cao A, Liu Y. Quantification of carbon nanomaterials in vivo. Acc Chem Res. 2013;46(3):750–760. | ||
Tang H, Yang S-T, Yang Y, et al. Blood clearance, distribution, transformation, excretion, and toxicity of near-infrared quantum dots Ag2Se in mice. ACS Appl Mater Interfaces. 2016;8(28):17859–17869. | ||
Zhao F, Meng H, Yan L, Wang B, Zhao Y. Nanosurface chemistry and dose govern the bioaccumulation and toxicity of carbon nanotubes, metal nanomaterials and quantum dots in vivo. Sci Bull. 2015;60:3–20. | ||
Wang C, Bai Y, Li H, et al. Surface modification-mediated biodistribution of 13C-fullerene C60 in vivo. Part Fibre Toxicol. 2016;13(1):14. | ||
Wang C, Zhang H, Ruan L, et al. Bioaccumulation of 13C-fullerenol nanomaterials in wheat. Environ Sci Nano. 2016;3(4):799–805. | ||
Liu J, Yang S-T, Wang X, et al. Carbon nanoparticles trapped in vivo – similar to carbon nanotubes in time-dependent biodistribution. ACS Appl Mater Interfaces. 2014;6(16):14672–14678. | ||
Chang X, Ruan L, Yang ST, et al. Quantification of carbon nanomaterials in vivo: direct stable isotope labeling on the skeleton of fullerene C60. Environ Sci Nano. 2014;1:64–70. | ||
Yang ST, Fernando KA, Liu J, et al. Covalently PEGylated carbon nanotubes with stealth character in vivo. Small. 2008;4(7):940–944. | ||
Yang ST, Guo W, Lin Y, et al. Biodistribution of pristine single-walled carbon nanotubes in vivo. J Phys Chem. 2007;111(48):17761–17764. | ||
Yang ST, Wang X, Wang H, et al. Carbon dots as nontoxic and high performance fluorescence imaging agents. J Phys Chem C Nanomater Interfaces. 2009;113(42):18110–18114. | ||
Lascovich JC, Giorgi S, Scaglione S. Evaluation of the sp2/sp3 ratio in amorphous carbon structure by XPS and XAES. Appl Surf Sci. 1991;47(1):17–21. | ||
Brown JR, Fyfe WS, Bancroft GM. Semi-quantitative surface analysis of Mt. St. Helens Ash by X-ray photoelectron spectroscopy (XPS). Appl Surf Sci. 1981;7(4):419–424. | ||
Liu L, Fan S. Isotope labeling of carbon nanotubes and formation of 12C-13C nanotube junctions. J Am Chem Soc. 2001;123(46):11502–11503. | ||
Wang C, Ruan L, Chang X, et al. The isotopic effects of 13C-labeled fullerenes of large carbon cages (C70) and their formation process. RSC Adv. 2015;5:76949–76956. | ||
Yang ST, Cao L, Luo PG, et al. Carbon dots for optical imaging in vivo. J Am Chem Soc. 2009;131(32):11308–11309. | ||
Pouw JJ, Ahmed M, Anninga B, et al. Comparison of three magnetic nanoparticle tracers for sentinel lymph node biopsy in an in vivo porcine model. Int J Nanomedicine. 2015;10:1235–1243. | ||
Wu Q, Chu M. Self-illuminating quantum dots for highly sensitive in vivo real-time luminescent mapping of sentinel lymph nodes. Int J Nanomedicine. 2012;7:3433–3443. | ||
Tang L, Yang X, Dobrucki LW, et al. Aptamer-functionalized, ultra-small, monodisperse silica nanoconjugates for targeted dual-modal imaging of lymph nodes with metastatic tumors. Angew Chem Int Ed. 2012;51(51):12721–12726. |
 © 2017 The Author(s). This work is published and licensed by Dove Medical Press Limited. The
full terms of this license are available at https://www.dovepress.com/terms
and incorporate the Creative Commons Attribution
- Non Commercial (unported, 3.0) License.
By accessing the work you hereby accept the Terms. Non-commercial uses of the work are permitted
without any further permission from Dove Medical Press Limited, provided the work is properly
attributed. For permission for commercial use of this work, please see paragraphs 4.2 and 5 of our Terms.
© 2017 The Author(s). This work is published and licensed by Dove Medical Press Limited. The
full terms of this license are available at https://www.dovepress.com/terms
and incorporate the Creative Commons Attribution
- Non Commercial (unported, 3.0) License.
By accessing the work you hereby accept the Terms. Non-commercial uses of the work are permitted
without any further permission from Dove Medical Press Limited, provided the work is properly
attributed. For permission for commercial use of this work, please see paragraphs 4.2 and 5 of our Terms.