
Back to Journals » Journal of Asthma and Allergy » Volume 19

Skeletal Muscle Mass and Visceral Fat are Independently Associated with Poorly Controlled Asthma in Children with Obesity: A Cross-Sectional Study
Authors Wang Z  , Zhao J , Wang Y , Dai Q , Qu S , Ru L
Received 3 February 2026
Accepted for publication 23 June 2026
Published 29 June 2026 Volume 2026:19 600914
DOI https://doi.org/10.2147/JAA.S600914
Checked for plagiarism Yes
Review by Single anonymous peer review
Peer reviewer comments 4
Editor who approved publication: Dr Luis Garcia-Marcos
Zhiyuan Wang, Junlin Zhao, Yanan Wang, Qianqian Dai, Shengmeng Qu, Liang Ru
Department of Pediatrics, The First Affiliated Hospital of Xinjiang Medical University, Urumqi, Xinjiang, People’s Republic of China
Correspondence: Liang Ru, Department of Pediatrics, The First Affiliated Hospital of Xinjiang Medical University, No. 137 Liyushan Road, Xinshi District, Urumqi, Xinjiang, 830054, People’s Republic of China, Tel +86 18997953070, Email [email protected]
Purpose: The role of body composition—particularly skeletal muscle mass and visceral fat—in asthma control among children with obesity remains unclear. We compared body composition between children with obesity with and without asthma and examined associations with asthma control.
Patients and Methods: We enrolled 191 children with obesity aged 6– 14 years (85 with asthma, 106 without). Skeletal muscle mass (SMM)-to-body weight (WT) ratio and visceral fat area (VFA) were measured by multi-frequency bioelectrical impedance analysis. Poorly controlled asthma was defined using validated cut-points: Childhood Asthma Control Test ≤ 12 (ages 4– 11) and Asthma Control Test ≤ 15 (ages ≥ 12). Variables were screened by least absolute shrinkage and selection operator logistic regression; the model was assessed by receiver operating characteristic curve, calibration, and decision-curve analyses.
Results: The obese-asthma group had lower SMM/WT than the simple-obesity group (30.17% vs 31.51%, P< 0.001); VFA did not differ significantly (P=0.051). Among children with obese-asthma, the poorly controlled group showed lower SMM/WT (P=0.002) and higher VFA (P=0.011). In multivariable analysis, SMM/WT (OR=0.664 per 1%, 95% CI 0.497– 0.889, P=0.006), VFA (OR=1.014 per 1 cm2, 95% CI 1.001– 1.028, P=0.034), maximal mid-expiratory flow (MMEF) percent predicted (OR=1.073, 95% CI 1.007– 1.143, P=0.029), and extracellular water to total body water ratio (ECW/TBW) (OR=1.719 per 0.01, 95% CI 1.000– 2.956, P=0.050) were independently associated with poorly controlled asthma. The area under the curve (AUC) was 0.807 (95% CI 0.709– 0.905; sensitivity 76.9%, specificity 75.8%; mean absolute error 0.027).
Conclusion: Lower SMM/WT, higher VFA, higher MMEF percent predicted, and higher ECW/TBW were independently associated with poorly controlled asthma in children with obesity. The four-variable model showed good discrimination (AUC=0.807). These exploratory associations require prospective validation before clinical application.
Plain Language Summary: Why did we do this study?
Obesity and asthma are both becoming more common in children. Children who have both conditions may have less well-controlled asthma. Doctors usually record only height and weight, which do not show how much muscle a child has or where body fat is stored. We wanted to learn whether measuring muscle and fat separately could help explain why some children with obesity have poorer asthma control.
What did we do?
We studied 191 children with obesity aged 6– 14 years. We used a body-composition scanner to estimate muscle mass and visceral fat (the fat stored around internal organs). We compared children with and without asthma, and—among those with asthma—children whose symptoms were poorly controlled with the rest of the asthma group, who had comparatively better symptom control.
What did we find?
Children with obesity and asthma had less muscle relative to their body weight than children with obesity alone. Among the children with asthma, those whose asthma was poorly controlled tended to have lower muscle mass and higher visceral fat. Using these measures, we built a preliminary tool to help estimate which children might be at higher risk of poor asthma control.
What does this mean?
Looking at body composition, rather than weight alone, may give doctors additional information about asthma in children with obesity, and could support more individualized care in the future. Further studies in other groups of children are needed before these measures can be used in routine practice. Study of 191 children with obesity (ages 6-14) using Bioelectrical Impedance Analysis and Spirometry compared asthma (n=85) and simple obesity (n=106) groups. Findings: Asthma group had lower SMM/WT (30.17% vs 31.51%, P< 0.001) and higher sarcopenic obesity (18.8% vs 7.5%, P=0.034). Asthma control analysis: Poorly Controlled (n=52) vs Non-Poorly-Controlled (n=33). Poorly controlled group showed lower SMM/WT (29.31% vs 30.89%, P=0.002) and higher VFA (169.11 vs 137.63 cm², P=0.011). Factors linked to poorly controlled asthma: SMM/WT (OR=0.664, P=0.006), VFA (OR=1.014, P=0.034), MMEF% pred (OR=1.073, P=0.029), ECW/TBW (OR=1.719, P=0.050). Model: AUC=0.807, Sensitivity 76.9%, Specificity 75.8%. Conclusion: Muscle-fat imbalance (low SMM/WT, high VFA) is linked to poorly controlled asthma in children with obesity.Infographic on 191 children with obesity, comparing asthma status and asthma control with body composition metrics.
Keywords: pediatric obesity, asthma, skeletal muscle mass, visceral fat, sarcopenic obesity
Introduction
Asthma and obesity are two major public health challenges with a persistently increasing prevalence among children globally.1,2 Accumulating evidence demonstrates a close relationship between the two. Obesity is a significant risk factor for new-onset asthma during childhood.3 Meanwhile, for children with pre-existing asthma, obesity is associated with more severe disease, more frequent acute exacerbations, and poorer treatment response through mechanisms such as inducing airway structural abnormalities.4 In China, the prevalence of overweight and obesity among children and adolescents aged 6–17 years reached 11.1% and 7.9%, respectively, in the most recent national survey.5 Children with obesity-related asthma exhibit higher hospitalization rates, emergency department visits, and worse quality of life, suggesting that they may represent a unique phenotype, distinct from classic allergic asthma.6,7 However, the specific mechanisms by which obesity affects asthma remain incompletely elucidated, and research on inflammatory mechanisms in childhood obesity-related asthma is still relatively limited in scope.8
Conventional wisdom holds that body mass index (BMI) is a commonly used indicator for assessing obesity, but BMI cannot distinguish between fat mass and muscle mass, nor can it reflect fat distribution characteristics.9 Recent studies have found that refined body composition indicators, such as waist circumference, waist-to-height ratio (WHtR), and visceral fat area (VFA), can more accurately predict obesity-related health risks.10 This is because visceral fat, as a metabolically active endocrine organ, secretes pro-inflammatory cytokines and adipokines, inducing systemic inflammation and promoting airway inflammation and remodeling.11,12 A large-scale study based on the National Health and Nutrition Examination Survey (NHANES) revealed a dose-dependent association between visceral fat index and childhood asthma risk.13 Visceral fat index is a standardized measure of visceral adiposity. Meanwhile, skeletal muscle, also an endocrine organ, secretes anti-inflammatory myokines, which play an important role in counteracting the pro-inflammatory effects of adipose tissue.14 Recent adult studies have found that reduced skeletal muscle mass (SMM) is independently associated with uncontrolled asthma and increased risk of acute exacerbations.15 It should be noted, however, that most evidence linking reduced skeletal muscle mass to asthma outcomes derives from adult cohorts; whether these associations extend to children, whose skeletal-muscle physiology and growth differ substantially, remains unestablished. However, previous pediatric studies have largely focused on BMI or isolated parameters such as body fat percentage, with limited investigation of the combined effects of skeletal muscle and visceral fat compartments on asthma control in obesity-related asthma populations.
In this cross-sectional study, we assessed body composition in 191 children with obesity (85 with asthma, 106 without) using multi-frequency bioelectrical impedance analysis. We compared skeletal muscle mass, visceral fat area, and related parameters between groups, examined their associations with asthma control status, and developed a predictive model for poorly controlled asthma. We hypothesized that, compared with children who have simple obesity, those with obesity-related asthma would show lower SMM/WT and higher VFA, and that within the obese-asthma group lower SMM/WT and higher VFA—reflecting muscle–fat imbalance—would be associated with poorly controlled asthma.
Material and Methods
Study Design and Ethics Approval
This single-center cross-sectional study was conducted from May 2025 to November 2025. During this period, eligible children with obesity were consecutively enrolled from the Department of Pediatrics at a tertiary hospital. All participants underwent anthropometric measurements and body composition analysis. In addition, pulmonary function testing and hematological examinations were performed in a fasting state to assess their pulmonary function status and levels of inflammatory markers. This study was conducted in accordance with the Declaration of Helsinki and was approved by the Ethics Committee of The First Affiliated Hospital of Xinjiang Medical University (approval number: K202509-54). Informed consent was obtained from all guardians of the participants. We followed the Strengthening the Reporting of Observational Studies in Epidemiology (STROBE) guidelines for reporting this observational study.
Study Participants
Inclusion Criteria
Children aged 6–14 years who meet the diagnostic criteria for obesity. Obesity was defined according to the Chinese national standard for screening obesity among school-age children and adolescents (WS/T 586–2018),16 specifically as a BMI greater than or equal to the sex- and age-specific obesity cutoff value. Additionally, children must have completed body composition analysis and pulmonary function testing and possess complete clinical data. All participants with asthma were receiving guideline-based management according to the Global Initiative for Asthma (GINA) recommendations,17 including controller medications (inhaled corticosteroids with or without long-acting beta-agonists) as appropriate for their severity level.
Exclusion Criteria
Incomplete clinical data; presence of immunodeficiency, diabetes, congenital heart disease, or other serious metabolic diseases; presence of acute asthma exacerbation; airway developmental abnormalities; other chronic diseases; and serious diseases or dysfunctions of the heart, liver, or kidneys; history of systemic corticosteroid use exceeding 1 month. Medication adherence was assessed by treating physicians through review of prescription refill records and caregiver reports. Participants with documented poor adherence were excluded from the study.
Sample Size and Grouping
This study initially screened 375 children with obesity. After excluding those with incomplete clinical data (n = 166), comorbid serious underlying diseases (n = 5), and acute asthma exacerbation (n = 13), 191 children were included for analysis. The 166 children excluded for incomplete data were predominantly missing core body-composition or pulmonary-function measurements. Age, sex, and BMI were available for both groups and did not differ significantly between the analyzed cohort and these excluded children (all P > 0.05; Supplementary Table S1). The participants were frequency-matched by age and sex and divided into two groups based on the presence of asthma. The Obese-asthma group (obesity-related asthma) (n = 85) consisted of children with obesity meeting the diagnostic criteria for asthma according to the GINA. The Obese-only group (n = 106) included children with obesity who did not meet the diagnostic criteria for asthma. The flowchart of the study is shown in Figure 1.
 |
Figure 1 Study Flow Diagram. |
Clinical Data Collection
Clinical data were collected from the electronic medical record system and included basic information such as age and sex; anthropometric indicators including height, weight, BMI, waist circumference, and WHtR; and body composition indicators such as percent body fat (PBF), SMM, SMM/WT, VFA, phase angle (PhA), and extracellular water (ECW) to total body water (TBW) ratio. Pulmonary function parameters collected included forced expiratory volume in 1 second (FEV1), forced vital capacity (FVC), FEV1/FVC ratio, peak expiratory flow (PEF), maximal mid-expiratory flow (MMEF), maximal expiratory flow (MEF) at 75%, 50%, and 25% of FVC (MEF75, MEF50, MEF25), along with their percent-predicted values. Inflammatory markers measured were fractional exhaled nitric oxide (FeNO), peripheral blood eosinophil count, total immunoglobulin E (Total IgE), C-reactive protein (CRP), and interleukin-6 (IL-6). Additionally, for children in the obese-asthma group, asthma control status was assessed using the Asthma Control Test (ACT) score.
Testing Methods and Instruments
Anthropometric Measurements
Height and weight were measured by professionally trained medical staff according to standard operating procedures. Subjects removed their shoes and wore light clothing; height and weight were measured to the nearest 0.1 cm and 0.1 kg, respectively. BMI was calculated as BMI = weight (kg) / [height (m)]2. Additionally, waist circumference was measured to the nearest 0.1 cm at the midpoint between the lowest rib and the iliac crest while the subject was standing at the end of a normal, quiet exhalation. WHtR was calculated as waist circumference divided by height.
Body Composition Analysis
Body composition was assessed using the InBody 720 multi-frequency segmental bioelectrical impedance analysis (BIA) device (InBody Co., Ltd., Seoul, Korea), a clinical-grade octopolar device that measures impedance at six frequencies (1, 5, 50, 250, 500, and 1000 kHz) across five body segments via an eight-point tactile-electrode system. Like other octopolar multi-frequency BIA systems, the InBody 720 uses proprietary manufacturer algorithms whose internal details are not publicly disclosed.18 In a head-to-head comparison of the InBody 720 against dual-energy X-ray absorptiometry (DXA) in 172 Chinese children and adolescents aged 5–17 years, the two methods showed excellent agreement for appendicular skeletal muscle mass (intraclass correlation coefficient 0.90–0.98) with no significant systematic bias, and the agreement was strongest in the obesity subgroup.19 Octopolar multi-frequency BIA devices employing the same measurement platform have also been applied to pediatric body composition and sarcopenia risk assessment in Chinese children.20 Nevertheless, the InBody 720 is known to underestimate fat mass percentage and overestimate fat-free mass percentage relative to DXA,18,19 and impedance-based estimates remain sensitive to hydration status; these are acknowledged as limitations. Subjects were required to fast for at least 4 hours before testing, to empty their bladders, to remove shoes, socks, and metal objects from their bodies, and to wear light clothing. During testing, subjects stood barefoot on the instrument’s measuring platform, grasped the hand electrodes, and remained standing until the measurement was complete. The testing process strictly followed the instrument’s operating procedures and was completed by professionally trained technicians. The instrument automatically output body composition parameters, including TBW, protein, minerals, body fat mass (BFM), PBF, fat-free mass (FFM), SMM, VFA, PhA—a measure of cell membrane integrity and body cell mass—ECW/TBW, basal metabolic rate (BMR), WHtR, and other relevant indicators. SMM/WT was calculated separately using the following formula: SMM/WT = (SMM / body weight) × 100%.
Pulmonary Function Testing
Pulmonary function testing was performed using the MasterScreen Pulmonary Function Testing System (JAEGER, Hoechberg, Germany). Before testing, subjects and their guardians were given detailed explanations of the testing methods and precautions. Spirometry was performed according to American Thoracic Society/European Respiratory Society (ATS/ERS) guidelines.21 Each participant completed at least three acceptable maneuvers, with the two largest FEV1 and FVC values within 5%. Parameters (FEV1, FVC, FEV1/FVC, PEF, FEF25-75%) were expressed as percentages of predicted values using Global Lung Function Initiative (GLI) 2012 reference equations,22 adjusted for age, sex, height.
FeNO Testing
FeNO was measured using the Sunvou-CA2122 chemiluminescence exhaled nitric oxide analyzer (Sunvou Medical Electronics Co., Ltd., Wuxi, China). Before testing, participants were instructed to avoid strenuous exercise and to maintain normal breathing immediately prior to and during the test. Participants sat upright and wore a mouthpiece connected to the instrument. They inhaled deeply as prompted by the instrument, then exhaled slowly at a constant flow rate of 50 milliliters per second (mL/s) for 10 seconds. The instrument automatically displayed the FeNO value in parts per billion (ppb). Each participant was tested twice consecutively, and the average value was used for analysis.
Inflammatory Marker Testing
All subjects had 5 mL of venous blood collected in the morning after an overnight fast. The blood samples were sent to the laboratory department of the hospital for testing within 2 hours after collection. Peripheral blood eosinophil count was measured using an automated blood cell analyzer. Serum total IgE was measured by chemiluminescence immunoassay, and CRP, as well as IL-6, were measured by enzyme-linked immunosorbent assay (ELISA). All tests were completed by trained laboratory technicians according to standard operating procedures, with internal quality control continuously performed by the laboratory staff.
Quality Control
All researchers were professionally trained physicians, and the testing process strictly followed standard operating procedures. Data entry employed a double data entry verification system, where two individuals independently entered the data. Discrepancies were identified through automated comparison and resolved by a third senior researcher through re-verification against original source data.
Statistical Analysis
General Statistical Methods and Between-Group Comparisons
All statistical analyses were performed using SPSS 29.0 statistical software (IBM Corporation, Armonk, NY, USA). The Kolmogorov–Smirnov test was used to assess the normality of continuous variables. Continuous variables that follow a normal distribution were expressed as mean ± standard deviation (mean ± SD). Between-group comparisons for these variables were performed using the independent samples t-test. Continuous variables that do not follow a normal distribution were expressed as median (interquartile range, IQR). Between-group comparisons for these variables were performed using the Mann–Whitney U-test. Categorical variables were expressed as n (%), and between-group comparisons were performed using the Pearson chi-square test or Fisher’s exact test when the expected frequency was less than 5. P < 0.05 was considered statistically significant.
Diagnostic Criteria for Sarcopenic Obesity (SO)
There is no unified standard for the definition of SO. This study followed the research of Donini et al23 and used dual criteria: concomitant low muscle mass and high fat mass. Percentiles were calculated using the Python numpy.percentile function based on this study’s data. The ranking position was calculated as (n-1) × p/100 + 1, where n is the sample size and p is the percentile, and linear interpolation was used to obtain the exact percentile value. After determining percentiles, multiple cutoff value combinations were tested for sensitivity analysis. The Chi-square test was used to evaluate between-group differences, with P < 0.05 considered statistically significant. To systematically evaluate the impact of different threshold combinations on SO classification, three candidate schemes were defined a priori. Scheme A (Conservative): P10 for SMM/WT + P90 for VFA. Scheme B (Moderate): P20 for SMM/WT + P80 for VFA. Scheme C (Liberal): P25 for SMM/WT + P50 for VFA.
Subgroup Analysis of Asthma Control Level
To further investigate the relationship between asthma control level and body composition characteristics, children in the obese-asthma group were stratified by their asthma control status. Asthma control was assessed using the Childhood Asthma Control Test (C-ACT) for children aged 4–11 years24,25 and the Asthma Control Test (ACT) for those aged ≥12 years.26 Poorly controlled asthma was defined a priori using the higher-risk, second validated cut-point of each instrument: C-ACT ≤1224 and ACT ≤15, with the latter being the threshold for “very poorly controlled asthma” incorporated into the National Asthma Education and Prevention Program (NAEPP) Expert Panel Report 3 (EPR-3) asthma management guidelines.27 The two age-specific instruments were thereby harmonized into a single binary control status (poorly controlled vs. non-poorly-controlled), each defined by its respective validated cut-off and applied uniformly across all subsequent analyses. This more stringent definition was deliberately chosen — rather than the broader ≤19 “not well-controlled” threshold — to enrich the case group for children at the highest clinical risk, in whom the body-composition signal was expected to be most pronounced. To assess differences between these groups in demographic characteristics, body composition indicators, pulmonary function parameters, and inflammatory markers, statistical comparisons were conducted using the same methods as for baseline characteristic analyses, with the Pearson chi-square test for categorical variables and the Mann–Whitney U-test for continuous variables. A P value < 0.05 was considered statistically significant.
Independent Predictor Screening and Predictive Model Construction
To identify independent predictors of poorly controlled asthma and develop a predictive model, Least Absolute Shrinkage and Selection Operator (LASSO) logistic regression was used for variable selection. First, all 27 candidate variables (including demographic characteristics, body composition indicators, pulmonary function parameters, and inflammatory markers) were included in the LASSO regression model, with asthma control status (poorly controlled = 1, non-poorly-controlled = 0) as the dependent variable. The optimal penalty parameter (λ) was determined by 10-fold cross-validation. Then, by selecting “Lambda.min” — the λ value that minimizes the mean cross-validated error — variables with non-zero coefficients were selected. Lambda.min was preferred over the more parsimonious lambda.1se to retain candidate variables with potential predictive value for subsequent evaluation in the logistic regression step. These LASSO-selected variables were then entered into a forward stepwise logistic regression model (entry criterion P<0.1, removal criterion P>0.1) to determine the final parsimonious model.
The model’s discrimination ability was evaluated using the area under the receiver operating characteristic (ROC) curve (AUC). Calibration was assessed by drawing calibration curves through bootstrap resampling with 1000 iterations and calculating the mean absolute error (MAE) to quantify calibration accuracy. The model’s clinical utility was evaluated using decision curve analysis (DCA) to assess the net benefit across different threshold probabilities. Based on the final model, a nomogram was constructed for clinical application. All analyses were completed using R software (version 4.5.2), with the glmnet, rms, ggscidca, and regplot packages.
Results
Baseline Characteristics
This study enrolled 191 children with obesity, including 85 children in the obese-asthma group and 106 children in the obesity-only group. There were no significant differences between the two groups in sex distribution, age, height, weight, BMI, waist circumference, and WHtR, (all P > 0.05). These findings indicate comparable baseline characteristics between groups, as shown in Table 1.
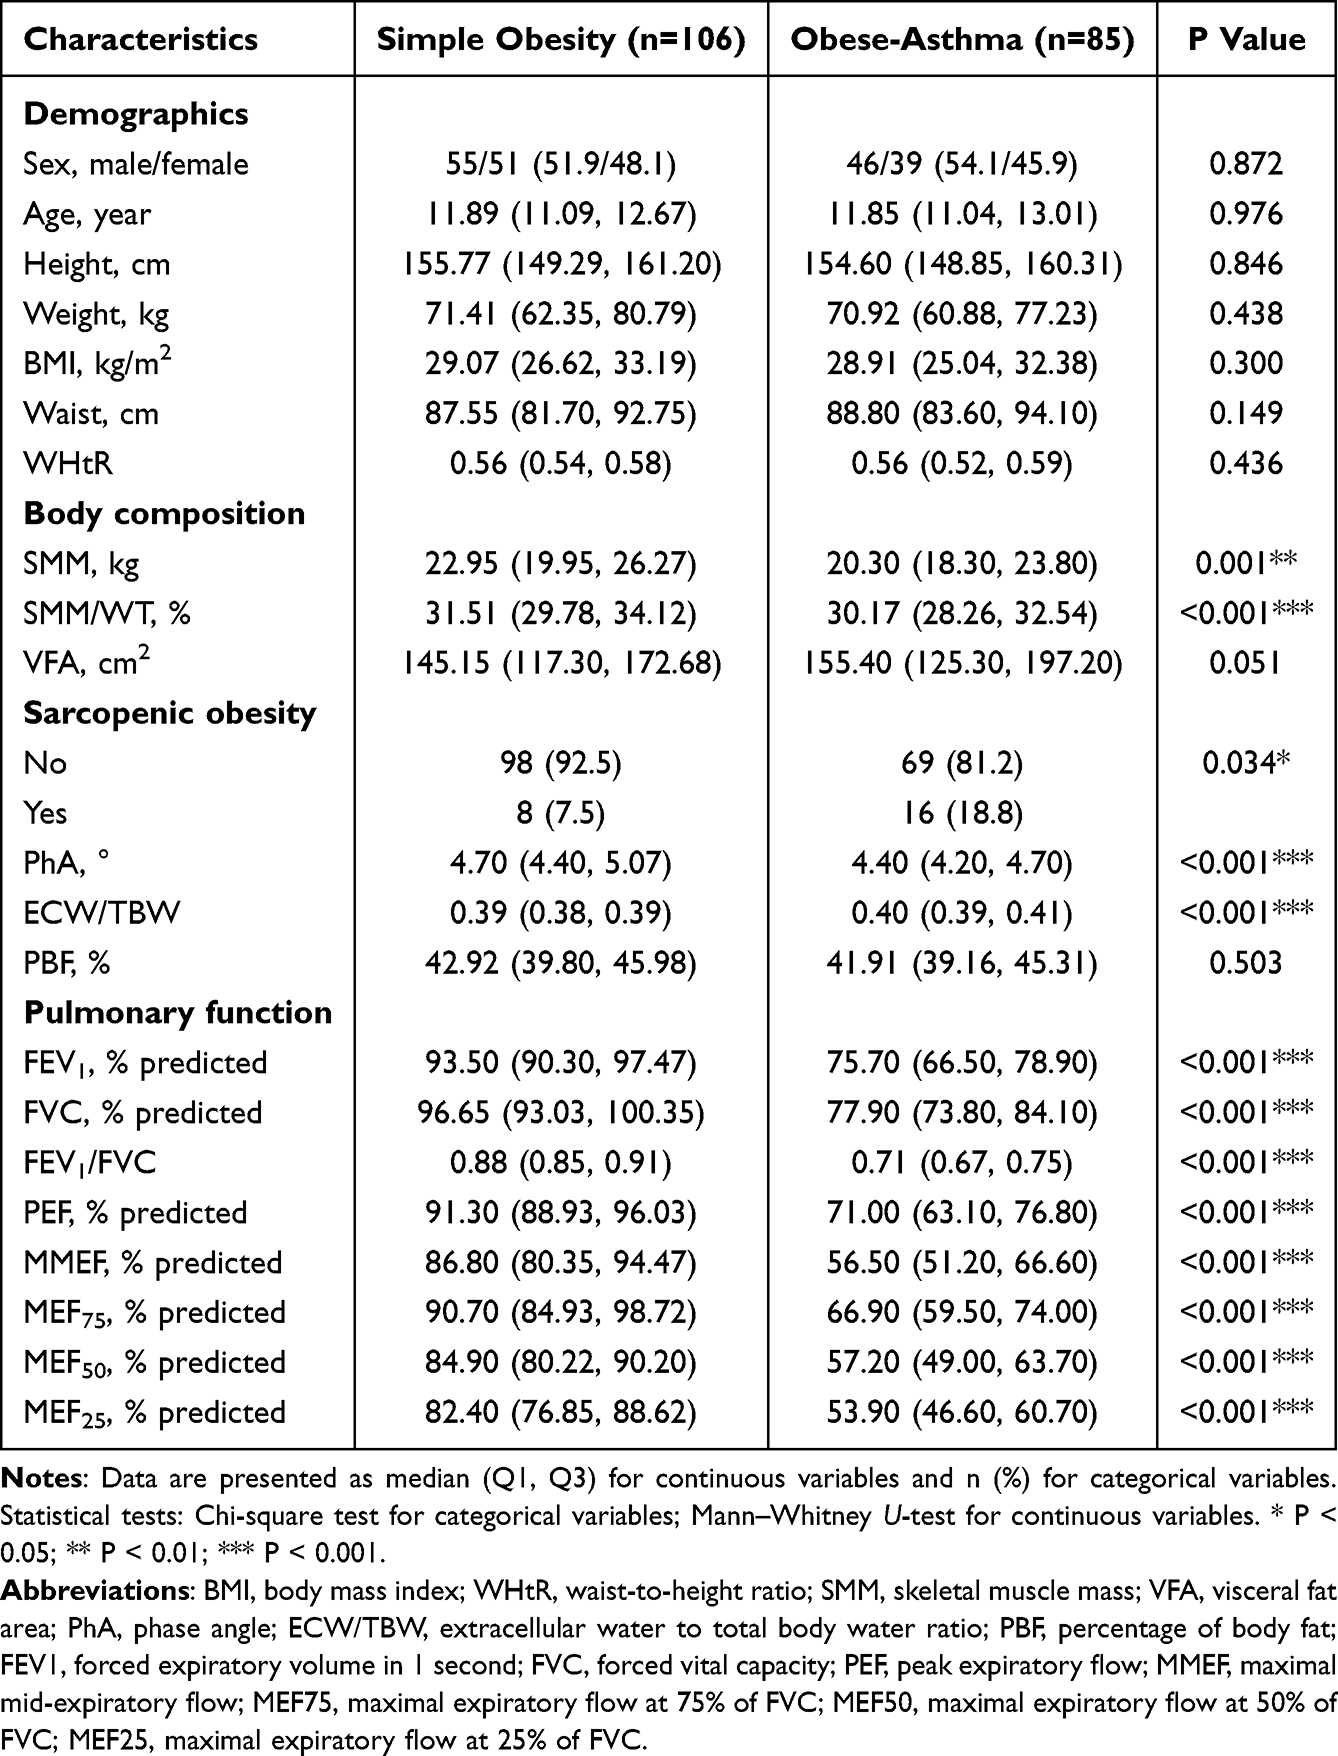 |
Table 1 Baseline Characteristics of Study Participants |
Body Composition Comparison
The obese-asthma group had markedly lower SMM than the group with simple obesity [20.30 (18.30, 23.80) kg vs. 22.95 (19.95, 26.27) kg, P = 0.001], and SMM/WT was also significantly lower [30.17 (28.26, 32.54)% vs. 31.51 (29.78, 34.12)%, P < 0.001] (Figure 2A and Table 1). VFA was numerically higher in the obese-asthma group, but the difference did not reach statistical significance (P = 0.051) (Figure 2B). PhA was substantially lower in the obese-asthma group than in the simple obesity group [4.40° (4.20°, 4.70°) vs. 4.70° (4.40°, 5.07°), P < 0.001] (Figure 2C). ECW/TBW was significantly elevated in the obese-asthma group [0.40 (0.39, 0.41) vs. 0.39 (0.38, 0.39), P < 0.001] (Figure 2D). There was no significant difference in PBF between the two groups (P = 0.503).
 |
Figure 2 Comparison of Body Composition and Pulmonary Function in Children with Obesity, Stratified by Asthma Status. Box plots comparing body composition parameters (A–D) and pulmonary function indices (E–H) between children with obesity-related asthma (Obese-Asthma, n = 85, Orange boxes) and those with simple obesity (Simple Obesity, n = 106, blue boxes). (A) Skeletal muscle mass to body weight ratio (SMM/WT). (B) Visceral fat area (VFA). (C) Phase angle (PhA). (D) Extracellular water to total body water ratio (ECW/TBW). (E) Forced expiratory volume in 1 second, percent predicted (FEV1% Predicted). (F) Forced vital capacity, percent predicted (FVC % Predicted). (G) Ratio of FEV1 to FVC (FEV1/FVC). (H) Maximal mid-expiratory flow, percent predicted (MMEF % Predicted). Boxes show the interquartile range with the horizontal line representing the median; whiskers extend to 1.5 × IQR; individual data points are overlaid. Red diamonds indicate group means. Statistical significance (Mann–Whitney U-test): ***P < 0.001; ns, not significant. In Panel (B), VFA showed a borderline non-significant difference (P = 0.051); the exact P-value is reported in Table 1. |
Pulmonary Function Comparison
All pulmonary function indicators were significantly lower in the obese-asthma group than in the simple obesity group (all P < 0.001) (Table 1). The FEV1 percent predicted was 75.70% (66.50%, 78.90%) in the obese-asthma group compared to 93.50% (90.30%, 97.47%) in the simple obesity group (Figure 2E). The FVC percent predicted was 77.90% (73.80%, 84.10%) versus 96.65% (93.03%, 100.35%) (Figure 2F). The FEV1/FVC ratio was 0.71 (0.67, 0.75) compared to 0.88 (0.85, 0.91) (Figure 2G). Additionally, PEF, MMEF (Figure 2H), and the percent predicted values of maximal expiratory flow at 75%, 50%, and 25% of lung volume (MEF75, MEF50, MEF25) were all significantly decreased in the obese-asthma group. These reductions indicate marked airway obstruction and impaired pulmonary function.
Determination of SO Cutoffs
Three percentile-based schemes were systematically compared. Sex-specific percentile distributions of SMM/WT and VFA are presented in Table 2, and sensitivity analyses comparing the three diagnostic cutoff schemes in Table 3. No significant sex differences were observed, supporting the use of unified cutoffs. Scheme A (P10/P90) identified 6.3% of children with sarcopenic obesity (9.4% in obese-asthma vs. 3.8% in simple obesity), but showed no significant association with obesity-related asthma (OR = 2.65, 95% CI: 0.76–9.23, P = 0.195). Scheme B (P20/P80) identified 12.6% of children (18.8% in obese-asthma vs. 7.5% in simple obesity) and demonstrated significant association with obesity-related asthma (OR = 2.84, 95% CI: 1.15–7.01, P = 0.034).Scheme C (P25/P50) identified 21.5% of children (32.9% in obese-asthma vs. 12.3% in simple obesity) with significant association (OR = 3.51, 95% CI: 1.68–7.33, P = 0.001), but the prevalence exceeded typical pediatric ranges. Scheme B was selected as the primary definition for all subsequent analyses based on optimal balance of statistical significance, clinically plausible prevalence, and biological relevance.
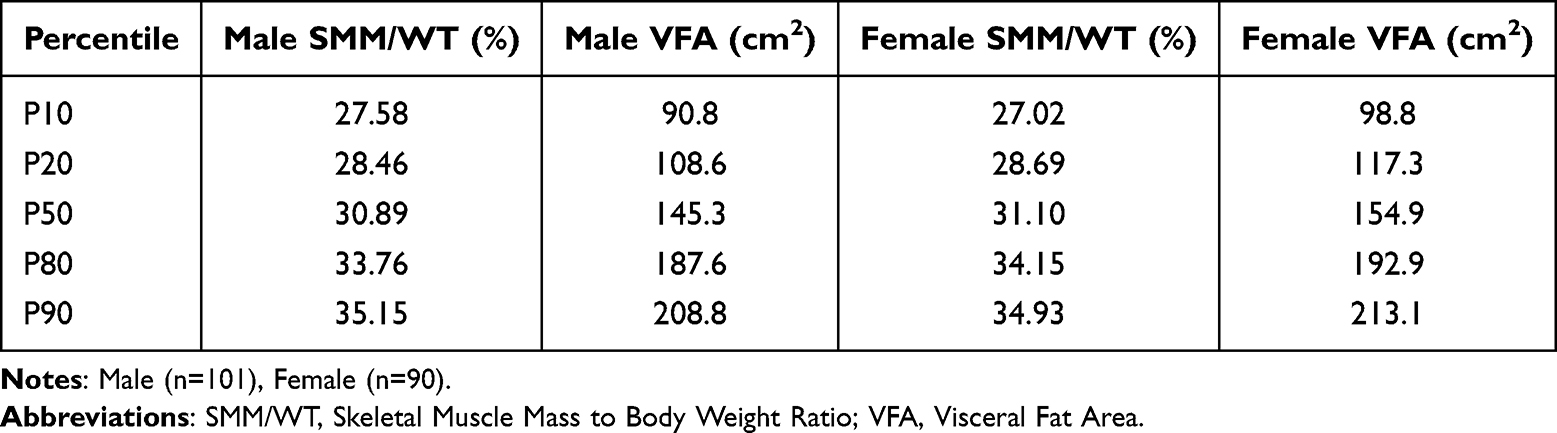 |
Table 2 Sex-Specific Percentile Values of SMM/WT and VFA |
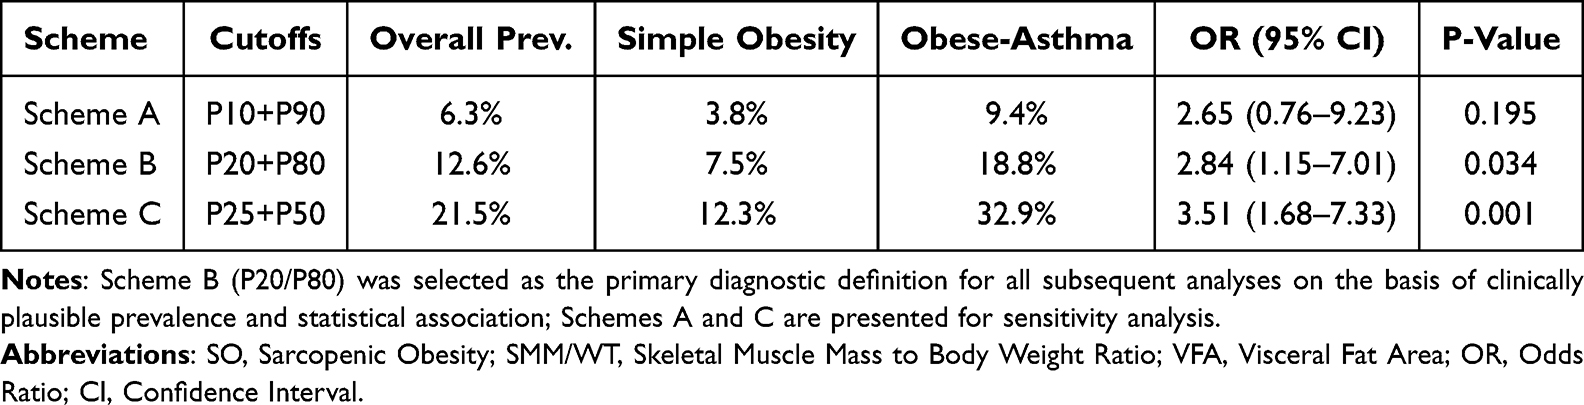 |
Table 3 Sarcopenic Obesity Prevalence Using Different Diagnostic Cutoffs - Sensitivity Analysis |
Subgroup Analysis in the Obese-Asthma Group
Among the 85 children with obesity with asthma, asthma control was classified using the respective validated higher-risk cut-points, yielding a poorly controlled group (n = 52) and a non-poorly-controlled group (n = 33). There were no significant differences between the two groups in sex distribution, age, height, weight, BMI, waist circumference, and WHtR (all P > 0.05), indicating comparable baselines (Table 4).
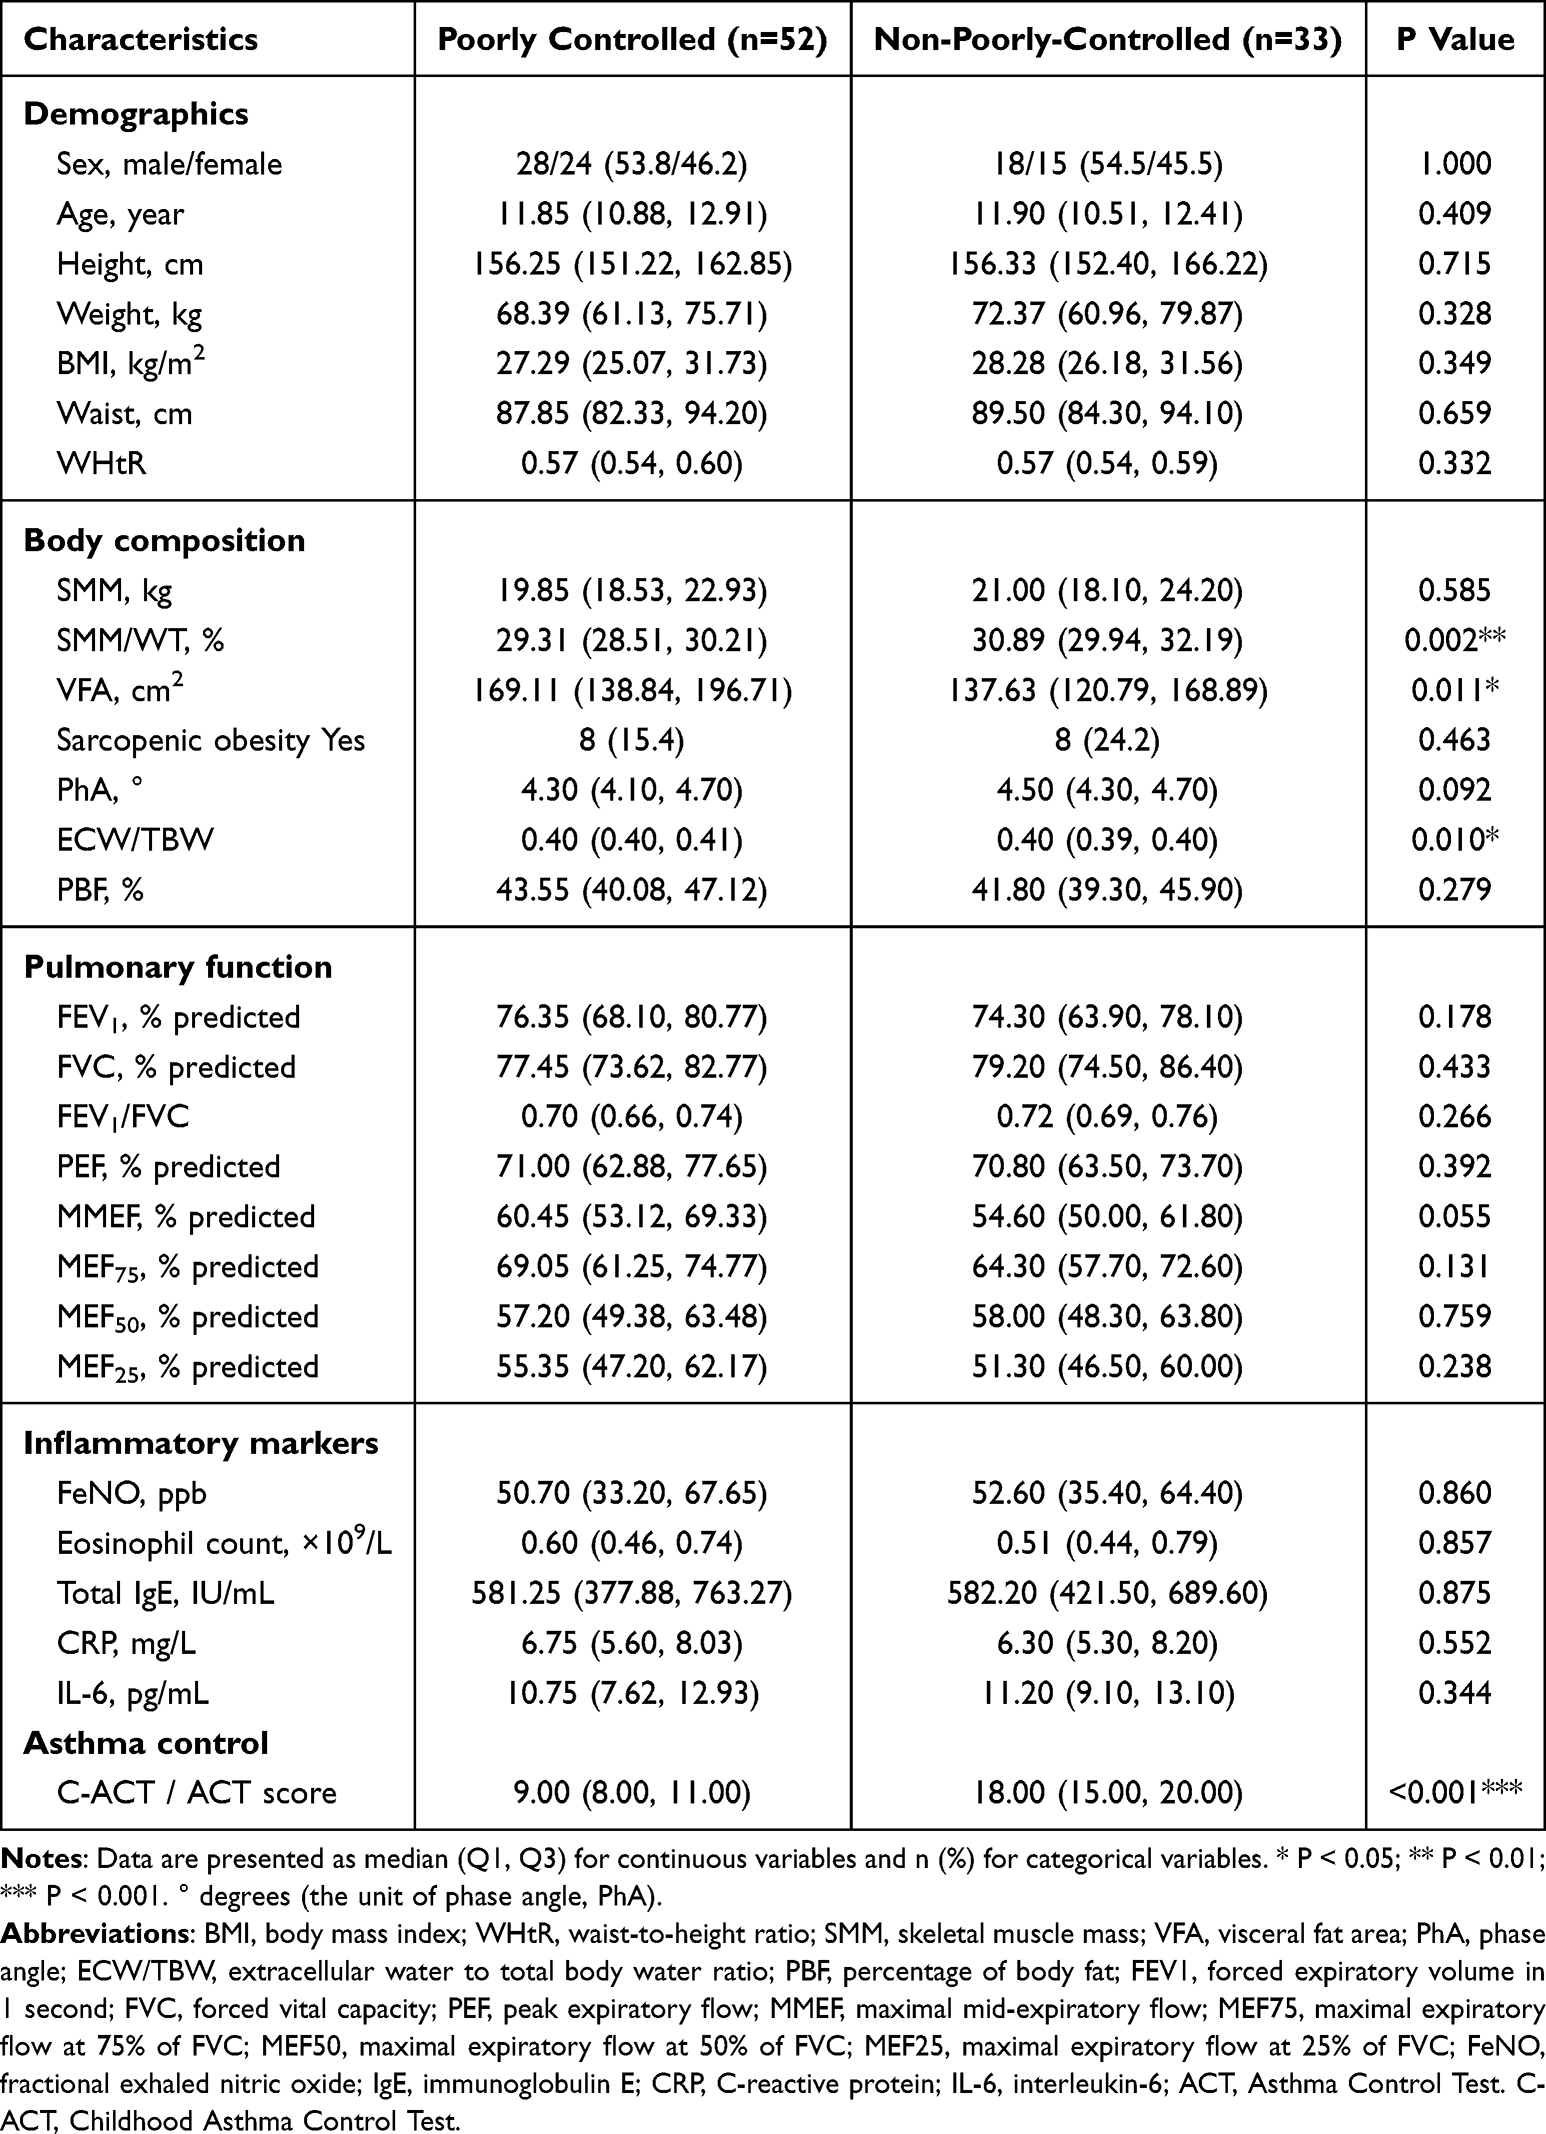 |
Table 4 Comparison of Characteristics Between Poorly Controlled and Non-Poorly-Controlled Groups |
In terms of body composition, the poorly controlled group had significantly lower SMM/WT than the non-poorly-controlled group [29.31% (28.51%, 30.21%) vs. 30.89% (29.94%, 32.19%), P = 0.002], suggesting lower relative muscle mass in children with poorly controlled asthma. VFA was significantly higher in the poorly controlled group than in the non-poorly-controlled group [169.11cm2 (138.84cm2, 196.71cm2) vs. 137.63cm2 (120.79cm2, 168.89cm2), P = 0.011], indicating greater visceral fat accumulation in children with poorly controlled asthma. ECW/TBW was significantly higher in the poorly controlled group than in the non-poorly-controlled group [0.40 (0.40, 0.41) vs. 0.40 (0.39, 0.40), P = 0.010]. PhA showed a decreasing trend in the poorly controlled group, but the difference did not reach statistical significance (P = 0.092). There were no significant differences between the two groups in SMM, prevalence of SO, and PBF (all P > 0.05).
In terms of pulmonary function, there were no significant differences between the two groups in all pulmonary function indicators (FEV1, FVC, FEV1/FVC, PEF, MMEF, and various MEF) (all P > 0.05). In terms of inflammatory markers, there were also no significant differences between the two groups in FeNO, eosinophil count, total IgE, CRP, and IL-6 levels (all P > 0.05).
Predictors of Poorly Controlled Asthma
Body Composition Differences by Asthma Control Status
Subgroup analysis revealed that among children with obesity with asthma, those with poorly controlled asthma exhibited notable body composition abnormalities. These included reduced relative muscle mass, increased visceral fat accumulation, and an increased tendency for edema. In contrast, pulmonary function parameters and inflammatory markers showed no significant differences between the two groups. To further clarify which factors can independently predict asthma control, we used LASSO logistic regression to screen all candidate predictor variables and construct a logistic regression predictive model.
LASSO Regression Variable Selection
Twenty-seven candidate variables were included in the LASSO regression model (excluding ACT score as the outcome measure), comprising demographic characteristics, anthropometric measurements, body composition parameters, pulmonary function indices, and inflammatory markers. The LASSO coefficient path diagram showed that as the penalty parameter λ increased, variable coefficients were gradually compressed to zero (Figure 3A). Through 10-fold cross-validation, lambda.min was selected as the optimal penalty parameter (Figure 3B), ultimately screening out five variables with non-zero coefficients: SMM/WT, VFA, ECW/TBW, MMEF percent predicted, and MEF75% predicted. Notably, phase angle (PhA), despite showing significant group differences in the baseline comparison, was not retained by LASSO, indicating that it did not contribute additional predictive value beyond the selected variables (Table 5).
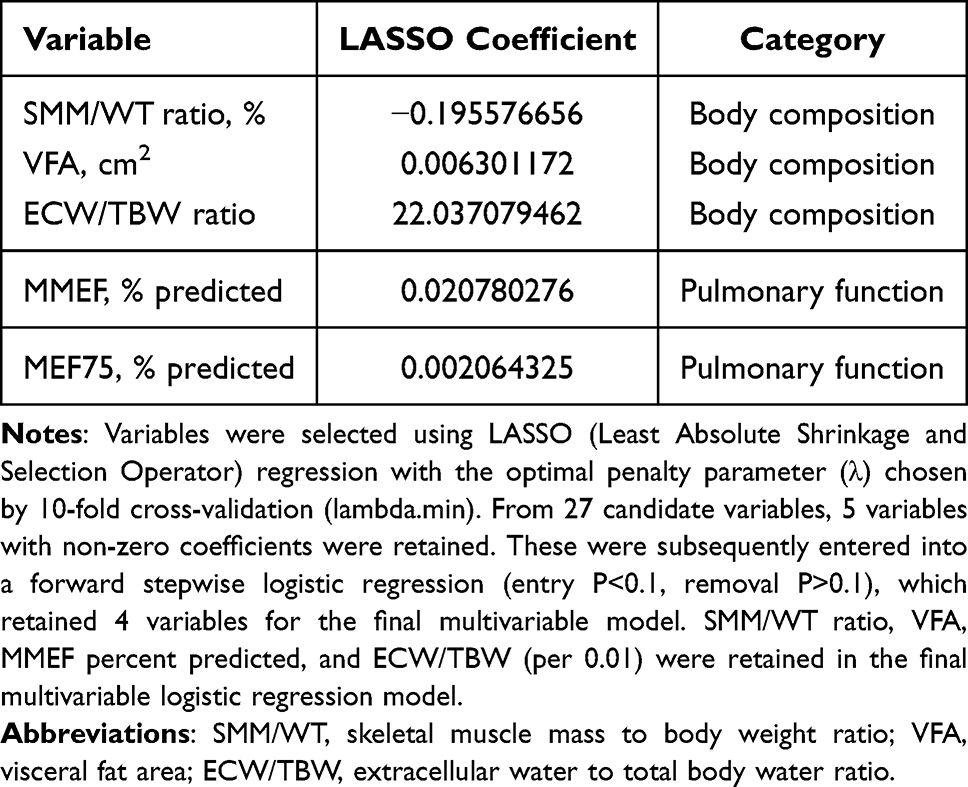 |
Table 5 Variables Selected by LASSO Regression |
 |
Figure 3 Variable Selection Using LASSO Regression. (A) Ten-fold cross-validation curve. Red dots represent the binomial deviance at each value of the penalty parameter (λ), and vertical bars represent ±1 standard error. The left vertical dashed line indicates lambda.1se (λ = 0.10571), the largest λ within 1 standard error of the minimum deviance, which yields a more parsimonious model. The right vertical dashed line indicates lambda.min (λ = 0.06639), the value that minimises the cross-validated deviance and was selected for this study to maximise predictive performance. Numbers at the top of the panel indicate the count of non-zero coefficients retained at each λ; five variables were retained at lambda.min. (B) LASSO coefficient path. Each coloured line represents the trajectory of one candidate variable’s coefficient as the penalty parameter (λ) varies along the −Log(λ) axis. As λ increases (moving leftward on the −Log(λ) axis), less important variables are shrunk toward zero, leaving only the most predictive features. Numbers at the top of the panel indicate the count of non-zero coefficients at the corresponding λ values. |
Multivariable Logistic Regression Analysis
The five variables screened by LASSO were entered into a forward stepwise logistic regression model (entry P<0.1, removal P>0.1). MEF75% predicted was excluded (P=0.149). Four variables remained as independent predictors of poorly controlled asthma (Table 6): SMM/WT, VFA, MMEF percent predicted, and ECW/TBW. The OR for SMM/WT was 0.664 (95% CI: 0.497–0.889, P=0.006), indicating that each 1% increase in SMM/WT was associated with a 33.6% decrease in the odds of poorly controlled asthma. The OR for VFA was 1.014 (95% CI: 1.001–1.028, P=0.034), indicating that each 1 cm2 increase in VFA was associated with a 1.4% increase in the odds. MMEF percent predicted showed an OR of 1.073 (95% CI: 1.007–1.143, P=0.029), suggesting that higher mid-expiratory flow was associated with increased odds of poor control in this subgroup. ECW/TBW (per 0.01 increase) showed an OR of 1.719 (95% CI: 1.000–2.956, P=0.050), indicating a borderline significant association with poorly controlled asthma.
 |
Table 6 Multivariable Logistic Regression Analysis of Predictors for Poorly Controlled Asthma |
Predictive Model Performance Evaluation
ROC curve analysis showed that the predictive model had good discriminative ability, with an AUC of 0.807 (95% CI: 0.709–0.905). The cutoff value corresponding to the maximum Youden index was 0.618, with a sensitivity of 76.9% and a specificity of 75.8% (Figure 4A). The calibration curve showed that predicted probabilities were highly consistent with actual observed probabilities, with a MAE of 0.027, indicating good calibration (Figure 4B). The Nagelkerke R-squared (R2) of the model was 0.365, indicating that the model explained 36.5% of the variance in asthma control status. The Brier score was 0.168, below the non-informative threshold of 0.238 for a prevalence of 61%, indicating acceptable probabilistic prediction accuracy. The Hosmer–Lemeshow test showed no significant lack of fit (χ2=5.273, df=8, P=0.728), and variance inflation factors for all predictors were approximately 1.0, indicating no multicollinearity.
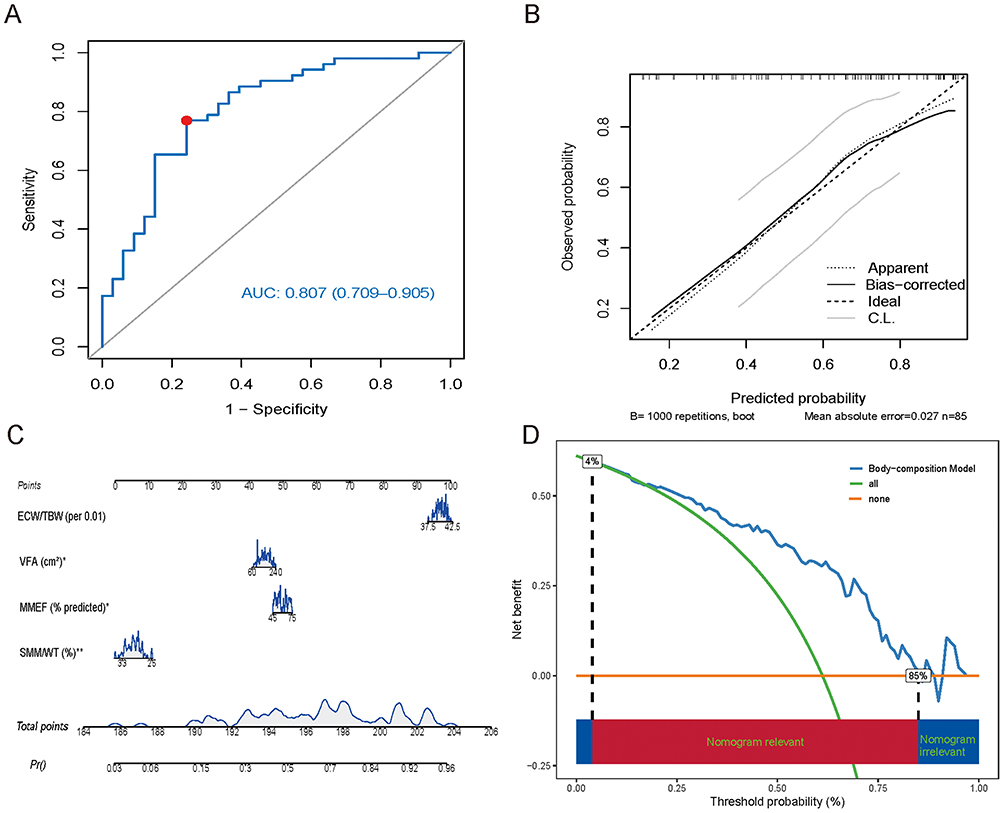 |
Figure 4 Performance Evaluation and Clinical Application of the Predictive Model. (A) Receiver operating characteristic (ROC) curve of the four-variable logistic regression model. The blue line represents the ROC curve and the diagonal grey reference line represents random prediction. The red dot indicates the optimal cut-point determined by the Youden index (predicted probability = 0.618, sensitivity = 76.9%, specificity = 75.8%). AUC = 0.807 (95% CI: 0.709–0.905). (B) Calibration curve. The dashed diagonal line represents perfect calibration (ideal); the dotted line shows apparent calibration; the solid black line shows bias-corrected calibration after 1000 bootstrap resamples; and the flanking thin grey lines indicate the 95% confidence limits (C.L.). Mean absolute error (MAE) = 0.027 (n = 85), indicating good agreement between predicted and observed probabilities. (C) Nomogram for estimating the predicted probability of poorly controlled asthma based on SMM/WT, VFA, MMEF percent predicted, and ECW/TBW (per 0.01). Blue density curves at each predictor axis display the distribution of values in the study population. The bottom “Pr()” axis gives the predicted probability of poorly controlled asthma. Asterisks next to predictor names indicate statistical significance in the multivariable logistic regression model: *P < 0.05; **P < 0.01. (D) Decision curve analysis (DCA). The blue line represents the net benefit of the body-composition model; the green line represents the treat-all strategy; and the Orange line represents the treat-none strategy. The coloured bar at the bottom indicates the risk-threshold range over which the model provides clinical net benefit (“Nomogram relevant”, red, approximately 4%–85%) versus the ranges where the model does not outperform the reference strategies (“Nomogram irrelevant”, blue). Abbreviations: SMM/WT, skeletal muscle mass to body weight ratio; VFA, visceral fat area; MMEF, maximal mid-expiratory flow; ECW/TBW, extracellular water to total body water ratio; ROC, receiver operating characteristic; AUC, area under the curve; MAE, mean absolute error; DCA, decision curve analysis. |
Based on the final logistic regression model, a nomogram was constructed for clinical application (Figure 4C). Clinicians can locate the corresponding points for each predictor (SMM/WT, VFA, MMEF percent predicted, and ECW/TBW) on the nomogram, then sum the four individual scores to obtain the total score, which is used to predict the probability of poorly controlled asthma. DCA showed that within the risk threshold range of approximately 4–85%, the predictive model demonstrated greater net benefit compared with the treat-all and treat-none strategies. The boundaries of this range correspond to the threshold probabilities at which the model’s net benefit curve intersects the two reference strategies and should not be interpreted as recommended clinical decision thresholds (Figure 4D), suggesting potential clinical utility pending external validation.
Discussion
Obesity-related asthma in children is increasingly recognized as a clinically distinct entity, in which body composition and metabolic factors—rather than purely allergic mechanisms—may shape disease control.6,9 In this cross-sectional study of 191 children with obesity, those with asthma exhibited lower relative skeletal muscle mass and higher sarcopenic obesity prevalence than those without. Within the obese-asthma subgroup, SMM/WT, VFA, MMEF percent predicted, and ECW/TBW were independently associated with poorly controlled asthma, and a four-variable prediction model showed good discrimination (AUC=0.807). These findings suggest that muscle–fat imbalance may contribute to asthma control in pediatric obesity and warrant prospective validation.
Compared with prior pediatric and adult studies that defined uncontrolled asthma using the broader ACT/C-ACT ≤19 threshold, our study applied the more stringent ≤15/≤12 cut-points, which correspond to the very-poorly-controlled stratum endorsed by the EPR-3 guidelines and the second validated cut-point of the C-ACT.25 This methodological choice accounts for the relatively high proportion of poorly controlled cases in our cohort (52/85, 61%) and was made a priori to maximize the body-composition contrast between the most clinically refractory children and those with relatively preserved control, thereby improving the signal-to-noise ratio in a modest sample. A potential trade-off is that our findings may not be directly generalizable to children with milder degrees of inadequate control, who likely represent a clinically and biologically distinct subgroup warranting separate investigation.
Given that there is currently no standardized consensus for the diagnosis of SO in children and adolescents,28 we followed the dual-criteria framework of Donini et al23 and defined sarcopenic obesity as concomitant low skeletal muscle mass and high visceral fat mass. The selection of Scheme B (P20/P80) was a data-driven decision based on consideration of statistical significance and clinical plausibility. While Scheme A (P10/P90) lacked statistical power to detect associations with obesity-related asthma, Scheme C (P25/P50) yielded prevalence that may not reflect clinically meaningful sarcopenic obesity. Scheme B showed significant association with obesity-related asthma and prevalence comparable to published pediatric estimates, which vary widely depending on diagnostic criteria.28,29 The higher prevalence in our obese-asthma subgroup aligns with reports that sarcopenic obesity is elevated among children with obesity with cardiometabolic comorbidities.30 However, these cutoffs were derived from our study population and require external validation in independent cohorts with diverse ethnic and body composition characteristics before broader application.
SMM/WT was lower in children with obesity with asthma and inversely associated with poorly controlled asthma, consistent with adult studies linking higher muscle mass to better asthma control.15 This association may involve multiple mechanisms. Decreased skeletal muscle function has been associated with impaired respiratory muscle capacity and reduced airway clearance.31 Tattersall et al32 found muscle fatty infiltration associated with accelerated pulmonary function decline in severe asthma. Additionally, skeletal muscle secretes anti-inflammatory myokines (IL-6, IL-15, irisin) that may counteract adipokines.14,33 Reduced muscle mass leads to insufficient myokine secretion, weakening the body’s anti-inflammatory capacity and aggravating systemic inflammation. In addition, reduced SMM is closely related to insulin resistance, which in turn affects glucose and lipid metabolism and promotes systemic inflammatory responses.34 It should be noted that the mechanistic evidence cited above derives predominantly from adult cohorts, and the applicability of these pathways to children aged 6–14 years—whose skeletal-muscle physiology and hormonal milieu differ substantially from adults—cannot be assumed without pediatric-specific investigation. Furthermore, given the cross-sectional nature of our study, prospective studies are needed to determine whether SMM/WT could inform risk stratification in pediatric obesity-related asthma.
VFA, a measure of visceral fat accumulation, represents another important body composition characteristic in obesity-related asthma. In our study, each 1 cm2 increase in VFA was associated with 1.4% higher odds of poorly controlled asthma (OR=1.014). Visceral adipose tissue is a metabolically active endocrine organ that secretes pro-inflammatory cytokines and chemokines,12 and children with obesity with asthma have been reported to show elevated inflammatory markers.8 Visceral adiposity has been associated with systemic low-grade inflammation, which may contribute to airway inflammation and structural remodeling.12 Visceral fat accumulation is associated with adipokine dysregulation, including elevated leptin levels, which have been linked to increased asthma severity.11 Additionally, airway inflammation in obese asthma often demonstrates a neutrophil-predominant phenotype,35,36 which may partially explain reduced responsiveness to inhaled corticosteroid treatment.36 Mechanically, visceral adiposity may also affect pulmonary function through thoracic compression.37 Notably, VFA did not differ significantly between children with and without asthma, yet higher VFA was associated with poorly controlled asthma within the obese-asthma subgroup, suggesting that visceral fat accumulation may influence asthma control more than asthma susceptibility. This is consistent with adult studies identifying VFA as a stronger correlate of asthma outcomes than traditional obesity measures,38,39 and underscores the potential value of assessing fat distribution rather than overall adiposity alone.
A notable observation was that despite body composition differences between the non-poorly-controlled and poorly controlled groups, we found no significant differences in measured inflammatory markers. This may suggest that muscle-fat imbalance operates through mechanisms distinct from classical type-2 allergic inflammation. Several possibilities may explain this observation. Visceral adiposity effects may be tissue-specific, with peribronchial fat exerting paracrine inflammatory effects on airways without proportionally elevating circulating markers.40,41 Reduced muscle mass may impair anti-inflammatory myokine secretion14,33 without affecting type-2 biomarkers. Additionally, poorly controlled asthma in children with obesity may involve non-type-2 mechanisms including neutrophilic inflammation, oxidative stress, and mechanical factors not reflected by conventional biomarkers.35,42 It should also be noted that the subgroup comparison (n=52 vs. n=33) may have been underpowered to detect modest differences in circulating markers, and this statistical limitation should be considered alongside the mechanistic explanations. Future studies with larger sample sizes examining myokines, adipokines, neutrophilic inflammation markers, and tissue-level assessments may help elucidate these mechanisms. The positive association between MMEF percent predicted and poorly controlled asthma warrants cautious interpretation. Within this subgroup, MMEF values were uniformly reduced (median 56.5%). The paradoxical direction may reflect confounding by obstruction pattern: children with predominantly large-airway obstruction but relatively preserved small-airway flow may present with higher MMEF yet still exhibit poor control. This borderline association (univariate P = 0.055) should be regarded as hypothesis-generating.
SO was more prevalent in children with obesity with asthma compared to those with simple obesity. However, within the obese-asthma subgroup, SO prevalence did not differ significantly between the poorly controlled and non-poorly-controlled groups, suggesting that SO alone may not independently predict asthma control status. The higher prevalence of SO in obese-asthma children may reflect altered anti-inflammatory capacity and increased pro-inflammatory effects associated with the disease process. SO has been linked to cardiometabolic disease and elevated inflammatory markers.28,43 While pediatric diagnostic criteria remain unstandardized,23 our percentile-based cutoffs demonstrated statistical associations that may inform future validation. Lower PhA in obese-asthma children may reflect altered cellular integrity. ECW/TBW, retained as an independent predictor in the final model, may reflect subclinical fluid expansion associated with systemic inflammation and airway edema in obese asthma; however, this borderline association requires replication before mechanistic conclusions can be drawn.
The prediction model demonstrated good discriminative ability (AUC=0.807, sensitivity 76.9%, specificity 75.8%). The calibration curve showed good agreement between predicted and observed probabilities, and the Hosmer–Lemeshow test confirmed adequate fit. Decision curve analysis indicated potential net benefit within the identified risk threshold range. A nomogram based on SMM/WT, VFA, MMEF percent predicted, and ECW/TBW was developed to facilitate risk estimation. However, given the cross-sectional design and single-center setting, external validation is necessary before this model can be considered for clinical application. The nomogram requires bioelectrical impedance analysis to estimate SMM/WT, VFA, and ECW/TBW, along with spirometry for MMEF percent predicted. While multi-frequency BIA devices are available in some pediatric centers,18,44 access may be limited in primary care settings. Alternative approaches could include anthropometric surrogates such as waist-to-height ratio, which has shown correlations with visceral fat area.45 Although discrimination was acceptable (AUC = 0.807), the Youden-derived cut-point yielded a sensitivity of 76.9%, indicating that approximately one in four children with poorly controlled asthma would be misclassified as non-poorly-controlled. In a screening context this false-negative rate may be unacceptable, and an alternative cut-point favouring higher sensitivity—or use of the model for triage rather than for ruling out poor control—may be more appropriate. If validated prospectively, these findings may inform risk stratification in obesity-related asthma. Whether interventions targeting body composition could improve asthma outcomes remains to be determined. Prospective trials evaluating the effects of exercise and dietary modifications on both body composition and asthma control in children are needed. Future mechanistic studies may explore the role of muscle-fat balance in asthma pathophysiology.46,47
Several limitations should be acknowledged. First, the cross-sectional design precludes causal inference; whether muscle–fat imbalance contributes to poor asthma control or vice versa cannot be determined from these data. An additional consideration is that the non-poorly-controlled comparison group (n = 33) was heterogeneous, with C-ACT/ACT scores spanning a wide range (median 18, IQR 15–20), which may have attenuated the observed body-composition contrasts. Future studies adopting a three-tier stratification (well-controlled / not-well-controlled / poorly controlled) are warranted. Second, recruitment from a single tertiary center in Xinjiang, China, may have favored more severe cases and limits generalizability to community settings and other ethnic populations. Third, the prediction model demonstrated good discrimination in our cohort but lacks external validation in geographically and ethnically diverse populations, which is required before clinical application. Fourth, body composition was estimated by octopolar multi-frequency BIA using proprietary undisclosed algorithms18 rather than the reference-standard DXA. Although the InBody 720 has demonstrated excellent agreement with DXA for skeletal muscle mass in Chinese children aged 5–17 years, particularly in the obesity subgroup,19 octopolar BIA devices tend to underestimate fat mass percentage and overestimate fat-free mass percentage18,19 and remain sensitive to hydration status. Because our primary exposures were skeletal muscle mass ratio and visceral fat area rather than fat mass percentage, this directional bias is unlikely to have materially affected the main findings, but cannot be excluded. Fifth, several unmeasured confounders—including physical activity levels, dietary patterns, environmental exposures, and socioeconomic factors—may have influenced the observed associations. Finally, several additional methodological considerations should be noted. Of 375 screened children, 166 were excluded for incomplete data; although age, sex, and BMI did not differ significantly between included and excluded children, other unmeasured characteristics may have differed. Asthma control was assessed with two age-specific instruments (C-ACT and ACT), which may introduce measurement heterogeneity that the modest subgroup sizes precluded us from evaluating through instrument-stratified sensitivity analyses. Additionally, the sarcopenic-obesity cutoffs were derived internally in the absence of an internationally accepted pediatric definition and may not be transferable to other populations. Furthermore, the two-stage variable-selection strategy (LASSO with lambda.min followed by forward stepwise logistic regression) and the resulting gain in discrimination over our earlier two-variable model should be regarded as exploratory.
Conclusion
This study found that lower SMM/WT, higher VFA, higher MMEF percent predicted, and higher ECW/TBW were independently associated with poorly controlled asthma in children with obesity. SO was more prevalent in obesity-related asthma. A prediction model incorporating body composition and pulmonary function parameters demonstrated good discriminative ability (AUC=0.807). These findings suggest that muscle-fat imbalance may influence asthma control outcomes in pediatric obesity. However, given the single-centre tertiary-hospital recruitment in Xinjiang, China, and the limited ethnic representation of the study population, external validation in multi-centre cohorts of diverse ethnic background, together with prospective studies evaluating whether interventions targeting body composition can improve asthma control, will be required before these findings can inform routine clinical practice.
Abbreviations
ACT, Asthma Control Test; ATS, American Thoracic Society; AUC, area under the curve; BFM, body fat mass; BIA, bioelectrical impedance analysis; BMI, body mass index; BMR, basal metabolic rate; C-ACT, Childhood Asthma Control Test; CI, confidence interval; CRP, C-reactive protein; DCA, decision curve analysis; DXA, dual-energy X-ray absorptiometry; ECW/TBW, extracellular water to total body water ratio; ELISA, enzyme-linked immunosorbent assay; EPR-3, Expert Panel Report 3; ERS, European Respiratory Society; FeNO, fractional exhaled nitric oxide; FEV1, forced expiratory volume in 1 second; FFM, fat-free mass; FVC, forced vital capacity; GINA, Global Initiative for Asthma; GLI, Global Lung Function Initiative; IgE, immunoglobulin E; IL-6, interleukin-6; IQR, interquartile range; LASSO, Least Absolute Shrinkage and Selection Operator; MAE, mean absolute error; MEF25, maximal expiratory flow at 25% of FVC; MEF50, maximal expiratory flow at 50% of FVC; MEF75, maximal expiratory flow at 75% of FVC; MMEF, maximal mid-expiratory flow; NAEPP, National Asthma Education and Prevention Program; NHANES, National Health and Nutrition Examination Survey; OR, odds ratio; PBF, percent body fat; PEF, peak expiratory flow; PhA, phase angle; ROC, receiver operating characteristic; SD, standard deviation; SMM, skeletal muscle mass; SMM/WT, skeletal muscle mass to body weight ratio; SO, sarcopenic obesity; STROBE, Strengthening the Reporting of Observational Studies in Epidemiology; TBW, total body water; VFA, visceral fat area; WHtR, waist-to-height ratio.
Data Sharing Statement
The data that support the findings of this study are available from the corresponding author upon reasonable request.
Ethics Approval and Informed Consent
This study was approved by the Ethics Committee of the First Affiliated Hospital of Xinjiang Medical University (approval number: K202509-54). Written informed consent was obtained from the legal guardians of all participants prior to enrollment. All procedures complied with institutional requirements and the ethical standards of the Declaration of Helsinki.
Consent for Publication
Written informed consent for the publication of deidentified participant data was obtained from the legal guardians of all minor participants prior to study enrollment.
Author Contributions
All authors made a significant contribution to the work reported, whether that is in the conception, study design, execution, acquisition of data, analysis and interpretation, or in all these areas; took part in drafting, revising or critically reviewing the article; gave final approval of the version to be published; have agreed on the journal to which the article has been submitted; and agree to be accountable for all aspects of the work.
Funding
This work was supported by the Tianshan Elite High-Level Medical Talent Development Program administered by the Health Commission of Xinjiang (Grant No. TSYC202301B003), State Key Laboratory of Pathogenesis, Prevention, Treatment of Central Asian High Incidence Diseases Fund (Grant No. SKL-HIDCA-2024-GB9). The funders had no role in study design, data collection and analysis, decision to publish, or preparation of the manuscript.
Disclosure
The authors declare no competing interests in this work.
References
1. Zhang L, Jiang H, Yang G, et al. Global, regional and national burden of asthma from 1990 to 2021: a systematic analysis for the Global Burden of Disease Study 2021. BMJ Open Respir Res. 2025;12(1):e003144. doi:10.1136/bmjresp-2025-003144
2. Park H, Choi JE, Jun S, et al. Metabolic complications of obesity in children and adolescents. Clin Exp Pediatr. 2024;67(7):347–20. doi:10.3345/cep.2023.00892
3. Egan KB, Ettinger AS, Bracken MB. Childhood body mass index and subsequent physician-diagnosed asthma: a systematic review and meta-analysis of prospective cohort studies. BMC Pediatr. 2013;13(1):121. doi:10.1186/1471-2431-13-121
4. Forno E, Weiner DJ, Mullen J, et al. Obesity and Airway Dysanapsis in Children with and without Asthma. Am J Respir Crit Care Med. 2017;195(3):314–323. doi:10.1164/rccm.201605-1039OC
5. Pan XF, Wang L, Pan A. Epidemiology and determinants of obesity in China. Lancet Diabetes Endocrinol. 2021;9(6):373–392. doi:10.1016/S2213-8587(21)00045-0
6. Abu Zahra M, Pessin J, Rastogi D. A clinician’s guide to effects of obesity on childhood asthma and into adulthood. Expert Rev Respir Med. 2024;18(10):759–775. doi:10.1080/17476348.2024.2403500
7. Averill SH, Forno E. Management of the pediatric patient with asthma and obesity. Ann Allergy Asthma Immunol. 2024;132(1):30–39. doi:10.1016/j.anai.2023.10.001
8. Shailesh H, Noor S, Hayati L, et al. Asthma and obesity increase inflammatory markers in children. Front Allergy. 2025;5:1536168. doi:10.3389/falgy.2024.1536168
9. Reyes-Angel J, Kaviany P, Rastogi D, Forno E. Obesity-related asthma in children and adolescents. Lancet Child Adolesc Health. 2022;6(10):713–724. doi:10.1016/S2352-4642(22)00185-7
10. Rastogi D, Holguin F. Metabolic Dysregulation, Systemic Inflammation, and Pediatric Obesity-related Asthma. Ann Am Thorac Soc. 2017;14(Supplement_5):S363–S367. doi:10.1513/AnnalsATS.201703-231AW
11. Bantulà M, Roca-Ferrer J, Arismendi E, Picado C. Asthma and Obesity: two Diseases on the Rise and Bridged by Inflammation. J Clin Med. 2021;10(2):169. doi:10.3390/jcm10020169
12. Listyoko AS, Okazaki R, Harada T, Inui G, Yamasaki A. Impact of obesity on airway remodeling in asthma: pathophysiological insights and clinical implications. Front Allergy. 2024;5:1365801. doi:10.3389/falgy.2024.1365801
13. Shao S, Wu L, Cui C, et al. Positive association between visceral adiposity index and asthma in US children and adolescents: an analysis of NHANES data. Pediatr Res. 2025. doi:10.1038/s41390-025-04453-8
14. Di Ludovico A, La Bella S, Ciarelli F, Chiarelli F, Breda L, Mohn A. Skeletal muscle as a pro- and anti-inflammatory tissue: insights from children to adults and ultrasound findings. J Ultrasound. 2024;27(4):769–779. doi:10.1007/s40477-024-00917-5
15. Zhang S, Zhang X, Deng K, et al. Reduced Skeletal Muscle Mass Is Associated with an Increased Risk of Asthma Control and Exacerbation. J Clin Med. 2022;11(23):7241. doi:10.3390/jcm11237241
16. National Health Commission of the People’s Republic of China. Screening for overweight and obesity among school-age children and adolescents (WS/T 586-2018). Beijing, China: National Health Commission of the People’s Republic of China; 2018. Available from: https://www.nhc.gov.cn/wjw/pqt/201803/a7962d1ac01647b9837110bfd2d69b26.shtml.
17. Global Initiative for Asthma. 2024 GINA Main Report [homepage on the Internet]. Global Initiative for Asthma; 2024. Available from: https://ginasthma.org/2024-report/.
18. Dupertuis YM, Jimaja W, Beardsley Levoy C, Genton L. Bioelectrical impedance analysis instruments: how do they differ, what do we need for clinical assessment? Curr Opin Clin Nutr Metab Care. 2025;28(5):379–387. doi:10.1097/MCO.0000000000001142
19. Huang Y, Wang X, Cheng H, et al. Differences in air displacement plethysmography, bioelectrical impedance analysis and dual-energy X-ray absorptiometry for estimating body composition in Chinese children and adolescents. J Paediatr Child Health. 2023;59(3):470–479. doi:10.1111/jpc.16327
20. Hu Q, Long Q, Wang W, Ma M. Bioelectrical impedance analysis for measuring body composition and predicting low muscle mass in apparently healthy pediatric outpatients: a retrospective observational study. BMC Pediatr. 2025;25(1):303. doi:10.1186/s12887-025-05579-8
21. Miller MR, Hankinson J, Brusasco V, et al. Standardisation of spirometry. Eur Respir J. 2005;26(2):319–338. doi:10.1183/09031936.05.00034805
22. Quanjer PH, Stanojevic S, Cole TJ, et al. Multi-ethnic reference values for spirometry for the 3–95-yr age range: the global lung function 2012 equations. Eur Respir J. 2012;40(6):1324–1343. doi:10.1183/09031936.00080312
23. Donini LM, Busetto L, Bischoff SC, et al. Definition and Diagnostic Criteria for Sarcopenic Obesity: ESPEN and EASO Consensus Statement. Obesity Facts. 2022;15(3):321–335. doi:10.1159/000521241
24. Liu AH, Zeiger RS, Sorkness CA, et al. Development and cross-sectional validation of the Childhood Asthma Control Test. J Allergy Clin Immunol. 2007;119(4):817–825. doi:10.1016/j.jaci.2006.12.662
25. Liu AH, Zeiger RS, Sorkness CA, et al. The Childhood Asthma Control Test: retrospective determination and clinical validation of a cut point to identify children with very poorly controlled asthma. J Allergy Clin Immunol. 2010;126(2):267–273.e1. doi:10.1016/j.jaci.2010.05.031
26. Schatz M, Sorkness CA, Li JT, et al. Asthma Control Test: reliability, validity, and responsiveness in patients not previously followed by asthma specialists. J Allergy Clin Immunol. 2006;117(3):549–556. doi:10.1016/j.jaci.2006.01.011
27. National Asthma Education and Prevention Program. Expert Panel Report 3 (EPR-3): guidelines for the Diagnosis and Management of Asthma-Summary Report 2007. J Allergy Clin Immunol. 2007;120(5):S93. doi:10.1016/j.jaci.2007.09.043.
28. Zembura M, Matusik P. Sarcopenic Obesity in Children and Adolescents: a Systematic Review. Front Endocrinol. 2022;13:914740. doi:10.3389/fendo.2022.914740
29. Boros KK, Veres G, Pintér HK, et al. Novel approach to assess sarcopenia in children with inflammatory bowel disease. Front Pediatr. 2024;12:1204639. doi:10.3389/fped.2024.1204639
30. Perng W, Tang L, Song PXK, Tellez-Rojo MM, Cantoral A, Peterson KE. Metabolomic profiles and development of metabolic risk during the pubertal transition: a prospective study in the ELEMENT Project. Pediatr Res. 2018;85(3):262–268. doi:10.1038/s41390-018-0195-5
31. Visser E, de Jong K, van Zutphen T, Kerstjens HAM, Ten Brinke A. Muscle Function in Moderate to Severe Asthma: association With Clinical Outcomes and Inflammatory Markers. J Allergy Clin Immunol Pract. 2023;11(5):1439–1447.e3. doi:10.1016/j.jaip.2022.12.043
32. Tattersall MC, Lee KE, Tsuchiya N, et al. Skeletal Muscle Adiposity and Lung Function Trajectory in the Severe Asthma Research Program. Am J Respir Crit Care Med. 2023;207(4):475–484. doi:10.1164/rccm.202203-0597OC
33. Eckardt K, Görgens SW, Raschke S, Eckel J. Myokines in insulin resistance and type 2 diabetes. Diabetologia. 2014;57(6):1087–1099. doi:10.1007/s00125-014-3224-x
34. Gaur K, Mohapatra L, Wal P, Parveen A, Kumar S, Gupta V. Deciphering the mechanisms and effects of hyperglycemia on skeletal muscle atrophy. Metabol Open. 2024;24:100332. doi:10.1016/j.metop.2024.100332
35. Scott HA, Gibson PG, Garg ML, Wood LG. Airway inflammation is augmented by obesity and fatty acids in asthma. Eur Respir J. 2011;38(3):594–602. doi:10.1183/09031936.00139810
36. Telenga ED, Tideman SW, Kerstjens HAM, et al. Obesity in asthma: more neutrophilic inflammation as a possible explanation for a reduced treatment response. Allergy. 2012;67(8):1060–1068. doi:10.1111/j.1398-9995.2012.02855.x
37. Silva-Reis A, Brill B, Brandao-Rangel MAR, et al. Association Between Visceral Fat and Lung Function Impairment in Overweight and Grade I Obese Women: a Cross-Sectional Study. Adv Respir Med. 2024;92(6):548–558. doi:10.3390/arm92060048
38. Türk Y, Witte JA, Van huisstede A, et al. Visceral adipose tissue: a relevant inflammatory compartment in obesity-related asthma? Clin Exp Allergy. 2023;53(12):1295–1297. doi:10.1111/cea.14395
39. Liu Q, Han X, Chen Y, Gao Y, Yang W, Huang L. Asthma prevalence is increased in patients with high metabolism scores for visceral fat: study reports from the US. Front Endocrinol. 2023;14:1162158. doi:10.3389/fendo.2023.1162158
40. Elliot JG, Donovan GM, Wang KCW, Green FHY, James AL, Noble PB. Fatty airways: implications for obstructive disease. Eur Respir J. 2019;54(6):1900857. doi:10.1183/13993003.00857-2019
41. Sideleva O, Suratt BT, Black KE, et al. Obesity and asthma: an inflammatory disease of adipose tissue not the airway. Am J Respir Crit Care Med. 2012;186(7):598–605. doi:10.1164/rccm.201203-0573OC
42. Peters U, Dixon AE, Forno E. Obesity and asthma. J Allergy Clin Immunol. 2018;141(4):1169–1179. doi:10.1016/j.jaci.2018.02.004
43. Veronese N, Ragusa FS, Pegreffi F, et al. Sarcopenic obesity and health outcomes: an umbrella review of systematic reviews with meta-analysis. J Cachexia Sarcopenia Muscle. 2024;15(4):1264–1274. doi:10.1002/jcsm.13502
44. Wells JCK, Fewtrell MS. Measuring body composition. Arch Dis Child. 2005;91(7):612–617. doi:10.1136/adc.2005.085522
45. Zhang X, Lu X, Pan X, Shen S, Tong N. Role of waist circumference-to-height ratio in assessing adiposity, predicting type 2 diabetes mellitus and other cardiometabolic diseases. Zhong Nan Da Xue Xue Bao Yi Xue Ban. 2024;49(7):1062–1072. doi:10.11817/j.issn.1672-7347.2024.240259
46. Althoff MD, Gaietto K, Holguin F, Forno E. Obesity-related Asthma: a Pathobiology-based Overview of Existing and Emerging Treatment Approaches. Am J Respir Crit Care Med. 2024;210(10):1186–1200. doi:10.1164/rccm.202406-1166SO
47. Tashiro H, Kurihara Y, Kuwahara Y, Takahashi K. Impact of obesity in asthma: possible future therapies. Allergol Int. 2024;73(1):48–57. doi:10.1016/j.alit.2023.08.007
 © 2026 The Author(s). This work is published and licensed by Dove Medical Press Limited. The
full terms of this license are available at https://www.dovepress.com/terms
and incorporate the Creative Commons Attribution
- Non Commercial (unported, 4.0) License.
By accessing the work you hereby accept the Terms. Non-commercial uses of the work are permitted
without any further permission from Dove Medical Press Limited, provided the work is properly
attributed. For permission for commercial use of this work, please see paragraphs 4.2 and 5 of our Terms.
© 2026 The Author(s). This work is published and licensed by Dove Medical Press Limited. The
full terms of this license are available at https://www.dovepress.com/terms
and incorporate the Creative Commons Attribution
- Non Commercial (unported, 4.0) License.
By accessing the work you hereby accept the Terms. Non-commercial uses of the work are permitted
without any further permission from Dove Medical Press Limited, provided the work is properly
attributed. For permission for commercial use of this work, please see paragraphs 4.2 and 5 of our Terms.