Back to Journals » Diabetes, Metabolic Syndrome and Obesity » Volume 10
Sitagliptin ameliorates oxidative stress in experimental diabetic nephropathy by diminishing the miR-200a/Keap-1/Nrf2 antioxidant pathway
Authors Civantos E, Bosch E, Ramirez E, Zhenyukh O, Egido J, Lorenzo O, Mas S
Received 17 January 2017
Accepted for publication 22 March 2017
Published 7 June 2017 Volume 2017:10 Pages 207—222
DOI https://doi.org/10.2147/DMSO.S132537
Checked for plagiarism Yes
Review by Single anonymous peer review
Peer reviewer comments 2
Editor who approved publication: Professor Ming-Hui Zou
Esther Civantos,1,2 Enrique Bosch,1 Elisa Ramirez,1 Olha Zhenyukh,1 Jesús Egido,1,2 Oscar Lorenzo,1,2 Sebastián Mas1,2
1Renal, Vascular and Diabetes Research Laboratory, IIS-Fundación Jiménez Díaz, Autonoma University, 2CIBERDEM (Biomedical Research Centre in Diabetes and Associated Metabolic Disorders), Madrid, Spain
Background: Sitagliptin, a dipeptidyl peptidase-4 (DPP-4) inhibitor used in type 2 diabetes therapy, has demonstrated protective effects in diabetic chronic kidney disease, in part due to its pleiotropic actions. However, its potential direct effects on the kidney are still not completely defined. Here, by means of proteomics and miRNA profiling, we have further unveiled the role of sitagliptin in oxidative stress, as well as the underlying mechanisms.
Methods: Renal cortex samples from 9-month-old wild-type (Wistar), type II diabetic Goto-Kakizaki (GK) and sitagliptin-treated GK rats (GK+Sita) (10 mg kg−1 per day) were subjected to quantitative miRNA transcriptomic array, immunohistochemistry and Western blot studies. Renal GK and GK+Sita samples were also analyzed by differential in-gel electrophoresis. Bioinformatic tools were used to find out the relationships between altered proteins and related miRNA expression. Studies were also carried out in cultured tubular cells to confirm in vivo data.
Results: Diabetic GK rats exhibited proteinuria, renal interstitial inflammatory infiltrates and fibrosis, which improved by 20 weeks of sitagliptin treatment. Proteomic analysis of diabetic GK and Wistar rats showed a differential expression of 39 proteins mostly related to oxidative stress and catabolism. In addition, 15 miRNAs were also significantly altered in GK rats.
Conclusion: Treatment with sitagliptin was associated with modulation of antioxidant response in the diabetic kidney, involving a downregulation of miR-200a, a novel Keap-1 inhibitor and miR-21, coincidentally with the clinical and the morphological improvement. These data further support the concept that DPP-4 inhibitors could exert a direct reno-protective effect in patients with diabetic nephropathy.
Keywords: diabetes, sitagliptin, Nrf2, Keap-1, miRNAs, GK rats
Introduction
Type 2 diabetes mellitus (T2DM) accounts for 90% of all cases of diabetes and constitutes the major single cause of end-stage renal disease (ESRD), which is a major cause of death and disability worldwide. Globally, an estimated 422 million adults were living with diabetes in 2014 (9% of the adult population) compared to 108 million in 1980.1 Diabetic nephropathy (DN) has become a major public health problem, and it has a great impact on the quality of life of T2DM patients. The pathophysiology of T2DM is complex, involving defects in insulin sensitivity and secretion in correlation with incretin reduction.2
DN is still a therapeutic challenge, as treatment efficiency preventing or ameliorating its progression to ESRD has been rather modest. The current first line of treatment for DN is a tight glycemic control combined with renin–angiotensin–aldosterone system modulators,3 but in most cases, renal function continues to deteriorate, leading to renal failure. The reasons behind the therapeutic failure seem to be an incomplete knowledge of diabetes mediators of tissue injury. A better comprehension of those mechanisms could lead to novel strategies for diabetic kidney therapies.
Although many mediators are involved in this process, the most important is hyperglycemia itself as well as the generation of advanced glycosylation end products that may trigger reactive oxygen species (ROS) production and mitochondrial dysfunction.4,5
Similarly, the induction of intrinsic antioxidant response occurs through the activation of Nrf2 transcription pathway. This activation is achieved via inhibition of the Nrf2 repressor Keap-1. Thus, when Keap-1 releases Nrf2, it is translocated into the nucleus, where it induces the transcription of multiple genes involved in the antioxidant response such as catalase or superoxide dismutase factors.6
Compounds activating this pathway have already been tested in renal clinical trials. Bardoxolone methyl has been found to exert antioxidant effects via Nrf2 activation, and in a phase 2 clinical trial in DN patients, an amelioration of renal damage increasing the glomerular filtration rate was noted.7 Although a phase 3 trial (BEACON) was terminated due to cardiovascular safety concerns, Nrf2 activation still remains a potential therapeutic target for DN patients.8
Among the current treatments for T2DM, sitagliptin is one of the best known incretin-related drugs, which increases the incretin content through the inhibition of dipeptidyl peptidase-4 (DPP-4). The major produced incretin is GLP-1, which has been demonstrated to act as a key determinant of glucose metabolism, inducing slow gastric emptying, enhancing pancreatic insulin secretion and suppressing pancreatic glucagon secretion. Due to their safety profile and large clinical experience,9 sitagliptin and other DPP-4 inhibitors have been particularly recommended for diabetic patients with chronic kidney disease (CKD). In addition to their contributions in controlling blood glucose levels, a number of pleiotropic effects have been described for this class of compounds, including the glucose-independent reduction of glomerular hyperfiltration and albuminuria10,11 and the protective effects in the diabetic kidney disease.12 However, the mechanisms underlying the potential nephroprotection conferred by those types of drugs remain unclear. In an experimental model of T2DM, we evaluated the potential reno-protective effects of sitagliptin with a particular emphasis on the redox components and the Nrf2 system.
Materials and methods
T2DM experimental model
The Goto-Kakizaki (GK) model is polygenic nonobese and non-hypertensive rats from Wistar-Kyoto (WKY) strain, which develop T2DM. Male GK rats were purchased from Taconic (Hudson, NY, USA) and kept on an artificial 12-h light–dark cycle (7 a.m. to 7 p.m.) at 25°C. GK rats exhibited similar metabolism and hormonal and vascular disorders as the human T2DM, offering a convenient model for the study of type 2 diabetes per se, without the confounding effects of obesity or hypertension.13 Once male GK rats (n=12) became diabetic (at 16th week), six of them were treated with sitagliptin (Merck Sharp & Dohme, Kenilworth, NJ, USA) at 10 mg⋅kg−1 per day14 for 20 weeks (Figure 1A). The drug was dissolved in water and administered (at 10 a.m.) by gavage daily. Vehicle-treated GK rats (n=6) and their littermates (WKY, n=6) were also examined.
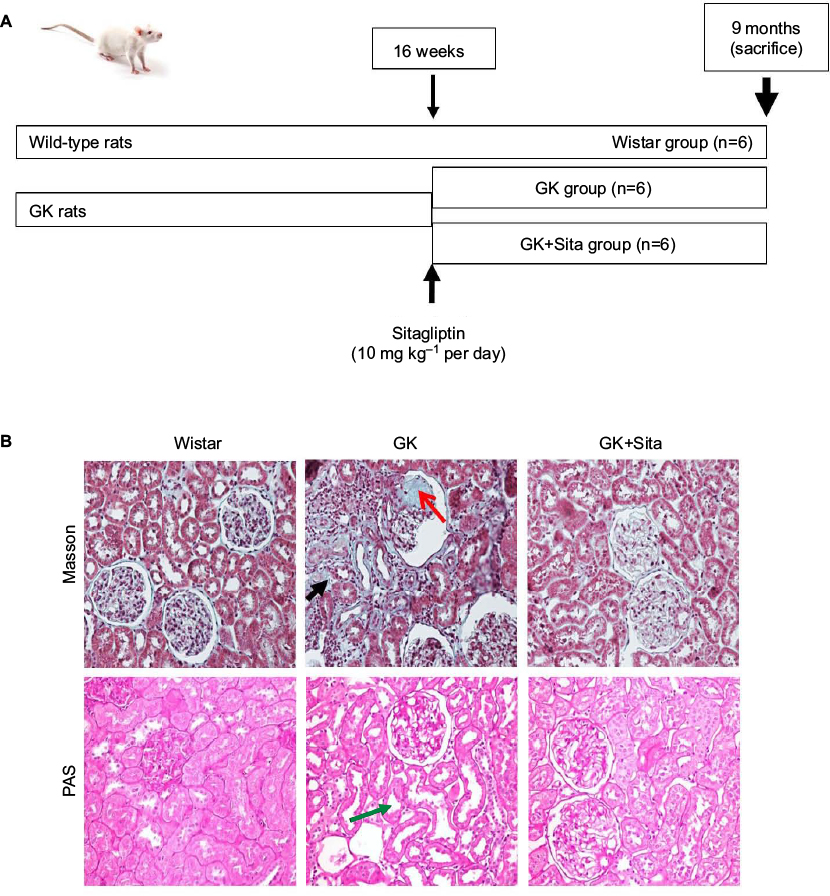 | Figure 1 (A) Experimental model schema: at 16 weeks (when the diabetic parameters were developed), some GK rats were injected with sitagliptin (10 mg⋅kg−1 per day) until sacrifice at 9 months. (B) Kidney Masson’s trichrome and PAS staining: significant glomerulosclerosis and interstitial fibrosis (black arrow) are observed in GK kidney vs. Wistar and Sita group (Kimmelstiel–Wilson nodule, red arrow), and PAS staining shows focal tubular dilation (green arrow). Abbreviations: GK, Goto-Kakizaki; PAS, Periodic Acid Schiff. |
Characterization of the model
Body weight and systolic blood pressure (by tail-cuff sphygmomanometer method) were also measured. After 20 weeks of treatment, rats were sacrificed, and plasma (collected with ethylenediamine tetraacetic acid) and the kidneys were isolated under isoflurane (1.5% in oxygen) anesthesia. Plasma lipid profile, glucose, GLP-1 and renal parameters were enzymatically measured. Insulin was measured by a glucose overload at t=0, and homeostatic model assessment – insulin resistance (HOMA-IR) was calculated as 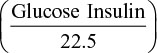 . The kidneys were rinsed, dried, weighted and longitudinally cut. One half of the kidney was included in formalin for histological examination, and the other half was frozen in liquid nitrogen for biochemical assays. This investigation was carried out according to the Guide for the Care and Use of Laboratory Animals (NIH Publication No. 85-23, revised 2011), and was approved by the Ethical Committee of the University Hospital Fundación Jiménez Díaz.
Masson’s and PAS staining in the kidneys
The kidneys were excised and placed in 4% neutral buffered formalin overnight at 4°C and subsequently processed and embedded in paraffin, and then sectioned at 4 µm. Masson’s trichrome staining and Periodic Acid Schiff (PAS) staining15 were performed following the manufacturer’s instructions, and the images were captured at 20× magnification. Renal damage was evaluated by a renal pathologist.
Renal proteomic analysis
The kidney samples from GK and GK+Sita rats (n=6, each group) were powdered and dissolved in lysis buffer (7 M urea, 2 M thiourea, 4% Chaps and 30 mM Tris pH 8.5) containing 50 mM dithiothreitol (DTT) and additionally broken with the 2D Grinding Kit (GE Healthcare, Little Chalfont, UK), following the manufacturer’s instructions. Protein concentrations were measured using the Bradford method:16 25 µg of total protein was used for analysis. An internal standard was prepared by pooling a portion of all samples. Samples were labeled with Cy dyes using 200 pmol minimal dye-labeling protocol, according to the manufacturer’s instructions (GE Healthcare). Samples were labeled with Cy3 or Cy5 interspersed. The internal standard was prepared from equal amounts of all samples and labeled with Cy2.
Samples were mixed with rehydration buffer (9 M urea, 2% Chaps, 0.5% immobilized pH gradient (IPG) buffer pH 3–10 NL, 65 mM DTT and a trace of bromophenol blue) and incubated for 30 min at room temperature. The isoelectric focusing was performed using an IPGphor 3 apparatus (GE Healthcare) and 24-cm isoelectric focusing strips pH 3–10 NL (GE Healthcare) as described.17
After electrophoresis, the gels were scanned with Typhoon 9400 scanner (GE Healthcare) with the appropriate excitation and emission wavelengths for Cy2, Cy3 and Cy5 dyes (Figure S1). Differential expression analysis was performed using DeCyder software v 7.0 and multivariate statistical module Extended Data Analysis (GE Healthcare). All the protein spots that showed statistical significant changes (p ≤ 0.05) in their expression (average ratio ≥1.5) were further analyzed by mass spectrometry (MS).
MS analysis and protein identification
Differentially expressed spots were selected from colloidal Coomassie preparative gels for excision and tryptic digestion.18 The analysis of the peptides extracted was carried out in a 4700 MALDI-TOF/TOF instrument (AB Sciex) combining MS and MS/MS data for each spot. Combined data with a mass tolerance of 50 ppm were used to search in a nonredundant protein database (National Center for Biotechnology Information [NCBI], Bethesda, MD, USA) and Rattus norvegicus Swiss-prot database through the Mascot software (Matrix Science), integrated in the Global Protein Server Workstation as described.19
Protein validation
Primary antibodies of Nrf2 (1:500, sc-722; Santa Cruz Biotech), Keap-1 (1:500, sc-15246; Santa Cruz Biotech), GPX-3 (1:500, ab59524; Abcam), GST (1:500, ab96043; Abcam), PRDX-1 (1:500, sc-21948R; Santa Cruz Biotech) and GADPH (1:5000, mab374; Millipore) were used for Western blotting with their respective specific horseradish peroxidase-conjugated secondary antibodies (GE Healthcare).
IHC and DHE staining
Paraffin sections of the kidney (n=6, each) were mounted on slides and used for immunohistochemistry (IHC). Primary antibodies, the same used in Western blot assay, were incubated overnight at 4°C, with biotin-labeled antibodies (anti-rabbit; GE Healthcare) and developed using the avidin–biotin–peroxidase complex (Dako Diagnósticos SA, Barcelona, Spain), and 3,3′-diaminobenzidine as chromogen. The sections were counterstained with Carazzi’s hematoxylin for nucleus staining. The negative controls used were nonspecific Ig of the same isotype. The quantification was made by determining the total number of positive cells in 20 randomly chosen fields (400×) using Image-Pro Plus software (Media Cybernetics, Rockville, MD, USA). To assess superoxide production, dihydroethidium (DHE) fluorescence of kidney tissue sections was visualized by fluorescence microscopy, as previously described.20 The data were expressed as positive stained area vs. total analyzed area.
miRNAs profiling and qPCR
The kidneys were lysed using a Bullet Blender (Next Advance, Inc) according to the manufacturer’s instructions. Briefly, approximately 30–40 mg of frozen kidney was homogenized in 2 volumes of Qiazol reagent (Qiagen GmbH, Hilden, Germany) and then centrifuged at 10,000 g for 15 min at 4°C. The RNA from supernatant was extracted by Trizol method. Pool of miRNAs was extracted by using a Qiagen miRNeasy Mini Kit (Qiagen GmbH). miRNAs were quantified by Agilent 2100 Bioanalyzer. Reverse transcription was conducted using miRNA First Strand Kit (Qiagen GmbH). A quantitative polymerase chain reaction (qPCR) array was carried out using ABI 7900HT System (Applied Biosystems, Foster City, CA, USA) to analyze rat microRNAs (RT2 miRNA PCR array; SABiosciences).
The miRNA qPCR array data analysis was carried out in SABiosciences web portal (http://www.sabiosciences.com/pcrarraydataanalysis.php).
Total RNA was extracted using Qiazol (Qiagen GmbH) from rat kidney according to the manufacturer’s instructions. Reverse transcription of 2 µg of total RNA was made using High Capacity DNA Reverse Transcription kit (Applied Biosystems). Expression levels of rno-miR-16-5p (ID: 000391), rno-miR-21-5p (ID: 000397), rno-miR-26b-5p (ID: 000407), rno-miR-27b-3p (ID: 000409), rno-miR-200a-3p (ID: 000502) and U6snRNA (ID: 001973 as housekeeping) were evaluated with specific TaqMan MicroRNA Assays in single-plex by PCR using the 7500 Fast Real Time PCR System (Applied Biosystems). The fold change for each miRNA was calculated using this method with U6 small nuclear RNA as the endogenous control. All reactions were done in triplicate for each sample.
In vitro studies in HK2
An immortalized proximal tubule epithelial cell line from normal adult human kidney HK-2 (ATCC CRL-2190) was used for in vitro assays. HK-2 cells were grown in RPMI 1640 medium (Sigma-Aldrich, St Louis, MO, USA) with 10% heat-inactivated fetal bovine serum, 100 units/ml penicillin, 100 μg/ml streptomycin, 2 mM glutamine, insulin transferrin selenite (5 μg/ml) and hydrocortisone (36 ng/ml) (Sigma-Aldrich) at 37°C in a 5% CO2 atmosphere. At confluence, cells were growth-arrested in serum-free medium for 24 h before the experiments. The hyperglycemic conditions were mimicked by incubation (24 h) with high concentration of D-glucose (33 mM; Sigma-Aldrich). Some cells were pretreated with sitagliptin (1 h, 0.05 and 0.1 μM).21
Statistical analysis
All results were expressed as mean±standard error of the mean. For biochemical approaches and differences between the groups, analysis of variance followed by Tukey’s analysis was carried out, and Mann–Whitney U-test was applied as a nonparametric test. A two-tailed p<0.05 was considered significant.
Results
Characterization of diabetic kidney GK rats
The GK model is one of the best-characterized animal models used for studying T2DM.22 At 9 months, GK rats showed lower body weight than Wistar rats (376±42 vs. 476±39 g, p<0.001), but they showed elevated blood glucose (452±104 vs. 209±37 mg dl−1, p<0.001), triglycerides (126.5±73.8 vs. 69.8±14.1 mg dl−1, p<0.01) and proteinuria (41±4 vs. 1.5±0.3 mg per day, p<0.001). Sitagliptin treatment ameliorated those parameters in GK rats showing a significant diminution in blood glucose and HOMA-IR (p<0.01) and a GLP-1 increase (p<0.01) with a moderate decrease in total blood cholesterol, low-density lipoprotein cholesterol, triglycerides and proteinuria (Table 1). In order to study the pathophysiological mechanisms of diabetes-driven renal damage, we evaluated the kidneys of GK rats, compared with nondiabetic animals (Figure 1B). GK rats showed Kimmelstiel–Wilson nodules, glomerulosclerosis, interstitial fibrosis and focal tubular dilation (PAS and Masson’s trichrome staining) (Figure 1B). By contrast, GK+Sita group exhibited a marked amelioration in glomerular and tubulointerstitial injuries similarly to Wistar animals (Figure 1B).
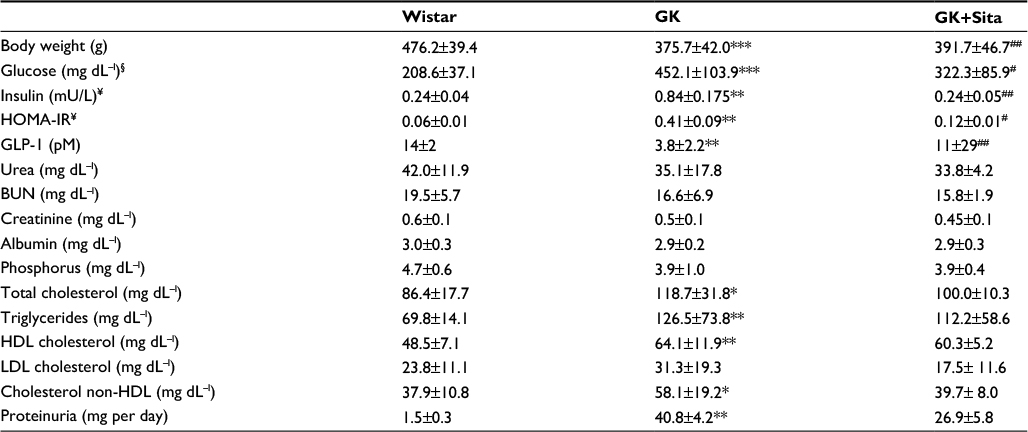 | Table 1 Body weight, biochemical parameters in plasma and proteinuria Notes: GK rats were compared with sitagliptin-treated (GK+Sita) and wild-type animals (Wistar). Values are expressed as mean±SD. §Glucose measurement at 9 months, like the other biochemical parameters. ¥Insulin and HOMA-IR were evaluated by glucose overload at t=0. *p<0.05 GK vs. Wistar; **p<0.01 GK vs. Wistar; ***p<0.0001 GK vs. Wistar; #p<0.05 GK+Sita vs. GK; ##p<0.01 GK+Sita vs. GK. Abbreviations: GK, Goto-Kakizaki; SD, standard deviation; HOMA-IR, homeostatic model assessment – insulin resistance; BUN, blood urea nitrogen; HDL, high-density lipoprotein; LDL, low-density lipoprotein. |
Protein expression in the renal cortex of GK and GK+Sita rats
A differential proteomic study was carried out in the renal cortex of rats, and significant variations of 1.5-fold changes or higher were included (p<0.05) (Table 2).
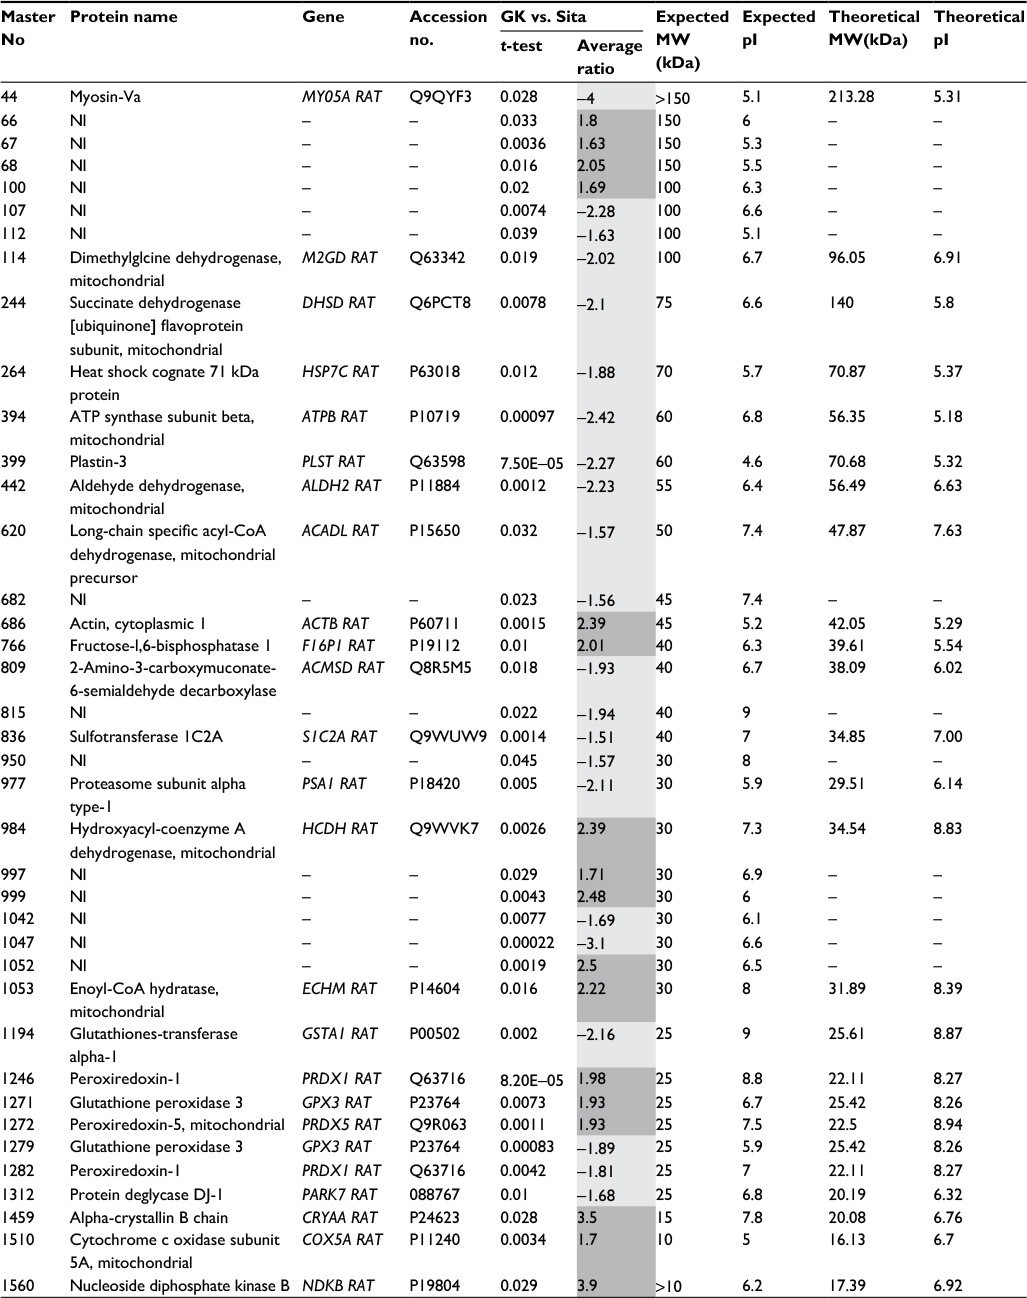 | Table 2 List of proteins identified by MALDI-MS/MS spectral search. Notes: Columns from left to right: gel master number, protein name, gene name, Uniprot KB accession number, statistical significance and fold change between GK untreated animals vs. sitagliptin-treated animals (dark grey: proteins increased in nontreated animals; light grey: proteins increased in sitagliptin-treated animals). Observed isoelectric point, observed molecular weight, theoretical isoelectric point and theoretical molecular weight are also presented. Student’s t-test has been used. Abbreviations: MALDI-MS/MS, matrix-assisted laser desorption ionization tandem mass spectrometry; GK, Goto-Kakizaki; MW, molecular weight. |
In order to identify protein spots, we performed matrix-assisted laser desorption ionization (MALDI)-MS/MS analysis of peptides recovered from in-gel tryptic digestion excised from a preparative silver-stained gel (300 µg) (Figure 2A). Twenty-five spots were unambiguously characterized, as seen in Table 2. Gene ontology analysis of proteins identified showed that most of the proteins belonged to pathways such as cellular catabolism (aldehyde dehydrogenase, fructose-1,6-bisphosphatase 1, long-chain specific acyl-CoA dehydrogenase, dimethylglycine, or succinate dehydrogenase) or oxidation–reduction metabolism: PRDX-1 and PRDX-5 or GPX-3, and GST (Table 2). GK renal cortices showed 39 differentially expressed protein spots compared with Wistar. These proteins were clustered using principal component analysis (Figure 2B) and the non-supervised hierarchical cluster analysis using Pearson distance (Figure 2C).
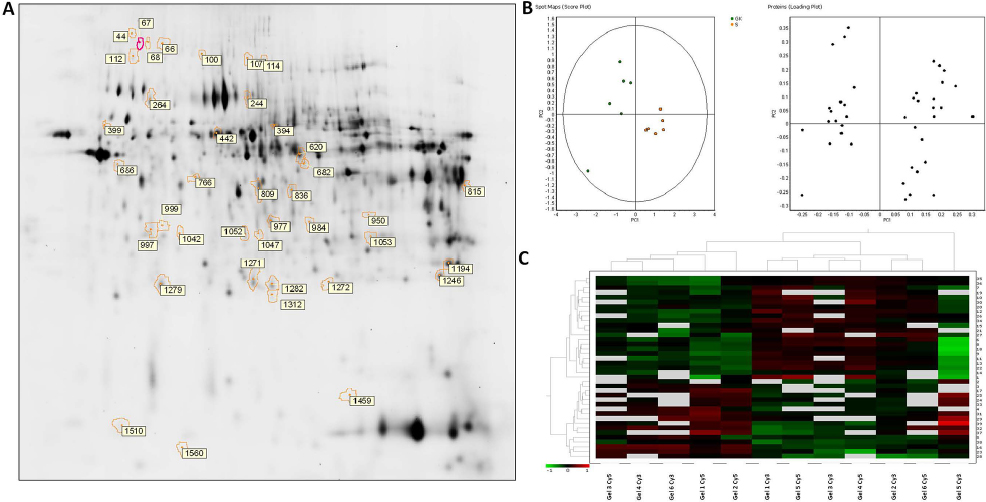 | Figure 2 Differential protein expressions in the renal cortex between untreated and sitagliptin-treated GK rats. (A) Silver staining of two-dimensional gel depicts protein spots significantly altered during diabetic nephropathy treatment showing differential spots identified. (B) Principal component analysis of GK vs. sitagliptin-treated GK as score plot (comparing each individual gel) and as loading plot (comparing each protein spot with higher differential expression) (±1.5-fold, p<0.05). (C) Heat map showing relative abundance in each experiment vs. proteins of interest. Hierarchical cluster analysis was performed using Pearson distance. Abbreviation: GK, Goto-Kakizaki. |
PRDX-1 and GPX-3 expression in the renal cortex
Furthermore, two of those enzymes (PRDX-1 and GPX-3) were identified in two spots differing in their isoelectric point. This suggested a posttranslational modification of those enzymes. In all cases, one isoform was expressed in diabetic animals, while the other was upregulated in response to sitagliptin treatment (Figure S2).
The identity and differential expression of the isoforms were confirmed by Western blot (Figure S2C and G) and mass spectra, suggesting that both isoforms were compatible with phosphorylation of the most acidic isoforms (Figure S2D and H).
Antioxidant expression in the GK rat model
In order to support the results observed by proteomics, we measured the protein expression by IHC and noted a significant increase of GPX-3 (sixfold, p<0.01) in GK vs. Wistar rats, while sitagliptin treatment decreased its expression (p<0.01) (Figure 3A). Similar results were observed when we compared the expression of PRDX-1 (eightfold, p<0.01) and GST (threefold, p<0.05) in GK animals vs. Wistar rats (Figure 3B).
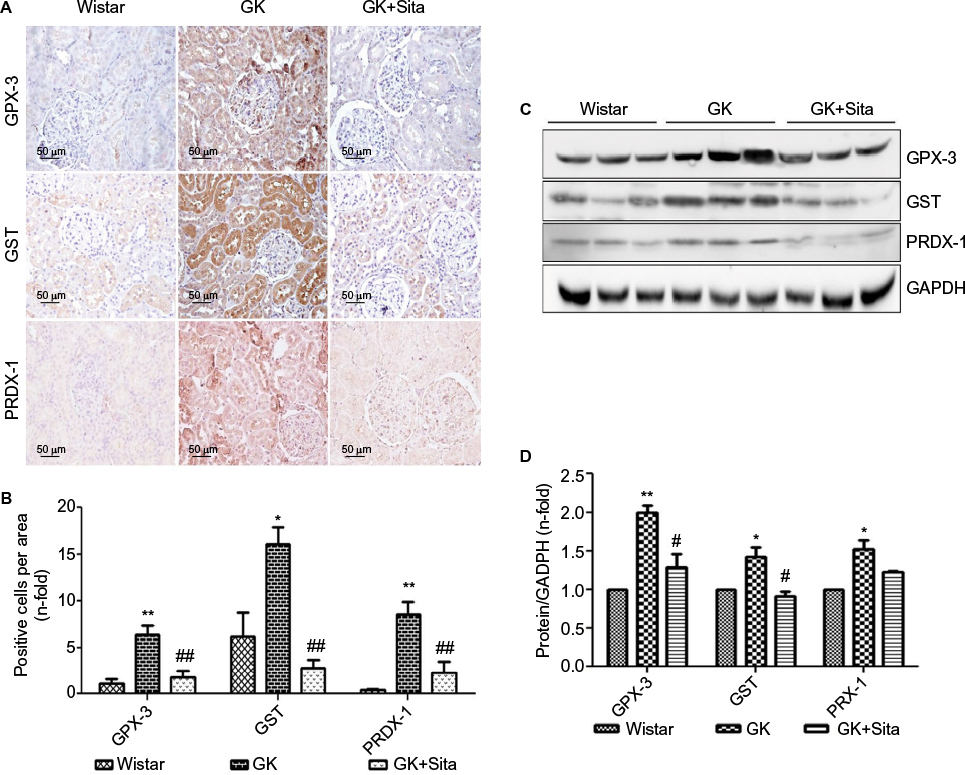 | Figure 3 Antioxidant protein expression in the GK model. (A) Immunostaining for GPX-3, GST and PRDX-1 in the kidney from Wistar, GK and GK+Sita rats at 9 months (n=6). Original magnification: 20×. (B) Values were represented in graphic as positive cells per area. Data are mean±SEM. *p<0.05 GK vs. Wistar; **p<0.01 GK vs. Wistar; ##p<0.01 GK-Sita vs. GK. (C) Representative western blot of GPX-3, GST and PRDX-1, as mean ± SEM of n=6 rats. (D) Results of total protein expression were obtained from densitometry analysis and expressed as the ratio protein/GADPH as n-fold over Wistar. *p<0.05 GK vs. Wistar; **p<0.01 GK vs. Wistar; #p<0.05 GK-Sita vs. GK. Abbreviations: GK, Goto-Kakizaki; SEM, standard error of the mean. |
Likewise, sitagliptin treatment was associated with a decrease in the expression of PRDX-1 (p<0.01) and GST (p<0.01) proteins. Both tubular and glomerular expressions were observed for GPX-3 and PRDX-1, while GST exhibited only tubular expression (Figure 3A). The protein expression was also confirmed by Western blot quantification (Figure 3C) depicting the same pattern, that is, a significant increase in GK animals vs. Wistar and a decrease in GK+Sita vs. GK rats, although in all cases, the fold change was less pronounced than that observed by IHC (Figure 3D).
Proinflammatory miRNA profile in GK rats treated with sitagliptin
We also looked for the changes in miRNA profile in the kidneys from untreated vs. treated animals. The presence of proinflammatory miRNA was assessed using the RT2 miRNA PCR array. As observed in Figure 4A, 88 miRNAs were differentially expressed in GK vs Wistar. rno-miR-16, -21, -26a, -26b, -27a, -27b, -30a, -30c, -30e, -195 and -23a were significantly upregulated in diabetic GK group compared to the Wistar and GK+Sita groups, both exhibiting a lower expression of those microRNAs (Figure 4B and C).
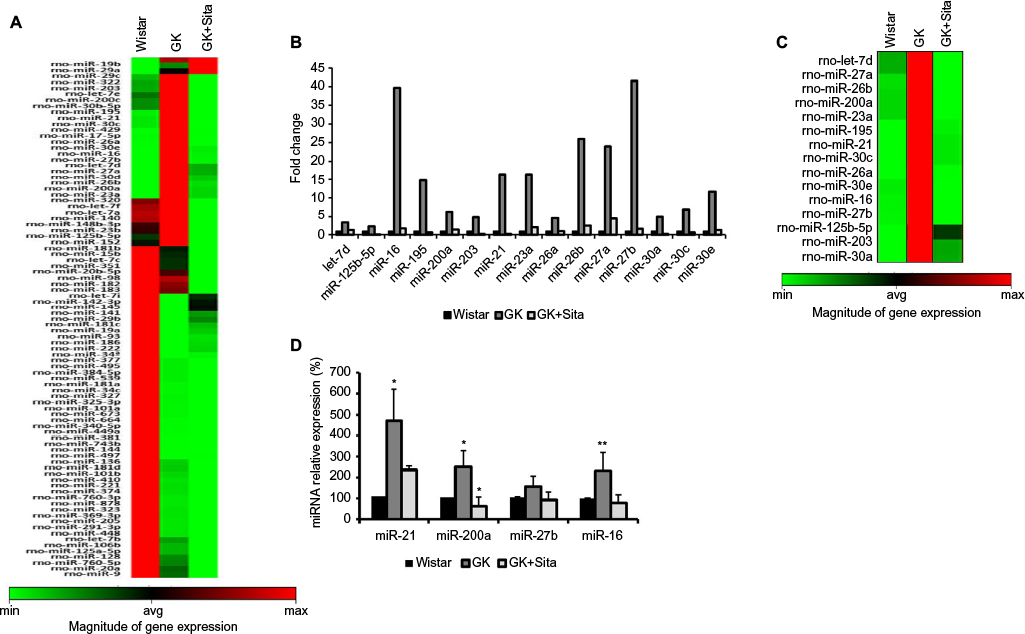 | Figure 4 Microarray profiling of miRNAs expression in diabetic kidney. (A) Heat map diagram and hierarchical clustering of differential expression of miRNAs between Wistar, GK and GK+Sita group. Each row represents an miRNA, and each column the study group. The color scale shown at the bottom illustrates the relative expression level of miRNA across all samples. (B) Graphical representation of the most incremented miRNAs in GK group vs. Wistar and GK+Sita group. (C) Clustering representation of the enhanced miRNA in GK group. (D) Validation of the differential expression of miR-21, miR-200a, miR-27b and miR-16. *Statistical p value <0.05 and **p<0.01 using Mann–Whitney test (Wistar vs GK group). Abbreviation: GK, Goto-Kakizaki. |
A special expression pattern was noted for several miRNAs that were present in an elevated level in Wistar and GK rats and were diminished by sitagliptin treatment such as miR-320, let-7f, -7a, -140, -148b-3p, -23b, -125b-5p, -152, -181b, -15b, -7c, -351, -20b-5p, -98, -182, -183 and -7i (Figure 4A).
Out of the miRNAs that were differentially expressed in qPCR array analysis, four candidates were selected: miR-16 and miR-27b were the most increased miRNAs in GK group. These four miRNAs were analyzed by qPCR, and their expression was found to be elevated in GK group (Figure 4D). These results confirmed the findings of miRNA qPCR array profiling for selected miRNAs. miR-21 showed the major increment in the Wistar group (350 times). This microRNA is involved in protection from DN, upregulating its expression to prevent mesangial hypertrophy.23 We also chose miR-200a as another candidate for qPCR due to its previous relationship with oxidative stress and the regulation of the Keap-1/Nrf2 pathway. miR-200a was also increased in GK rat kidneys compared to the Wistar and GK+Sita groups (p<0.05) (Figure 4D), as well as miR-16.
ROS and Nrf2/ARE pathway in the diabetic GK model
Several identified proteins, associated to DN development, were functionally classified as antioxidant response elements (AREs) and co-regulated under the Nrf2 transcriptional control (Figure S3). Also, the results obtained from proteomics and miRNA profile in the renal cortex point out to Nrf2 regulation as a potential factor involved in diabetic kidney, and as also the main element modulated in response to sitagliptin. Therefore, we assessed the Nrf2 expression in the renal cortex of those animals by IHC quantitation of Nrf2 and its repressor Keap-1 (Figure 5A). A sixfold Nrf2 increase and 70% Keap-1 downregulation were noted in the GK kidneys in comparison to Wistar (p<0.05 for both) (Figure 5B). However, sitagliptin induced a downregulation of Nrf2, while Keap-1 expression was increased. Next, superoxide production was quantified in the kidney by DHE. GK kidneys showed an increase in fluorescence in GK that was attenuated by sitagliptin treatment. In addition, the expression of Nrf2 and Keap-1 was analyzed in kidney protein extract from the three experimental groups. We found that Nrf2 was increased, and Keap-1 was decreased, in GK group vs. Wistar and GK+Sita groups (Figure 5C), confirming IHC results.
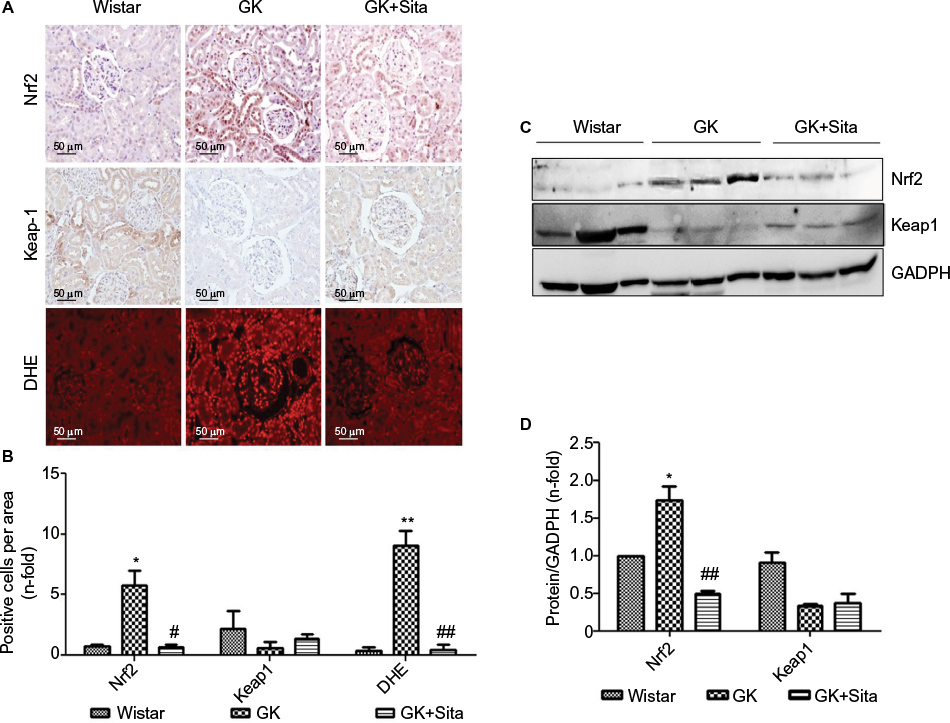 | Figure 5 Oxidative stress markers in the GK model. (A) Immunostaining for Nrf2, Keap-1 and DHE in the kidney from Wistar, GK and GK+Sita rats at 9 months (n=6). Original magnification: 20×. (B) Values were represented in graphic as positive cells per area. Data were mean±SEM. *p<0.05 Wistar vs. GK, #p<0.05 GK vs. GK+Sita. ##p<0.01 GK vs. GK+Sita (C) Representative western blot of Nrf2 and Keap-1 as mean ± SEM of n=6 rats. (D) Results of total protein expression were obtained from densitometry analysis and expressed as the ratio protein/GADPH as n-fold over Wistar. *p<0.05 GK vs. Wistar; ##p<0.01 GK vs. GK+Sita. Abbreviations: GK, Goto-Kakizaki; DHE, dihydroethidium; SEM, standard error of the mean. |
Expression of antioxidant markers in vitro
Hyperglycemic conditions upregulated Nrf2, but co-stimulation with sitagliptin reduced its expression. In addition, HO-1 and Nqo-1, two Nrf2-related genes, showed a downregulation after sitagliptin treatment (Figure 6A, C and D). By contrast, Keap-1 expression was diminished under high glucose conditions, but with sitagliptin, its basal levels were restored (Figure 6A and B). Finally, miR-200a showed a similar pattern as Nrf2 (Figure 6C), suggesting a potential direct interaction between them.
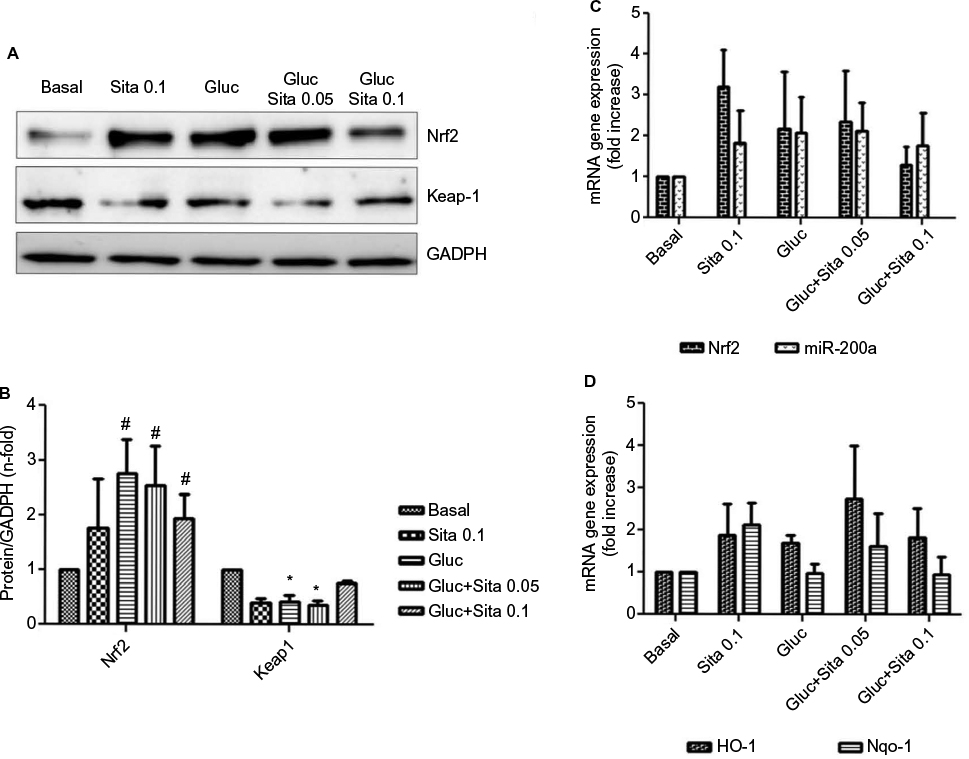 | Figure 6 Regulation of antioxidant response by sitagliptin and hyperglycemia. (A) Representative western blot of Nrf2 and Keap-1 protein expression (n=5). (B) Results of total protein expression were obtained from densitometry analysis and expressed as the ratio protein/GADPH as n-fold over control. #p<0.05 vs. basal, *p<0.05 Nrf2 vs. Keap-1 (C) Effects of different sitagliptin concentrations (0.05, 0.1 µM) and high glucose 33 mM in Nrf2 and miR-200a expression. (D) Effects of different Sitagliptin concentrations (0.05, 0.1 µM) and high glucose 33 mM in HO-1 and Nqo-1 expression. Data are expressed as the mean ± SEM. Abbreviation: SEM, standard error of the mean. |
Discussion
The aim of our work was to compare the changes in proteomic and miRNA profiles of the kidneys of rats with T2DM and to test whether early therapeutic intervention with sitagliptin could attenuate the functional and morphological abnormalities. We chose the GK rats since they spontaneously develop T2DM without obesity and mild renal damage, and the DPP-4 inhibitor sitagliptin is one of the drugs commonly used for the treatment of T2DM in CKD patients due to its safety profile.9 Sitagliptin also significantly reduces urinary albumin excretion compared with other oral glucose-lowering agents24 suggesting a reno-protective effect at least in the early stage of DN.
By means of differential protein expression, MALDI-MS/MS and gene ontology analysis, we identified altered proteins in the renal cortex of GK rats that were involved in oxidation–reduction processes. Out of eight proteins related to oxidative stress, we focused our attention on PRDX-1 and GPX-3 that were significantly elevated in the kidney of GK rats compared to sitagliptin-treated kidneys.
Proteomic analysis of the kidney from rats with streptozotozin-induced diabetes25 or mice Kk-Ay model with spontaneous diabetes26 has also shown renal increase of proteins such as chaperones and oxidoreductases, among others. In the most comprehensive proteomic study carried out in leptin db−/db− rats developing T2DM and obesity phenotype,27 out of 190 identified glomerular proteins, metabolic enzymes were approximately 50%, while enzymes from reductive metabolism and chaperones accounted for a 10% of total proteins each. Overall, those results clearly pointed out that, despite differences in diabetes origin, most of the proteins identified in the renal cortex of diabetic animals belong to the same biological processes. Also, miRNA analysis confirmed the critical involvement of inflammation and oxidative stress in kidney damage associated with diabetes.
miR-21 has been described to be elevated in the kidneys of diabetic patients,28 and in diabetic mouse models associated with the development of albuminuria, renal inflammation and fibrosis.29–31 Upregulation of renal miR-21 content was observed in mouse models of type 1 DM. In this regard, it has been suggested that the improvement in DN or miR-2123 is due to the key role of those molecules in the protection of ROS injury. Other miRNAs upregulated in GK animals were miR-27b and miR-16. The miR-16 is an apoptosis-related miRNA that modulates TLR/NF-B-mediated transcription of inflammatory genes.32,33 Both miR-21 and miR-16 showed an increment in GK kidney, but were downregulated in sitagliptin group.
Particularly relevant was miR-200a. The miR-200 family seems to be responsible for protecting tubular epithelial cells from de-differentiation and mesenchymal transition.34 In addition, it has been recently described that miR-200a regulates the Keap-1/Nrf2 pathway in mammary epithelium in breast cancer.35 Here, we demonstrated that in GK rat kidneys, there was an augmentation of miR-200a, which seemed to be linked to the upregulation of Nrf2 and the antioxidant response genes such as GPX-3 and PRDX-1. miR-200a was captured by Keap-1 mRNA in an ROS production ambient, and then Nrf2 was released and translocated into the nucleus activating the antioxidant defense enzymes. Similarly, a diabetic mice study demonstrated that miR-200a modulated Nrf2 in renal cells through an aldose reductase-dependent mechanism.36 Moreover, mice under intermittent hypoxia exposure showed a diminished mRNA and protein Nrf2 expression after 8 weeks of hypoxia and then after 3 weeks, 1 week and 3 days, suggesting a compensatory response.37 The need of a tight control of Nrf2 signaling is further stressed by the observation that constitutive overactivation of Nrf2 is associated with cancer development, progression and chemotherapy resistance in human bronchial epithelial cells.38 Antioxidant effect associated with sitagliptin has been observed in ischemia–reperfusion models and in ex vivo studies in arteries, showing that sitagliptin could reduce superoxide generation by directly scavenging ROS or upregulating UCP-2.39 It has been demonstrated that GLP-1 agonists reduce oxidative stress by diminishing lipid peroxidation in the liver of type 1 diabetic mice.40
miR-200a regulation seemed to be a consequence of sitagliptin antioxidant effect, consistent with other authors’ observations. Thus, in endothelial cells exposed to chronic hyperglycemia, sitagliptin treatment for 3 weeks decreased ROS production,41 while in animal model, sitagliptin antitumoral effects were mediated via ROS inhibition.42
Altogether, the present study further extends the concept that oxidative stress is a major hallmark in DN. Here, we demonstrate that sitagliptin is capable of reversing ROS production and therefore acting as an antioxidant in diabetic kidney disease. Although, in cultured experiments at 24 h, sitagliptin induced Nrf2 per se, it was able to ameliorate hyperglycemia-induced oxidative stress. These data suggest that sitagliptin antioxidant action takes place through a hormetic mechanism.
As a consequence of sitagliptin antioxidant effect, a downregulation of the endogenous antioxidant response was observed, a modulator response that seems to occur through an miR-200a-mediated Keap-1 repression mechanism (Figure 7). Moreover, sitagliptin-associated antioxidant effect in the kidney does not seem to be associated with glycemic control, supporting the direct effects on the kidney.
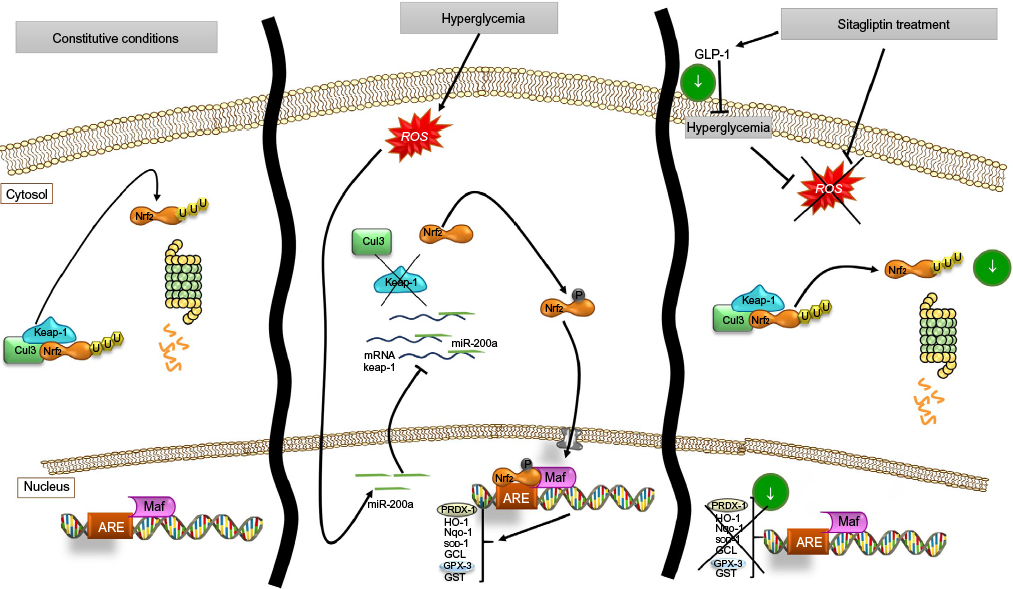 | Figure 7 Schema of proposed antioxidant effect of sitagliptin on renal cells and miR-200a action on Keap-1/Nrf2/ARE pathway. Abbreviation: ROS, reactive oxygen species. |
Acknowledgments
The authors would like to acknowledge the financial support by the Spanish Ministry of Economy and Competitiveness/Health research fund FIS-FEDER (PI13/0047, PI14/00386 and PIE13/00051) and by the Fundación Renal Iñigo Alvarez de Toledo (FRIAT). They also acknowledge Dr. Pablo Cannata for helping in the evaluation of renal pathology.
Author contributions
EC performed the experiments, wrote the manuscript and analyzed the results. EB and OZ performed the experiments. ER and OL contributed to the development of experimental model. OL and JE contributed to discussion, and reviewed and edited the manuscript. SM contributed to the experimental design and was the main writer of the manuscript. All authors contributed toward data analysis, drafting and critically revising the paper and agree to be accountable for all aspects of the work.
Disclosure
The authors declare that no competing interests exist in this work.
References
Wild S, Roglic G, Green A, Sicree R, King H. Global prevalence of diabetes: estimates for the year 2000 and projections for 2030. Diabetes Care. 2004;27(5):1047–1053. | ||
Subbarayan S, Kipnes M. Sitagliptin: a review. Expert Opin Pharmacother. 2011;12(10):1613–1622. | ||
Ruggenenti P, Cravedi P, Remuzzi G. The RAAS in the pathogenesis and treatment of diabetic nephropathy. Nat Rev Nephrol. 2010;6(6):319–330. | ||
Brownlee M. Biochemistry and molecular cell biology of diabetic complications. Nature. 2001;414(6865):813–820. | ||
Sharma K. Mitochondrial hormesis and diabetic complications. Diabetes. 2015;64(3):663–672. | ||
Liu W, Du Y, Liu J, et al. Effects of atrazine on the oxidative damage of kidney in Wister rats. Int J Clin Exp Med. 2014;7(10):3235–3243. | ||
Pergola PE, Raskin P, Toto RD, et al; BEAM Study Investigators. Bardoxolone methyl and kidney function in CKD with type 2 diabetes. N Engl J Med. 2011;365(4):327–336. | ||
de Zeeuw D, Akizawa T, Audhya P, et al; BEACON Trial Investigators. Bardoxolone methyl in type 2 diabetes and stage 4 chronic kidney disease. N Engl J Med. 2013;369(26):2492–2503. | ||
Eligar VS, Bain SC. A review of sitagliptin with special emphasis on its use in moderate to severe renal impairment. Drug Des Devel Ther. 2013;7:893–903. | ||
Muskiet MH, Smits MM, Morsink LM, Diamant M. The gut-renal axis: do incretin-based agents confer renoprotection in diabetes? Nat Rev Nephrol. 2014;10(2):88–103. | ||
Bergenstal RM, Wysham C, Macconell L, et al; DURATION-2 Study Group. Efficacy and safety of exenatide once weekly versus sitagliptin or pioglitazone as an adjunct to metformin for treatment of type 2 diabetes (DURATION-2): a randomised trial. Lancet. 2010;376(9739):431–439. | ||
Mega C, de Lemos ET, Vala H, et al. Diabetic nephropathy amelioration by a low-dose sitagliptin in an animal model of type 2 diabetes (Zucker diabetic fatty rat). Exp Diabetes Res. 2011;2011:162092. | ||
Goto Y, Kakizaki M, Masaki N. Production of spontaneous diabetic rats by repetition of selective breeding. Tohoku J Exp Med. 1976;119(1):85–90. | ||
Kelleni MT, Amin EF, Abdelrahman AM. Effect of metformin and sitagliptin on doxorubicin-induced cardiotoxicity in rats: impact of oxidative stress, inflammation, and apoptosis. J Toxicol. 2015;2015:424813. | ||
Cook HC. A histochemical characterization of malignant tumour mucins as a possible aid in the identification of metastatic deposits. Med Lab Technol. 1973;30(3):217–224. | ||
Bradford MM. A rapid and sensitive method for the quantitation of microgram quantities of protein utilizing the principle of protein-dye binding. Anal Biochem. 1976;72:248–254. | ||
Duran MC, Mas S, Martin-Ventura JL, et al. Proteomic analysis of human vessels: application to atherosclerotic plaques. Proteomics. 2003;3(6):973–978. | ||
Martinez-Pinna R, Ramos-Mozo P, Madrigal-Matute J, et al. Identification of peroxiredoxin-1 as a novel biomarker of abdominal aortic aneurysm. Arterioscler Thromb Vasc Biol. 2011;31(4):935–943. | ||
Pérez V, Navarro-Muñoz M, Mas S, et al. Proteomic approach to the study of statin pleiotropy in kidney transplant patients. Pharmacology. 2011;87(3–4):161–168. | ||
Rodriguez-Porcel M, Gheysens O, Paulmurugan R, et al. Antioxidants improve early survival of cardiomyoblasts after transplantation to the myocardium. Mol Imaging Biol. 2010;12(3):325–334. | ||
Chua S, Sheu JJ, Chen YL, et al. Sitagliptin therapy enhances the number of circulating angiogenic cells and angiogenesis-evaluations in vitro and in the rat critical limb ischemia model. Cytotherapy. 2013;15(9):1148–1163. | ||
Srinivasan K, Ramarao P. Animal models in type 2 diabetes research: an overview. Indian J Med Res. 2007;125(3):451–472. | ||
Zhang Z, Peng H, Chen J, et al. MicroRNA-21 protects from mesangial cell proliferation induced by diabetic nephropathy in db/db mice. FEBS Lett. 2009;583(12):2009–2014. | ||
Mori H, Okada Y, Arao T, Tanaka Y. Sitagliptin improves albuminuria in patients with type 2 diabetes mellitus. J Diabetes Investig. 2014;5(3):313–319. | ||
Hsu YC, Lei CC, Ho C, Shih YH, Lin CL. Potential biomarkers associated with diabetic glomerulopathy through proteomics. Ren Fail. 2015;37(8):1308–1315. | ||
Liu X, Yang G, Fan Q, Wang L. Proteomic profile in glomeruli of type-2 diabetic KKAy mice using 2-dimensional differential gel electrophoresis. Med Sci Monit. 2014;20:2705–2713. | ||
Barati MT, Merchant ML, Kain AB, Jevans AW, McLeish KR, Klein JB. Proteomic analysis defines altered cellular redox pathways and advanced glycation end-product metabolism in glomeruli of db/db diabetic mice. Am J Physiol Renal Physiol. 2007;293(4):F1157–F1165. | ||
Fiorentino L, Cavalera M, Mavilio M, et al. Regulation of TIMP3 in diabetic nephropathy: a role for microRNAs. Acta Diabetol. 2013;50(6):965–969. | ||
Zhong X, Chung AC, Chen HY, et al. miR-21 is a key therapeutic target for renal injury in a mouse model of type 2 diabetes. Diabetologia. 2013;56(3):663–674. | ||
Dey N, Das F, Mariappan MM, et al. MicroRNA-21 orchestrates high glucose-induced signals to TOR complex 1, resulting in renal cell pathology in diabetes. J Biol Chem. 2011;286(29):25586–25603. | ||
Wang J, Gao Y, Ma M, et al. Effect of miR-21 on renal fibrosis by regulating MMP-9 and TIMP1 in kk-ay diabetic nephropathy mice. Cell Biochem Biophys. 2013;67(2):537–546. | ||
Lin Q, Gao Z, Alarcon RM, Ye J, Yun Z. A role of miR-27 in the regulation of adipogenesis. FEBS J. 2009;276(8):2348–2358. | ||
Zhou R, Li X, Hu G, Gong AY, Drescher KM, Chen XM. miR-16 targets transcriptional corepressor SMRT and modulates NF-kappaB-regulated transactivation of interleukin-8 gene. PLoS One. 2012;7(1):e30772. | ||
Wang B, Koh P, Winbanks C, et al. miR-200a prevents renal fibrogenesis through repression of TGF-β2 expression. Diabetes. 2011;60(1):280–287. | ||
Xiong M, Jiang L, Zhou Y, et al. The miR-200 family regulates TGF-β1-induced renal tubular epithelial to mesenchymal transition through Smad pathway by targeting ZEB1 and ZEB2 expression. Am J Physiol Renal Physiol. 2012;302(3):F369–F379. | ||
Wei J, Zhang Y, Luo Y, et al. Aldose reductase regulates miR-200a-3p/141-3p to coordinate Keap1-Nrf2, Tgfβ1/2, and Zeb1/2 signaling in renal mesangial cells and the renal cortex of diabetic mice. Free Radic Biol Med. 2014;67:91–102. | ||
Wu H, Zhou S, Kong L, et al. Metallothionein deletion exacerbates intermittent hypoxia-induced renal injury in mice. Toxicol Lett. 2015;232(2):340–348. | ||
Yang X, Wang D, Ma Y, et al. Continuous activation of Nrf2 and its target antioxidant enzymes leads to arsenite-induced malignant transformation of human bronchial epithelial cells. Toxicol Appl Pharmacol. 2015;289(2):231–239. | ||
Liu L, Liu J, Tian XY, et al. Uncoupling protein-2 mediates DPP-4 inhibitor-induced restoration of endothelial function in hypertension through reducing oxidative stress. Antioxid Redox Signal. 2014;21(11):1571–1581. | ||
Patel V, Joharapurkar A, Dhanesha N, et al. Combination of omeprazole with GLP-1 agonist therapy improves insulin sensitivity and antioxidant activity in liver in type 1 diabetic mice. Pharmacol Rep. 2013;65(4):927–936. | ||
Pujadas G, De Nigris V, Prattichizzo F, La Sala L, Testa R, Ceriello A. The dipeptidyl peptidase-4 (DPP-4) inhibitor teneligliptin functions as antioxidant on human endothelial cells exposed to chronic hyperglycemia and metabolic high-glucose memory. Endocrine. Epub 2016 Aug 16. | ||
Femia AP, Raimondi L, Maglieri G, Lodovici M, Mannucci E, Caderni G. Long-term treatment with Sitagliptin, a dipeptidyl peptidase-4 inhibitor, reduces colon carcinogenesis and reactive oxygen species in 1,2-dimethylhydrazine-induced rats. Int J Cancer. 2013;133(10):2498–2503. |
Supplementary materials
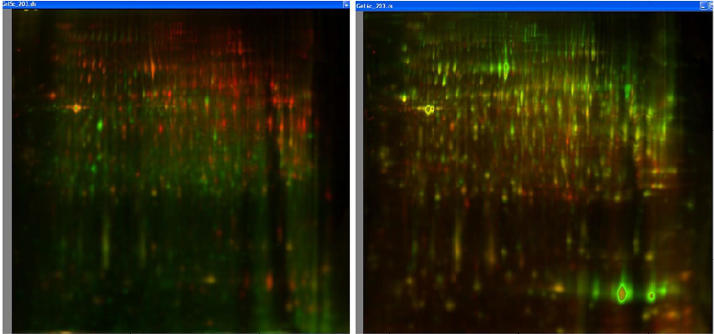 | Figure S1 DIGE images showing the overlay for Cy2, Cy3 and Cy5 channels. Abbreviation: DIGE, differential in-gel electrophoresis. |
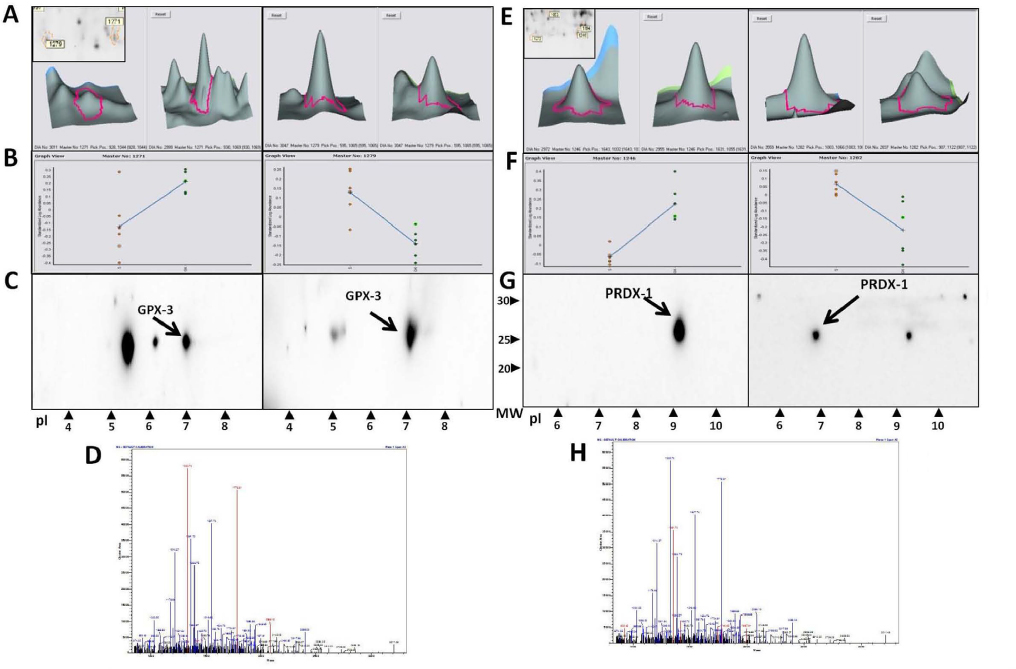 | Figure S2 Increased levels of GPX-3 and PRDX-l in diabetic renal injury. (A and E) Magnification of GPX-3 protein spots (1271 and 1279) in GK+Sita (left) and GK rats (right) and PRDX-l protein spots (1246 and 1282) in GK+Sita (left) and GK rats (right). (B and F) Graphical presentation of GPX-3 and PRDX-1 expression in both conditions of all 2D-DIGE gels as analyzed using the DeCyder software. The blue line represents the median of all gels. (C and G) Validation of the changes in protein expression using 2D Western blot analysis. (D and H) Spots mass fingerprinting. Abbreviations: GK, Goto-Kakizaki; 2D-DIGE, two-dimensional differential in-gel electrophoresis. |
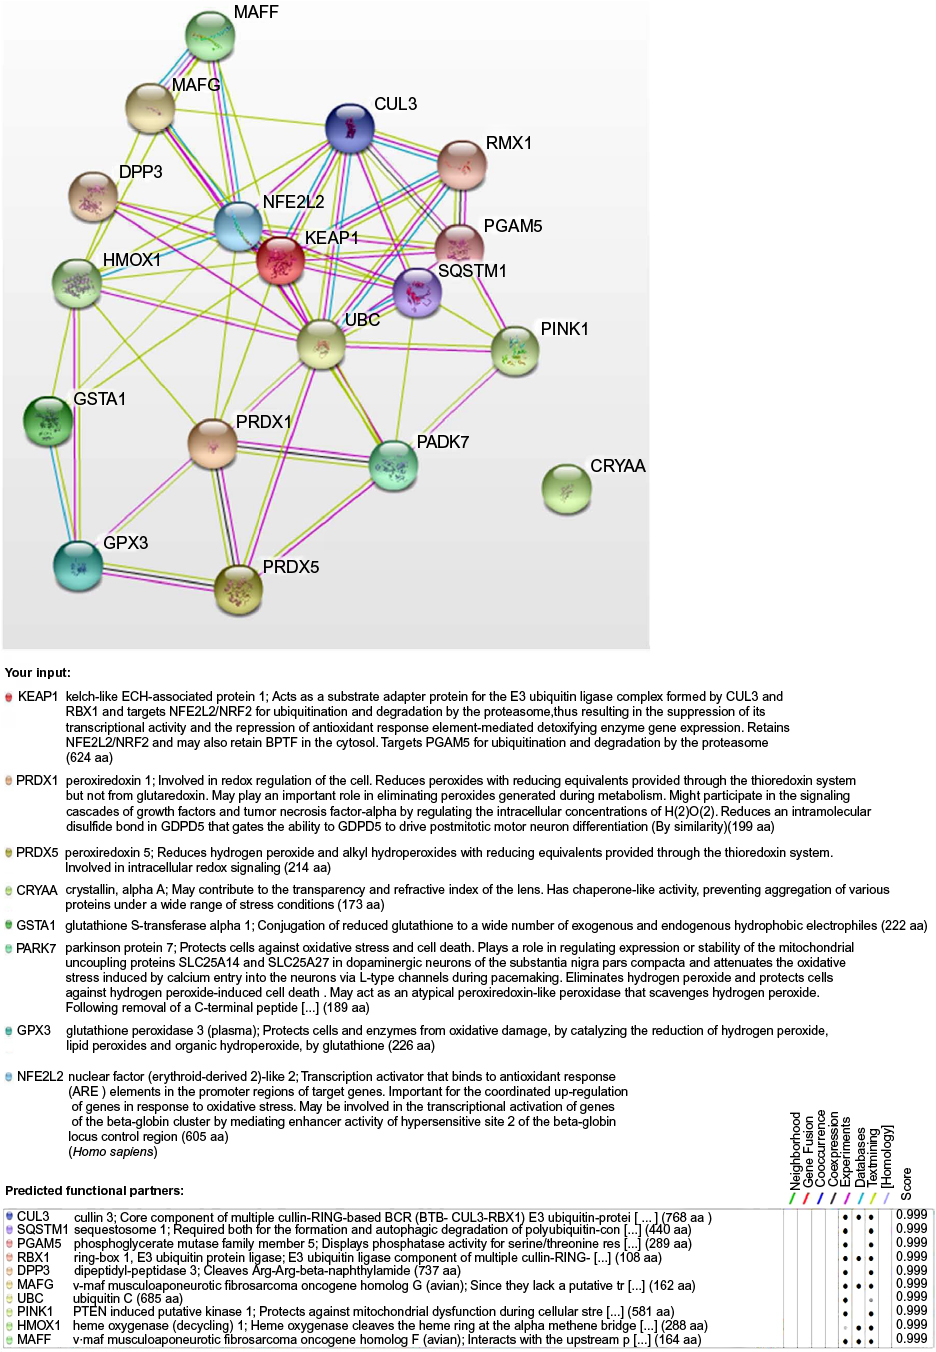 | Figure S3 Protein–protein interaction networks analyzed by String V9.1 software. Notes: Network analyzed from antioxidant response-related proteins identified by proteomic analysis in GK animals. Light blue lines represent database evidence, and strong blue lines represent co-occurrence evidence.1 Abbreviation: GK, Goto-Kakizaki. |
Reference
Franceschini A, Szklarczyk D, Frankild S, et al. STRING v9.1: protein-protein interaction networks, with increased coverage and integration. Nucleic Acids Res. 2013;41:D808–815. |
 © 2017 The Author(s). This work is published and licensed by Dove Medical Press Limited. The
full terms of this license are available at https://www.dovepress.com/terms
and incorporate the Creative Commons Attribution
- Non Commercial (unported, 3.0) License.
By accessing the work you hereby accept the Terms. Non-commercial uses of the work are permitted
without any further permission from Dove Medical Press Limited, provided the work is properly
attributed. For permission for commercial use of this work, please see paragraphs 4.2 and 5 of our Terms.
© 2017 The Author(s). This work is published and licensed by Dove Medical Press Limited. The
full terms of this license are available at https://www.dovepress.com/terms
and incorporate the Creative Commons Attribution
- Non Commercial (unported, 3.0) License.
By accessing the work you hereby accept the Terms. Non-commercial uses of the work are permitted
without any further permission from Dove Medical Press Limited, provided the work is properly
attributed. For permission for commercial use of this work, please see paragraphs 4.2 and 5 of our Terms.