Back to Journals » Clinical, Cosmetic and Investigational Dermatology » Volume 16
Single-Cell RNA Sequencing Reveals Cellular Heterogeneity in an Acral Amelanotic Melanoma After Immunotherapy Treatment
Authors Zhuang L, Tian J ![]() , Lai B, Zhang G, Li H
, Lai B, Zhang G, Li H
Received 24 January 2023
Accepted for publication 20 March 2023
Published 13 April 2023 Volume 2023:16 Pages 1009—1018
DOI https://doi.org/10.2147/CCID.S404381
Checked for plagiarism Yes
Review by Single anonymous peer review
Peer reviewer comments 2
Editor who approved publication: Dr Jeffrey Weinberg
Le Zhuang,1– 6,* Jie Tian,1– 4,7,* Binbin Lai,1– 4,7 Guohong Zhang,1– 4 Hang Li1– 4
1Department of Dermatology, Peking University First Hospital, Beijing, People’s Republic of China; 2National Clinical Research Center for Skin and Immune Diseases, Peking University First Hospital, Beijing, People’s Republic of China; 3Beijing Key Laboratory of Molecular Diagnosis on Dermatoses, Peking University First Hospital, Beijing, People’s Republic of China; 4NMPA Key Laboratory for Quality Control and Evaluation of Cosmetics, Peking University First Hospital, Beijing, People’s Republic of China; 5Dermatology Hospital, Southern Medical University, Guangzhou, People’s Republic of China; 6Central Hospital Affiliated to Shandong First Medical University, Shandong First Medical University and Shandong Academy of Medical Sciences, Jinan, Shandong Province, People’s Republic of China; 7Institute of Medical Technology, Peking University Health Science Center, Beijing, People’s Republic of China
*These authors contributed equally to this work
Correspondence: Hang Li, Peking University First Hospital, No. 8, Xishiku Street, Xicheng District, Beijing, 100034, People’s Republic of China, Tel +8613693058190, Fax +861083572350, Email [email protected]
Background: Anti-programmed cell death ligand-1 (anti-PD-L1) immunotherapy is often used for advanced urothelial carcinoma and melanoma, including amelanotic melanoma, a relatively rare subtype with little to no pigment in the tumor cells. However, cellular heterogeneity of amelanotic melanoma during or after anti-PD-L1 immunotherapy treatments has not been described.
Purpose: To investigate cellular heterogeneity in acral amelanotic melanoma after immunotherapy exposure.
Methods: We evaluated subtle visual changes of the melanoma by dermoscopy and performed a pathological examination to analyze the heterogeneity of microscopic morphological and immunohistochemistry changes. The cellular transcriptional heterogeneity and corresponding biological function profiles of the melanoma were determined by single-cell RNA sequencing (scRNA-seq).
Results: The dermoscopic examination revealed black globules and scar-like depigmentation areas against a homogeneous red background. Pigmented and amelanotic melanoma cells were observed microscopically. The pigmented cells were large and contained melanin granules expressing Melan-A and HMB45; the amelanotic cells were small and did not express HMB45. Ki-67 immunohistochemical staining revealed that the pigmented melanoma cells had a higher proliferative ability than the amelanotic cells. scRNA-seq identified three cell clusters: amelanotic cell cluster 1, amelanotic cell cluster 2, and pigmented cell cluster. Furthermore, a pseudo-time trajectory analysis showed that amelanotic cell cluster 2 originated from amelanotic cell cluster 1 and transformed into the pigmented melanoma cell cluster. The expression pattern of melanin synthesis-related and lysosome-endosome-related genes in different cell clusters supported the cell cluster transformation results. Also, upregulated expression of cell cycle genes indicated that the pigmented melanoma cells had a high proliferative ability.
Conclusion: Coexisting amelanotic and pigmented melanoma cells indicated cellular heterogeneity in an acral amelanotic melanoma from a patient who underwent immunotherapy treatment. Additionally, the pigmented melanoma cells acquired a higher proliferative ability than the amelanotic melanoma cells.
Keywords: amelanotic, acral melanoma, cellular heterogeneity, immunotherapy, drug resistance
Introduction
Immune checkpoint molecules, such as programmed death ligand 1 (PD-L1) and cytotoxic T lymphocyte antigen 4 (CTLA-4), negatively regulate T cell function by binding to receptors on activated T lymphocytes and other immune cells.1 Immune checkpoint inhibitors (ICIs) are commonly used in clinical practice; they enhances anti-tumor immunity by blocking the inhibition of T cell activation pathways.2 Furthermore, PD-L1 inhibitors, such as atezolizumab, have been approved as alternative ICIs for advanced cancers, such as urothelial carcinoma and melanoma.3,4
Patients with metastatic melanoma treated with ICIs still risk developing new primary cutaneous melanoma (CMs).5 For instance, in a cohort of more than 2000 patients with metastatic melanoma treated with ICIs, the incidence of new primary CM was 1.9%, the 5-year cumulative risk was 4.9%, and the incidence rate was 1103 cases per 100,000 person-years.6 However, new primary CMs occurring during ICI treatment for other malignancies have not been adequately discussed.
Amelanotic melanoma (AM) is a relatively rare subtype accounting for 2–8% of all melanomas,7 and it is more rare in patients undergoing ICI therapy. AMs are prone to misdiagnosis owing to the absence of black color, resulting in progression to a more advanced tumor stage with a worse prognosis.8 Furthermore, increasing age and ultraviolet exposure predispose individuals to AM.9 Therefore, most AMs have been detected on chronically photodamaged skin of older patients.
Herein, we present a case of an acral AM that occurred during anti-PD-L1 therapy for urothelial carcinoma. Then, given the rarity of AM occurring during ICI treatment, we investigated the cellular heterogeneity of the acral AM using single-cell RNA sequencing (scRNA-seq).
Methods
Ethical Approval
This study was conducted following the principles of the Declaration of Helsinki with approval from Peking University First Hospital (Ethics Approval number: 2021[076]). The patient provided informed consent for publication.
Clinical Information
An 82-year-old man presented at our clinic with a 2.0×1.5 cm red lesion on his left palm in January 2021. In December 2018, the patient was diagnosed with advanced urothelial carcinoma and started continuous atezolizumab therapy. In December 2019, the patient noticed a red macule on his left palm. However, it was misdiagnosed as dermatitis and a skin infection; topical steroids and antibiotics were administered without improvement. In November 2020, the patient withdrew from atezolizumab therapy owing to fungal pneumonia. After that, the lesion regionally developed a black color. At this point, the patient came to our clinic, where we performed dermoscopic and biopsy examinations (Figure 1). Finally, the patient was diagnosed with acral AM. The tumor was surgically removed by excising 2 cm of tissue based on the Breslow thickness. A sentinel lymph node biopsy indicated no metastases in the left axillary. The patient was clinically staged as IIB (T3bN0M0). scRNA-seq of the spare resected lesion was also performed. The patient died six months after the surgery from multiple organ metastasis of urothelial carcinoma.
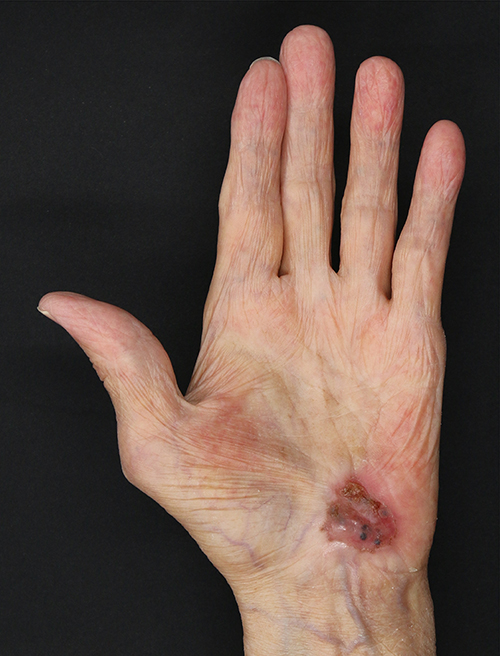 |
Figure 1 Gross appearance of a red lesion on the left palm of an 82-year-old man who previously underwent immunotherapy; the lesion has a heterogeneous color (black, white, and red). |
Dermatopathology Analyses
Standard laboratory protocols were followed when processing formalin-fixed and paraffin-embedded surgical samples. Additionally, routine hematoxylin and eosin stains for the sections were performed. Protein expression was detected with primary antibodies targeting MelanA (IR63361-2, dilution: 1:500, DaKo, Santa Clara, CA, USA), HMB45 (N154587-2, dilution: 1:500, DaKo), and Ki-67 (IR62661-2, dilution: 1:500, DaKo). The secondary antibodies were goat anti-rabbit IgG (ZB-2308, dilution: 1:1000, ZSBIO, Beijing, China) and goat anti-mouse IgG (ZB-2313, dilution: 1:1000, ZSBIO). The Ki-67 positivity rate was assessed by two pathologists independently. The number of positive tumor cells was manually counted and then compared to the total number of tumor cells to calculate the Ki-67 positivity rate.
Melanoma Tissue Processing for Single-Cell Suspension
A fresh sample was collected at the Department of Dermatology of Peking University First Hospital. Tumor samples were taken from the operating room, placed in MACS Tissue Storage Solution (cat# 130-100-008, Miltenyi Biotec, Bergisch Gladbach, Germany) on ice, and transported to the laboratory within 45 minutes. Next, whole skin layer sections of melanoma tissues (approximately 2×1 cm) were washed three times with phosphate-buffered saline (PBS). Subsequently, the tissue was digested in 0.125 mg/mL of trypsin at 37 °C for 15 minutes. Then, 2% fetal bovine serum (FBS) in PBS was added to flush the tissue, and all fluid was collected in the centrifuge tube, which was then centrifuged at 1000 rpm for 3 minutes. After discarding the supernatant, the cells were suspended in 2% FBS-PBS. Next, a digestion mixture (2 mg/mL collagenase IV, 2.5 mM CaCl2, 0.1 mg/mL elastase, 2% FBS, and DNA enzymes) was added to undigested bulk tissue cut into pieces as small as possible. Then, the tissue mixture was placed on a shaker for 30 minutes for digestion. After, the cells were centrifuged and resuspended in 2% FBS-PBS. Finally, the suspension was passed through 100 µm and 40 µm cell strainers in sequence, collecting the entire volume.
The quality was assessed using the Countstar cell analysis systems (Countstar Rigel S2, Alit Biotech, Shanghai) after centrifuging and resuspending the cells. Cell viability was obtained using the trypan blue method with the Countstar machine and intelligent image recognition technology in one step. If the cell viability was above 80%, 10x Genomics sample processing was performed.
Cell Capture and Complementary DNA (cDNA) Synthesis
Using the Single-cell 3′ Library and Gel Bead Kit V3.1 (cat# 1000075 10x Genomics, Pleasanton, CA, USA) and Chromium Single Cell B Chip Kit (cat# 1000074, 10x Genomics), the cell suspension (300–600 living cells per µL determined by Count Star) was loaded onto the Chromium Single Cell controller (10x Genomics) to generate single-cell gel beads in the emulsion according to the manufacturer’s protocol. In short, single cells were suspended in PBS containing 0.04% bovine serum albumin. Approximately 10,000 cells were added to each channel; the target number to recover was around 18,447 cells. Captured cells were lysed, and the released RNA was barcoded through reverse transcription in individual gel beads-in-emulsion (ie, GEMs). Reverse transcription was performed on an S1000TM Touch Thermal Cycler (Bio-Rad, Hercules, CA, USA) at 53 °C for 45 min, followed by 85 °C for 5 min, and then held at 4 °C. The cDNA was generated and then amplified, and quality was assessed using an Agilent 4200 (performed by CapitalBio Technology, Beijing, China).
scRNA-Seq Library Preparation
Following the manufacturer’s instructions, scRNA-seq libraries were constructed using the Single Cell 3′ Library and Gel Bead Kit V3.1 (10x Genomics). The libraries were sequenced using an Illumina NovaSeq 6000 sequencer with a sequencing depth of at least 100,000 reads per cell with a pair-end 150 bp (PE150) reading strategy (performed by CapitalBio Technology).
Cell Ranger
Alignment, filtering, barcode counting, and unique molecular identifier counting were performed with Cell Ranger software (v5.0.1) to generate feature-barcode matrices. The reads were aligned to the human reference genome GRCh38. The Cell Ranger software was obtained from the 10x Genomics website (https://support.10xgenomics.com/single-cell-gene-expression/software/pipelines/latest/what-is-cell-ranger).
R Toolkit: Seurat
Seurat is an R toolkit for single-cell genomics10 where the SCTransform command replaces the NormalizeData, ScaleData, and FindVariableFeatures commands; this change helps identify rare cell populations by improving the signal-to-noise ratio.11 Cells with ≤400 and ≥6000 genes and a mitochondrial gene percentage of ≥20% were filtered out to include only high-quality true cells. After the quality control assessment, 22,077 high-quality cells were obtained. A principal component analysis was performed on approximately 3000 variable genes. We used the FindClusters function on 50 principal components with a resolution of 0.1 to perform the cluster analysis, annotating each cluster with known markers. For visualization, the dimensionality of each dataset was further reduced using Uniform Manifold Approximation and Projection (UMAP) with Seurat functions RunUMAP. Analysis pipeline has been published in GitHub. The data can be access by the link: https://github.com/TianJie327/acral-amelanotic-melanoma.
Gene Ontology (GO) Biological Process Enrichment Analysis
A GO biological process enrichment analysis implemented in the clusterProfiler (v4.0.5) was used to elucidate the biological properties of the cell clusters at single-cell levels.12 Differentially expressed genes among three melanoma cell subtypes were detected with the FindMarkers function of Seurat. The significance threshold was set to an adjusted P-value of <0.05 and the top 25% log2-fold change.
Pseudo-Time Cell Trajectories Analysis
Single-cell pseudo-time trajectories were constructed with Monocle 2 (v2.20.0).13 The order was based on genes with a q-value of <0.01 that showed expression differences between clusters of melanomas selected via the unsupervised dpFeature procedure. Then, the data space was reduced to two dimensions with the DDRTree method. The cells were ultimately ordered in pseudo-time, and pigmentation melanomas represented the end of the trajectory.
Branched Expression Analysis Modeling (BEAM)
We used BEAM, a function of Monocle 2 (v2.20.0), to present the different fates of melanoma and pigmentation-related (MITF, MLANA, PMEL, and TYR), endosome-related (RAB4A, RAB5A, RAB7A, and RAB11A), and lysosome-related (LAMP1, LAMP2, and M6PR) genes on the branch of fate.
Results
Dermoscopic Examination
The dermoscopic examination showed black globules without a pigment network against a red background in the black region (Figure 2A), a scar-like depigmentation area in the white region (Figure 2B), and a homogeneous red background in the red region (Figure 2C).
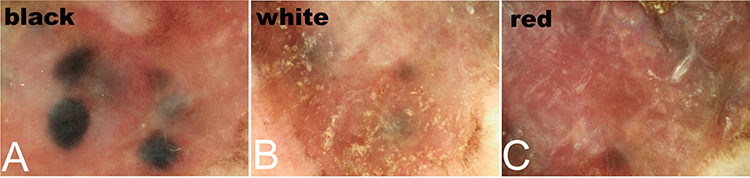 |
Figure 2 Dermoscopic examination results in our 82-year-old male patient. (A) The black region shows black globules without a pigment network against a red background. (B) The white region shows a scar-like depigmentation area. (C) The red region shows a homogeneous red background. |
Pathological Examination
Microscopic findings revealed two types of epithelioid tumor cells: pigmented melanoma cells and AM cells (Figure 3A). The pigmented cells were large, contained melanin granules, and were arranged as large tumor nests. The regional nests corresponding to black globules were identifiable on dermoscopic examination. The AM cells without melanin granules were small and scattered throughout the dermis, corresponding to the red background under the dermoscope.
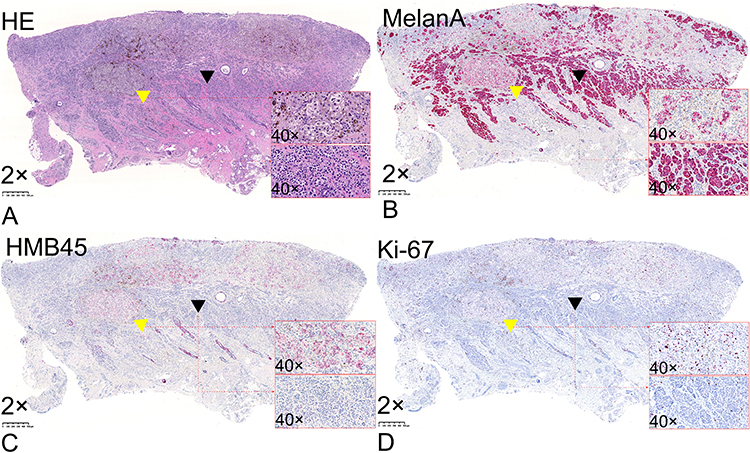 |
Figure 3 (A) Two types of melanoma cells: pigmented cells containing melanin granules (yellow triangles) and small amelanotic cells distributed throughout the entire dermis (black triangle) (hematoxylin and eosin; 2× magnification). (B) Melan-A-positive melanoma cells (2× magnification). (C) HMB45-positive pigmented melanoma cells (2× magnification). (D) Pigmented melanoma cells (yellow triangle) have a higher KI-67 positivity rate (>10%) than amelanotic melanoma cells (<1%; black triangle) (2× magnification). |
All melanoma cells were Melan-A-positive (Figure 3B); however, only pigmented cells were HMB45-positive (Figure 3C). The KI-67 positivity rate was significantly higher in the pigmented cells (>10%) than in the AM cells (<1%). The pigmented cells also demonstrated higher proliferative and invasive abilities than the AM cells (Figure 3D).
scRNA-Seq Profile Findings
UMAP
We identified seven major cell types: Melanoma (MLANA, MITF, TYR, and PMEL), epidermal appendage keratinocytes (KRT8 and KRT18), epidermal keratinocytes (KRT5 and KRT14), endothelial (PECAM1 and VWF), cancer-associated fibroblasts (FAP and MME), fibroblasts (ACTA2, DCN, and LUM), and immune cells (PTPRC) (Figure 4).
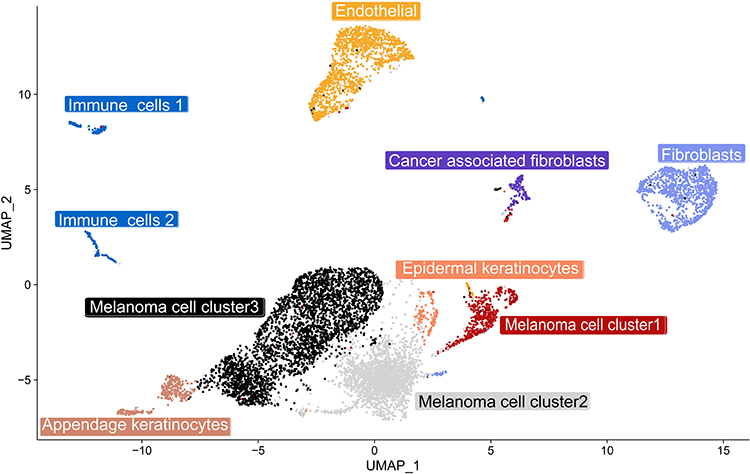 |
Figure 4 A uniform manifold approximation and projection (UMAP) plot shows the unbiased melanoma tissue classified into seven cell types. |
GO Biological Process Enrichment Analysis
The scRNA-seq analysis revealed cellular heterogeneity; thus, the melanoma cells were divided into three clusters. GO term enrichment indicated that cluster 1 was active in RNA splicing processes, cluster 2 was active in drug responses and extracellular matrix modulation, and cluster 3 was active in melanin synthesis (Figure 5A). The expression of melanin synthesis-related genes was downregulated in cluster 1 and cluster 2 but upregulated in cluster 3 (Figure 5B). We defined clusters 1, 2, and 3 as amelanotic cell cluster 1, amelanotic cell cluster 2, and pigmented cell cluster, respectively.
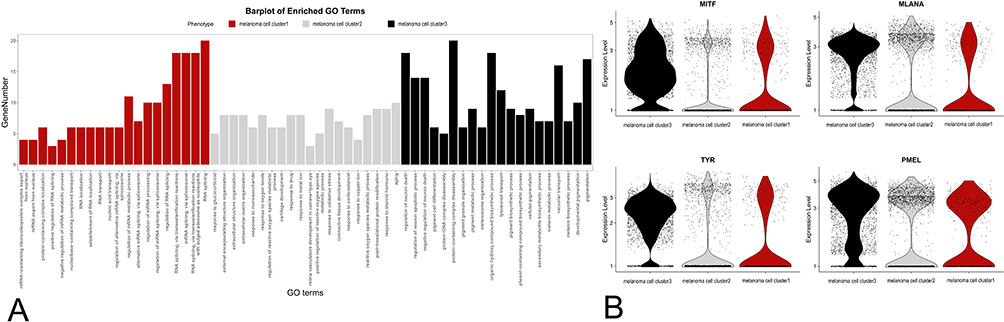 |
Figure 5 (A) Gene ontology (GO) analysis defines three clusters based on the biological processes: 1) melanoma cell cluster 1 is active in RNA splicing; 2) melanoma cell cluster 2 is active in drug responses and extracellular matrix modulation; and 3) melanoma cell cluster 3 is active in the melanin synthesis process. (B) Single-cell transcript expression levels of MITF, MLANA, TYR, and PMEL in the three clusters. |
Pseudo-Time Trajectories Analysis
scRNA-seq and the pseudo-time cell trajectory analysis revealed the cluster’s transition. Amelanotic cluster 1 was in the initial part of the trajectory, and the pigmented cluster was at the end, transitioning from amelanotic cluster 2 (Figure 6).
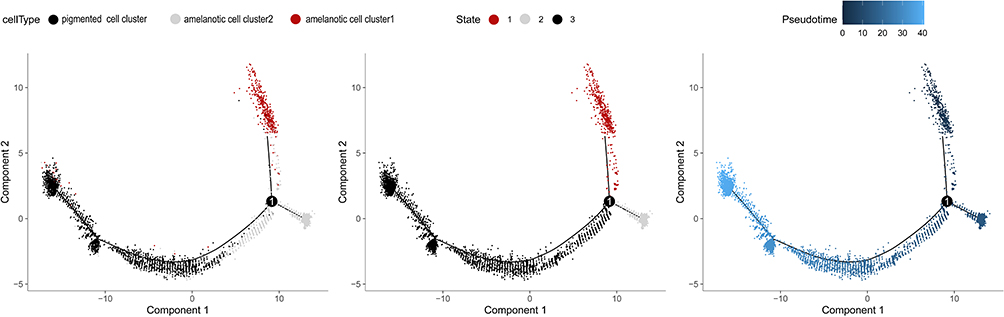 |
Figure 6 Pseudo-time trajectory showing the distribution of cells from melanomas based on the cell type (left). The pseudo-time trajectory is divided into three different states by Monocle 2 (middle). The pseudo-time color gradient transitions from dark (right; start) to light blue (end). |
BEAM
To elucidate the molecular basis of the transformation, we explored the genes that determine the cell fate of the pigmented melanoma and AM clusters (Figure 7A). The melanin synthesis-related genes (MITF, MLANA, PMEL, and TYR) were downregulated, but lysosome and endosome-related genes (LAMP1, LAMP2, RAB4A, and M6PR) were upregulated in the amelanotic clusters compared to the pigmented cluster. Furthermore, cell cycle genes (RB1, PCNA, CDK2, CDK4, and CDK6) were upregulated in the pigmented cluster compared to the amelanotic clusters, consistent with the histological finding that the pigmented melanoma cells acquired higher division activity and were more aggressive (Figure 7B).
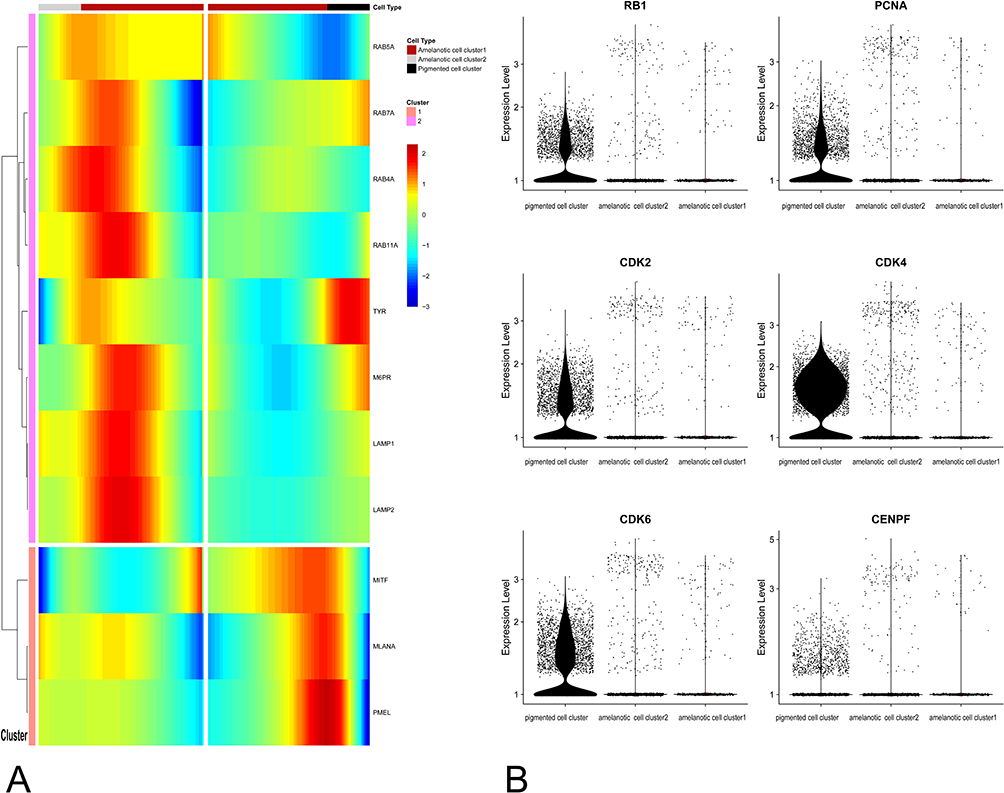 |
Figure 7 (A) Branched expression analysis modeling of the pigmented and amelanotic melanoma clusters. (B) Single-cell transcript expression levels of cell cycle genes. RB1, PCNA, CDK2, CDK4, CDK8, and CENPF were significantly upregulated in the pigmented cell cluster. |
Discussion
Several reports have described BRAF inhibitor-associated cutaneous squamous cell carcinoma and T-cell lymphoma during checkpoint inhibitor therapy.14–16 Furthermore, literature reviews were performed to determine if AM has been reported during immunotherapy.17,18 However, none have investigated cellular heterogeneity in acral AM during or after immunotherapy treatments.
Cancer cells exhibit different transcriptome characteristics, which is one type of intra-tumoral heterogeneity in response to systemic therapy.19 Our scRNA-seq profile provided a model to interpret how cancer heterogeneity contributes to immunotherapy resistance.20 Our cell trajectory results identified amelanotic cell cluster 1 at the beginning of the trajectory. Therefore, we propose that this was a group of melanoma cells active in the RNA splicing process. Thus, in response to the PD-L1 drug, an immune escape effect was exerted by modulating cellular transcriptomic changes and decreasing MITF expression through active RNA splicing, thereby reducing melanoma antigen expression (eg, TYR, MLANA, and PMEL).21–23 A by-product of this response is the development of a non-pigmented clinical presentation. As a result, some researchers are exploring how RNA splicing processes affect cancer immunotherapy resistance and are using spliceosome-targeted therapies combined with immunotherapies to try and reduce tumor immunotherapy resistance.24,25 Furthermore, after RNA splicing, cluster 1 transformed into cluster 2, and a large population of amelanotic cells exhibiting drug resistance emerged (ie, cluster 2 with GO biological process enriched in drug responses and extracellular matrix modulation).26 Finally, the pigmented cell cluster appeared at the end of the trajectory. After discontinuing the medication, the melanoma cells transitioned from a therapy-resistant state to a proliferative and differentiated state (ie, the pigmented cell cluster).27 The clinical course of our patient’s lesion supports this theory; after discontinuing the drug, an unrestricted tumor cell state and color appeared. Thus, the pseudo-time cell trajectory analysis was consistent with the clinical changes.
In our patient, the AM cell cluster underwent phenotypic transition to pigmented melanoma cell cluster after immunotherapy discontinuation. Therefore, we suspect the tumor had phenotypic plasticity. Phenotypic plasticity refers to a wide range of phenomena, including dedifferentiation and transdifferentiation (ie, a direct fate change to another differentiated cell type).28 Phenotypic plasticity in cancer cells is one form of intra-tumoral heterogeneity in response to systemic therapy, which has been broadly reported.19 Although we did not confirm the exact association between phenotypic transition and immunotherapy, we found downregulated expression of melanin synthesis-related genes and upregulated expression of lysosome-related genes in AM cells. Melanosome is a lysosome-related organelle whose synthesis process is closely related to lysosome function, and PD-L1 antibody (H1A, STM108) induces PD-L1 degradation in lysosomes.29,30 Thus, we hypothesize that increased PD-L1 degradation after medication use contributes to the upregulated expression of lysosomal function genes in AM cells. However, these hypotheses should be confirmed by cell and functional experiments in the future.
In our case, the acquired proliferative ability accompanied by discontinuation of the medication uncovered unanticipated biological principles dictating the aggressive disease state of the pigmented melanoma cells. The pigmented melanoma cells in this acral AM presented higher proliferative capacity, such as high Ki-67-positive cells and upregulated cell cycle gene expression. This finding contradicted the previous viewpoint of higher proliferation and invasiveness of AM compared to pigmented melanomas.8,31 However, we do not think this result is inconsistent because more sophisticated tools, such as single-cell sequencing, were used to identify intra-tumor heterogeneity. Different environments in which the tumor exists (eg, continued or discontinued immunotherapy) might cause intra-tumor proliferative heterogeneity. However, this is not equivalent to inter-tumor heterogeneity.32
The present study has some limitations. Melanomas are highly heterogeneous; thus, more samples should be accumulated to dissect the heterogeneity of ecology systems of melanoma occurring after immunotherapy exposure. Furthermore, we could not obtain lesion tissue before our patient discontinued atezolizumab; therefore, further studies are needed to confirm the findings and uncover the cancer immune editing mechanisms.
Conclusions
For patients exposed to immunotherapy, coexisting amelanotic and pigmented melanoma cells indicate prominent cellular heterogeneity in acral AM. Furthermore, the pigmented melanoma cells acquired higher proliferative ability than the AM cells in the evolution sequence. The atypical appearance of this tumor should remind clinicians, both oncologists and dermatologists, to monitor persistent skin lesions occurring during tumor immunotherapy, including non-skin cancers.
Abbreviations
AM, Amelanotic melanoma; BEAM, Branched expression analysis modeling; cDNA, Complimentary DNA; CM, Cutaneous melanoma; GO, Gene ontology; ICI, Immune checkpoint inhibitor; PD-L1, Programmed death ligand 1; scRNA-seq, Single-cell RNA sequencing; UMAP, Uniform Manifold Approximation and Projection.
Data Sharing Statement
Data supporting this study’s findings are available from the corresponding author upon reasonable request.
Ethics Approval and Informed Consent
This study was conducted following the Declaration of Helsinki with approval from Peking University First Hospital (Ethics Approval number 2021[076]). The patient provided informed consent for publication.
Acknowledgments
The authors thank the patient for allowing us to use his photographs and tissue for research purposes and academic publication.
Author Contributions
All authors made a significant contribution to the work reported, whether that is in the conception, study design, execution, acquisition of data, analysis and interpretation, or in all these areas; took part in drafting, revising or critically reviewing the article; gave final approval of the version to be published; have agreed on the journal to which the article has been submitted; and agree to be accountable for all aspects of the work.
Funding
This work was supported by the National Key Research and Development Program of China (2019YFC0840706), the National Natural Science Foundation of China (82073015), and the Shandong Province Natural Science Foundation (ZR2020QH138).
Disclosure
The authors report no conflicts of interest in this work.
References
1. Granier C, De Guillebon E, Blanc C, et al. Mechanisms of action and rationale for the use of checkpoint inhibitors in cancer. ESMO Open. 2017;2(2):e000213. doi:10.1136/esmoopen-2017-000213
2. Economopoulou P, Kotsantis I, Bamias A. A drug safety evaluation of atezolizumab in locally advanced or metastatic urothelial carcinoma. Expert Opin Drug Saf. 2020;19(8):955–960. doi:10.1080/14740338.2020.1792442
3. Powles T, Eder JP, Fine GD, et al. MPDL3280A (anti-PD-L1) treatment leads to clinical activity in metastatic bladder cancer. Nature. 2014;515(7528):558–562. doi:10.1038/nature13904
4. Hamid O, Molinero L, Bolen CR, et al. Safety, clinical activity, and biological correlates of response in patients with metastatic melanoma: results from a Phase I trial of atezolizumab. Clin Cancer Res. 2019;25(20):6061–6072. doi:10.1158/1078-0432.CCR-18-3488
5. Huis In’t Veld EA, van Seventer IC, van Teeseling L, van Thienen JV, Crijns MB. Is routine skin examination in metastatic melanoma patients treated with immuno- or targeted therapy necessary? J Eur Acad Dermatol Venereol. 2020;34(4):e175–e176. doi:10.1111/jdv.16128
6. Nanda JK, Dusza SW, Navarrete-Dechent C, Liopyris K, Marghoob AA, Marchetti MA. Incidence of new primary cutaneous melanoma in patients with metastatic melanoma treated with immune checkpoint inhibitors: a single-center cohort study. JAMA Dermatology. 2021;157(1):79–83. doi:10.1001/jamadermatol.2020.3671
7. Thomas NE, Kricker A, Waxweiler WT, et al. Comparison of clinicopathologic features and survival of histopathologically amelanotic and pigmented melanomas: a population-based study. JAMA Dermatol. 2014;150(12):1306–1314. doi:10.1001/jamadermatol.2014.1348
8. Phan A, Touzet S, Dalle S, Ronger-Salvé S, Balme B, Thomas L. Acral lentiginous melanoma: a clinicoprognostic study of 126 cases. Br J Dermatol. 2006;155(3):561–569. doi:10.1111/j.1365-2133.2006.07368.x
9. Pizzichetta MA, Talamini R, Stanganelli I, et al. Amelanotic/hypomelanotic melanoma: clinical and dermoscopic features. Br J Dermatol. 2004;150(6):1117–1124. doi:10.1111/j.1365-2133.2004.05928.x
10. Hao Y, Hao S, Andersen-Nissen E, et al. Integrated analysis of multimodal single-cell data. Cell. 2021;184(13):3573–3587.e29. doi:10.1016/j.cell.2021.04.048
11. Hafemeister C, Satija R. Normalization and variance stabilization of single-cell RNA-seq data using regularized negative binomial regression. Genome Biol. 2019;20(1):296. doi:10.1186/s13059-019-1874-1
12. Yu G, Wang LG, Han Y, He QY. clusterProfiler: an R package for comparing biological themes among gene clusters. OMICS. 2012;16(5):284–287. doi:10.1089/omi.2011.0118
13. Trapnell C, Cacchiarelli D, Grimsby J, et al. The dynamics and regulators of cell fate decisions are revealed by pseudotemporal ordering of single cells. Nat Biotechnol. 2014;32(4):381–386. doi:10.1038/nbt.2859
14. Cohen DN, Lumbang WA, Boyd AS, Sosman JA, Zwerner JP. Spindle cell squamous carcinoma during BRAF inhibitor therapy for advanced melanoma: an aggressive secondary neoplasm of undetermined biologic potential. JAMA Dermatol. 2014;150(5):575–577. doi:10.1001/jamadermatol.2013.7784
15. Wu JH, Cohen DN, Rady PL, Tyring SK. BRAF inhibitor-associated cutaneous squamous cell carcinoma: new mechanistic insight, emerging evidence for viral involvement and perspectives on clinical management. Br J Dermatol. 2017;177(4):914–923. doi:10.1111/bjd.15348
16. Anand K, Ensor J, Pingali SR, et al. T-cell lymphoma secondary to checkpoint inhibitor therapy. J Immunother Cancer. 2020;8(1):e000104. doi:10.1136/jitc-2019-000104
17. Gong HZ, Zheng HY, Li J. Amelanotic melanoma. Melanoma Res. 2019;29(3):221–230. doi:10.1097/CMR.0000000000000571
18. Kaizer-Salk KA, Herten RJ, Ragsdale BD, Sengelmann RD. Amelanotic melanoma: a unique case study and review of the literature. BMJ Case Rep. 2018;bcr-2017–222751. doi:10.1136/bcr-2017-222751
19. Gupta PB, Pastushenko I, Skibinski A, Blanpain C, Kuperwasser C. Phenotypic plasticity: driver of cancer initiation, progression, and therapy resistance. Cell Stem Cell. 2019;24(1):65–78. doi:10.1016/j.stem.2018.11.011
20. Hugo W, Zaretsky JM, Sun L, et al. Genomic and transcriptomic features of response to anti-PD-1 therapy in metastatic melanoma. Cell. 2016;165(1):35–44. doi:10.1016/j.cell.2016.02.065
21. Escobar-Hoyos L, Knorr K, Abdel-Wahab O. Aberrant RNA splicing in cancer. Annu Rev Cancer Biol. 2019;3(1):167–185. doi:10.1146/annurev-cancerbio-030617-050407
22. Kholmanskikh O, van Baren N, Brasseur F, et al. Interleukins 1α and 1β secreted by some melanoma cell lines strongly reduce expression of MITF-M and melanocyte differentiation antigens. Int J Cancer. 2010;127(7):1625–1636. doi:10.1002/ijc.25182
23. Przybyla A, Zhang T, Li R, Roen DR, Mackiewicz A, Lehmann PV. Natural T cell autoreactivity to melanoma antigens: clonally expanded melanoma-antigen specific CD8 + memory T cells can be detected in healthy humans. Cancer Immunol Immunother. 2019;68(5):709–720. doi:10.1007/s00262-018-02292-7
24. Ding L, Odunsi K, Phimister EG. RNA splicing and immune-checkpoint inhibition. N Engl J Med. 2021;385(19):1807–1809. doi:10.1056/NEJMcibr2110736
25. Lu SX, De Neef E, Thomas JD, et al. Pharmacologic modulation of RNA splicing enhances anti-tumor immunity. Cell. 2021;184(15):4032–4047.e31. doi:10.1016/j.cell.2021.05.038
26. Hoek KS, Eichhoff OM, Schlegel NC, et al. In vivo switching of human melanoma cells between proliferative and invasive states. Cancer Res. 2008;68(3):650–656. doi:10.1158/0008-5472.CAN-07-2491
27. Arozarena I, Wellbrock C. Phenotype plasticity as enabler of melanoma progression and therapy resistance. Nat Rev Cancer. 2019;19(7):377–391. doi:10.1038/s41568-019-0154-4
28. Bonfanti P, Barrandon Y, Cossu G. “Hearts and bones”: the ups and downs of ‘plasticity’ in stem cell biology. EMBO Mol Med. 2012;4(5):353–361. doi:10.1002/emmm.201200220
29. Tu X, Qin B, Zhang Y, et al. PD-L1 (B7-H1) Competes with the RNA exosome to regulate the DNA damage response and can be targeted to sensitize to radiation or chemotherapy. Mol Cell. 2019;74(6):1215–1226.e4. doi:10.1016/j.molcel.2019.04.005
30. Li CW, Lim SO, Chung EM, et al. Eradication of triple-negative breast cancer cells by targeting glycosylated PD-L1. Cancer Cell. 2018;33(2):187–201.e10. doi:10.1016/j.ccell.2018.01.009
31. Massi D, Pinzani P, Simi L, et al. BRAF and KIT somatic mutations are present in amelanotic melanoma. Melanoma Res. 2013;23(5):414–419. doi:10.1097/CMR.0b013e32836477d4
32. Zhang M, Yang H, Wan L, et al. Single-cell transcriptomic architecture and intercellular crosstalk of human intrahepatic cholangiocarcinoma. J Hepatol. 2020;73(5):1118–1130. doi:10.1016/j.jhep.2020.05.039
 © 2023 The Author(s). This work is published and licensed by Dove Medical Press Limited. The
full terms of this license are available at https://www.dovepress.com/terms
and incorporate the Creative Commons Attribution
- Non Commercial (unported, 3.0) License.
By accessing the work you hereby accept the Terms. Non-commercial uses of the work are permitted
without any further permission from Dove Medical Press Limited, provided the work is properly
attributed. For permission for commercial use of this work, please see paragraphs 4.2 and 5 of our Terms.
© 2023 The Author(s). This work is published and licensed by Dove Medical Press Limited. The
full terms of this license are available at https://www.dovepress.com/terms
and incorporate the Creative Commons Attribution
- Non Commercial (unported, 3.0) License.
By accessing the work you hereby accept the Terms. Non-commercial uses of the work are permitted
without any further permission from Dove Medical Press Limited, provided the work is properly
attributed. For permission for commercial use of this work, please see paragraphs 4.2 and 5 of our Terms.